
Abstract
California is a seismically active region that contains approximately 26,000 bridges. Historical earthquakes have caused severe damage and collapse of bridges in California, resulting in casualties, economic losses, and disruptions to transportation networks. Seismic fragility models of bridges estimate the probability of exceeding damage states at varying ground motion intensity levels. These models can be utilized for bridge vulnerability assessment, risk and resilience quantification, and to support earthquake preparedness and response planning. Recent studies have developed a new generation of seismic fragility models for bridges, demonstrating several advancements when compared with the widely used first-generation HAZUS models. These models, termed second-generation fragility functions, are derived through detailed dynamic response analyses and are differentiated at the component level, with more rational, performance-based criteria for bridge grouping and archetype sampling. This study compiles and adapts a comprehensive set of second-generation fragility models from the literature. As part of this compilation, we filtered out fragility functions with outdated capacity models and unrealistic bridge configurations, establishing uniform bridge grouping criteria, and harmonized different cross-model ground motion intensity measures and bridge component definitions. The database comprises approximately 2300 component- and 500 system-level fragility models categorized into 26 bridge groups. It can serve as a valuable resource for researchers and practitioners conducting various related analyses to enhance the seismic resilience of bridge infrastructure in California.
Keywords
Introduction
Approximately 26,000 state and local bridges constitute a complex transportation network in California (FHWA, 2024a). The inventory features a diverse collection of bridges that vary based on their design era, geometry, material type, component type and connectivity, material properties, seismic detailing, etc. (Zheng, 2021). California bridges are vulnerable to seismic hazards. Historical seismic events, such as the 1971 San Fernando and the 1994 Northridge earthquakes, have led to the collapse of several bridges (Wang and Lee, 2009). The seismic vulnerability of bridges can be assessed using fragility models, which estimate the probability of reaching or exceeding component- (e.g. column) and/or system-level (i.e. the entire bridge) damage states when subjected to varying levels of ground shaking or seismic demand. Bridge fragility models have a wide range of applications, including seismic risk and resilience assessment (Baker et al., 2024; Dukes et al., 2018), performance-based design and optimization (Deb, 2021; Xie and Zhang, 2017), and post-earthquake damage assessment for recovery planning and decision-making (Hulsey et al., 2022; Mackie and Stojadinović, 2005).
Fragility models can be developed through empirical, analytical, expert judgment-based, and hybrid methods (Du et al., 2023). Analytical fragility models developed from simulation-based approaches, such as incremental dynamic analysis (IDA), multiple stripe analysis (MSA), and cloud analysis, are widely utilized because they enable fragility predictions when empirical damage data is not available (Baker, 2015). The cloud analysis approach has been primarily used to develop seismic fragilities for bridges (Nielson and DesRoches, 2007; Zhang and Huo, 2009). It requires conducting a large number of nonlinear response history analyses (NRHAs) of bridge models under a suite of spectrally matched records or synthetic ground motions (Nielson and DesRoches, 2007). This process is computationally demanding, making it intractable to develop fragility models for individual bridges across a large region, such as California. One viable solution is using classification methods to create groups of bridges with similar structural attributes and develop archetype fragilities representing the seismic vulnerability of all bridges in each group (Ramanathan, 2012).
The HAZUS model (FEMA, 2003) was one of the first to provide archetypal bridge fragilities. It categorizes bridges based on factors such as construction era, span number, bridge length, and bent type, and provides system-level fragility curves for each bridge group. These first-generation HAZUS-based fragility models have been widely used in seismic damage and risk assessment of different bridge networks, including those in Charleston, South Carolina (Padgett et al., 2010) and Clark County, Nevada (Ebrahimpour et al., 2007).
However, the HAZUS fragilities have several limitations. Developed using the static capacity spectrum method applied to idealized two-dimensional bridge models, these fragilities do not account for system dynamics and uncertainties in material properties, bridge configurations, and geometric parameters. The influence of abutment type (i.e. diaphragm versus seat-type abutments), which has been shown to significantly impact the bridge performance (Mangalathu, 2017; Ramanathan, 2012), was not considered. Moreover, the model relies on subjective engineering judgment for bridge grouping. For instance, it considers 1975 as a divergent year to classify bridge fragilities, contradicting the findings from Ramanathan (2012), who suggested that a more rational choice would be the years 1971 (when the San Fernando earthquake occurred) and 1989 (when the Loma Prieta earthquakes occurred). The San Fernando and Loma Prieta earthquakes were the impetus behind the changes in seismic design specifications of California bridges. The HAZUS model only quantifies the bridge fragility at the system level, excluding component-level assessments that are more valuable for targeted bridge maintenance, repair, retrofit, and design.
Over the past decade, research efforts have been devoted to addressing these limitations in developing the second-generation fragility models for California bridges (Mangalathu, 2017; Ramanathan, 2012; Zheng, 2021). The associated methodological advancements include (1) a three-era separation (i.e. pre-1970 for Era 1, 1971-1990 for Era 2, and post-1991 for Era 3) for distinct seismic design and fragility categorization (Ramanathan, 2012), (2) performance-based bridge grouping through statistical analysis of seismic demands (Mangalathu et al., 2017a), (3) the utilization of column testing data for developing capacity models that capture different failure modes (Mangalathu, 2017) and (4) refined damage state definitions that are better aligned with repair practices and operational targets (Zheng, 2021). Additional efforts have also led to more detailed NRHAs leveraging high-fidelity, three-dimensional (3D) multi-component bridge models (Kaviani et al., 2012; Omrani et al., 2017; Xie et al., 2019, 2021; Zheng et al., 2021). The resulting second-generation fragility models have been primarily developed for reinforced concrete (RC) bridges, employing more rational, performance-based criteria for bridge grouping. They account for the influence of abutment type by providing separate fragilities for bridges with diaphragm and seat-type abutments. In addition, they are differentiated at the component level and incorporate a holistic statistical sampling approach that captures uncertainties stemming from both ground motions and bridge attributes.
The second-generation fragility models use a ground motion intensity measure (IM) as the single variable to quantify the damage state exceedance probabilities of the entire bridge group, where the intra-group bridge variance is treated as an added source of uncertainty. In this regard, there are ongoing efforts to develop third-generation parameterized fragilities that can further distinguish individual bridges by taking both IM and detailed bridge parameters as model inputs (Du and Padgett, 2020; Ghosh and Padgett, 2010). However, the third-generation parameterized fragilities are not included in the current database because they require detailed bridge parameters as explicit model inputs, and the existing models do not cover a sufficiently large inventory of bridges in California.
This study synthesizes the second-generation seismic fragility models for RC bridges in California. It begins with a discussion of the high-fidelity bridge numerical modeling scheme. Subsequently, the overall methodology for developing the fragility models is presented, including ground motion selection, bridge inventory analysis, model sampling, seismic demand analysis, damage state consideration, component capacity modeling, as well as the compiled fragility parameters. An overview of the fragility model database is also provided, highlighting the design attributes used for bridge grouping and candidate references employed to extract the corresponding fragility parameters. Component and system-level fragility data are then presented and analyzed across different bridge groups. The resulting second-generation fragility model dataset is publicly accessible in the DesignSafe data repository (Chen et al., 2025).
Bridge numerical modeling
The bridge modeling approach that forms the basis for developing the second-generation fragilities is presented in Figure 1. The bridge numerical model has been primarily developed using OpenSees (McKenna, 2011). The deck is typically modeled using elastic beam-column elements with masses lumped along the centerline since it is not expected to undergo significant inelastic deformations during seismic events. Transverse rigid components are modeled to preserve the geometry and connect the deck with columns and end abutments. RC columns are modeled using nonlinear beam-column elements with discretized fiber sections, which captures unique material properties at different locations in the cross section. Concrete02 and Concrete07 materials are typically used to simulate both cover and core concrete. The strength increase of core concrete induced by the effective lateral confining stress can be considered per the recommendation by Chang and Mander (1994). The reinforcing steel can be simulated using Steel01, Steel02, or Reinforcing Steel Material in OpenSees (Dhakal and Maekawa, 2002; Gomes and Appleton, 1997; McKenna, 2011; Menegotto, 1973). Strain penetration effects at column ends can also be considered through zero-length section elements with the Bond_SP01 material (Zhao and Sritharan, 2007). Column foundations are simulated using simplistic linear translational and rotational springs or more complex nonlinear spring models (Xie et al., 2021). A spring system has been considered for modeling different components at end abutments (Figure 1). This includes the hyperbolic soil model for the backfill (Shamsabadi et al., 2010; Xie et al., 2019), the trilinear material for the abutment foundation (Mangalathu et al., 2016; Xie et al., 2021), a trilinear force-displacement model for the shear keys based on the Caltrans-UCSD field experiments (Silva et al., 2009), the Hertz contact model for pounding between the deck and abutment (Muthukumar and DesRoches, 2006), as well as the bilinear model for bearings (Mander et al., 1996). It is worth noting that modeling considerations for pounding, bearings, and shear keys do not exist for integral abutments. The second-generation fragility models for most of the bridge components have been developed based on the cloud analysis approach using this modeling scheme for numerical simulations. However, the fragility models for approach damage due to backfill settlements are developed through a different approach (Shao et al., 2022). Different foundation types, soil types, together with the associated uncertainties in soil profiles and properties, have been considered in the development of numerical models for column and abutment foundations (Mangalathu, 2017; Xie et al., 2021) and backfills (Xie et al., 2019), as well as fragility models for approach damage due to backfill settlements (Shao et al., 2022).
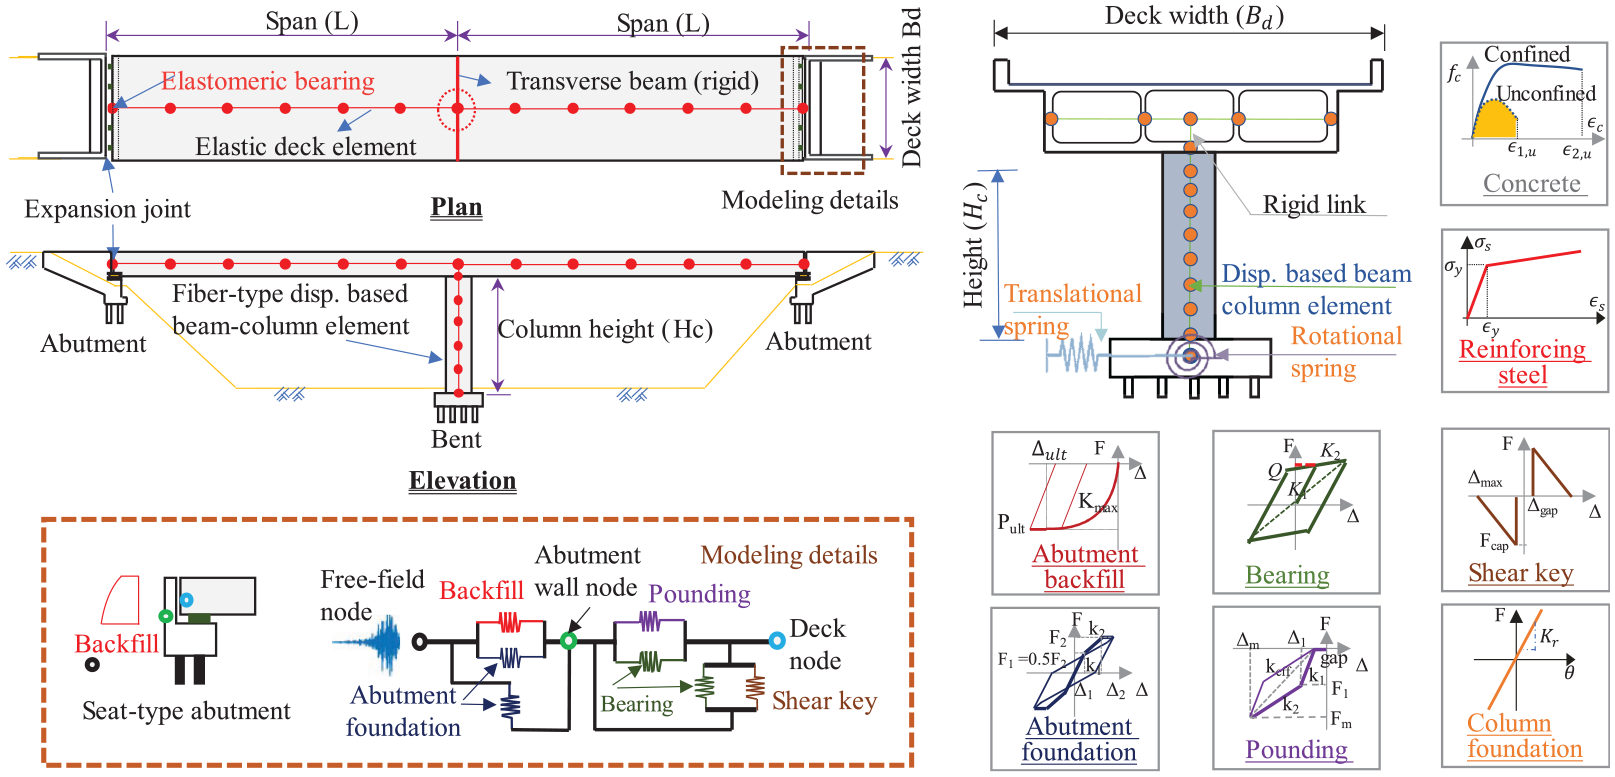
Numerical modeling of various components in a two-span concrete bridge (adapted from Ning et al., 2024; Song et al., 2024).
The advantages of the numerical modeling scheme lie in its more detailed consideration of the dynamic interplay among different abutment components through the use of a spring system, allowing for a more realistic capture of the seismic damage and fragility of enclosed components such as bearings, shear keys, and abutments. Nevertheless, the current modeling scheme does not account for the potential damage and failure of the abutment backwall, which has also been shown to influence the seismic performance of other bridge components (Zheng, 2021). In addition, while the numerical model effectively captures column damage under the flexural damage mode, it does not consider other critical damage modes, such as shear failure and lap-slice damage, which might be prevalent in early designed bridges in California.
Fragility model development
Ground motion selection, bridge inventory analysis, and numerical model sampling
The ground motions used to develop the second-generation fragility models are mainly those compiled by Baker et al. (2011). It includes a suite of 160 ground motions recorded from previous earthquakes that vary in magnitude, epicentral distance, site condition, and pulse characteristics, ensuring its applicability for analyzing different structural and geotechnical systems across diverse locations. These 160 ground motions can be divided into four sets, with each consisting of 40 motions. The first three sets correspond to three earthquake scenarios on rock or soil sites, whereas the last set is characterized by ground motions with strong velocity pulses under near-fault directivity effects. To ensure sufficient data for bridge damage, these 160 ground motions are scaled by a factor of two, resulting in an expanded dataset comprising 320 ground motions (Ramanathan, 2012).
The previously mentioned numerical models also capture various sources of bridge attribute uncertainty. An inventory investigation of California bridges and extensive reviews of design drawings was first conducted to benchmark statistical distributions of model parameters associated with each bridge group, including those for the overall geometry (e.g. span length and deck width), component hysteresis (e.g. shear key strength and bearing stiffness), dynamic parameters (e.g. mass factors and damping), and constitutive material properties (e.g. concrete compressive strength and steel yield strength). As shown in Figure 2(a), sampling techniques such as Latin Hypercube Sampling (LHS) (Iman and Conover, 1980) are then applied to generate realizations of each model parameter based on its theoretical distribution while accounting for inter-parameter correlations. This process captures the intra-group bridge-to-bridge variance, where each specific sample of the bridge model is then randomly coupled with one set of bi-directional ground motions for conducting the NRHAs (Figure 2(a)). Seismic demands of different bridge components are then recorded using the corresponding engineering demand parameters (EDPs), forming the seismic demand database that is further utilized for the subsequent cloud analysis for developing probabilistic seismic demand models (PSDM) of bridge components in each group.
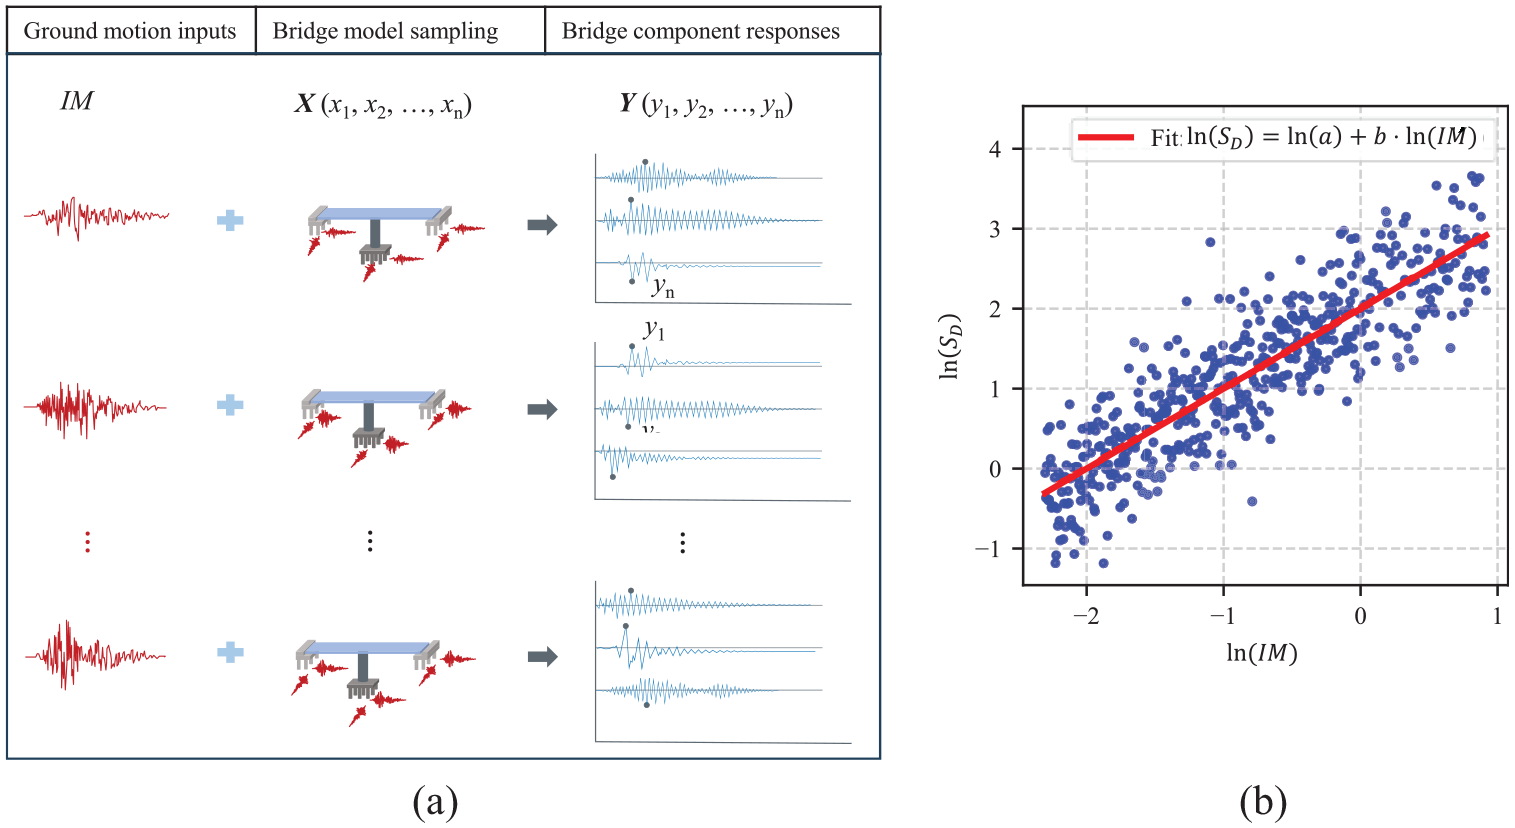
Bridge numerical model sampling and ground motion pairing for developing the probabilistic seismic demand models of bridge components: (a) Sampling bridge models for NRHAs and (b) Probabilistic seismic demand modeling using the analysis data.
Probabilistic seismic demand models
Fragility items for different bridge components and the corresponding EDPs are listed in Table 1. The cloud analysis first pairs the EDPs from the NRHA with the ground motion IMs in logarithmic space to develop the PSDM, as shown in Figure 2(b):

where
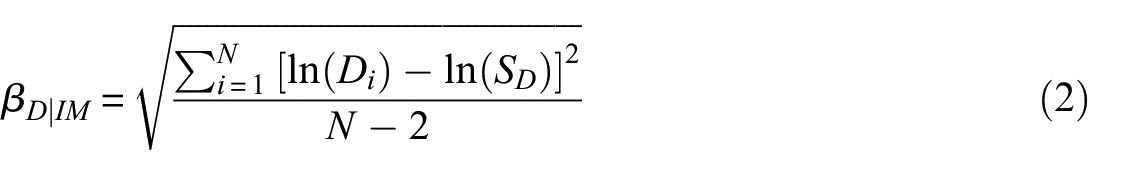
where
Component fragility notation, EDPs, and capacity limit state models for Era 2, multi-span, multi-column, seat-type RC bridges (Mangalathu, 2017; Shao et al., 2022)
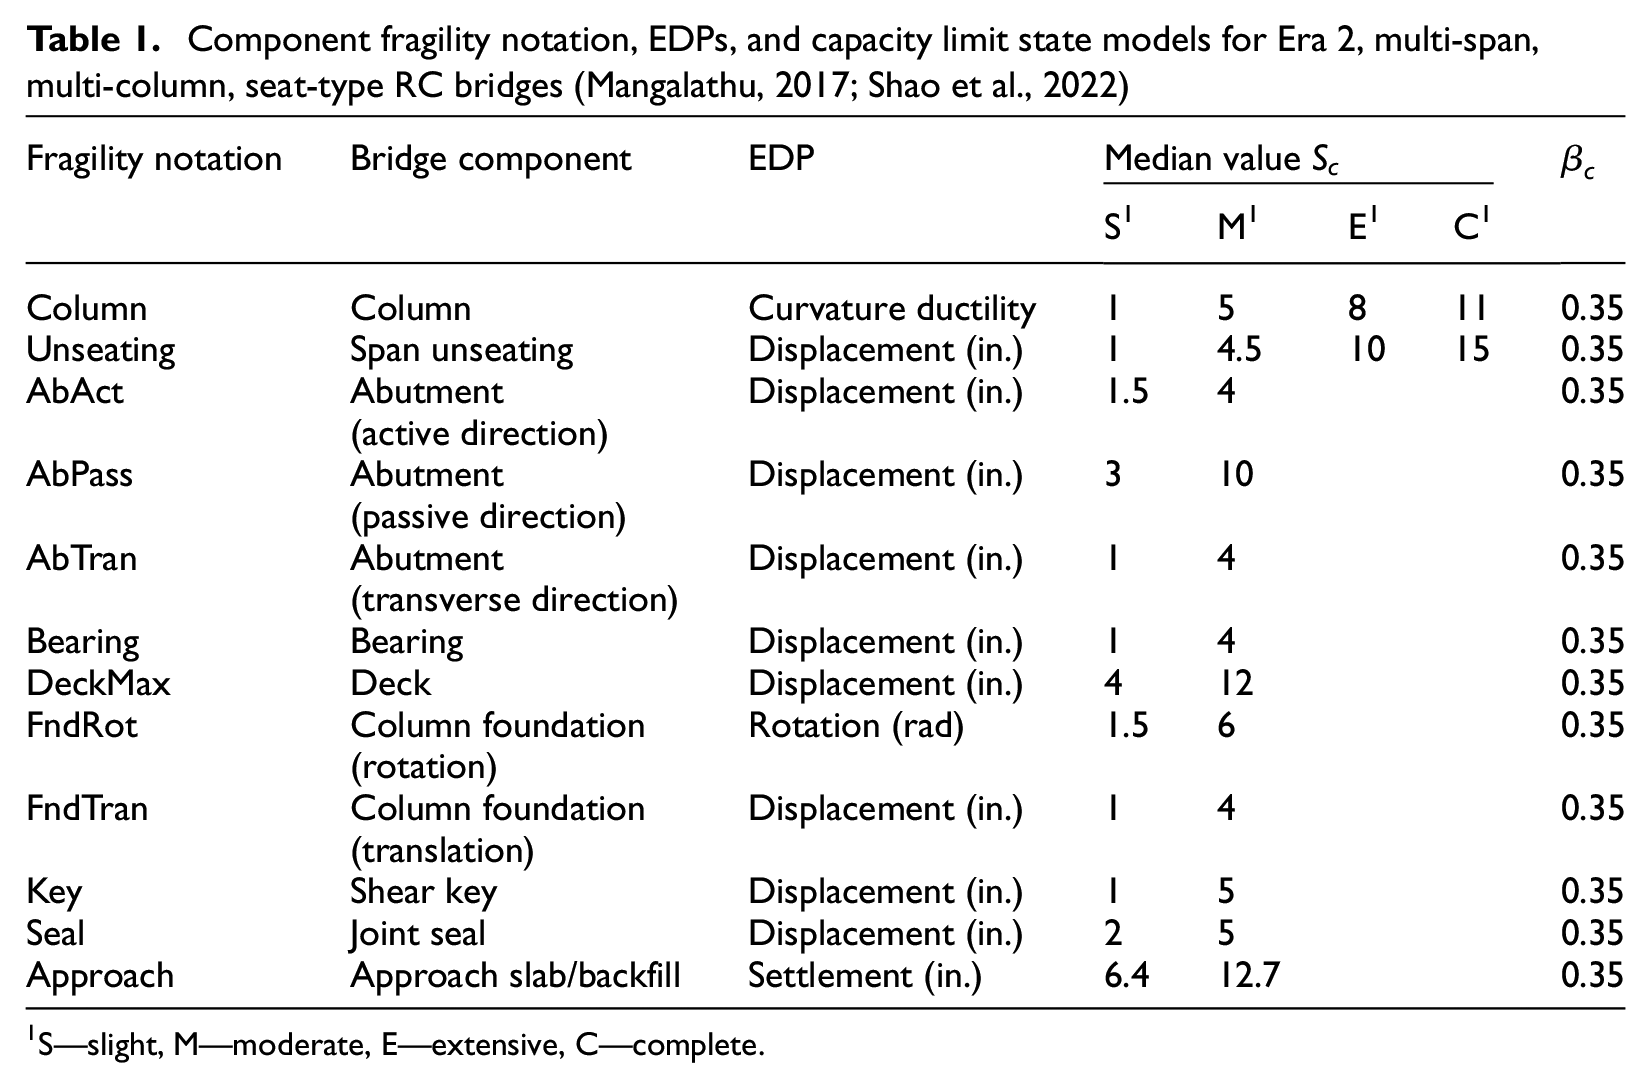
S—slight, M—moderate, E—extensive, C—complete.
Seismic damage states and capacity models of bridge components
Consistent with the HAZUS model (FEMA, 2003), the second-generation fragility models have been developed against four states, including slight, moderate, extensive, and complete damage. However, these damage states are defined across various bridge components to align with system-level bridge stability and operational targets. As such, bridge components are classified as either primary or secondary. Columns and span unseating at abutment/in-span seats are considered primary components, as their damage or failure has a direct impact on the overall stability and operational consequence of the bridge system. These two components are considered to have four damage states. In contrast, the remaining components listed in Table 1 are deemed secondary components without directly causing severe instability or total collapse (Mangalathu, 2017). The secondary components only have slight and moderate damage states. Recent efforts have also focused on refining the number and definitions of damage states for California bridges to better align with the state’s inspection and repair practices. For instance, Zheng (2021) identified seven column damage states, while Shao et al. (2022) proposed five damage states for approach slab settlement. However, this study converts them into four damage states to ensure compatibility with other previously developed second-generation fragility models. In particular, the minor and moderate damage states considered in the fragility models for approach slab settlement (Shao et al., 2022) are aligned with the slight and moderate damage states defined in the second-generation fragility models for other bridge components, taking into account system-level bridge stability, operational targets, and post-earthquake impacts such as repair actions, costs, and restoration efforts.
Component-level seismic capacities are considered to follow lognormal distributions, characterized by the median
Component- and system-level fragility modeling and parameters
Seismic demand models from the cloud analysis are convolved with the capacity models of each bridge component to compute the following damage state exceedance probabilities as the component-level fragility curve:
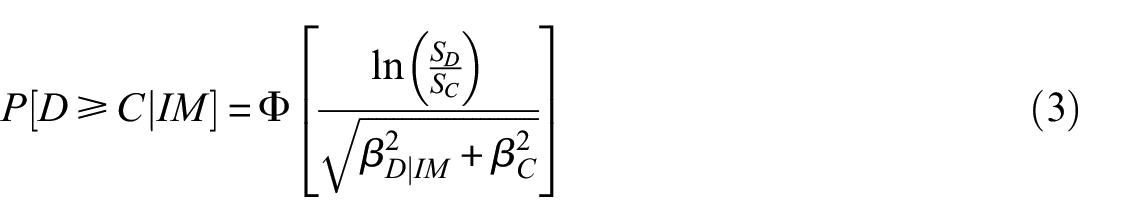
where
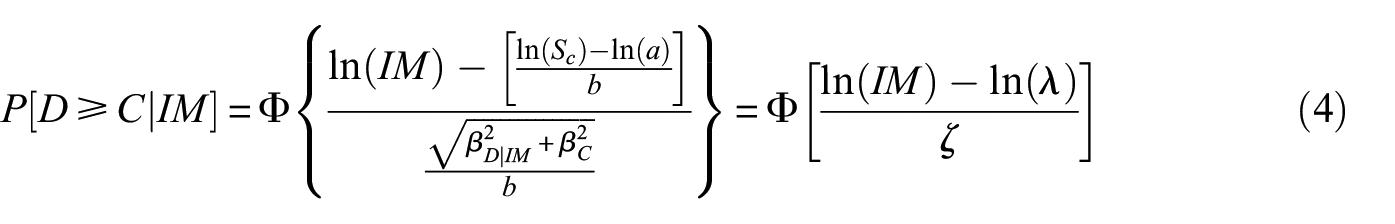
where
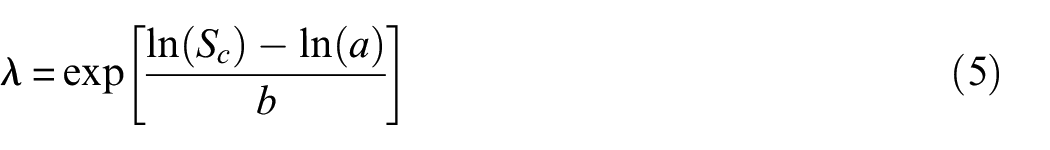
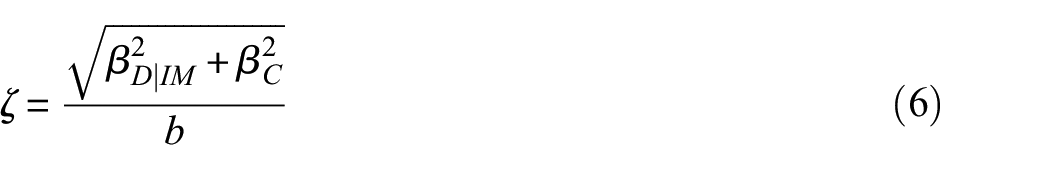
The median value
Overview of the fragility model database
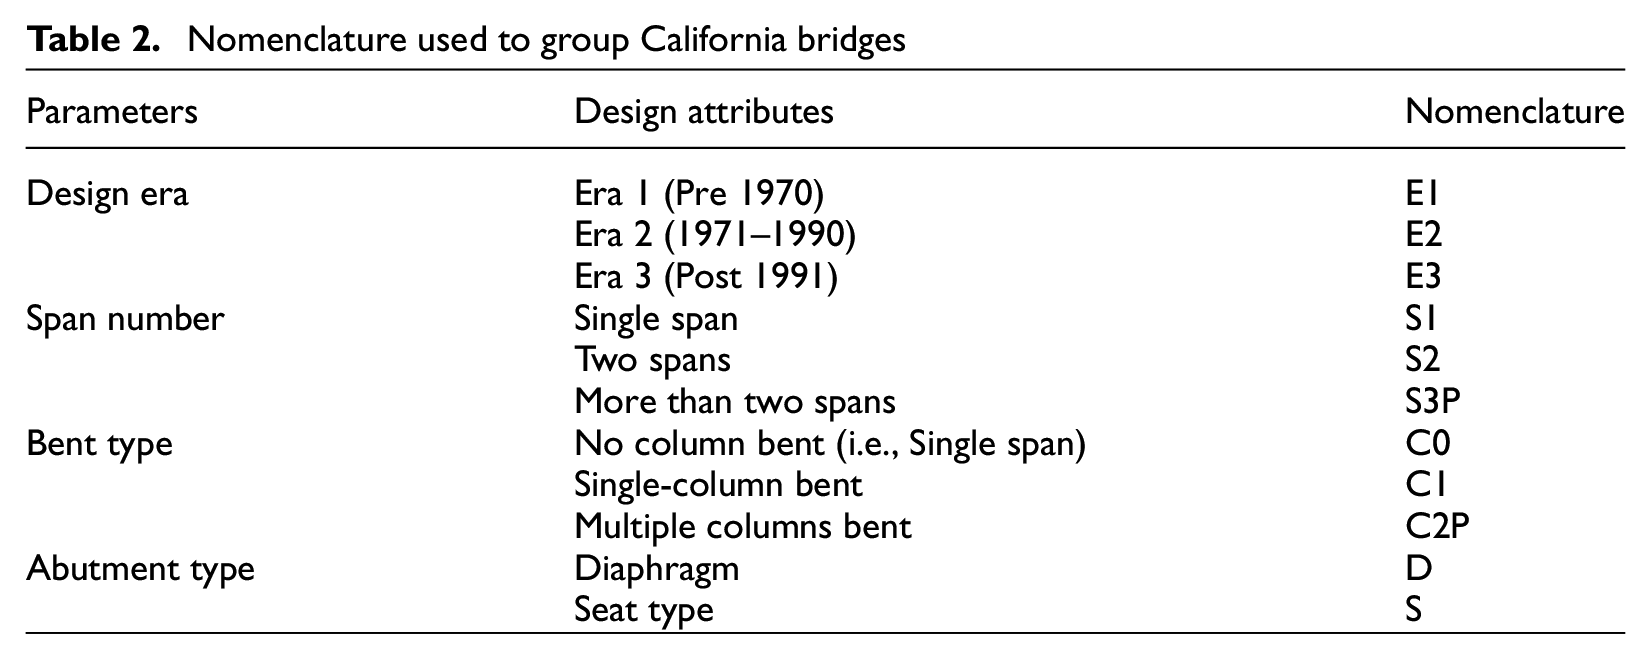
The second-generation fragility models show major distinctions across bridges designed in different eras, with different numbers of spans and columns, and between diaphragm and seat-type abutments. Table 2 lists these design attributes and their nomenclature used to differentiate each bridge group. For instance, the two-span concrete bridges with a single-column bent and seat-type abutments constructed in 1980 are assigned to the E2-S2-C1-S group. This grouping scheme provides a total of 24 groups for multi-span concrete bridges (i.e. 3 in design era × 2 in span number × 2 in bent type × 2 in abutment type). The single-span RC bridges are classified into two groups based on the abutment type, as they belong to span number S1 and bent type C0 by default. Besides, the influence of the design era is not considered for single-span bridges because (1) no era-specific fragility models exist and (2) the impact of the design era on fragilities is mainly attributed to improvements in the seismic design of columns (Mangalathu, 2017), which do not exist in single-span bridges. Several sets of fragility models are compiled for each bridge group. In total, the database consists of component and system-level fragility parameters for 26 groups of concrete bridges in California. Figure 3 presents the group assignment of the bridge inventory in the city of Los Angeles based on these design attributes using databases such as the National Bridge Inventory (NBI) (for general attributes such as location, structure/material type, year built, number of spans) (FHWA, 2024a), National Bridge Inventory Bridge Elements (for the number of component units) (FHWA, 2024b) and Google Street View (for abutment type and other bridges not listed in the NBI) (Anguelov et al., 2010).
Nomenclature used to group California bridges
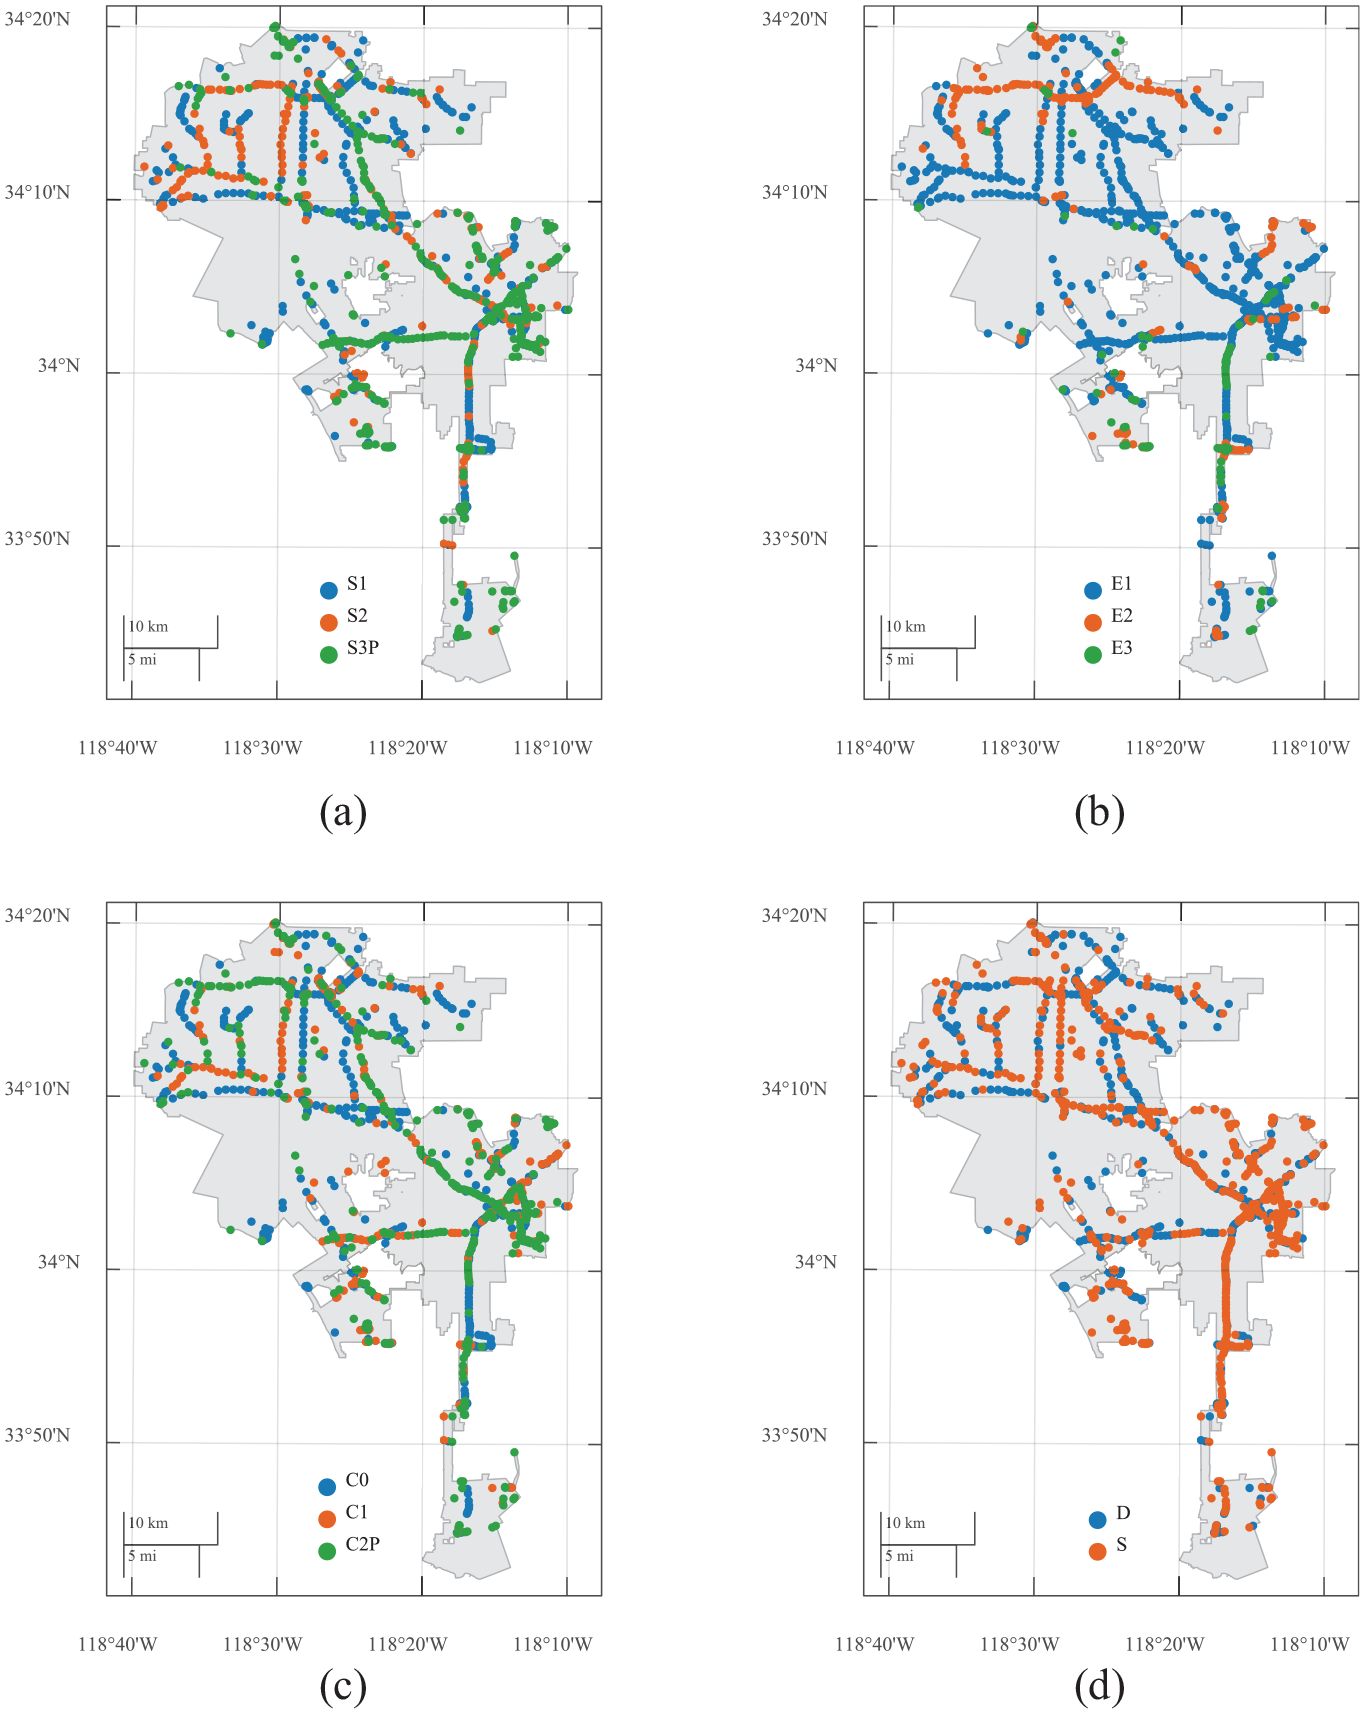
Grouping of bridges in Los Angeles based on different attributes: (a) Span number, (b) Design era, (c) Bent type and (d) Abutment type.
Table 3 lists previous studies as candidate references for extracting the corresponding second-generation fragility models for different California bridge groups. Several adjustments have been made during this model extraction process. First, the database excludes fragility models that (1) do not use
References used to extract the second-generation fragility models for California bridges
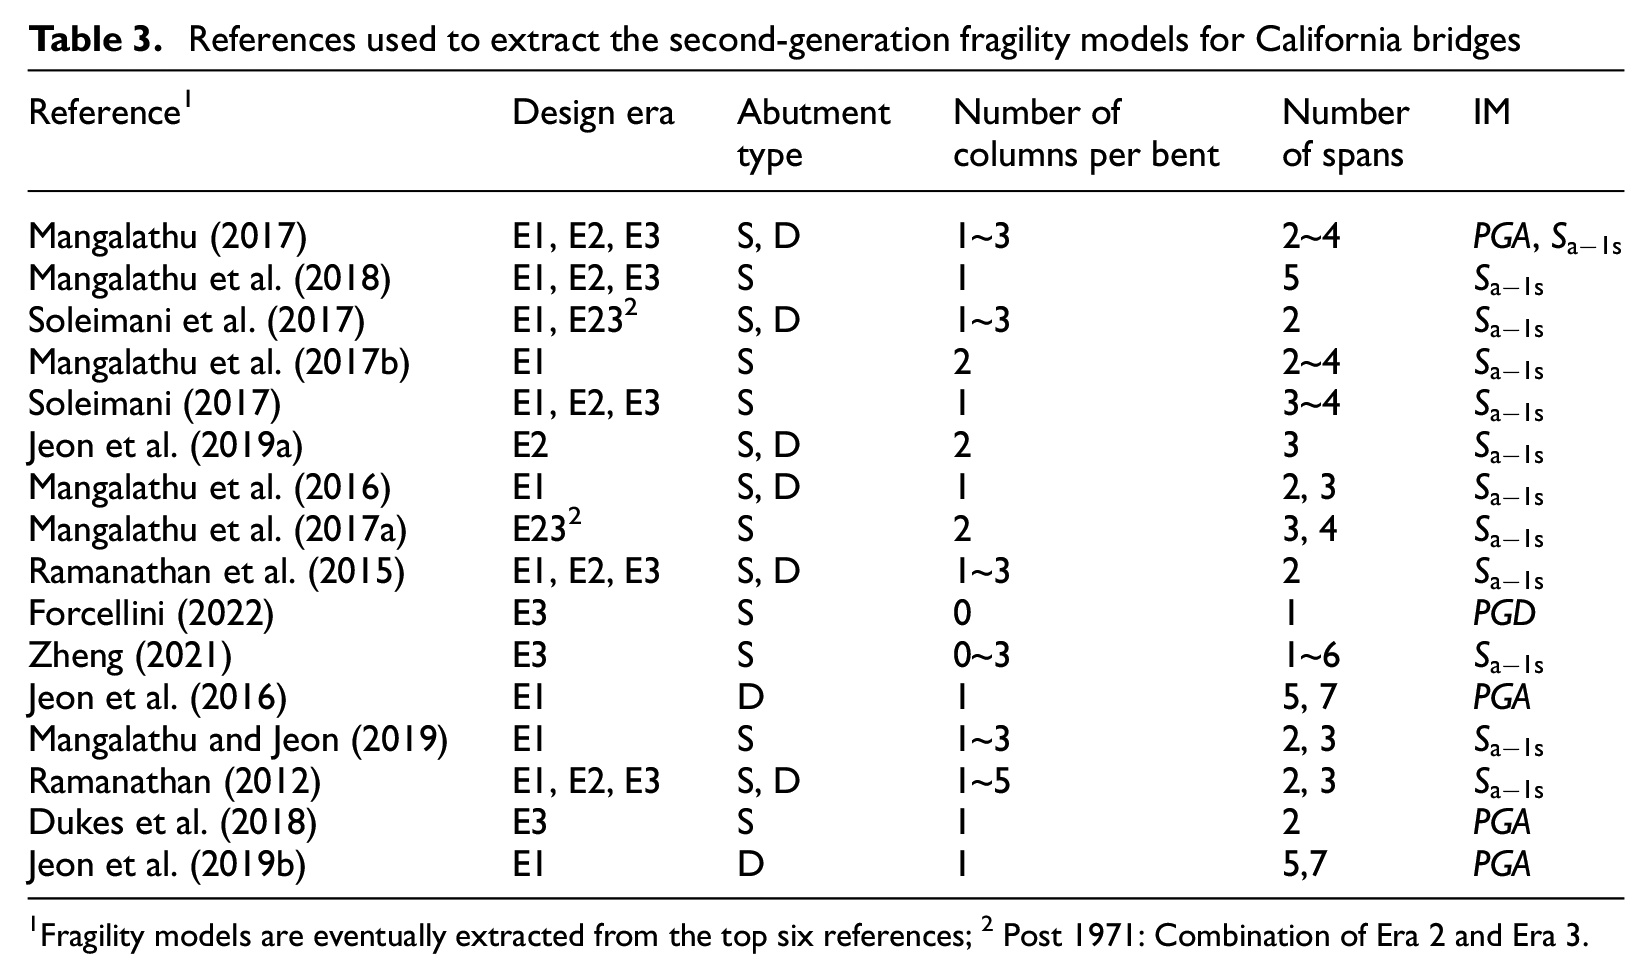
Fragility models are eventually extracted from the top six references; 2 Post 1971: Combination of Era 2 and Era 3.
Fragility model data for different bridge groups
Bridge component fragilities
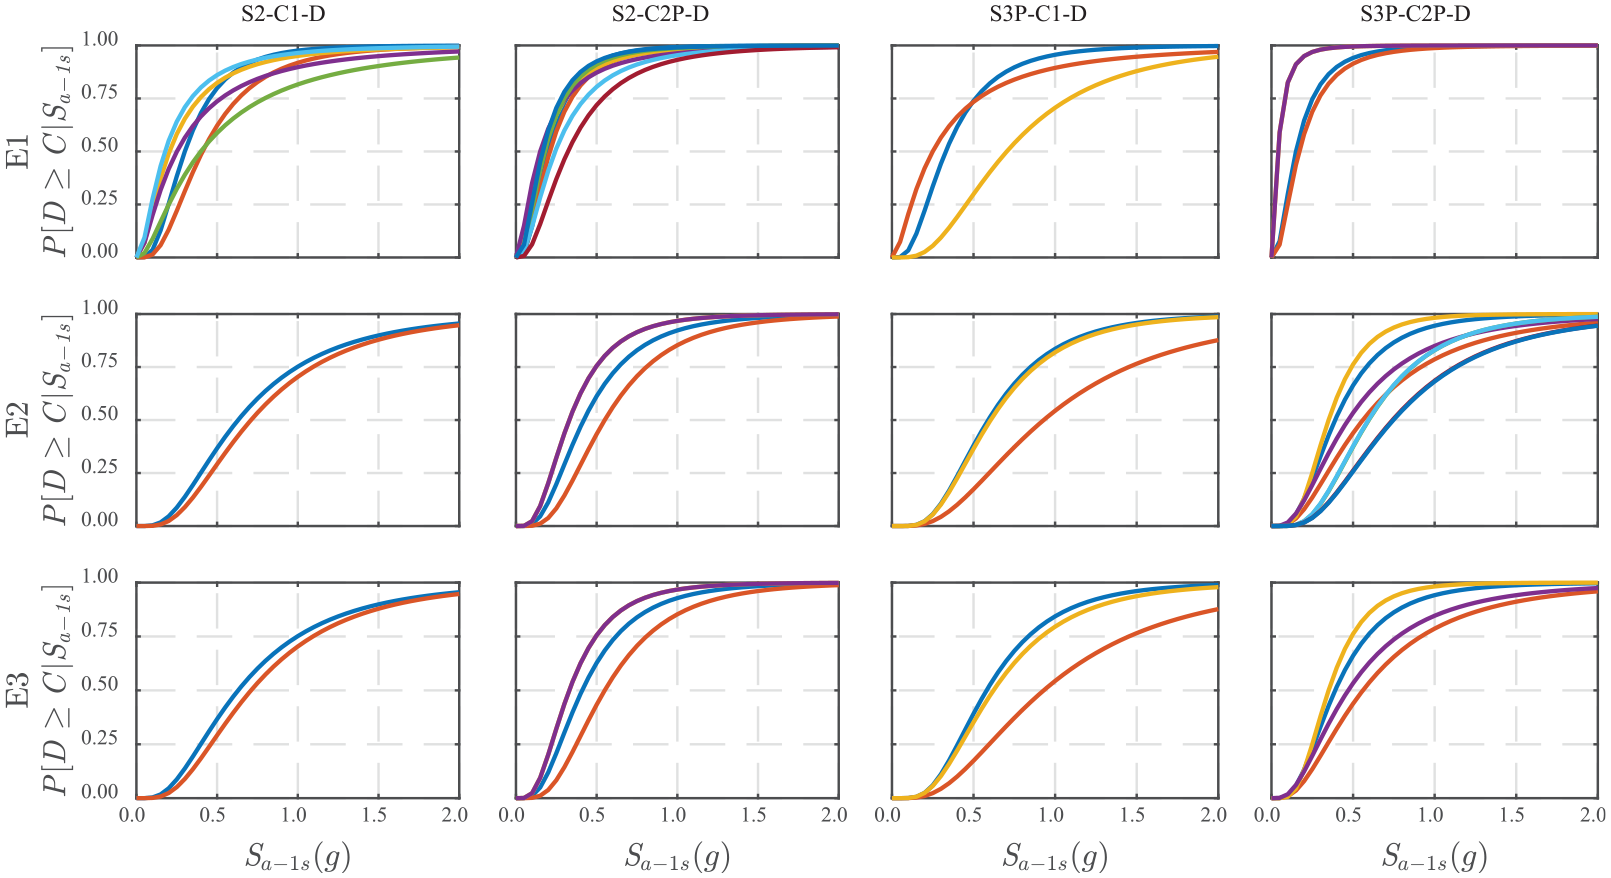
Figures 4 and 5 present the column fragility models for the complete damage state for multi-span diaphragm and seat-type bridges, respectively. It is worth noting that multiple fragility curves are extracted for the same bridge group in each figure to account for intra-group variance stemming from factors such as the developed numerical model, column shape (e.g. rectangular, circular, or oblong columns), column EDPs (curvature ductility, displacement ductility), and capacity limit states, among others. Despite this variance, both Figures 4 and 5 indicate consistent trends in terms of how the bridge attributes affect the columns’ fragilities. For example, when comparing the three figures, Era 1 columns exhibit the highest damage probabilities, followed by Era 2 columns, while Era 3 columns demonstrate the lowest fragilities. Columns in multi-column bents (C2P) tend to be more fragile than those in single-column bents (C1) when comparing figures in the same row. Columns in seat-type abutment bridges (Figure 5) are generally more fragile than those in diaphragm bridges (Figure 4) due to weaker longitudinal constraints in the former.
Column fragility models for seat-type bridges entering the complete damage state.
Figure 6 depicts fragility models for span unseating complete damage for multi-span bridges. They follow similar trends as column fragilities. Modern bridges in California were typically designed with a larger seat width, resulting in much lower fragilities for Era 2 and Era 3 bridges. Findings from Mangalathu (2017) indicate that span unseating fragilities for Era 2 and Era 3 bridges are similar. Therefore, they are presented together in Figure 6. It is noted that the E2-S3P-C2P-S group in the database also includes the unseating fragility models provided by (Jeon et al., 2019a), which are not shown in Figure 6 because the associated complete damage probabilities are extremely low, approaching 0 across varying
Span unseating fragility models for seat-type bridges entering the complete damage state.
Figure 7 shows fragility models for bridge components in the E2-S3P-C2P-S group meeting or exceeding the moderate damage state. Damage probabilities for other fragility items, such as column foundation (rotation), are nearly zero and are therefore not included in the figure. Figure 7 indicates that the bridge group under consideration includes seismically vulnerable components such as columns, span unseating, bearings, and abutment transverse deformations, which exhibit higher damage probabilities when compared with other components. Significant fragility variance exists for components such as columns, abutment active deformation, and approach settlement. This variance is a result of various studies conducted using different modeling assumptions. For instance, the fragilities of columns vary due to differences in column shape and column height (Jeon et al., 2019a; Mangalathu, 2017). The two distinct clusters in abutment active fragilities are primarily attributed to differences in bearing stiffness and backwall geometry (Jeon et al., 2019a; Mangalathu, 2017). The large variance in approach fragilities stems from different designs, settlement modes, abutment foundations, and analysis methods (Shao et al., 2022).
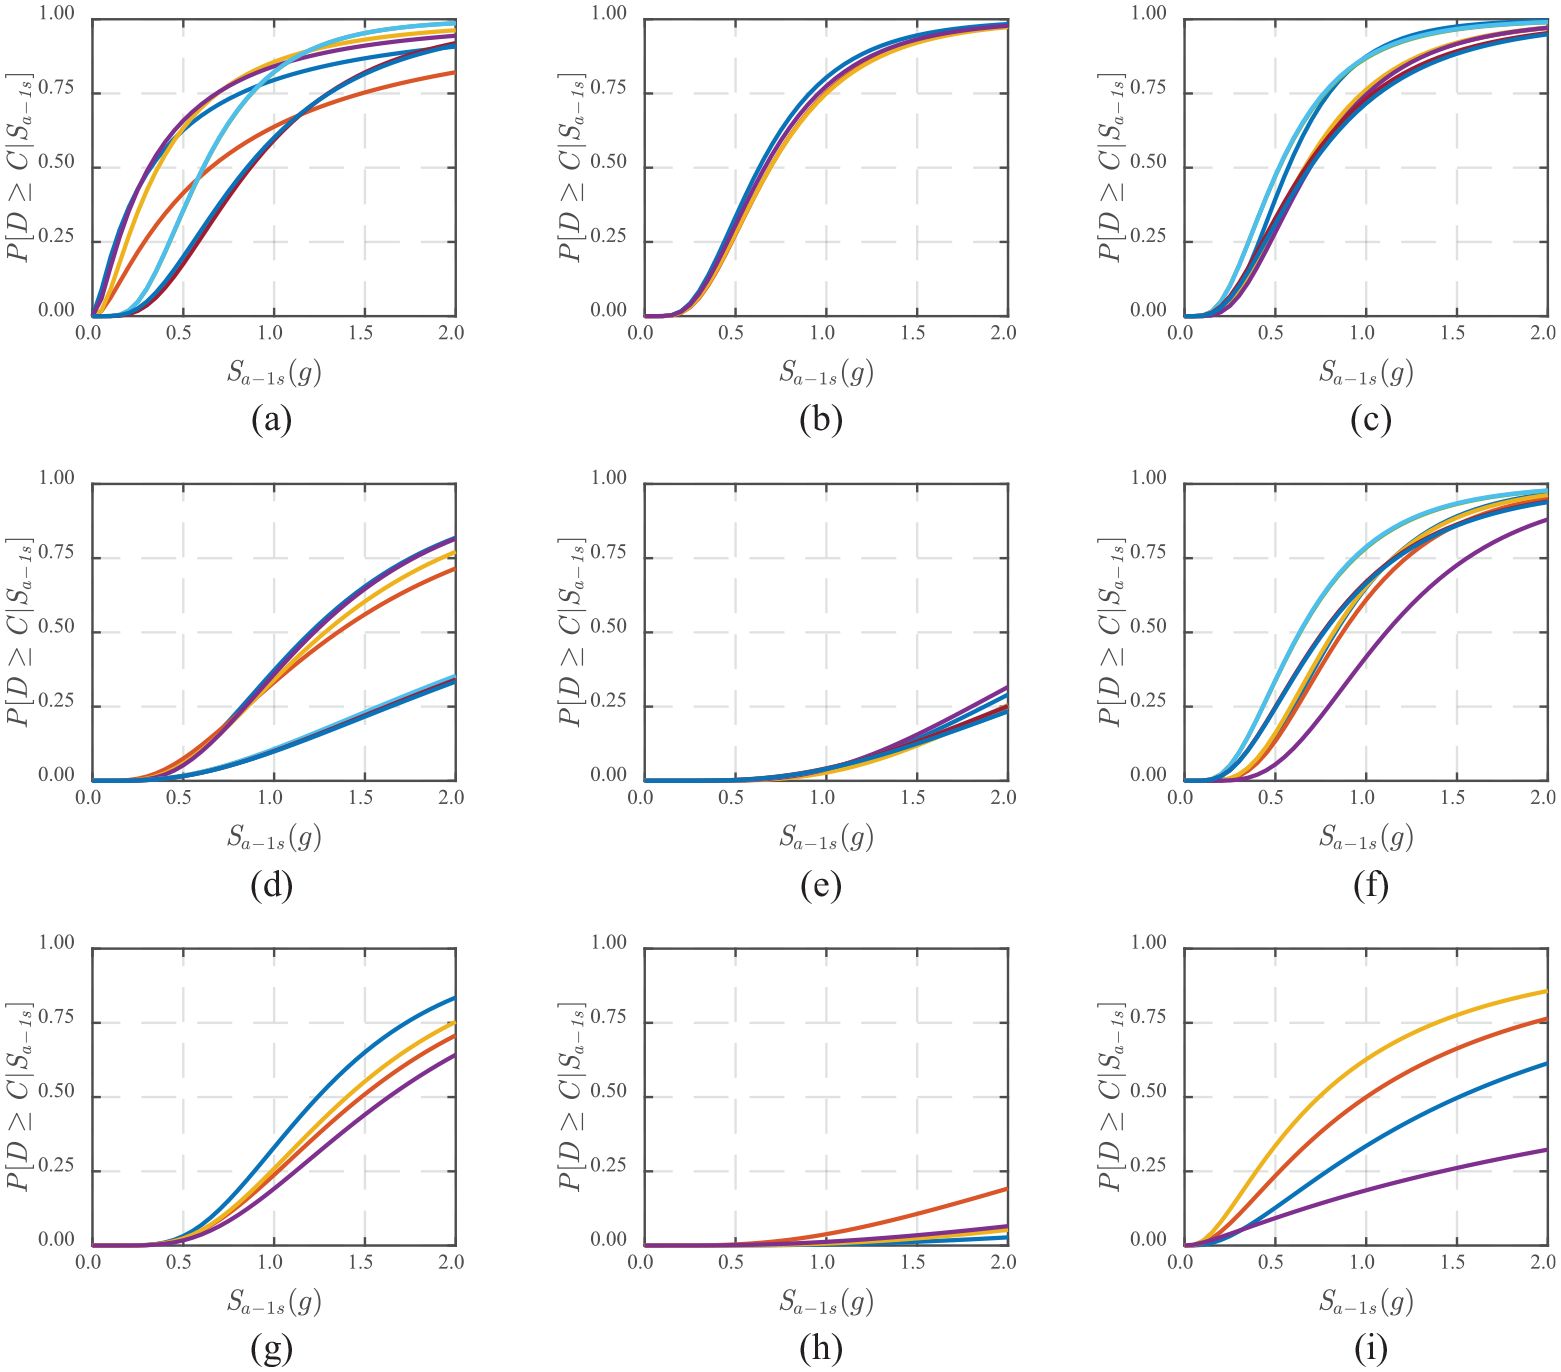
Component fragility models for the E2-S3P-C2P-S bridge group meeting or exceeding the moderate damage state: (a) Column, (b) Unseating, (c) Bearing, (d) AbAct, (e) AbPass, (f) AbTran, (g) DeckMax, (h) FndTran, and (i) Approach.
Bridge system fragilities
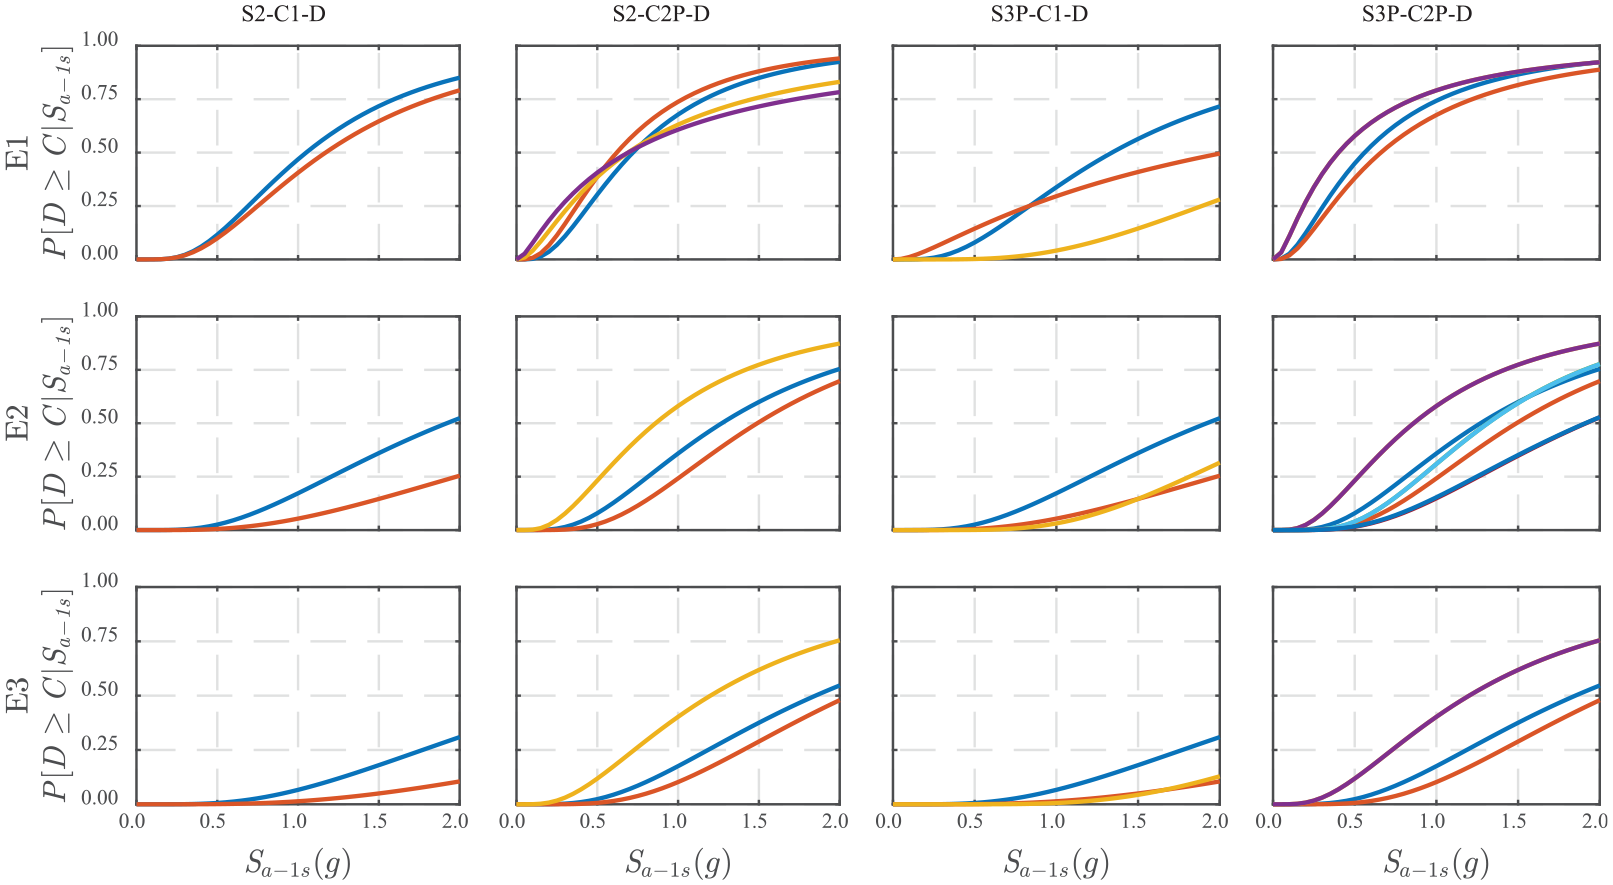
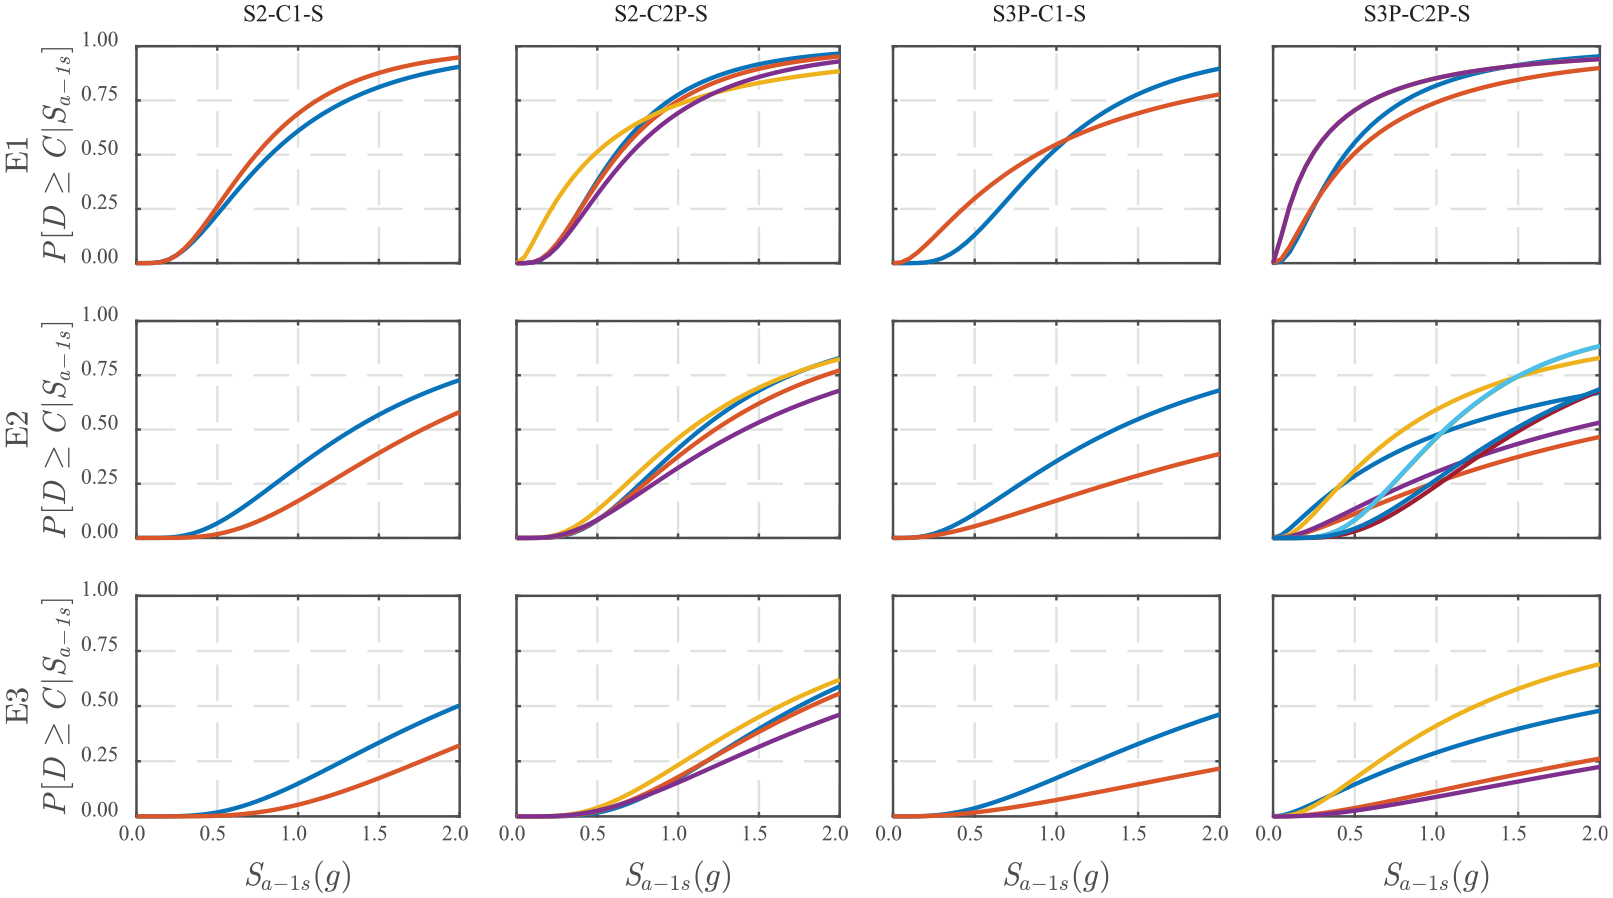
The JPSDM has been mainly adopted to develop system-level fragility models of different bridge groups. The JPSDM consists of marginal distributions of component seismic demands and a computed covariance matrix. These component demands are re-sampled with the embedded correlation and compared with the corresponding capacity limit states. The bridge system is then considered as a series system to reach a certain damage state should it be exceeded by any component. All bridge components will contribute to the system-level fragilities for the slight and moderate damage states, while those for extensive and complete damage are only affected by primary components, such as column and span unseating. For diaphragm bridges, only columns affect system fragilities at higher damage states. Figures 8 and 9 show the system fragility models for diaphragm and seat-type bridges when reaching the moderate and extensive damage states, respectively. When comparing the three figures in the same column, Era 1 bridges show much higher fragility than those in Era 2 and Era 3. Bridges with multiple columns (C2P) are more vulnerable than those with single columns (C1), as also demonstrated in Mangalathu (2017).
System fragility models for diaphragm bridges meeting or exceeding the moderate damage state.
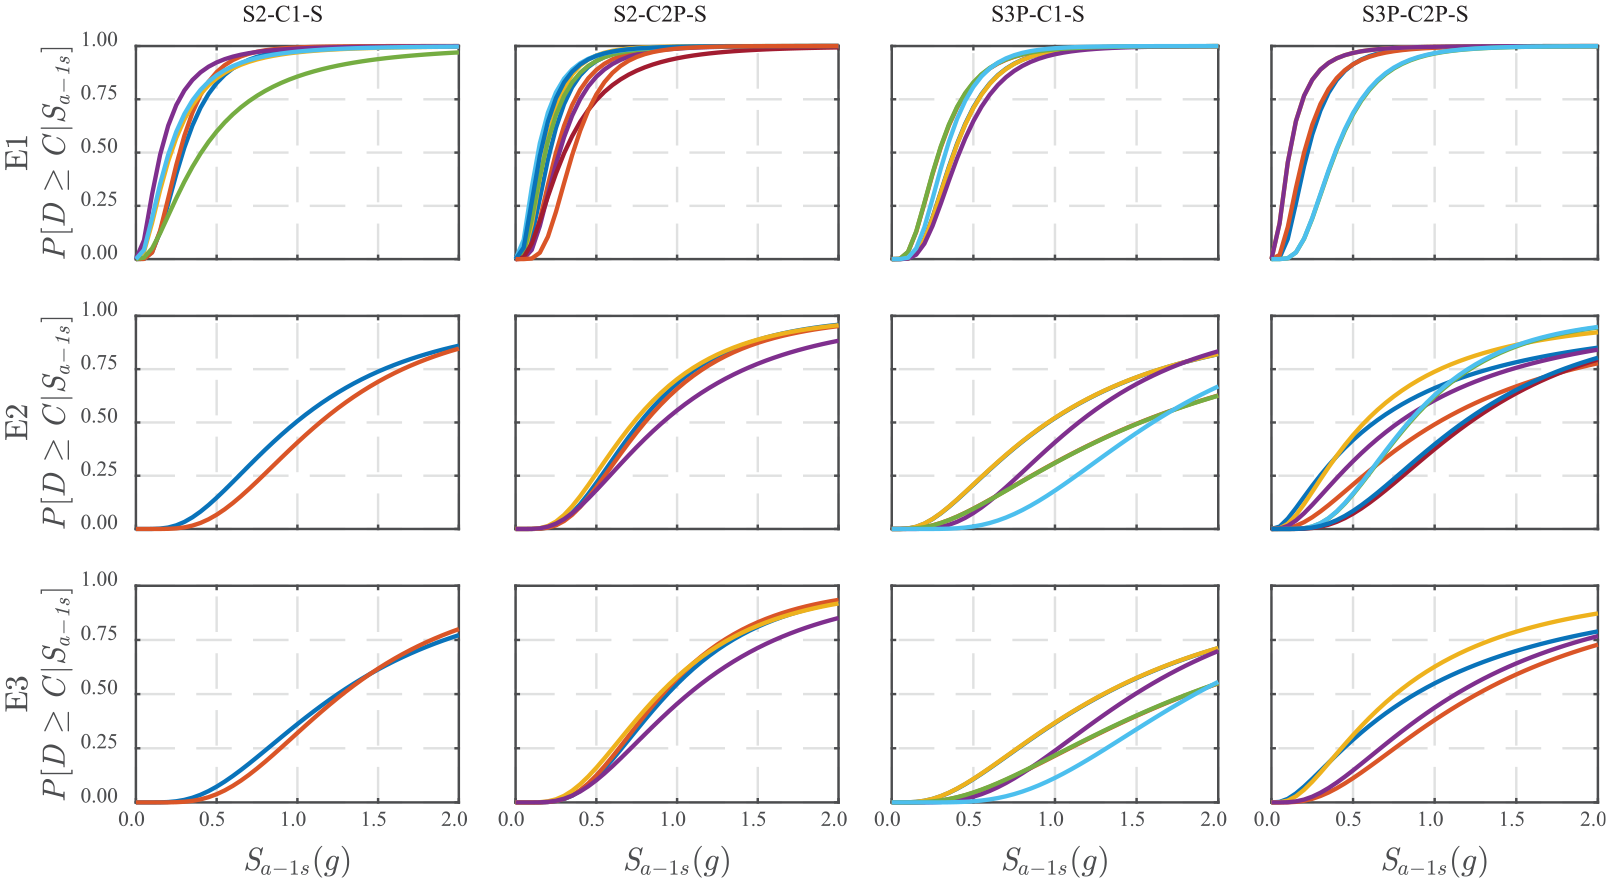
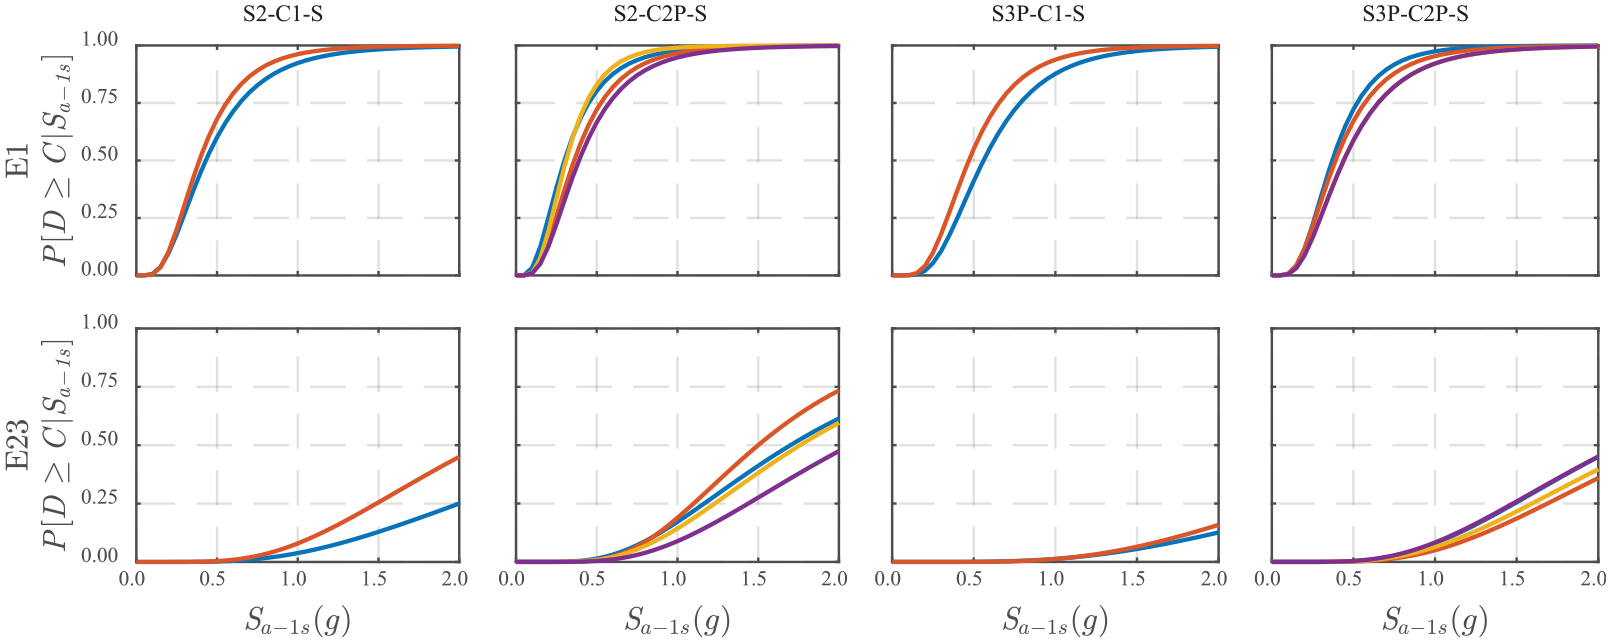
System fragility models for seat-type bridges when meeting or exceeding the extensive damage state.
Figure 10 presents system-level fragilities for single-span bridges. They are not designed with columns, and system instability for higher damage states is mainly controlled by span unseating. Therefore, single-span bridges with diaphragm abutments (i.e. with no abutment seats) only have fragilities for the slight and moderate damage states. Figure 10 shows that single-span diaphragm bridges have lower yet more varying fragility curves when compared with bridges with seat-type abutments. This is because the corresponding fragility models for single-span bridges with diaphragm abutments are not extracted from the literature but developed by applying stochastic modification factors, as previously discussed. The modification factors vary across design eras, causing a larger variance in the fragilities for single-span diaphragm bridges.
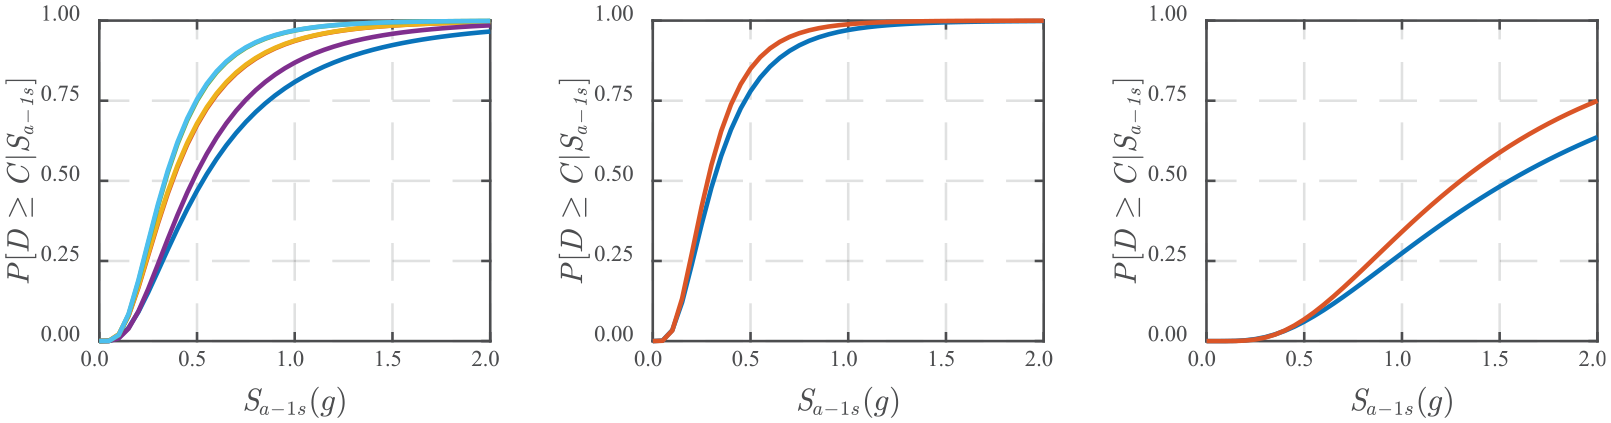
System-level fragility models for different types of single-span bridges: (a) Bridges with diaphragm abutments, moderate damage. (b) Bridges with seat-type abutments, moderate damage. (c) Bridges with seat-type abutments, complete damage.
Data reuse, summary, and conclusions
This data paper synthesizes the second-generation component- and system-level fragility models for 26 groups of RC California bridges. The database includes around 2300 component- and 500 system-level fragilities that vary based on their design era, span count, column number per bent, and abutment type. The fragilities feature several advancements over the first-generation HAZUS model that facilitate more detailed, component-level regional seismic damage, risk, and resilience assessments of bridge networks in California. By conducting such assessments at the bridge component level, more realistic, reliable, and granular assessment of seismic impacts on bridges can be achieved—for instance, this allows for disaggregated analyses that account for the necessary resolution and variations in seismic repair actions, material quantities, sequencing, and repair time, across individual bridge components. Such assessments are essential to support risk and resilience-informed emergency response, seismic retrofits, and long-term urban planning. As presented, multiple fragility curves are compiled for the same component type within each bridge group, enabling stochastic fragility model sampling when detailed bridge information is unavailable. However, if detailed bridge information is available, the fragility model database (Chen et al., 2025) also supports a more granular selection of specific fragility curves within a bridge group, as it provides the influential parameters (e.g. deck type, column shape, abutment type) that contribute to the differentiation of each curve.
Ongoing efforts target the integration of these second-generation fragility models into the NHERI-SimCenter (Deierlein et al., 2020) simulation platform. We add the bridge fragility models to the SimCenter’s Damage and Loss Model Library (NHERI SimCenter, 2025), which makes them available for local-scale analyses of individual bridges and regional-scale analyses of bridge portfolios. Examples of such analyses in the Pelicun damage and loss simulation engine (Zsarnóczay and Deierlein, 2020) and the corresponding SimCenter desktop applications will be developed and shared to serve as templates for researchers. These efforts combined with the bridge inventory generation capabilities provided by the SimCenter, will enable automated, high-resolution earthquake impact simulations for California bridges and bridge networks for all researchers in the natural hazards engineering community.
The current fragility models are for RC bridges supported by columns. To enhance their applicability, additional models are needed to either expand the database to encompass other bridge types or introduce modification factors that can be applied to existing fragility parameters. These enhancements should include bridges with features such as skewed and curved decks, steel decks, pier walls, extended column-pile shafts, and complex irregular configurations, including multi-span bridges commonly used in highway interchanges in California. The fragility models currently address bridges subjected to seismic shaking only; further expansion is also needed to capture the impact of seismic co-hazards such as ground movements caused by soil liquefaction.
Footnotes
Declaration of conflicting interests
The author(s) declared no potential conflicts of interest with respect to the research, authorship, and/or publication of this article.
Funding
The author(s) disclosed receipt of the following financial support for the research, authorship, and/or publication of this article: This research has been supported by the Canada NSERC Alliance International Catalyst Grant, the Pacific Earthquake Engineering Research Center’s Transportation Systems Research Program, and the U.S. National Science Foundation under Grant No. 2131111. Any opinions, findings, conclusions, or recommendations expressed in this paper are those of the authors and do not necessarily reflect the official views or policies of the funding agencies.