Recent research indicates that there are regionally variable differences between the —adjusted Next Generation Attenuation Relationships for Central & Eastern North-America (NGA-East) ground motion models (GMM) and recorded ground motions in Central and Eastern North America (CENA), such that region-specific adjustments are required. Increases in induced seismicity in the Texas, Oklahoma, and Kansas (TOK) region provide the motivation and the data to develop regional source, path, and site adjustments to the NGA-East central branch GMM for application to this region. For this purpose, we compiled a database within TOK of 12,756 ground motion recordings from 557 stations and 342 events with magnitudes 3.5–5.8. A mixed-effects reference empirical approach is applied to quantify the average misfit and adjustments to magnitude, distance, and site amplification scaling for TOK. The average misfit relative to the NGA-East GMM reference condition indicates overprediction at short periods and underprediction at long periods. The magnitude adjustment reduces the long-period response spectral values at magnitudes greater than about 4.5, the distance adjustment modifies the short- and mid-distance scaling, and the resulting site amplification model is similar to others developed for CENA.
To characterize earthquake ground motions in Central and Eastern North America (CENA), the NGA-East research project developed a set of median ground motion models (GMMs) and associated weights for these GMMs (Goulet et al., 2021a). The reference rock condition for these GMMs is = 3000 m/s (Hashash et al., 2014), where is the time-averaged shear-wave velocity for the top 30 m of the site. The NGA-East geotechnical working group (GWG) contributed to the development of an ergodic site amplification model for CENA (Stewart et al., 2020), which consists of three components: linear site amplification for = 760 m/s relative to = 3000 m/s (), linear site amplification for any relative to = 760 m/s (), and nonlinear site amplification as a function of ground motion intensity () (Hashash et al., 2020). Ideally, the NGA-East median GMMs for reference rock should be used in combination with the CENA site amplification model to predict ground motions in CENA. However, recent research (Ramos-Sepulveda et al., 2024) indicates period-dependent misfits of the NGA-East median GMMs when combined with the recommended site amplification model, based on comparisons with an expanded database of recorded ground motions in CENA. This misfit is regionally variable and is potentially a result of the decoupled procedure used to develop the NGA-East median GMMs for the reference rock condition and the CENA site amplification model. Ramos-Sepulveda et al. (2024) also found that different regions within CENA have distinct levels of misfit, suggesting that region-specific adjustments to the NGA-East GMMs may be needed. Other studies, such as Akhani et al. (2024), have also identified regional differences in ground shaking in CENA.
Increases in induced seismicity in the Texas, Oklahoma, and Kansas (TOK) region since ∼2010 provide the motivation to develop a region-specific GMM for use in seismic hazard assessments, and increases in the density of instrumentation in the region provide the ground motion data required to develop regional adjustments to the NGA-East central branch GMM. For this purpose, we downloaded, processed, and compiled ground motion recordings for earthquake events between 2005 and 2022 in TOK. Much of the data in TOK is from potentially induced earthquakes and previous research (Moschetti et al., 2019; Zalachoris and Rathje, 2019) has demonstrated that the region has distinct magnitude and distance scaling as compared to the broader CENA region. Thus, we develop TOK-specific adjustments for the NGA-East central branch GMM, including the overall misfit, magnitude distance scaling, and site amplification, using the new data set. These TOK-specific adjustments account for regional source, path, and site effects, as well as the fact that most, if not all, of the earthquakes in the region are potentially induced.
This article provides a review of related prior work regarding the NGA-East GMMs, the NGA-East site amplification model, and the model misfit as quantified by Ramos-Sepulveda et al. (2024). This is followed by an explanation of the methodology used to develop the reference empirical GMM for the study region, a description of the data set, and a presentation of the reference empirical adjustments that represent the new GMM. Finally, the components of the developed empirical GMM are compared with previously published models.
NGA-East median GMMs
The NGA-East project (Goulet et al., 2021a) produced GMMs for CENA using a database of more than 27,000 earthquake records from the CENA region between 1976 and 2011 (Goulet et al., 2021b). The development of the NGA-East GMMs started with building 20 “seed” GMMs for the NGA-East region (PEER, 2015), and these seed GMMs were used to develop 17 median GMMs and a weighted median, that is the NGA-East central branch GMM that, together, captures the epistemic uncertainty in ground motion prediction in CENA. The resulting GMMs are applicable to M = 4.0 to 8.2, rupture distances () from 0 to 1500 km, and reference rock conditions of = 0.006 s and = 3000 m/s. The final median GMMs for peak ground acceleration (PGA), peak ground velocity (PGV), and 5%-damped pseudo-spectral acceleration (PSA) for oscillator periods between 0.01 and 10 s are provided in the form of tables.
Stewart et al. (2020) developed the recommended CENA site amplification model to be used with the NGA-East median GMMs. The site amplification model predicts the natural log of the amplification () and consists of three additive components that represent: (1) an model that describes the linear-elastic site amplification of = 760 m/s relative to = 3000 m/s, (2) an model that describes the linear-elastic scaling relative to = 760 m/s (), and (3) a nonlinear model that incorporates the effect of ground motion intensity (the nonlinear part of the model was presented by Hashash et al. (2020)). The full site amplification model relative to the reference condition of m/s is as follows:
where
Because of the availability of a significant amount of low-intensity motions, the NGA-East model was developed empirically from ground motion recordings, while the and terms were based on simulations because little to no empirical data were available at the reference rock condition (for ) or at high intensities (for ). This study focuses on the linear component of the site amplification model, and thus, the and models are reviewed here.
The model recommended by Stewart et al. (2020) is largely based on the site amplification model developed by the NGA-East GWG (Parker et al., 2019). This model was derived from the NGA-East data through an analysis of the within-event rock residuals () computed relative to a GMM for a reference rock condition of = 760 m/s. Two GMMs for CENA, Yenier and Atkinson (2015; YA15) and Hassani and Atkinson (2015; HA15), were used to compute the within-event rock residuals, and an iterative procedure was implemented to conduct regression of the within-event rock residuals relative to .
The model developed by Parker et al. (2019) defines the natural log of the amplification as proportional to . The slope of this relationship is period-dependent and negative, with negative values indicating that amplification increases with decreasing . The slope from the CENA model of Parker et al. (2019) is less negative than the slope from models for active tectonic regions (Seyhan and Stewart, 2014), indicating that the correlation of amplification with is weaker in CENA. Similar results (i.e. weak scaling) were identified by Hassani and Atkinson (2017), Zalachoris and Rathje (2019), and Boore (2020).
The model suggested by Stewart et al. (2020) utilizes two simulation-based models: one for = 760 m/s velocity profiles with large impedance contrasts and one for velocity profiles with gradual velocity gradients. The amplification model for the impedance condition () is derived from simulation results by Boore and Campbell (2017), Darragh et al. (2015), and Harmon et al. (2019), while the amplification model for the gradient condition () used the results from Darragh et al. (2015) and Frankel et al. (1996) as re-analyzed by Stewart et al. (2020). The main difference in the two models is that the impedance model shows strong, peaked amplification at a period of about 0.1 s, while the gradient model has a wider and lower-amplitude peak at about 0.25 s.
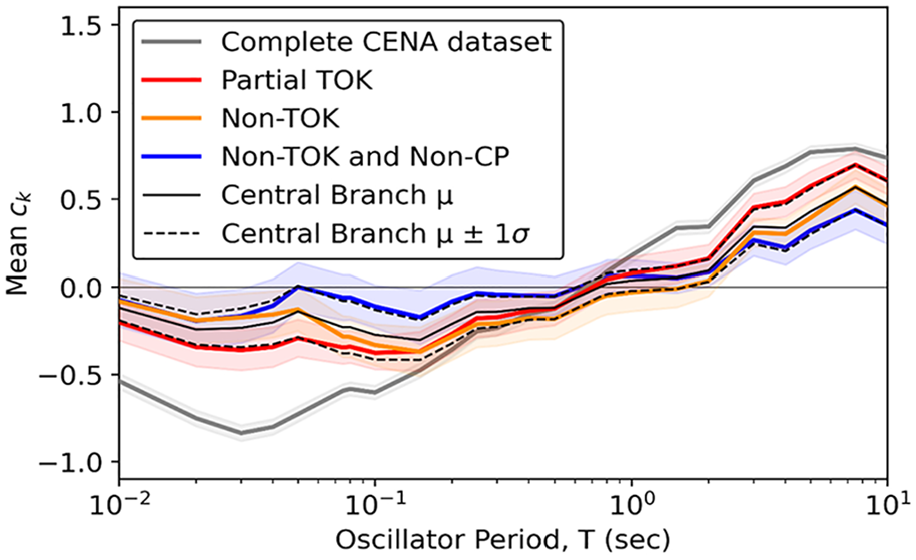
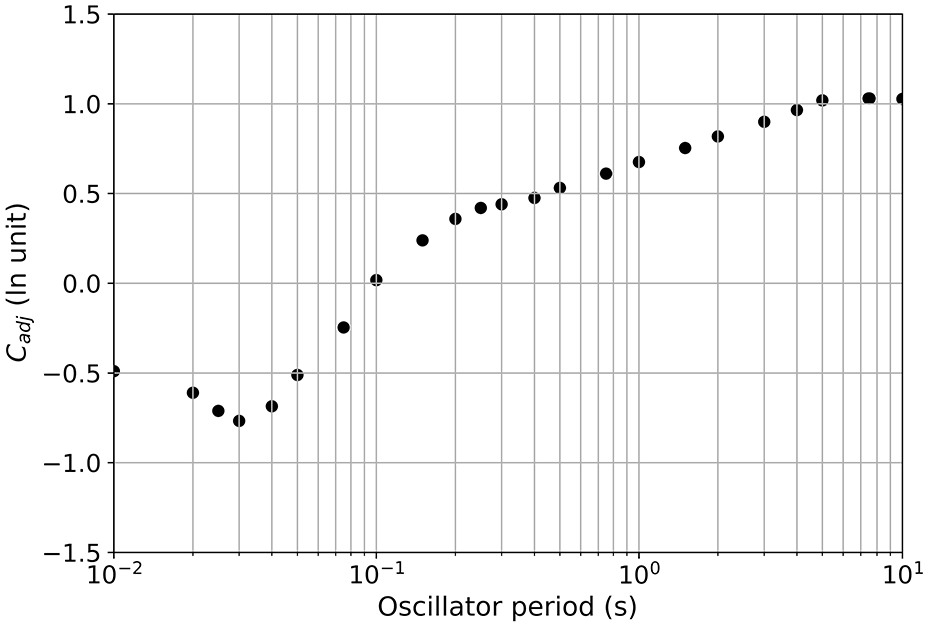
Ramos-Sepulveda et al. (2024) used data from an expanded version of the NGA-East database (Ramos-Sepulveda et al., 2023a) with magnitudes greater than 4.0 and rupture distances up to 600 km to analyze potential misfits of the NGA-East median GMMs when combined with the Stewart et al. (2020) and models. Mixed-effects analyses were applied to the ground motion residuals to obtain the overall misfit, . The analyses considered different regional subsets of the expanded NGA-East database as well as alternative NGA-East median GMMs and consistently found non-zero, period-dependent misfits. Figure 1 shows the computed misfits for the NGA-East central branch GMM for the different subsets of data. Although the amount of misfit is variable among the data sets, they all show negative misfit (overprediction by the GMM) at short periods and positive misfit (underprediction) at long periods. The misfits were strongest when utilizing the complete CENA data set and less strong when data from the TOK region were partially or fully removed. Similar results were found when using one of the seed NGA-East seed GMMs (Pezeshk et al., 2018) instead of the NGA-East median GMM. Because data from the TOK region dominate the expanded CENA data set, the results in Figure 1 indicate that the TOK region has unique characteristics relative to the rest of CENA.
Mean misfit (ck) vs period for the NGA-East central branch GMM using different subsets of CENA data (reproduced with permission from Ramos-Sepulveda et al., 2024).
Ground motion database
The ground motion database applied in this study is a combination a prior database for TOK (Zalachoris et al., 2020), the TOK motions included in the expanded NGA-East data set (Ramos-Sepulveda et al., 2024), and newly compiled and processed data for TOK. While the new data compilation efforts are largely similar to those used by the other two studies, some minor differences exist that are described below. The attributes of the combined data set used in this study are described below, and the flatfile of the data set has been published electronically by Li et al. (2023).
As part of the Zalachoris and Rathje (2019) GMM development, a ground motion database of 4528 earthquake ground motions recorded between January 2005 and November 2016 from 376 events in TOK was established (Zalachoris et al., 2020). The data covered a moment magnitude range of M = 3.0–5.8 and a hypocentral distance range of 4 to 500 km. As a result of substantially different attenuation characteristics for source-to-site paths passing through the Gulf Coast Plain as compared to other paths represented in the data set, the ground motions for events that occurred in the Gulf Coast Plain or recorded by seismic stations within the Gulf Coast Plain were removed from the flatfile used in GMM development.
For this study, we augmented the Zalachoris et al. (2020) database with ground motions recorded in TOK between November 2016 and December 2022. These additional events include all magnitudes greater than 3.5 between January 2005 and February 2022, as well as all events with magnitudes greater than 4.0 between February 2022 and December 2022. The resulting TOK catalog has 551 events, with 62.8% having reported moment magnitudes (M) from the ANSS Comprehensive Earthquake Catalog (ComCat) and the remaining only having reported local magnitudes or other types of magnitudes. To avoid conversions from other magnitude scales to M, only events with reported moment magnitudes were used in our analysis, which resulted in a total of 342 events (58 events in Texas, 253 events in Oklahoma, and 31 events in Kansas). Database development for this study occurred in parallel and in coordination with database development by Ramos-Sepulveda et al. (2024).
The final analyzed TOK data set for M ≥ 3.5 events includes 12,756 earthquake ground motions (after combining the two horizontal components) from 342 events between January 2005 and December 2022, which were recorded by 557 seismic recording stations (Li et al., 2023). All of these events have at least three recordings, and no attempt was made to distinguish tectonic from potentially induced earthquakes. The data set includes 2617 motions from the database developed by Zalachoris and Rathje (2019), 2256 motions from the database developed by Ramos-Sepulveda et al. (2024), and 7883 motions processed during this study. For the Zalachoris and Rathje (2019) data set, the hypocentral distance was used as the rupture distance because it was assumed that hypocentral distance provided an appropriate estimate of rupture distance for the relatively small magnitude events. Ramos-Sepulveda et al. (2024) used procedures from Contreras et al. (2022) to approximate rupture dimensions and compute rupture distance. For the new motions processed in this study, the rupture distance was calculated based on rupture models or, when unavailable, estimated from the epicentral distance and earthquake magnitude using the approach of Thompson and Worden (2017).
For this study, ground motion recordings were processed using automated procedures as provided in the U.S. Geological Survey software, gmprocess (Hearne et al., 2019; Thompson et al., 2025). The data processing steps in gmprocess generally follow the criteria used in NGA projects (Goulet et al., 2021b; Kishida et al., 2020), except that an automated algorithm is used to identify the corner frequencies of the band-pass filter based on the signal-to-noise ratio (SNR) and the displacement time series after filtering (Ramos-Sepulveda et al., 2023b). Visual checks of the filtered ground motions were applied after the automated processing. This approach matches the approach used by Ramos-Sepulveda et al. (2024), except for a minor difference in that we chose to always apply the low-pass corner frequency as provided by gmprocess. A detailed description of the data processing procedure is provided by Centella et al. (2023).
For the processed ground motion records, the rotation-angle-independent ground motion intensity measures (IMs) (RotD50, Boore, 2010) were computed for the periods used in the NGA-East database (Goulet et al., 2021b) using the Python package ucla_geotech_tools developed by Brandenberg and Yang (2021).
Values of were assigned to sites from measured profiles where available, while the P-wave seismogram method (Ni et al., 2014) or proxy-based methods were utilized at other sites. The assignment of used the following protocols:
If neither a measured nor a P-wave seismogram estimated is available, assign from the geostatistical map of Li et al. (2022) for Texas sites and that from the hybrid slope-geology-based proxy method of Li et al. (2022) for Oklahoma and Kansas sites.
The measurements were obtained from a variety of sources, including Goulet et al. (2014), Yust (2018), Stephenson et al. (2021), Mendoza et al. (2017), and EPRI (2013). The number of TOK sites with measured is 79 (14%), the number of sites assigned values from P-wave seismogram estimates is 149 (27%), and the remaining 329 (59%) sites were assigned values using proxy methods.
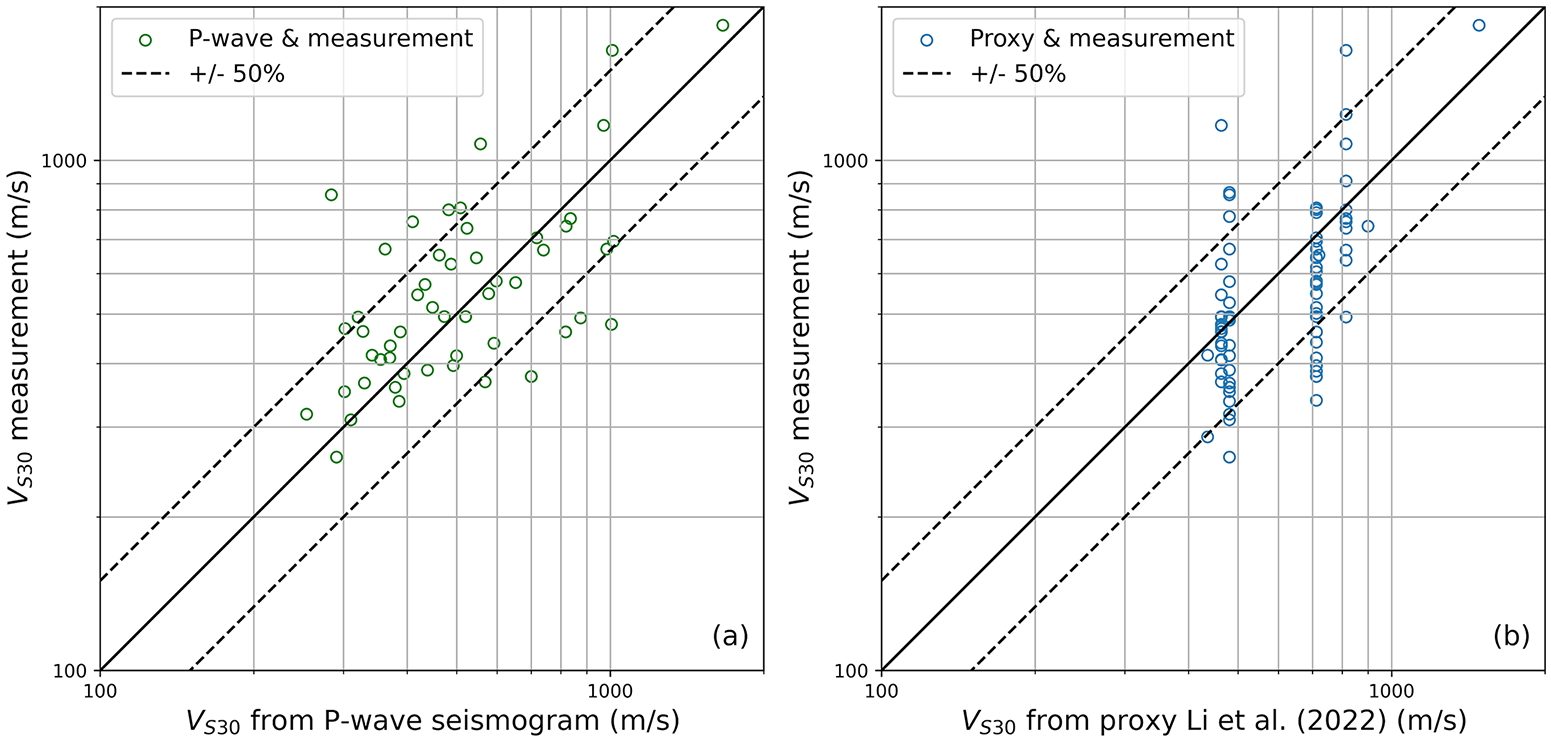
Values of estimated using the P-wave seismogram method were validated using the data set of measurements. A comparison of values for the 55 sites for which both were available is shown in Figure 2a. The mean residual in ln units is 0.042 (∼4% bias), and the standard deviation is 0.365. Proxy-based estimates from Li et al. (2022) were compared with measurements at 79 sites where measurements are available, as shown in Figure 2b. The mean and standard deviation of the residuals (in ln units) are −0.102 (∼10% bias) and 0.314, respectively. These statistics indicate that the P-wave seismogram and proxy-based methods provide reliable estimates with minimal bias.
(a) Comparison between measured and P-wave seismogram estimated at 55 sites and (b) comparison between measured and estimated based on hybrid slope-geology proxy methods of Li et al. (2022) at 79 sites.
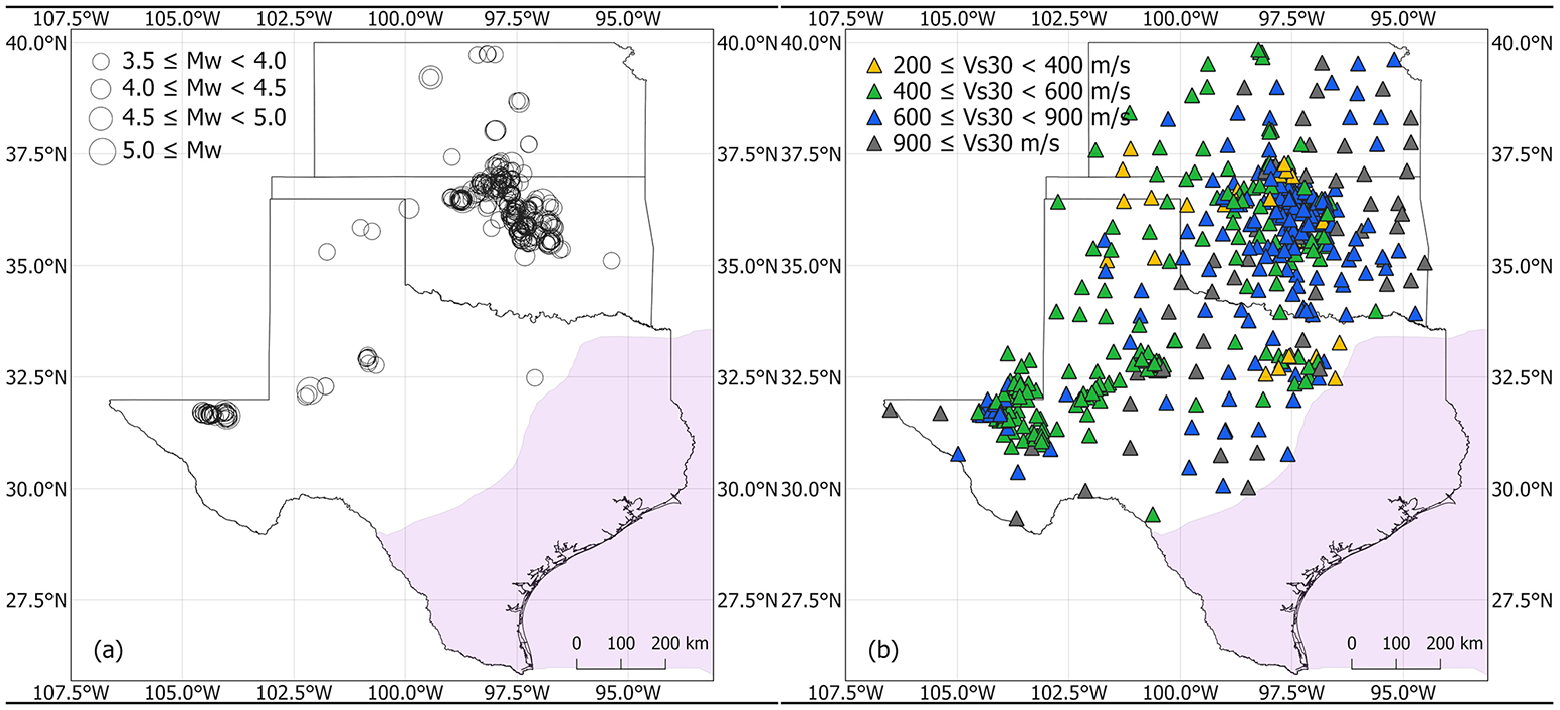
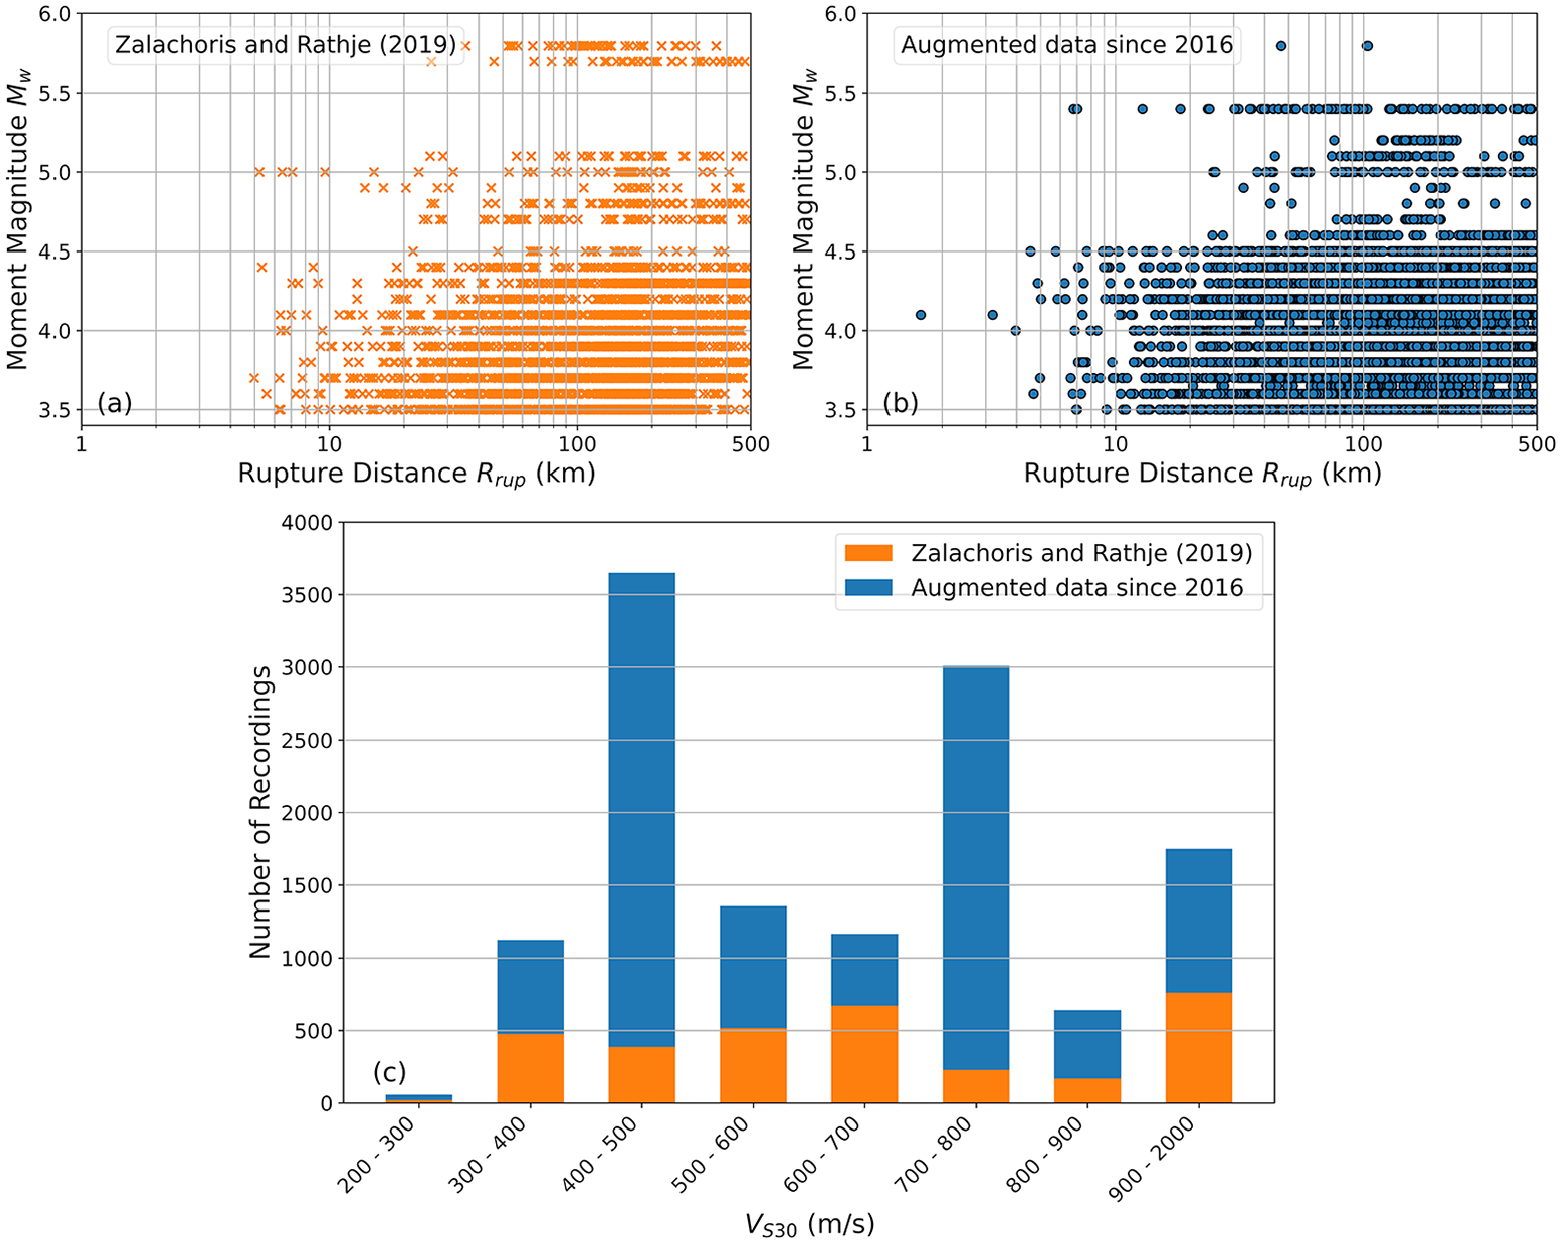
Locations of the earthquake events and seismic recording stations, as well as the of the stations, are shown in Figure 3. As noted earlier, no events or stations located in the Gulf Coast Plain were considered in this analysis. Most of the events in the data set occurred in Oklahoma and West Texas. The magnitude and distance distributions of the recordings (Figure 4) indicate that the data set spans distances from about 5 to 500 km and is dominated by events with M < 4.5. The augmented data since 2016 (Figure 4b) enhance the distribution of data at distances less than 20 km for magnitudes smaller than 4.5, but the data set remains relatively sparse for recordings with magnitude greater than 4.5 and rupture distances less than 20 km. The distribution of the recordings is shown in Figure 4c. The data set has a significant number of recordings with between 700 and 800 m/s due to the abundance of Paleozoic shale across the region and a significant number of recordings with between 400 and 500 m/s due to the presence of stiff Quaternary sediments that are characteristic of the TOK region outside of the Gulf Coast Plain (Li et al., 2022).
(a) Location of earthquake events in the analyzed TOK data set and (b) location of seismic recording stations that recorded data in the data set. Purple shading represents Gulf Coast Plain as defined by Coleman and Cahan (2012).
Moment magnitude versus rupture distance for ground motions used in this study: (a) Data from 2005–2016 included by Zalachoris and Rathje (2019), (b) augmented data from after 2016, and (c) distribution of recorded ground motions.
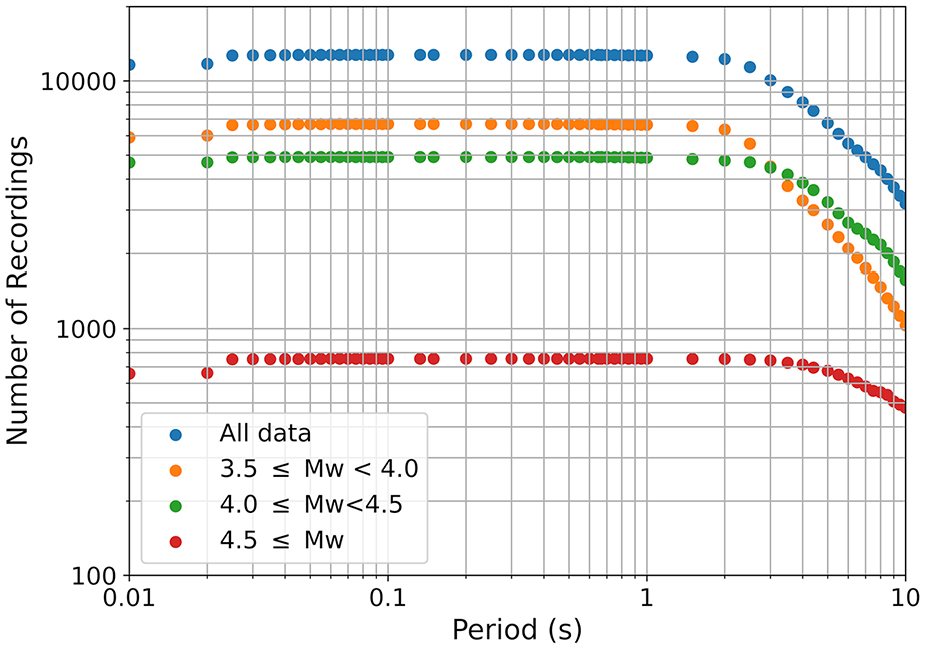
The number of records available for analysis as a function of period is shown in Figure 5. For all ranges of magnitudes, the number of records decreases at long periods due to the presence of long-period noise in the seismic recordings that was removed during record processing. This effect is most pronounced for the smaller magnitude events (M < 4.0).
Number of recordings for different periods.
GMM development method
The reference empirical approach originally developed by Atkinson (2008), and previously adapted for use in the study region by Zalachoris and Rathje (2019), is implemented in this study to develop a TOK-specific GMM. We used the NGA-East central branch GMM (Goulet et al., 2021a) as the reference GMM and developed regional adjustment factors for average misfit, magnitude distance scaling, and scaling. Because the NGA-East hard rock GMM was developed for tectonic events and, to the extent practical, excluded induced earthquakes (Goulet et al., 2021a), it is not appropriate for use in regions such as TOK that are likely dominated by potentially induced earthquakes (Petersen et al., 2023). Despite this incompatibility, the NGA-East model is used throughout CENA in the National Seismic Hazard Model (Moschetti et al., 2024) and hence any regional adjustments to it have practical value. In this spirit, we have considered the NGA-East model as the reference model for this study. The final empirical GMM is established by applying the adjustment factors to the tabulated values of the NGA-East central branch GMM.
To develop the adjustment factors, total residuals are computed for each spectral period as the difference (in natural log space) between the observed ground motion IM and the IM predicted using the NGA-East central branch GMM.
where represents the total residual for the recording at station and event ; and and represent the observed and predicted IMs for a recording, respectively. As shown in Equation 3, the input parameters for the NGA-East central branch GMM include the moment magnitude (M) and rupture distance () but not . Site amplification is not included in the prediction of to facilitate development of an independent site amplification model relative to the NGA-East reference rock condition of = 3000 m/s. Therefore, the reference site condition is hard rock with VS30 = 3000 m/s and associated kappa () of 0.006 s.
A mixed-effects analysis utilizing the smf function in the Python package statsmodels (Seabold and Perktold, 2010) is used to partition the computed total residual into the mean total residual , inter (between)-event residual , and intra (within)-event residual .
The mean total residual quantifies the overall misfit of the NGA-East central branch GMM with respect to the data set, is the event term for each individual earthquake event, and is the remaining residual after the overall misfit and event terms are removed. Adjustment factors for magnitude scaling were derived from the event terms, , while adjustment factors for distance- and -scaling were derived from the intra-event residuals, .
The overall TOK-specific adjustment factor to the NGA-East central branch GMM can be expressed as:
where represents the overall adjustment factor and includes elements related to overall mean misfit (), magnitude scaling (), distance scaling (), and scaling ().
The iterative procedure utilized by Zalachoris and Rathje (2019) is adopted to develop the adjustment factors using least squares regression to capture relevant trends in the residuals. The procedure is implemented as follows:
The magnitude adjustment factor was developed based on trends of inter-event residual () with M;
New values of the total residuals were computed using the developed , and mixed-effects analyses were conducted to partition the new total residuals into inter- and intra-event components;
The distance adjustment factor was developed based on trends of intra-event residuals with rupture distance ;
The intra-event residuals were updated using the developed , and these residuals were averaged for each site to compute site terms. The model was developed based on trends of site terms with ;
New values of the total residuals were computed using the developed and models, and steps 1–4 were repeated until the model stabilized (i.e. the coefficients of the models are within 1% of the values obtained from the previous iteration).
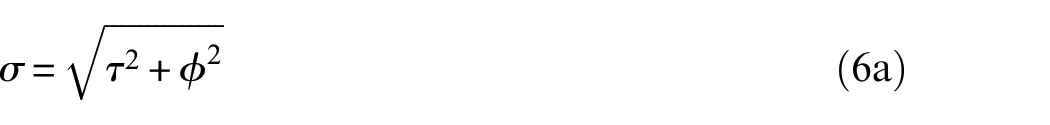
Using this iterative procedure, potential tradeoffs between source, distance, and site effects were minimized. The model typically stabilized after 4–5 iterations. After the final , , and models were obtained, a final mixed-effects analysis was conducted to compute the final , which is the mean total residual after correction for magnitude, distance, and site effects. The final inter- and intra-event residuals were also obtained, which are assumed to be normally distributed with a mean of 0 and standard deviations of (inter-event) and (intra-event), respectively. In addition, the intra-event residuals are further partitioned into site terms and the remaining intra-event, intra-site residuals to compute the site-to-site variability () and single-site variability (). These values are combined to compute the total standard deviation as:
where
One issue with utilizing the NGA-East GMMs in the reference empirical approach is the applicable magnitude range relative to the data set. The NGA-East GMMs are applicable to M = 4.0–8.2, but our data set includes motions from events with M as small as 3.5. Thus, a small magnitude extrapolation was required for the magnitude range between 3.5 and 4.0. For this purpose, we take advantage of the Yenier and Atkinson (2015) (YA15) CENA GMM, which was one of the seed models for the NGA-East project and is applicable down to magnitudes of 3.0. This extrapolation involved magnitude scaling factors that were derived from YA15 ground motion predictions for M < 4.0 and M = 4. These magnitude, distance, and period-dependent scaling factors were applied to the NGA-East central branch GMM predictions for M = 4 to generate predictions for M < 4.0. Additional information on this process can be found by Centella et al. (2023).
GMM adjustment factors for TOK
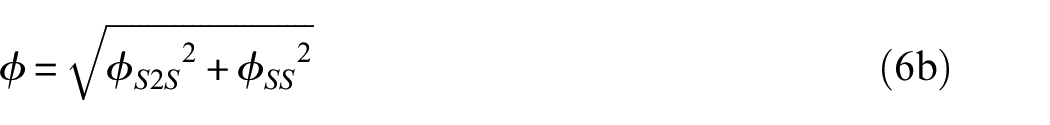
The final mean misfit () as a function of period is shown in Figure 6, and the values represent the average influence of unmodeled source, path, and site effects. These effects are hard to differentiate, but it is important to note that site response was not considered in the residuals calculation (Equation 3 uses the reference rock GMM for = 3000 m/s), and thus, the unmodeled site effect present in represents the average site response effect relative to = 3000 m/s in the database along with the other components. The mean misfit is negative at short periods (i.e. ground motions smaller than predicted by the NGA-East central branch GMM) and positive at long periods (i.e. ground motions larger than predicted by the NGA-East central branch GMM). These values of misfit are similar to those obtained by Ramos-Sepulveda et al. (2024) for their entire CENA data set (Figure 1), which was dominated by TOK motions.
Final mean misfit () as a function of period.
Magnitude adjustment
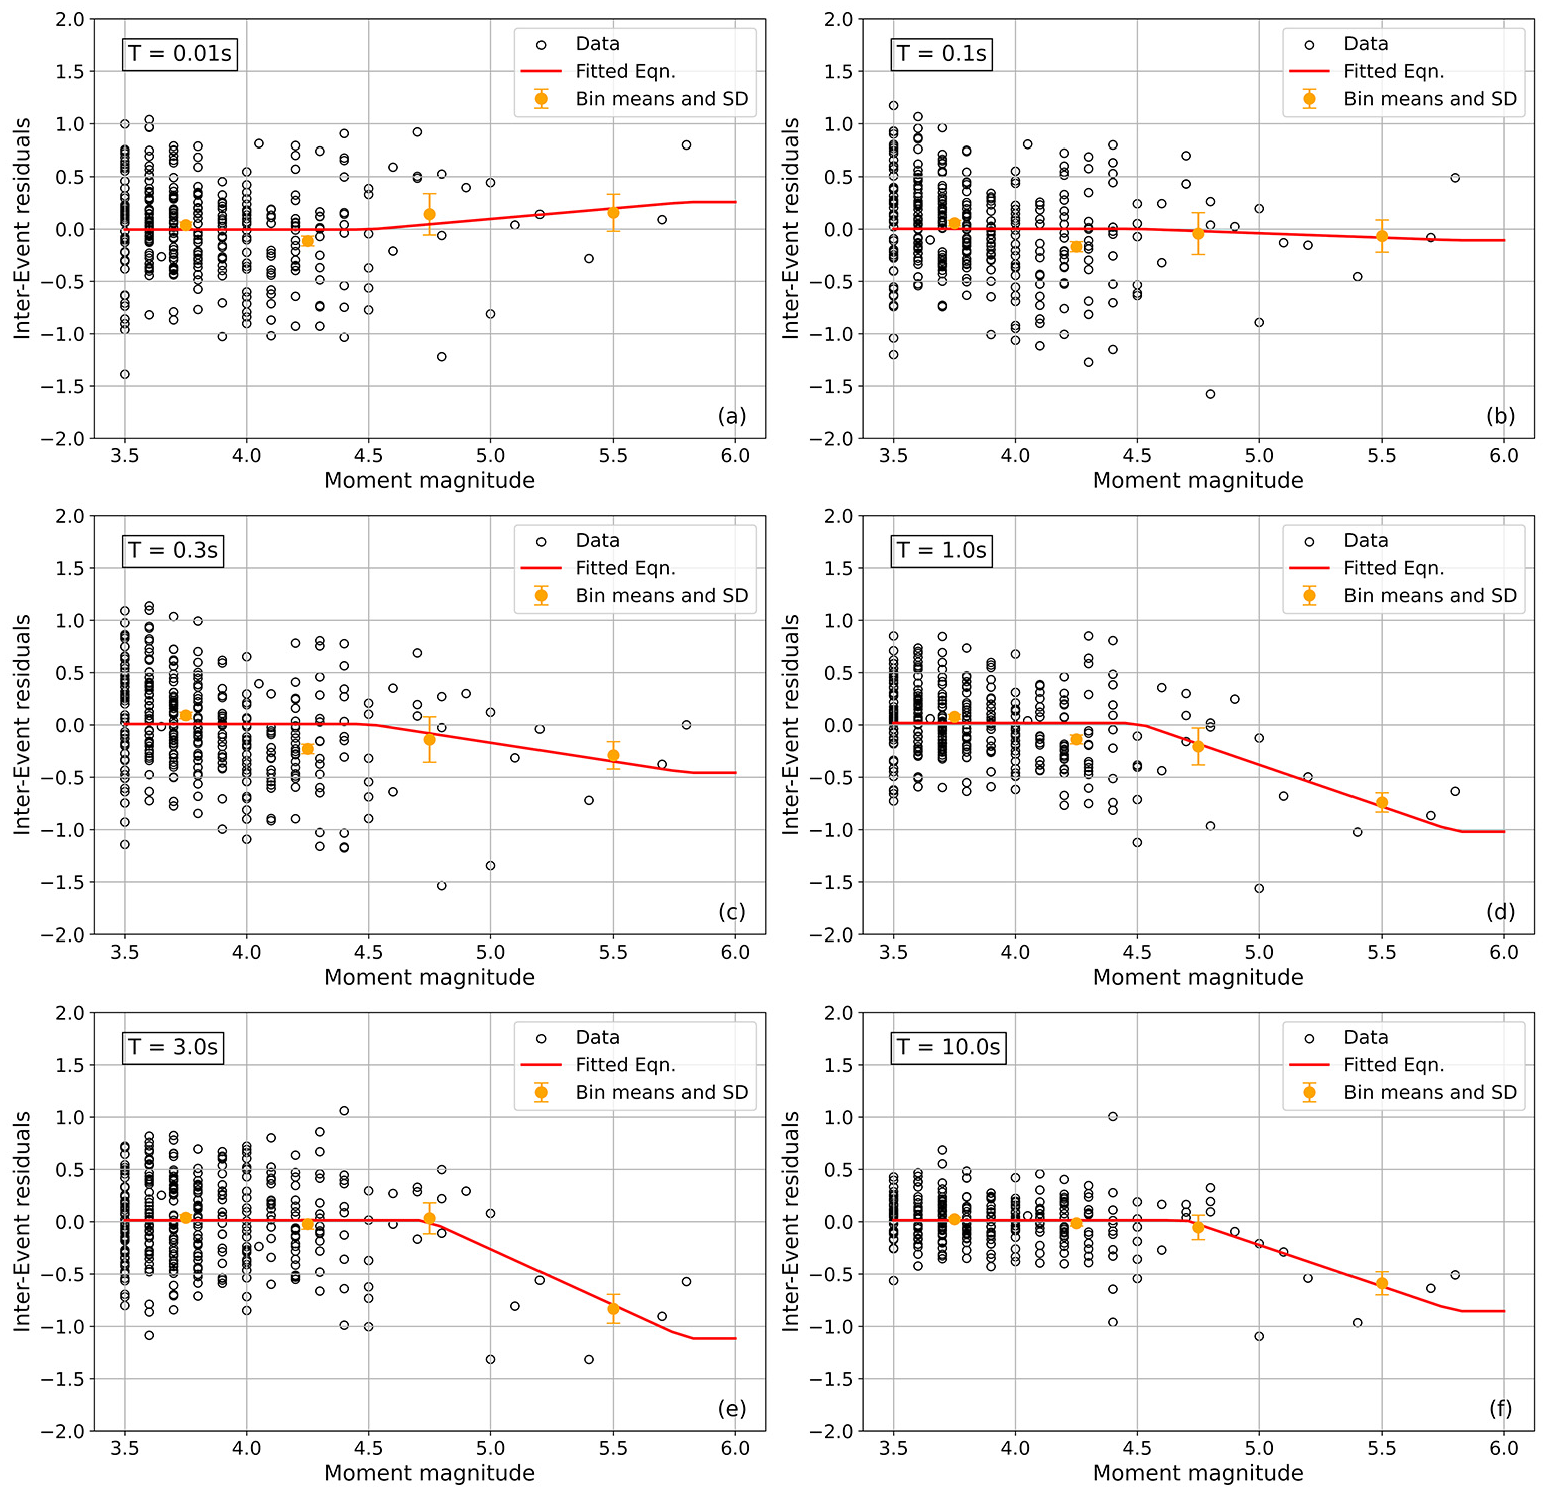
Event terms are plotted against M for selected spectral periods in Figure 7 to evaluate regional differences in magnitude scaling relative to the reference model. Significant data exist at smaller M but the data are sparse at M > 5.0, making the adjustment at large M more uncertain.
Inter-event residual () vs moment magnitude, along with binned means, standard deviations, and developed magnitude adjustment factor for periods: (a) 0.01s; (b) 0.1s; (c) 0.3s; (d) 1.0s; (e) 3.0s; and (f) 10.0s.
For shorter periods (T < 0.05 s), the event terms show a slight positive bias at larger magnitudes, but for longer periods, the event terms show a more significant negative bias. For periods between 0.05 and 0.1 s, the event terms remain unbiased at all magnitudes. The magnitude at which the event terms become biased is slightly different for each period. Although they used a different CENA GMM as the reference model, Zalachoris and Rathje (2019) also identified similar trends with magnitude. We also investigated a depth dependence for the inter-event residuals but no relationship was observed.
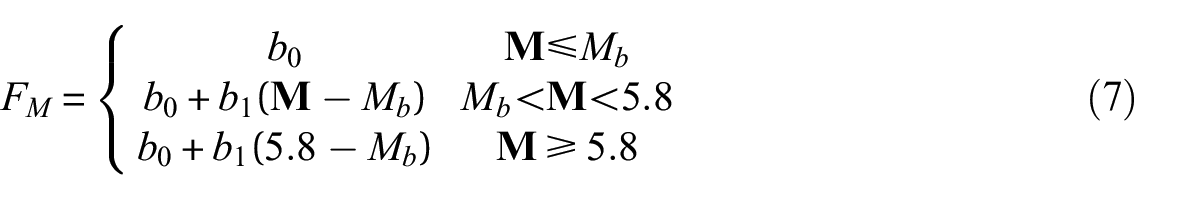
We adapt the linear hinge functional form of the magnitude adjustment factor as used by Zalachoris and Rathje (2019):
where , , and are model coefficients. represents the hinge magnitude below which is constant and above which varies linearly with M up to a maximum value of 5.8.
The regression process is conducted such that a range of hinge magnitudes are specified, the values of and are obtained for each via least squares regression, and the combination of , , and with the smallest mean squared error is selected. The final function for different periods is shown in Figure 7. For M > 5.8 (the maximum magnitude in the data set), is assumed to be constant and equal to the value at M = 5.8, which has the effect of returning the magnitude scaling from the reference model at higher magnitudes.
Distance adjustment
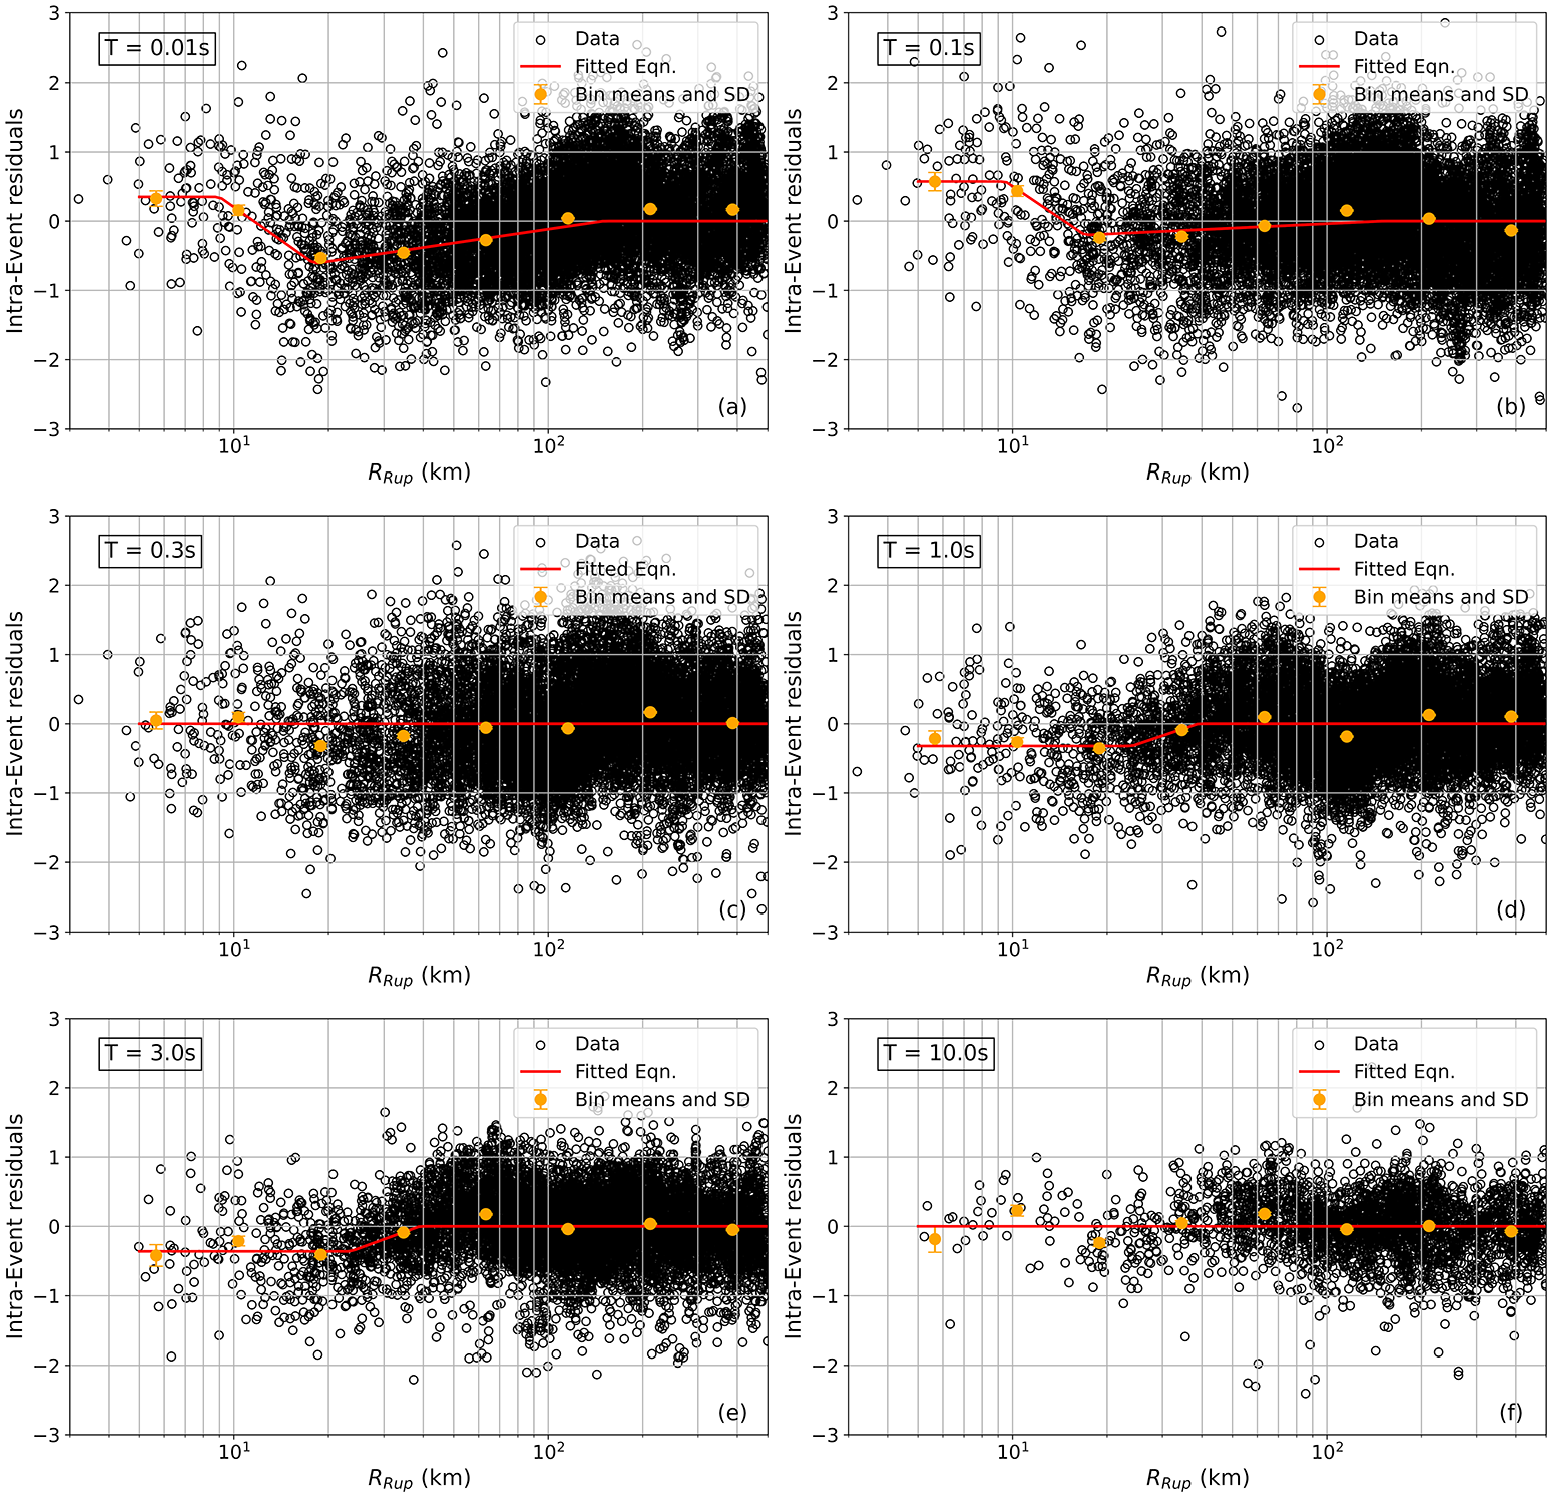
The need for a potential distance adjustment is investigated by plotting the intra-event residual as a function of rupture distance, (Figure 8). Although not shown here for brevity, the data trends shown in Figure 8 are consistent across the magnitude range of the data set.
Intra-event residuals () vs rupture distance, along with binned means, standard deviations, and developed distance adjustment factor for periods: (a) 0.01s; (b) 0.1s; (c) 0.3s; (d) 1.0s; (e) 3.0s; and (f) 10.0s.
For T < 0.25 s, Figure 8 shows that intra-event residuals become more positive with decreasing for < ∼10 km, indicating larger ground motions than predicted by the NGA-East central branch GMM. Similar positive residuals at short periods (T = 0.05–1.0 s) were observed by Zalachoris and Rathje (2019). One notable trend for the T = 0.01–0.2 s data is the systematically negative residuals between = 20–60 km. This trend is modeled in the distance adjustment to avoid overprediction in this distance range at shorter periods. For middle periods (T = 0.2–0.75 s), the residuals at shorter distances become zero; at longer periods between T = 0.75–3.0 s, a negative bias is observed for smaller . This negative bias becomes insignificant at periods T > 3.0 s.
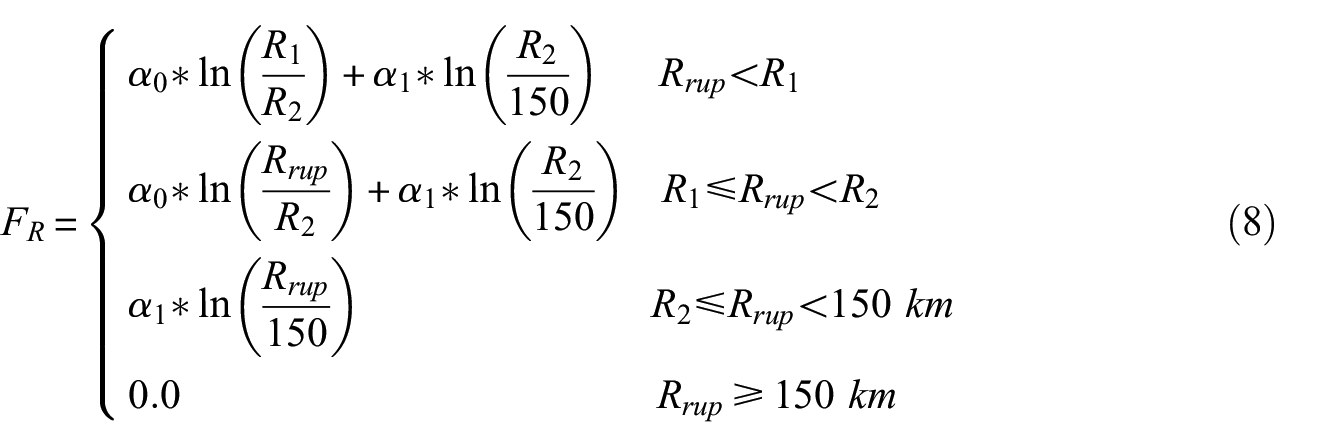
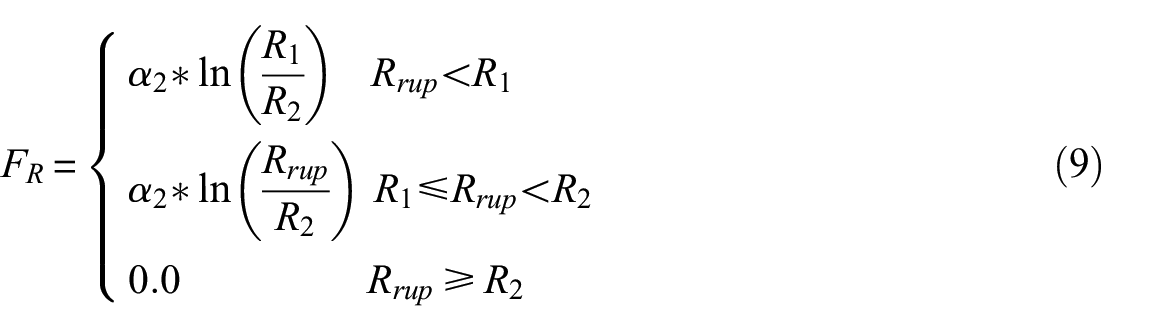
For T = 0.01–0.5 s, we use a four-segment piecewise linear model as shown by Equation 8 to fit the distance adjustment factor and for T = 0.75–10.0 s we use a three-segment piecewise linear model to fit , as shown in Equation 9:
where , , , , and are model coefficients. The parameter is the first hinge distance below which is constant, and is a second hinge distance. For the four-segment linear model, represents the slope for between and , represents the slope for between and 150 km, and no adjustment is applied at . For the three-segment linear model, represents the slope for as a function of between and and no adjustment is applied at . With no distance-dependence for larger distances, the TOK GMM effectively returns to the reference model distance scaling term. To obtain the values of the coefficients, the range of hinge distances and are specified, a least squares regression is conducted to obtain , , or for each and combination, and the selected parameters are those that produce the smallest mean squared error. The developed relationships are plotted in Figure 8.
Site adjustment
The site adjustment addressed in this section is only relative to = 760 m/s, while the remaining amplification of = 760 m/s relative to VS30 = 3000 m/s is part of the constant term . To develop the site adjustment, the distance adjustment is subtracted from the updated intra-event residuals (). The resulting intra-event residuals are partitioned into site terms () and the remaining within-event, within-site residual ().
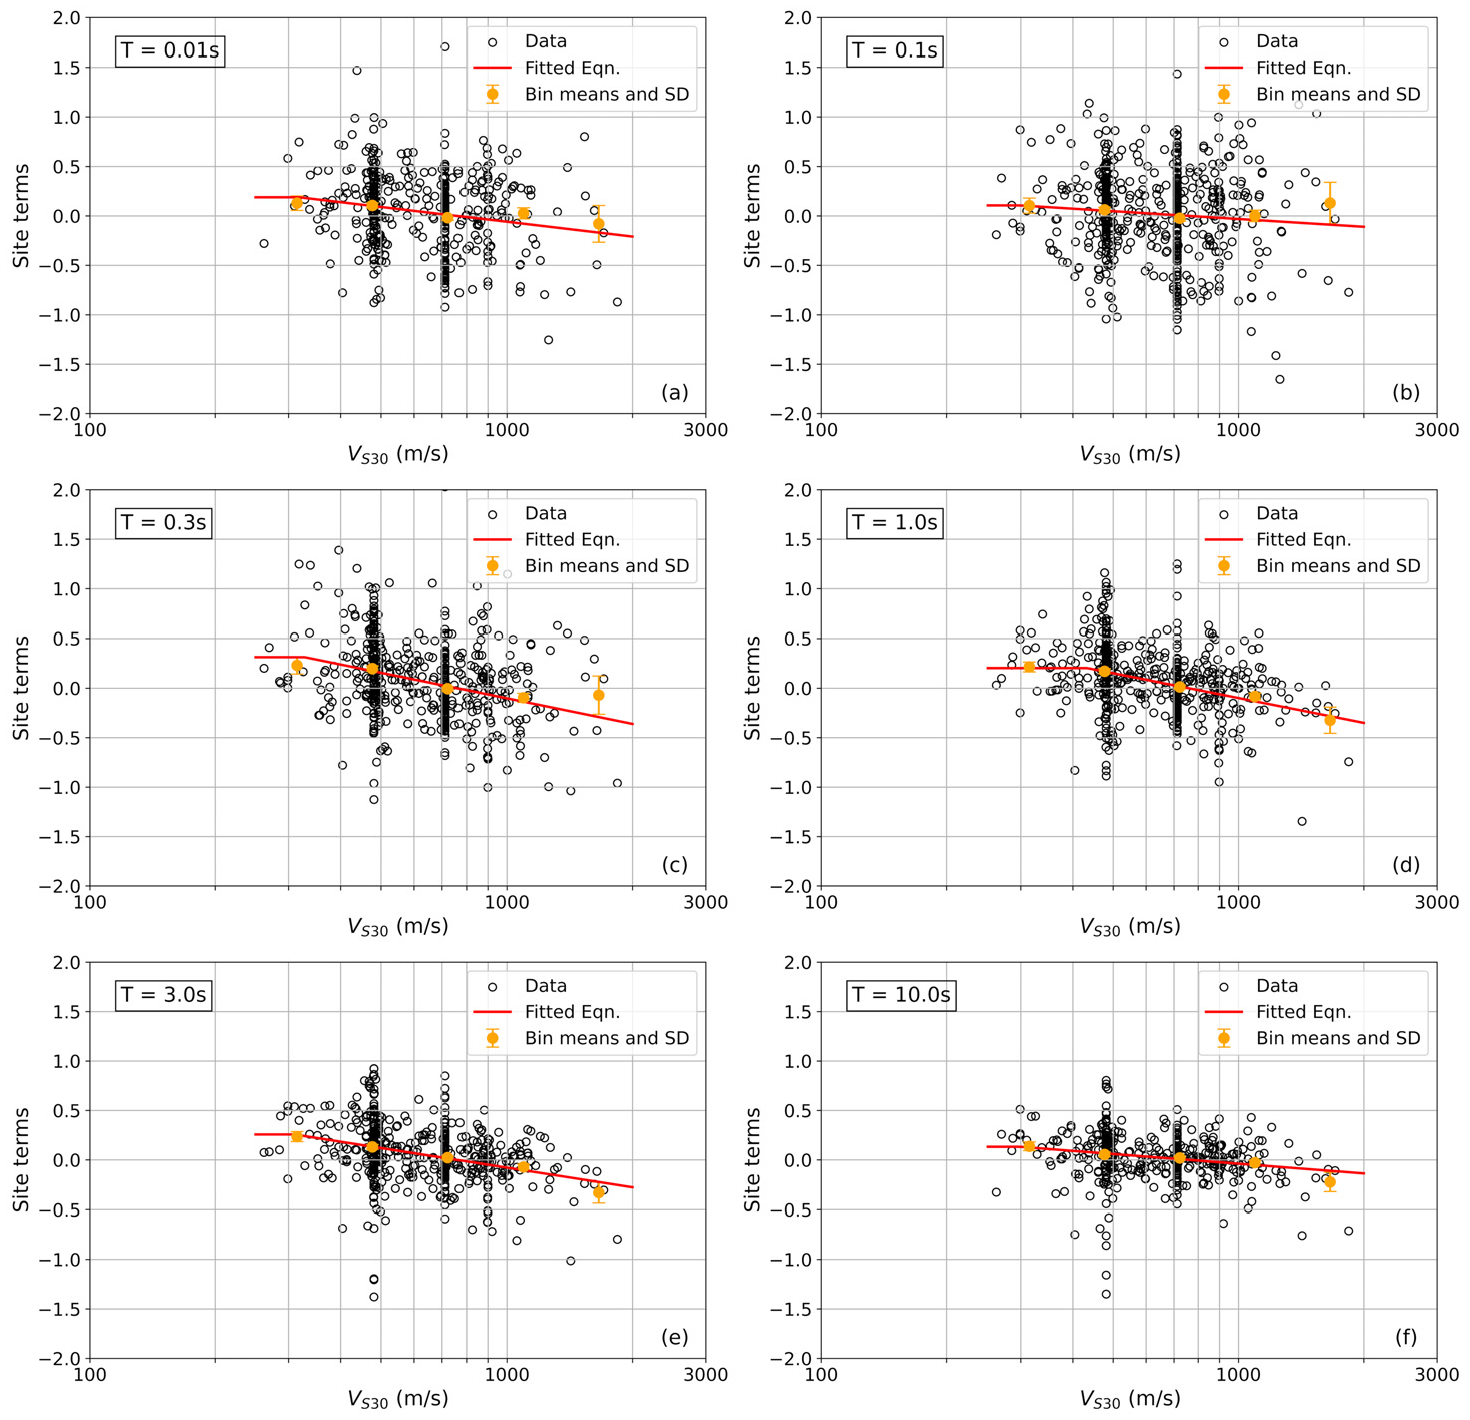
The site terms are plotted against in Figure 9. In general, the site terms decrease with increasing for all periods, but the slope of the relationship is relatively flat. Parker et al. (2019) and Zalachoris and Rathje (2019) also observed that site amplification in CENA is relatively flat, with scaling relatively weak compared with site amplification effects in active tectonic regions. These results suggest that the predictive power of may not be as significant for sites in CENA as it is in active regions.
Site terms vs , along with binned means, standard deviations, and developed site amplification adjustment for periods: (a) 0.01s; (b) 0.1s; (c) 0.3s; (d) 1.0s; (e) 3.0s; and (f) 10.0s.
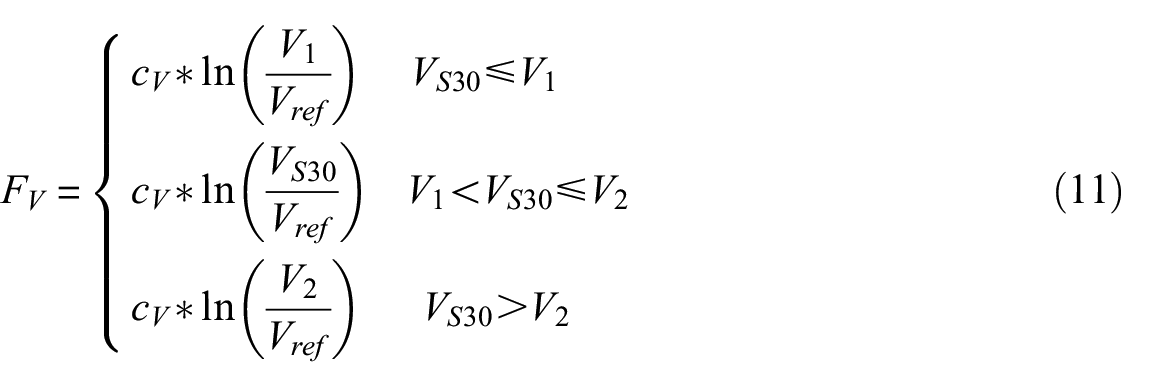
We utilize the same piecewise linear functional form used by Parker et al. (2019) to define the site amplification factor :
where , , , and are model coefficients. is the reference velocity at which and is constrained to be 760 m/s by shifting the intra-event residual with a constant, is the below which is constant, is the above which is constant, and is the slope of for . Similar to Parker et al. (2019), the value of is set to be 2000 m/s because the data set does not have recordings with 2000 m/s. The other coefficients are obtained by specifying a range of values between 280 and 500 m/s, computing by least squares regression for each , and selecting the combination of and that results in the smallest mean squared error. The developed relationships are shown in Figure 9.
Combined adjustments
The coefficients for the , , and models are smoothed across periods utilizing a triangular window. The final model coefficients and different components of the standard deviation (i.e. , , , and ) are provided in Table S1 as Online Supplemental Material of this article. The total standard deviation () is about 0.75 to 0.82 (in natural log units) at periods shorter than 0.5 s and decreases to about 0.52 at 10 s. These values are in general agreement with the composite total ergodic standard deviation provided by Goulet et al. (2021a) for M between 4 and 5.
The updated GMM for TOK () is established by adjusting the IM prediction from the NGA-East central branch GMM () using the overall adjustment factor:
Note that Equation 12 does not require the CENA-specific site amplification because the site factors are implicitly contained within the and terms. This is discussed further in the next section.
Discussion
Interpretations of and
As noted earlier, the residuals developed in this study are computed relative to the NGA-East reference hard rock site condition of = 3000 m/s and = 0.006 s, and these residuals are used to develop adjustments , , and . As such, the factors not only represent misfit in the TOK data relative to the NGA-East central branch GMM, but they also include any site amplification not captured by the developed site amplification factor (i.e. also represents ).
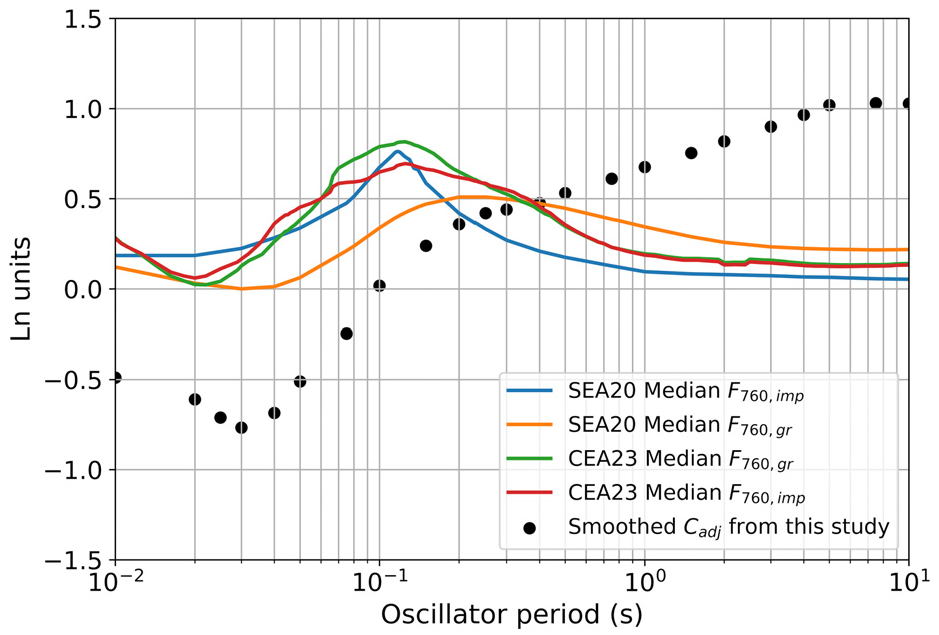
The period-dependent values are shown in Figure 10 along with the simulation-based models provided by Stewart et al. (2020) and Centella et al. (2023) for impedance () and gradient () conditions. For T < 0.1 s, the values show a generally similar shape as the models, where the values reach a minimum at T = 0.02 to 0.03 s. However, the minimum value of = −0.8 is significantly smaller than the minimum ∼0.0, with the values of indicating smaller ground motions at these shorter periods than predicted by the NGA-East GMM. At longer periods, the factors are positive, with approximately +0.5 between T = 0.15 and 0.5 s and increasing to approximately +1.0 at T > 3.0 s. Whereas the models decrease toward zero at long periods, which is consistent with 1D site response in which amplification trends toward 1.0 at periods much longer than the fundamental site period, continues to increase up to 5 s and shows no reductions to 10 s. This suggests that factors other than site response control , especially at long periods.
The large negative values in the short-period range suggest that the spectral shape associated with s for the reference hard rock condition is not consistent with the TOK data. If a higher value of was used in the development of the NGA-East median GMMs for hard rock conditions, the short-period ordinates of the response spectrum would be smaller, and the residuals at short periods would increase (become closer to zero), as suggested previously by Ktenidou and Abrahamson (2016).
The reasons for the large values of at long periods are less clear. It may be caused by the assumed site amplification used in the NGA-East GMM development, as suggested by Ramos-Sepulveda et al. (2024), but the values of at long periods are too large to be solely attributed to the difference in site amplification. Frankel (PEER, 2015) observed that simulated PSA values for T > 2 s depend on the depth of rupture, with smaller rupture depths generating larger PSA potentially due to larger surface wave amplitudes caused by a shallower source. Because earthquakes in TOK generally are shallower than the broader CENA (Zalachoris and Rathje, 2019), this effect may explain the regionally larger PSA values at longer periods in TOK.
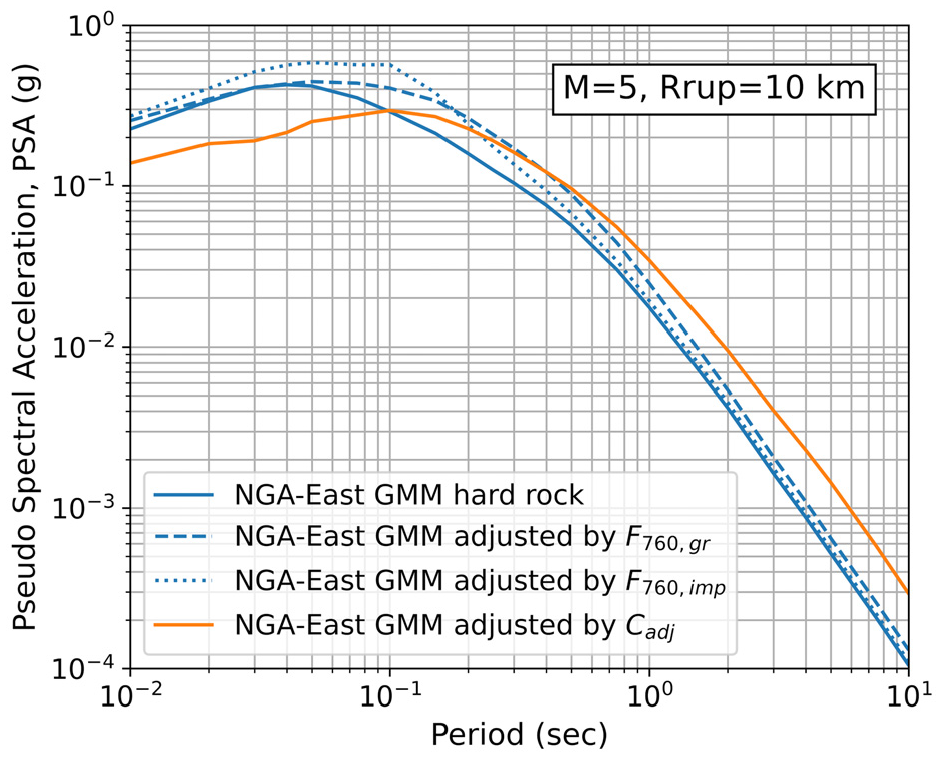
To investigate how and the models influence spectral shape, Figure 11 plots response spectra for a = 5.0 event at = 10 km for the NGA-East reference condition of = 3000 m/s modified by the different and adjustments. Please note that to highlight the influence of , the parameters , and are set to 0 for the PSA calculation. In Figure 11, the spectrum for the NGA-E reference condition peaks at a period of about T = 0.04 s, and after applying the two Stewart et al. (2020) models, the response spectra peak at slightly longer periods (T = 0.05 and 0.07 s). The adjustments are largest between T = 0.1–0.5 s (Figure 10), and thus, the spectral accelerations are amplified the most in this period range. When the factors from this study are applied to the NGA-East reference condition, the spectral shape changes more noticeably with a flattening of the spectrum at T < 0.03 s and the peak shifting to T = 0.1 to 0.15 s. This spectral shape is more consistent with a larger . Boore and Campbell (2017) suggested that ground motions at sites with = 760 m/s in CENA can be represented by between 0.01 and 0.03 s, which indicates that the factors at short periods may represent some effects associated with . At long periods, the models do not significantly change the NGA-East response spectrum, but the large factors from this study result in a significant increase in the spectral acceleration.
Predicted pseudo acceleration response spectra for M = 5 at = 10 km from the NGA-E weighted median GMM for the reference condition (VS30 = 3000 m/s) adjusted using the Stewart et al. (2020) gradient and impedance models and the from this study.
Comparisons of model with other CENA models
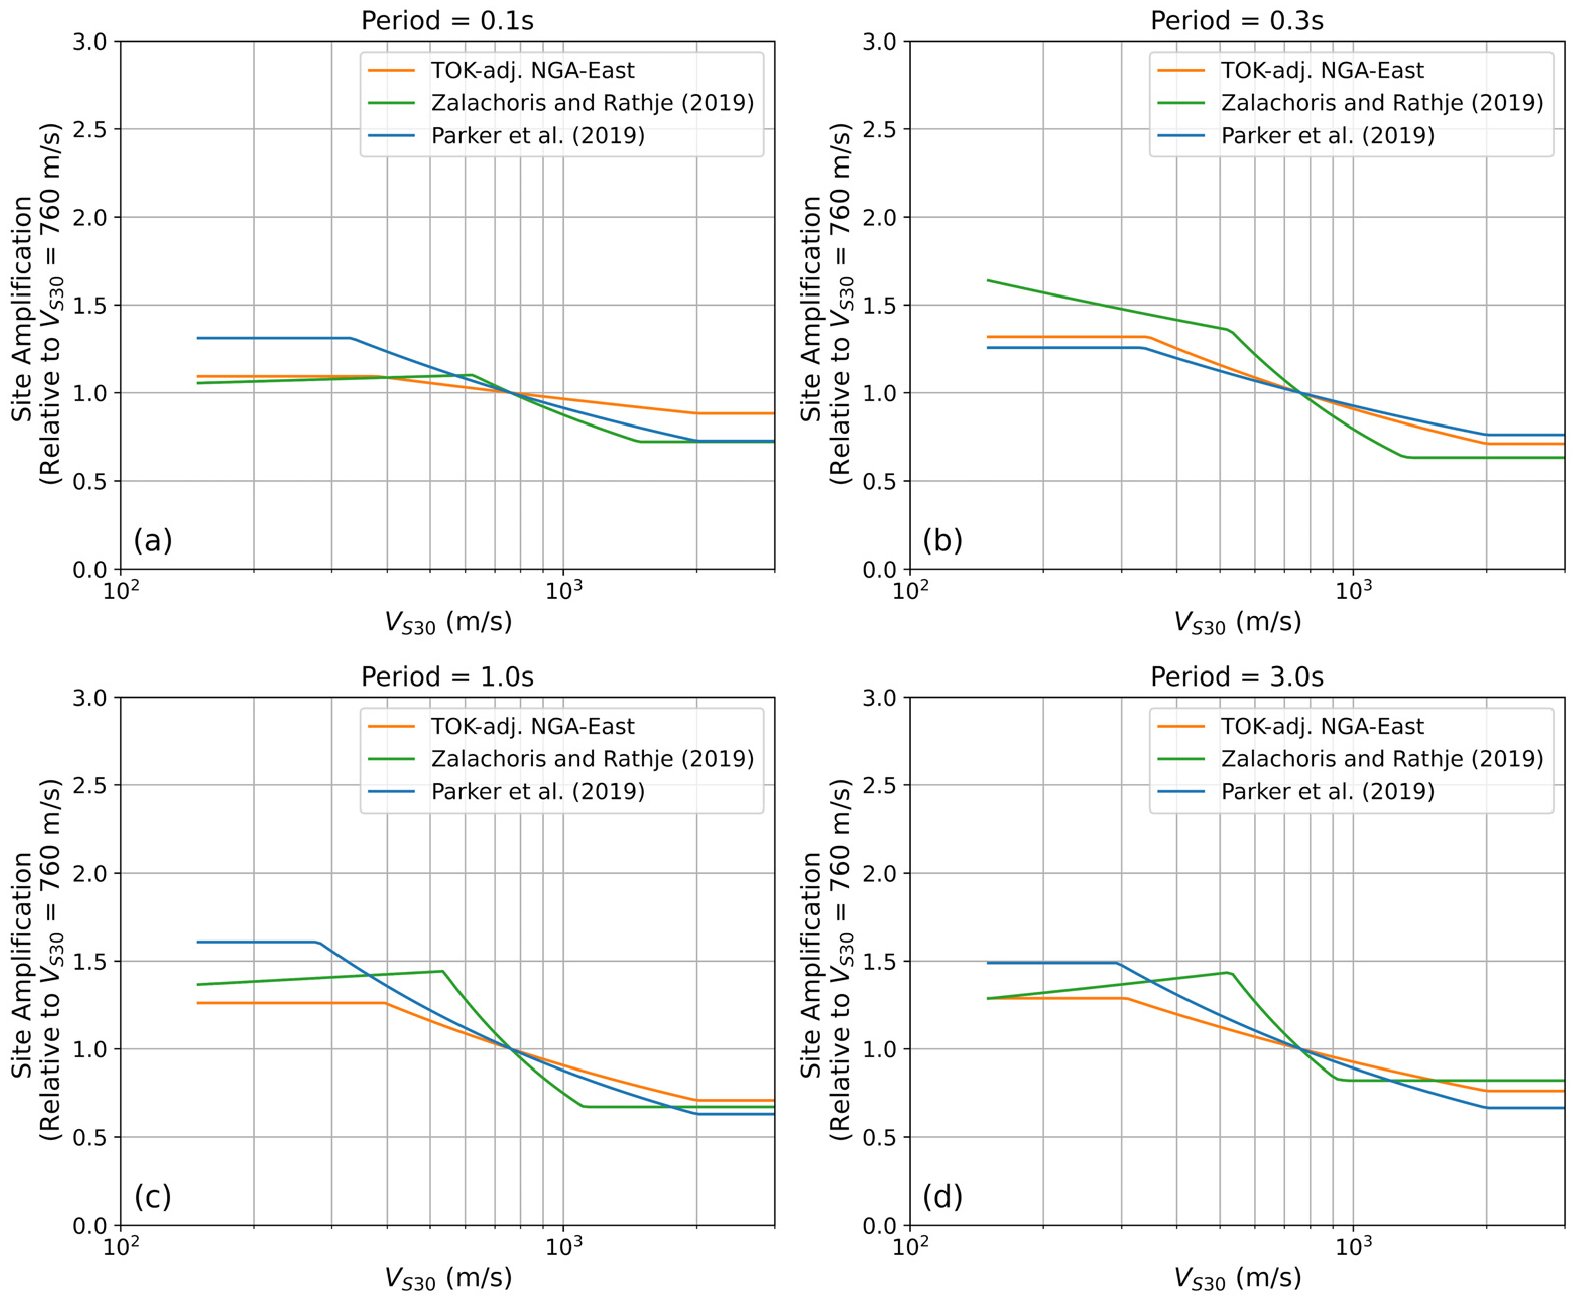
The component of the site amplification model derived from this study is compared with the site amplification models of Zalachoris and Rathje (2019) and Parker et al. (2019) in Figure 12. The model developed in this study compares favorably to Parker et al. (2019) for most periods, but with weaker scaling at some periods. Also, the below which amplification becomes constant is larger in this study for some periods. It is possible that the scaling for softer sites is not captured well by the TOK data set because of the paucity of data with < 300 m/s. The site amplification represented by the Zalachoris and Rathje (2019) model indicates slightly steeper slopes than the other two models, likely because the Zalachoris and Rathje (2019) model was derived as an adjustment to the site amplification model of Boore et al. (2014), which is for active tectonic regions and is characterized by a stronger effect. Nonetheless, the overall site amplification levels suggested by the three models are similar.
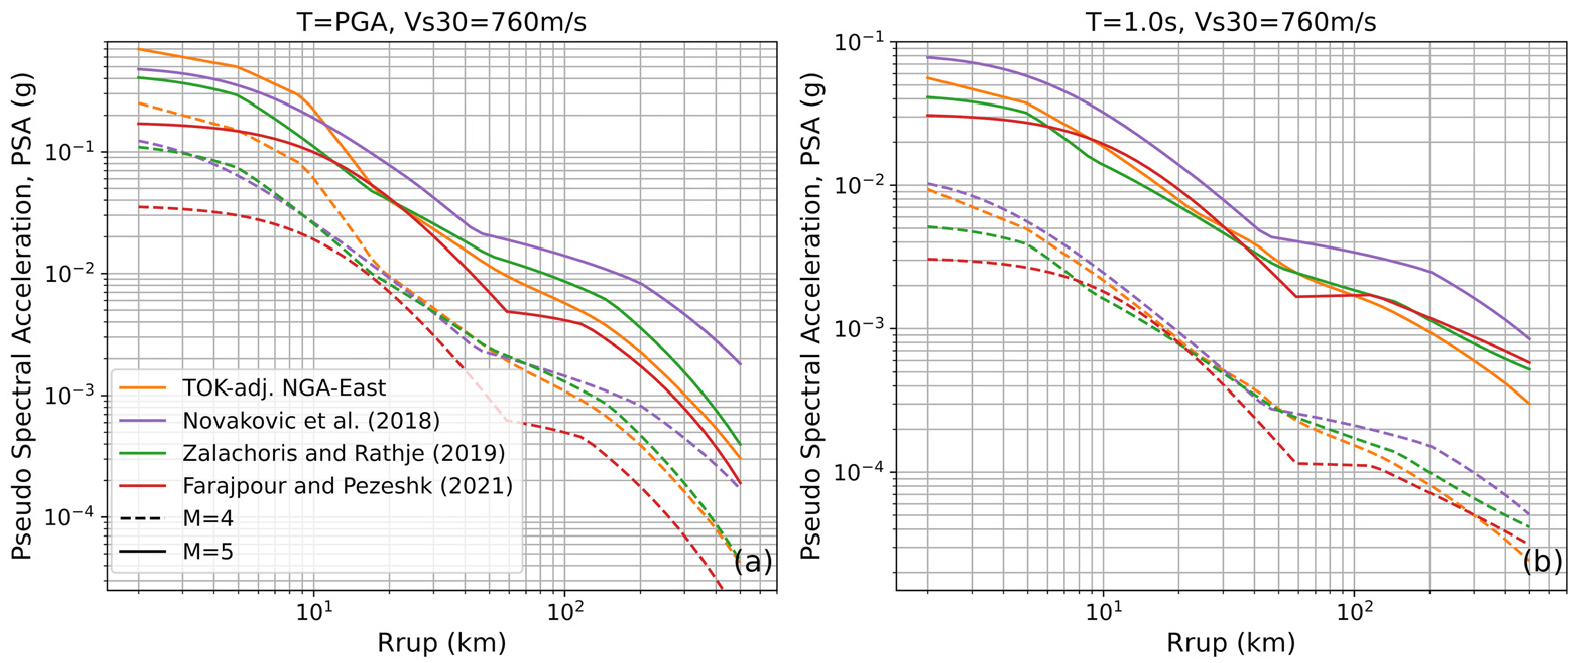
We compare ground motions predicted by the TOK GMM developed in this study with predictions from other GMMs for potentially induced earthquakes in CENA, specifically Novakovic et al. (2018), Zalachoris and Rathje (2019), and Farajpour and Pezeshk (2021). Novakovic et al. (2018) was developed using data in Oklahoma, while Farajpour and Pezeshk (2021) was developed using potentially induced earthquakes across all of CENA, predominantly from Oklahoma, Colorado/New Mexico, and Texas. Figure 13 shows predicted PGA and PSA at T = 1.0 s as a function of distance for M = 4.0 and 5.0. The TOK adjustment of the NGA-East model retains the characteristic CENA distance scaling with a flattening of the attenuation in the middle-distance range (∼40–100 km), which is a characteristic also shared by the other models, although the strength of this effect and the associated distance range is different for each model. In addition, there is weaker saturation at short distances for the models from this study and from Zalachoris and Rathje (2019) due to the adjustments derived from the positive distance residuals observed at short distances. There are considerable differences in the different GMMs at PGA, but the four models are more similar at T = 1.0 s.
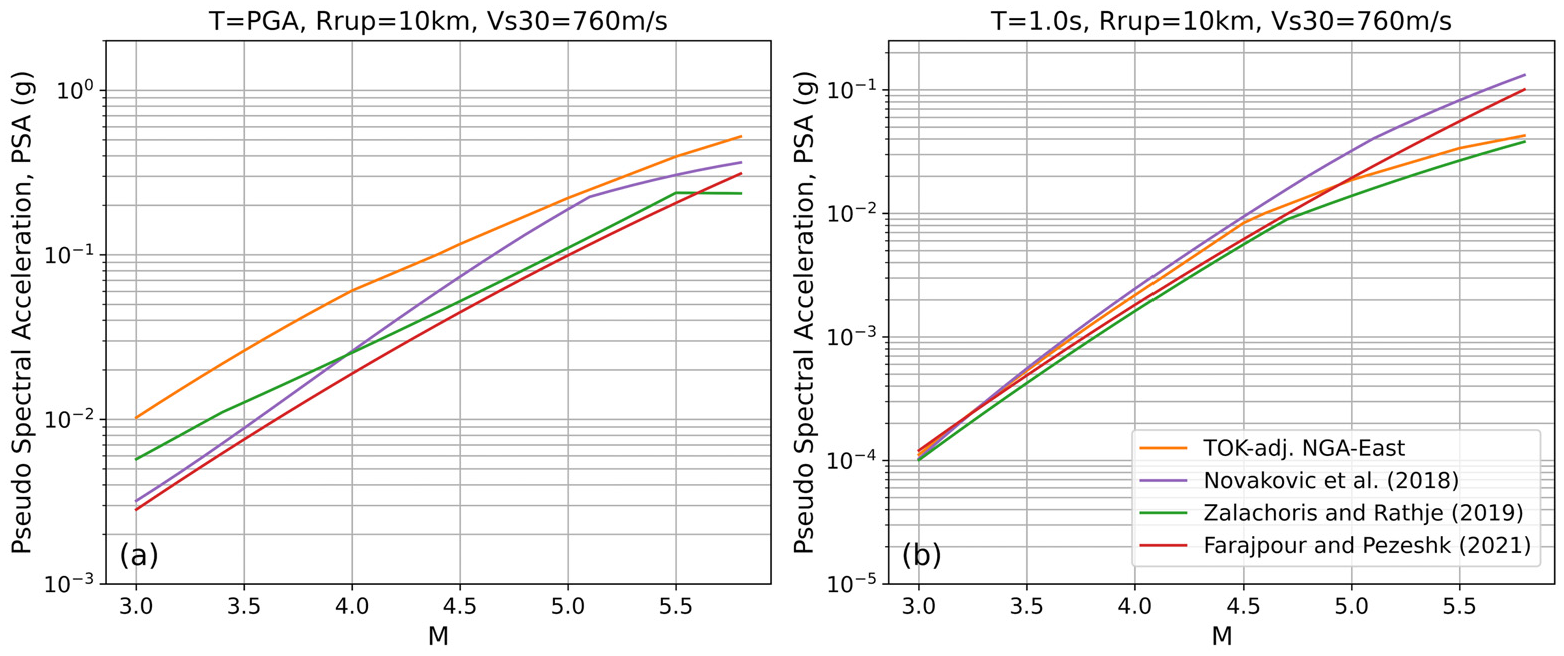
Figure 14 illustrates the magnitude scaling as predicted by the four GMMs for PGA and T = 1.0 s. At both periods, despite differences in the amplitude of the predictions across the GMMs, the slopes of the magnitude scaling are similar. However, at T = 1.0 s, the Zalachoris and Rathje (2019) model and the model from this study display at flatter slope at M > 4.5, which is due to the magnitude adjustment derived from the negative residuals at larger magnitude.
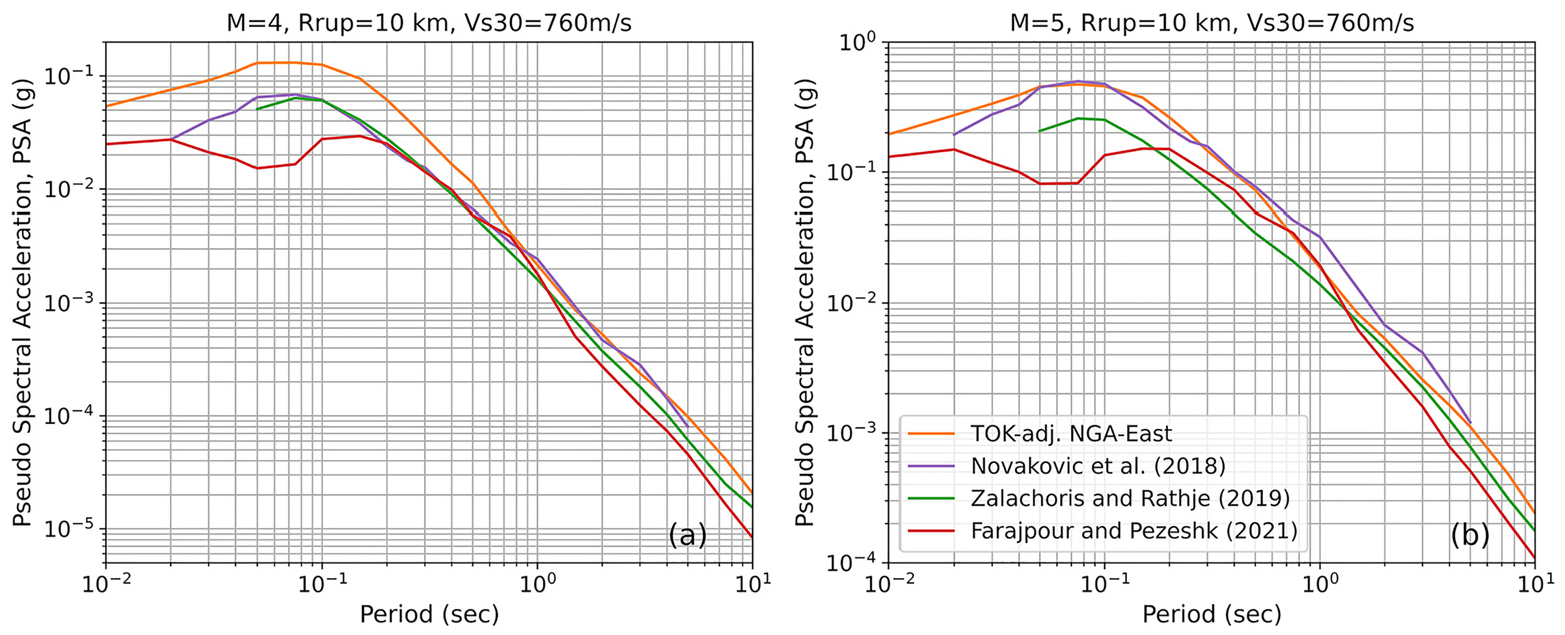
Finally, we plot the response spectra predicted by these four GMMs for M = 4.0 and 5.0, Rrup = 10 km, and = 760 m/s (Figure 15). Note that the available period range is 0.02 to 5 s for Novakovic et al. (2018) and it is 0.05 to 10 s for Zalachoris and Rathje (2019). At M = 4.0, the response spectrum from this study is very similar to Novakovic et al. (2018) at T > 1.0 s, but demonstrates larger spectral accelerations than the other three GMMs at shorter periods. At M = 5.0, the response spectrum from this study agrees with Novakovic et al. (2018) at shorter periods and agrees with all of the three GMMs at longer periods (T > 1.0 s).
Seismic hazard analyses consider earthquakes up to a specified maximum magnitude for a region, and for TOK, this maximum magnitude will likely be larger than the maximum observed magnitude of 5.8. Given that the empirical magnitude adjustment in this study is constrained by data only up to M = 5.8, extrapolation will be necessary when applying the TOK adjustment beyond this range. There is no accepted approach to this extrapolation, and thus, we propose two options that likely encompass the epistemic uncertainty associated with the extrapolation.
One option is to maintain constant for M > 5.8, as defined in Equation 7. This approach assumes that the adjustments and at M = 5.8 are also applicable to larger magnitudes. As a result, this approach maintains the magnitude scaling of the NGA-East central branch GMM for magnitudes exceeding 5.8, although the amplitude of shaking is shifted from the NGA-East central branch GMM.
An alternative option is to assume no TOK magnitude adjustment is needed for M > 5.8, and thus, the unadjusted NGA-East central branch GMM is used to compute ground motions. This option assumes that the larger source dimensions associated with larger magnitude events will penetrate deeper into the crust, and that this deeper extent of rupture will generate motions more similar to crustal events than the induced events that dominate the TOK data set. However, to avoid an abrupt change in ground shaking, tapering from the TOK-adjusted NGA-East central branch GMM to unadjusted GMM will be required.
Based on judgment of the analyst, either of these options may be selected or a combination of both can be employed within a logic tree framework to account for the epistemic uncertainty associated with extrapolating the model to magnitudes beyond the available data range.
Conclusion
To develop a regional adjustment to the NGA-East central branch GMM, we created a database of ground motion recordings in TOK for natural and potentially induced earthquakes and used these data to develop a TOK regional adjustment. The reference empirical approach is utilized in which residuals between the observed data and the NGA-East central branch GMM are used to develop adjustment factors for the overall misfit, magnitude distance scaling, and site amplification. The GMM adjustments are derived for spectral periods between 0.01 and 10 s, as well as for PGA and PGV, and the GMM is applicable to M from 3.5 to 5.8 and rupture distances up to 500 km, as represented by the data set.
The overall misfit () developed in this study is interpreted to represent both overall differences in the TOK data relative to the NGA-East central branch GMM as well as differences in the site amplification relative to m/s (i.e. ). The negative values of at short periods (<0.1 s) can be partially explained by the effects associated with the TOK data representing a larger than the NGA-East reference condition of = 0.006 s. The empirically derived values are more negative than the simulation-based values over this period range, but the models did not explicitly consider changes in during their development. The values are positive at periods larger than 0.1 s and increase with increasing period, reaching at value of +1.0 at T = 10 s. The long period values are much larger than the simulation-based values, and the source of these large values of is not fully understood. An important effect of the adjustment factor is a change in spectral shape, with the peak of the NGA-East response spectrum shifting from T = 0.04 s to T = 0.1–0.15 s and a flattening at T < 0.03 s.
The distance adjustments () incorporate changes in the short- and mid-distance scaling, and the magnitude adjustment () generally reduces the long-period response spectral values at magnitudes greater than about 4.5. However, the combined effects at long periods of the negative values for larger M and the positive results in relatively modest magnitude adjustments compared with other GMM for TOK. The site amplification model derived in this study for TOK shows weaker scaling than models derived for active tectonic regions, which is consistent with other GMMs developed for CENA and TOK.
Supplemental Material
sj-pdf-1-eqs-10.1177_87552930251313817 – Supplemental material for Regional adjustment to the NGA-East GMM for Texas, Oklahoma, and Kansas
Supplemental material, sj-pdf-1-eqs-10.1177_87552930251313817 for Regional adjustment to the NGA-East GMM for Texas, Oklahoma, and Kansas by Meibai Li, Ellen M Rathje, Jonathan P Stewart, Maria E Ramos-Sepulveda and Youssef MA Hashash in Earthquake Spectra
Footnotes
Acknowledgements
This research project is supported by the U.S. Geological Survey External Research Program (contract number: G21AP10367). This support is appreciated. The authors acknowledge the helpful interactions with Eric M. Thompson, Grace Parker, Scott J. Brandenberg, Okan Ilhan, Dylan Centella Raef, Morgan P. Moschetti, Oliver Boyd, Alexandros Savvaidis, Dino Huang, Mike Hearne, Victor Contreras, and Tristan Buckreis. The authors thank the reviewers, Shahram Pezeshk and Emel Seyhan, for their insightful comments, which have helped improve this paper.
Declaration of conflicting interests
The author(s) declared no potential conflicts of interest with respect to the research, authorship, and/or publication of this article.
Funding
The author(s) disclosed receipt of the following financial support for the research, authorship, and/or publication of this article: The author(s) gratefully acknowledge the support of the U.S. Geological Survey External Research Program under contract number G21AP10367 for this research.
ORCID iDs
Meibai Li
Jonathan P Stewart
Data and resources
The ground motions in this study are retrieved and available from the Incorporated Research Institutions for Seismology (IRIS) Data Management Center at http://www.iris.edu/hq/. The USGS automated ground motion processing software gmprocess (Hearne et al., 2019) was used to download and process the ground motions. Flatfiles of all ground motions used for analysis in this study are available on DesignSafe (Li et al., 2023). Time series data developed by Zalachoris and Rathje (2019) and Ramos-Sepulveda et al. (2024) are available through Zalachoris et al. (2020) in DesignSafe and a relational ground motion database by , respectively.
Supplemental material
Supplemental material for this article is available online.
References
1.
AkhaniMDavatgari-TafreshiMPezeshkS (2024) Adjusting Central and Eastern United States ground-motion models for use in the coastal plain considering the sediment thickness. Earthquake Spectra40(4): 2669–2691.
2.
AtkinsonG (2008) Ground-motion prediction equations for eastern North America from a referenced empirical approach: Implications for epistemic uncertainty. Bulletin of the Seismological Society of America98: 1304–1318.
3.
BooreDM (2010) Orientation-independent, nongeometric-mean measures of seismic intensity from two horizontal components of motion. Bulletin of the Seismological Society of America100(4): 1830–1835.
4.
BooreDM (2020) Revision of Boore (2018) Ground-motion predictions for central and eastern North America: Path and offset adjustments and extension to 200 m/s <= Vs30 <= 3000 m/s. Seismological Research Letters91: 977–991.
5.
BooreDMCampbellKW (2017) Adjusting central and eastern North America ground-motion intensity measures between sites with different reference-rock site conditions. Bulletin of the Seismological Society of America107: 132–148.
6.
BooreDMStewartJPSeyhanEAtkinsonGM (2014) NGA-West 2 equations for predicting response spectral accelerations for shallow crustal earthquakes. Earthquake Spectra30: 1057–1085.
BuckreisTENwekeCCWangPBrandenbergSJRamos-SepulvedaMEShamsRPretellRMazzoniSZimmaroPStewartJP (2023) Web Portal for the Global Earthquake Ground Motion Relational Database. Los Angeles, CA: The B. John Garrick Institute for the Risk Sciences.
9.
CentellaDLiMRamos-SepulvedaMEIlhanOHashashYMARathjeEMStewartJP (2023) Calibration of NGA-East GMMs and site amplification models against CENA ground motions. U.S. Geological Survey, Report No. G21AP10370, G21AP10368, G21AP10367. Reston, VA: U.S. Geological Survey.
10.
ColemanJLJrCahanSM (2012) Preliminary catalog of the sedimentary basins of the United States. USGS Open-file Report 2012–1111. Reston, VA: U.S. Geological Survey. Available at: http://pubs.usgs.gov/of/2012/1111/ (accessed 1 June 2017).
11.
ContrerasVStewartJPKishidaTDarraghRBChiouBSJMazzoniSYoungsRRKuehnNMAhdiSKWooddellKBoroschekRRojasFOrdenesJ (2022) NGA-Sub source and path database. Earthquake Spectra38: 799–840.
12.
DarraghRBAbrahamsonNASilvaWJGregorN (2015) Development of hard rock ground-motion models for region 2 of central and eastern North America. PEER Report no. 2015/04. Berkeley, CA: Pacific Earthquake Engineering Research Center, University of California, Berkeley.
13.
EPRI (2013) EPRI (2004, 2006) Ground-Motion Model Review Project: Shear Wave Velocity Measurements at Seismic Recording Stations in the Central and Eastern United States. Palo Alto, CA: EPRI.
14.
FarajpourZPezeshkS (2021) A ground-motion prediction model for small-to-moderate induced earthquakes for Central and Eastern United States. Earthquake Spectra37: 1440–1459.
GouletCABozorgniaYKuehnNAtikLAYoungsRRGravesRWAtkinsonGM (2021a) NGA-East ground-motion characterization model part I: Summary of products and model development. Earthquake Spectra37(Suppl. 1): 1231–1282.
17.
GouletCAKishidaTAnchetaTDCramerCHDarraghRBSilvaWJHashashYMAHarmonJHStewartJPWooddellKEYoungsRR (2014) PEER NGA-East database. PEER Report 2014-17. Berkeley, CA: Pacific Earthquake Engineering Research Center, University of California, Berkeley.
HarmonJAHashashYMAStewartJPRathjeEMCampbellKWSilvaWJIlhanO (2019) Site amplification functions for central and eastern North America—Part II: Modular simulation-based models. Earthquake Spectra35: 815–847.
20.
HashashYMAIlhanOHarmonJAParkerGAStewartJPRathjeEMCampbellKWSilvaWJ (2020) Nonlinear site amplification model for ergodic seismic hazard analysis in central and eastern North America. Earthquake Spectra36(1): 69–86.
21.
HashashYMAKottkeARStewartJPCampbellKWKimBMossCNikolaouSRathjeEMSilvaWJ (2014) Reference rock site condition for Central and Eastern North America. Bulletin of the Seismological Society of America104: 684–701.
22.
HassaniBAtkinsonGM (2015) Referenced empirical ground-motion model for eastern North America. Seismological Research Letters86: 477–491.
23.
HassaniBAtkinsonGM (2017) Site-effects model for central and eastern North America based on peak frequency and average shear-wave velocity, Bull. Seismological Society of America108: 338–350.
KishidaTDarraghRBChiouBSJBozorgniaYMazzoniSContrerasVBoroschek Rubén RojasFStewartJP (2020) Ground motions and intensity measures. Chapter 3 PEER Report 2020/02. Berkeley, CA: Pacific Earthquake Engineering Research Center, University of California, Berkeley.
26.
KtenidouOJAbrahamsonNA (2016) Empirical estimation of high-frequency ground motion on hard rock. Seismological Research Letters87(6): 1465–1478.
27.
LiMRamos-SepulvedaMBrandenbergSStewartJRathjeE. (2023) 2023 Texas, Oklahoma, and Kansas dataset for investigating NGA-East GMM and site amplification models. DesignSafe-CI. Available at: https://doi.org/10.17603/ds2-nadf-h758
28.
LiMRathjeEMCoxBRYustM (2022) A Texas-specific map incorporating geology and observations. Earthquake Spectra38(1): 521–542.
29.
MendozaCTurnerJO’ConnellD (2017) Ground Motion characterization and site specific IMASW Vs-depth measurements at CEUS seismic stations: The 2011 Prague, OK earthquake. U.S. Geological Survey Final Technical Report. Available at: https://earthquake.usgs.gov/cfusion/external_grants/reports/G17AP00021.pdf (accessed May 2021)
30.
MoschettiMPAagaardBTAhdiSKAltekruseJBoydOSFrankelADHerrickJPetersonMDPowersPMRezaeianSShumwayAMSmithJAStephensonWJThompsonEMWithersKB (2024) The 2023 US national seismic hazard model: Ground-motion characterization for the conterminous United States. Earthquake Spectra40(2): 1158–1190.
31.
MoschettiMPThompsonEMPowersPMHooverSMMcNamaraDE (2019) Ground motions from induced earthquakes in Oklahoma and Kansas. Seismological Research Letters90(1): 160–170.
32.
NiSLiZSomervilleP (2014) Estimating subsurface shear velocity with radial to vertical ratio of local P waves. Seismological Research Letters85(1): 82–89.
33.
NovakovicMAtkinsonGMAssatouriansK (2018) Empirically calibrated ground-motion prediction equation for Oklahoma. Bulletin of the Seismological Society of America108(5A): 2444–2461.
34.
ParkerGAStewartJPHashashYMARathjeEMCampbellKWSilvaWJ (2019) Empirical linear seismic site amplification in central and eastern North America. Earthquake Spectra35: 849–881.
35.
PEER (2015) NGA-East: Median ground-motion models for the Central and Eastern North America region. PEER Report No. 2015/04. Berkeley, CA: Pacific Earthquake Engineering Research Center, University of California, Berkeley.
36.
PetersenMDShumwayAMPowersPMFieldNMoschettiMPJaiswalKSMilnerKRRezaeianSFrankelALlenosALMichaelAJAltekruseJMAhdiSKWithersKMuellerCZengYChaseRESalditchLMLucoNRukstalesKSHerrickJAGirotDLAagaardBTBenderABlanpiedMLBriggsRWBoydOSClaytonBDuRossCEvansELHaeusslerPJHatemAEHaynieKLHearnEHJohnsonKMKortumZAKwongNSMakdisiAJMasonHBMcNamaraDMcPhillipsDOkuboPPageMTPollitzFRubinsteinJShawBEShenZKShiroBSmithJAStephensonWJThompsonEMThompson JobeJAWirthEWitterRC (2023) The 2023 US 50-state national seismic hazard model: Overview and implications. Earthquake Spectra40(1): 5–88.
37.
PezeshkSZandiehACampbellKWTavakoliB (2018) Ground-motion prediction equations for Central and Eastern North America using the hybrid empirical method and NGA-West2 empirical ground-motion models. Bulletin of the Seismological Society of America108(4): 2278–2304.
38.
Ramos-SepulvedaMBuckreisTLiMParkerGBrandenbergSRathjeEStewartJ (2023a) 2023 NGA-Compatible CENA database for GMM validation and site response studies [Version 3]. DesignSafe-CI. Available at: https://doi.org/10.17603/ds2-ywqs-sp29
39.
Ramos-SepulvedaMEParkerGAThompsonEMBrandenbergSJLiMIlhanOHashashYMARathjeEMStewartJP (2023b) High-Pass Corner Frequency Selection for Implementation in the USGS Automated Ground Motion Processing Tool (2023 Geo-Congress). Los Angeles, CA: DesignSafe-CI.
40.
Ramos-SepulvedaMEStewartJPParkerGAMoschettiMPThompsonEMBrandenbergSJHashashYMARathjeEM (2024) Data-driven adjustments for combined use of NGA-East hard-rock ground motion and site amplification models. Earthquake Spectra40: 1132–1157.
41.
SeaboldSPerktoldJ (2010) Statsmodels: Econometric and statistical modeling with python. In: Proceedings of the 9th python in science conference, Austin, TX, 28 June–3 July, pp. 57–61. Austin, TX: SciPy Society.
42.
SeyhanEStewartJP (2014) Semi-empirical nonlinear site amplification from NGA-West2 data and simulations. Earthquake Spectra30: 1241–1256.
43.
StephensonWJOdumJKHartzellSHLeedsALWilliamsRA (2021) Shear-wave velocity site characterization in Oklahoma from joint inversion of multimethod surface seismic measurements: Implications for Central U.S. ground-motion prediction. Bulletin of the Seismological Society of America111(4): 1693–1712.
44.
StewartJPParkerGAAtkinsonGMBooreDMHashashYMASilvaWJ (2020) Ergodic site amplification model for central and eastern North America. Earthquake Spectra36(1): 42–68.
45.
ThompsonEMWordenCB (2017) Estimating rupture distances without a rupture. Bulletin of the Seismological Society of America108(1): 371–379.
46.
ThompsonEMHearneMAagaardBTRekoskeJMWordenCBMoschettiMPHunsingerHEFerragutGCParkerGASmithJASmithKKKottkeAR (2025) Automated, near real-time ground-motion processing at the U.S. Geological Survey. Seismological Research Letters96: 538–553.
47.
TiwariA (2018) Engineering ground motion characteristics and site characterization for earthquakes in Texas. Master’s Thesis, Department of Civil Engineering, University of Texas at Austin, Austin, TX.
48.
YenierEAtkinsonGM (2015) Regionally adjustable generic ground-motion prediction equation based on equivalent point source simulations: Application to central and eastern North America. Bulletin of the Seismological Society of America105: 1989–2009.
49.
YustM (2018) Dynamic site characterization of TexNet ground motion stations. Master’s Thesis, Department of Civil Engineering, University of Texas at Austin, Austin, TX.
50.
ZalachorisGRathjeEM (2019) Ground motion model for small-to-moderate earthquakes in Texas, Oklahoma, and Kansas. Earthquake Spectra35(1): 1–20.
51.
ZalachorisGHeJRathjeE (2020) Earthquake time series from events in Texas, Oklahoma, and Kansas. DesignSafe-CI. Available at: https://doi.org/10.17603/ds2-v310-qc53v1
52.
ZalachorisGRathjeEMPaineJG (2017) characterization of Texas, Oklahoma, and Kansas using the P-wave seismogram method. Earthquake Spectra33: 943–961.
Supplementary Material
Please find the following supplemental material available below.
For Open Access articles published under a Creative Commons License, all supplemental material carries the same license as the article it is associated with.
For non-Open Access articles published, all supplemental material carries a non-exclusive license, and permission requests for re-use of supplemental material or any part of supplemental material shall be sent directly to the copyright owner as specified in the copyright notice associated with the article.