
Abstract
Shake table testing is a costly endeavor, often requiring construction of large-scale 3D specimens to allow system stability, though the focus may be solely on understanding the behavior of select components, subsystems, or contents. To minimize this burden on future researchers using the six-degree-of-freedom (DOF) Large High-Performance Outdoor Shake Table (LHPOST6) at UC San Diego, a unique Modular Testbed Building (MTB2) is designed and tested in a variety of configurations atop the LHPOST6 facility. The MTB2 is a reconfigurable, 3-story steel-framed building designed with replaceable structural fuses. The first use of the MTB2 involved testing two primary lateral force-resisting system (LFRS) configurations, namely Special Moment Frames (SMFs) and Buckling-Restrained Braced Frames (BRBF). As part of the SMF configuration, a rotationally compliant, column baseplate (CB) connection was integrated as an additional form of energy dissipation. The MTB2 in each of its LFRS configurations was subjected to a suite of one-, two- and three-DOF earthquake motions of increasing intensity. This unique building and its primary components are designed and detailed to be reused with easily replaceable fuses allowing the building to be reconfigured and retested. A shake-down program was undertaken to elicit a range of building responses from elastic to nonlinear with a dense sensor array provided to monitor global and local component responses. A reduced-order numerical model is developed, which offers a robust comparison with the specimen’s measured response.
Keywords
Introduction
The six-degree-of-freedom (DOF) Large High-Performance Outdoor Shake Table (LHPOST6) at UC San Diego is a national shared-use facility recently upgraded from a 1-DOF table to facilitate 6-DOF shaking tables (Van Den Einde et al., 2021). The Modular Testbed Building (MTB2) is a reconfigurable, steel-framed structure, which can be reused for testing of various structural and nonstructural components (NSCs) and was designed for adaptation to LHPOST6. The first, and current use of the MTB2 incorporated a variety of inelastic structural fuses intended to provide energy dissipation in two primary lateral force-resisting system (LFRS) configurations, namely: Special Moment Frames (SMFs) and Buckling-Restrained Braced Frames (BRBF). As part of the SMF configuration, a rotationally compliant column baseplate (CB) connection is integrated as an additional form of energy dissipation, referred to herein as the SMF + CB configuration. In the maiden usage of the MTB2, the shake table test program aimed to evaluate the performance of these LFRS systems and quantify their influence on global structural performance characteristics when subjected to multi-degree-of-freedom (MDOF) input excitation. Interested users of data from this program may find all necessary documentation, data, metadata, including FE models, and final test report (Morano et al., 2024a) curated within the Design-Safe Data Depot Repository (Hutchinson et al., 2024).
Specimen description
The plan geometry of the MTB2 was driven by the geometry of LHPOST6 such that the building footprint nearly encompasses the plan area of the shake table platen. To facilitate full-scale bay dimensions across the space available and use conventional steel member sizes, the building has two frame bays in the longitudinal direction and one frame bay in the transverse direction. The resulting plan dimensions are 32 × 20 ft2, with a usable area of 640 ft2 per floor, see Figure 1. The floor plan is consistent at all levels and designed to embrace the philosophy of a completely reconfigurable and reusable building. Large, open spaces between the transverse girders have been provided to allow for testing stairs or other vertically spanning egress systems, such as elevators, in future configurations. The desire to have a full-scale building with practical floor bay aspect ratios guided the selection of the specimens’ elevation and number of stories. The building is a hot-rolled steel frame structure with a uniform floor-to-floor height of 12 ft, and its six columns supported atop 3-ft tall, reinforced concrete footings, resulting in a total building height of 39 ft (measured from the base of the shake table to the top of the third story). The six structural columns terminate 4 ft above the top of the third story, facilitating placement of a perimeter safety railing.
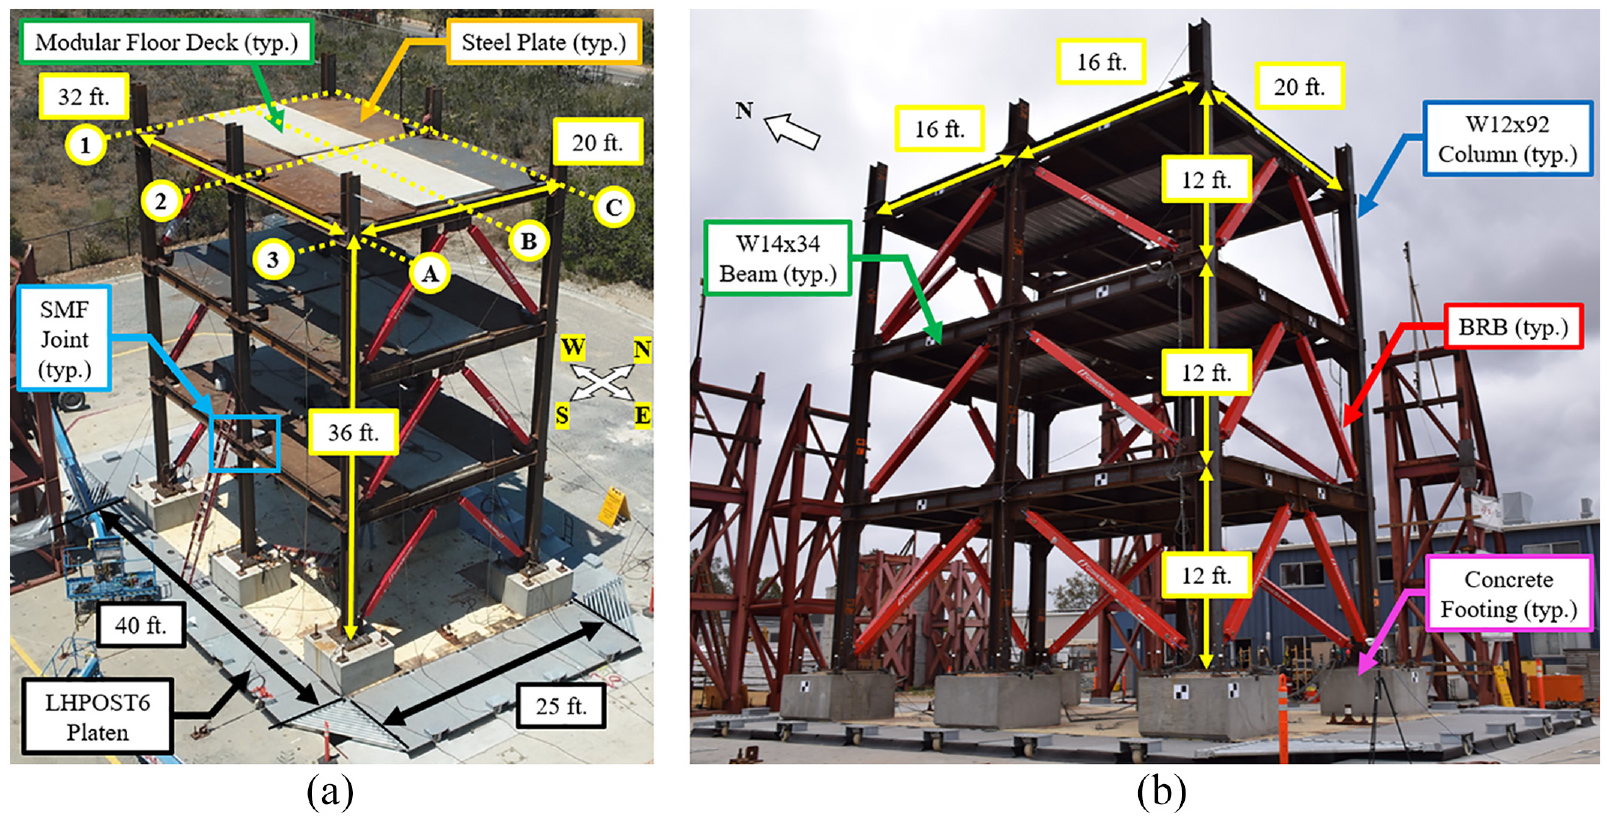
Perspective views of the MTB2 in (a) the SMF and SMF+CB configurations; and (b) the BRB-1 configuration.
The MTB2 has been designed to allow for reconfiguration of the LFRS in the East–West (EW, long axis of the specimen) direction. For the testing described herein, an SMF and a BRBF structural system are implemented. In the North–South (NS) direction in all configurations, BRBs are oriented in a chevron configuration in the outer two bays, while the center frame (Line 2) is designed as a gravity frame. The specimen is designed such that mixed framing systems may be used at different floor levels. Note that one configuration of the testing described herein adopted single-diagonal BRBs configured into a two-bay wide chevron BRBF at all floors in the EW direction, referred to as the BRB-1 configuration. Figure 2 provides elevation views of the buildings’ various LFRSs (Figure 2a to c), gravity bay (Figure 2d), and plan view of the floor system (Figure 2e). The motivation for selecting SMF and BRBF systems for the shake-down phase of the MTB2 was driven by the ability to demonstrate efficient reconfigurability between LFRSs and to characterize the model building, across a range of conventional LFRSs used in practice. To retain the model buildings reuse, only select elements were designed to attain inelastic behavior, while all others were intended to remain elastic, under seismic loading. Specifically, dissipation of seismic energy was localized at specially designed fuses, which can be economically and efficiently replaced following testing.
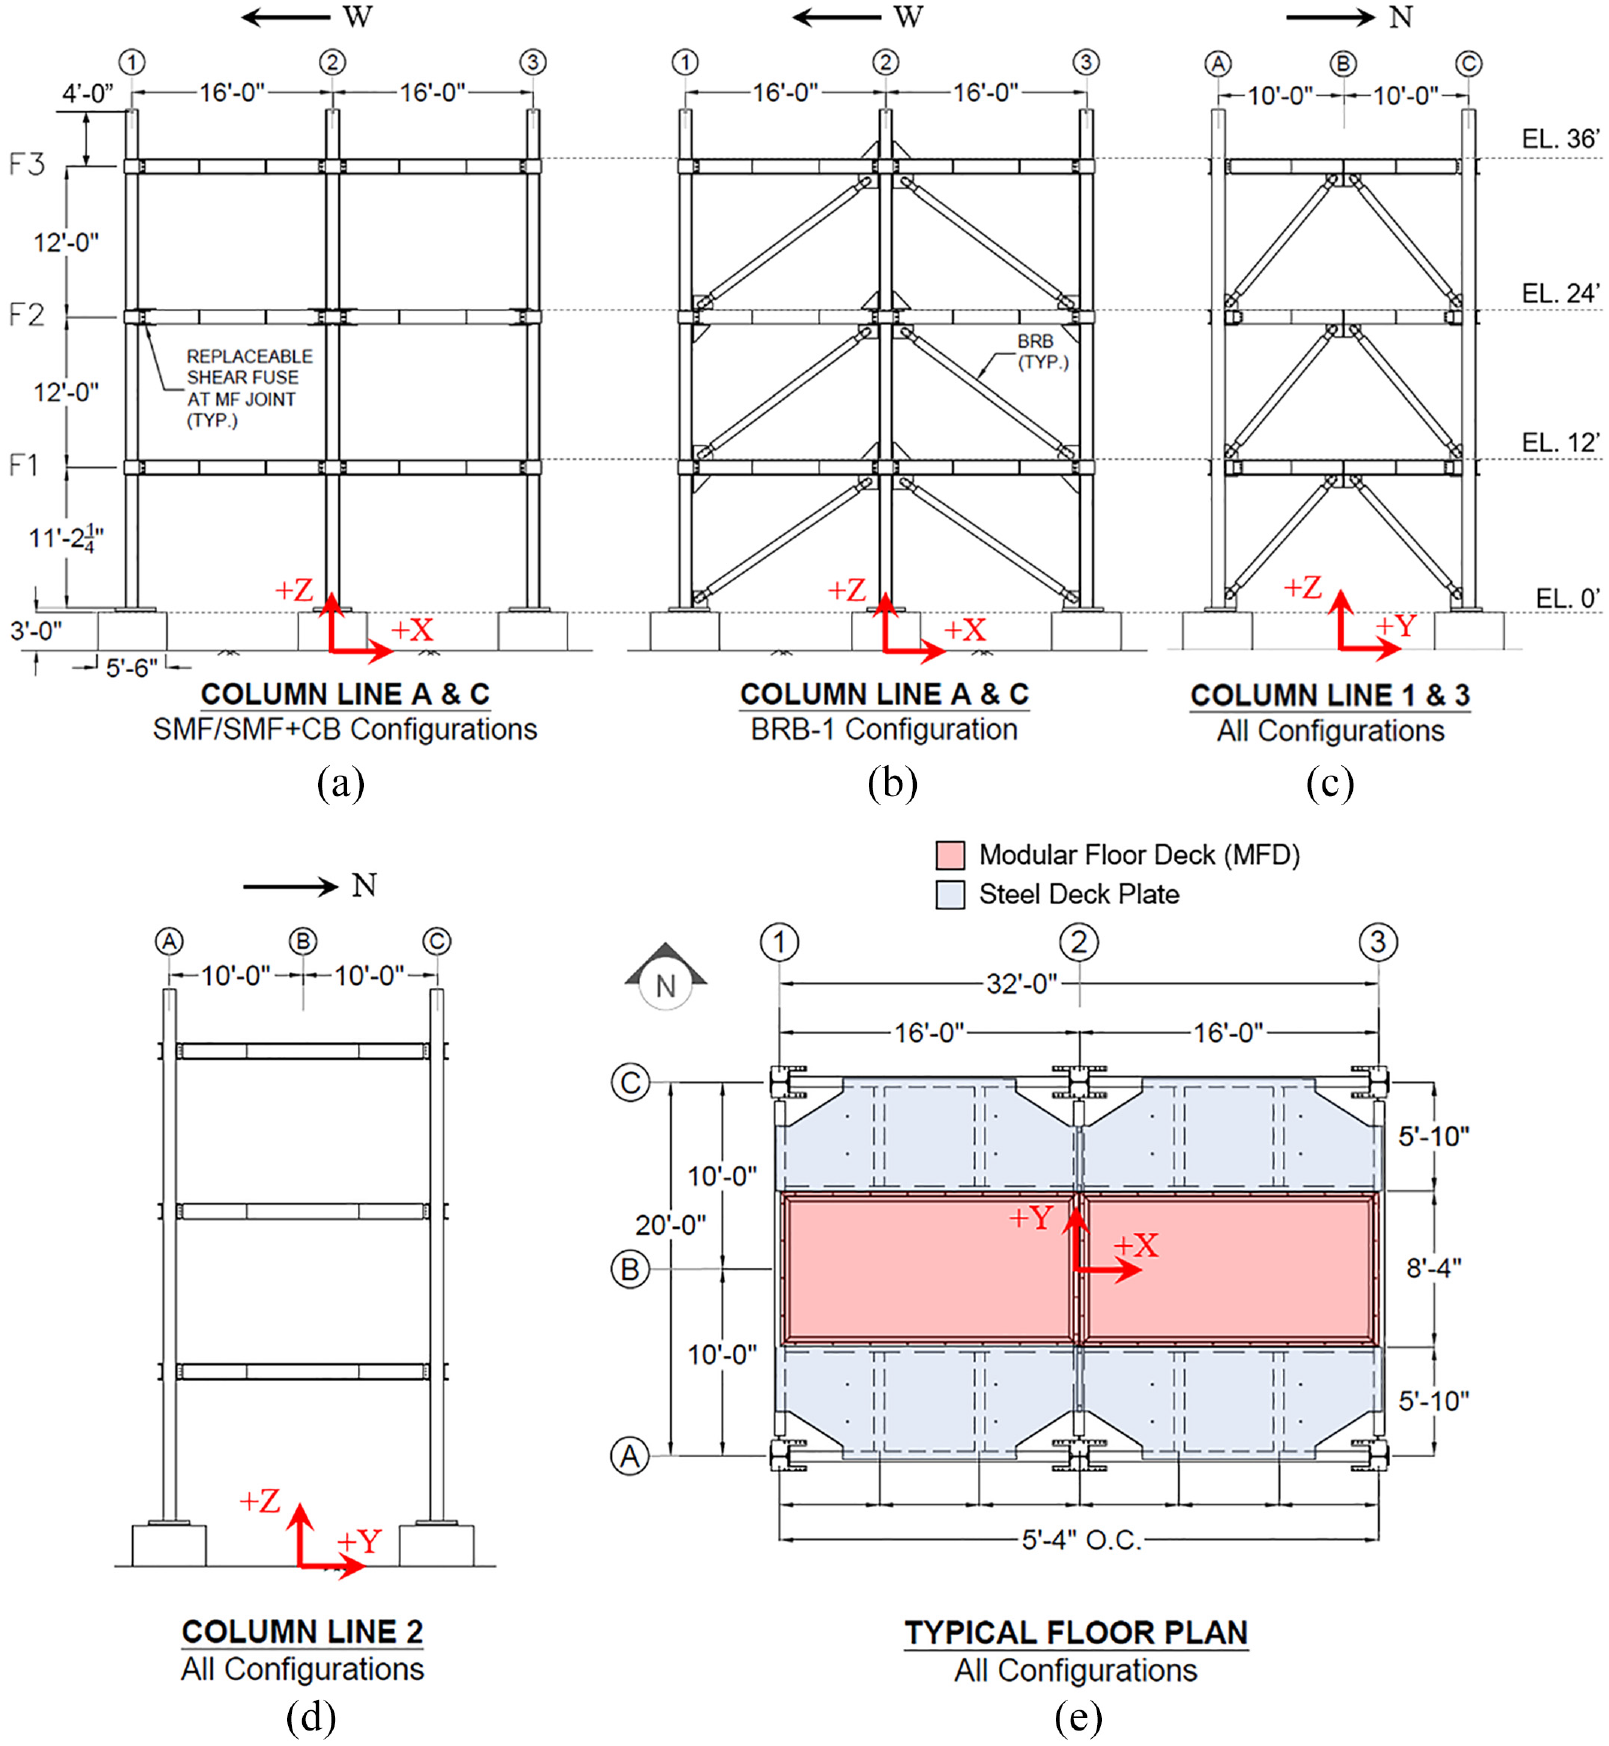
Primary lateral and gravity force resisting systems for the MTB2 test program: (a) X-direction (EW) for SMF and SMF+CB configurations; (b) X-direction (EW) for BRB-1 configuration; (c) Y-direction (NS) across all configurations; (d) Y-direction (NS) interior gravity bay across all configurations; and (e) typical floor plan across all configurations. Floor diaphragm not shown in elevation views for clarity.
Foundation design
The superstructure of the MTB2 is attached to six, isolated reinforced concrete footings, which are fixed to the shake table through post-tensioned high-strength threaded steel bars. Each footing supports an individual steel column. Footings were constructed of cast-in-place concrete with four tie-down locations for direct adaptability to the hole layout of the shake table platen, see Figure 3a. Footings were designed to remain elastic, with sufficient overstrength compared with the supporting framed building. Detailing was provided per ACI 318-19 and included uniform top and bottom reinforcement mats of #6 rebar and #5 hoops for horizontal shear reinforcement, all of which conform to ASTM A615 Grade 60 reinforcement. The concrete used for the foundation was specified as quick-setting high strength with an achieved 28-day compressive strength of 8.5 ksi. In plan, each footing is squared with side lengths of 5.5 ft and a height of 3 ft. The foundation system was not only designed to remain uncracked (not including serviceability level cracking) throughout this test series but also reusable for future tests and adaptable for different column configurations. The footings were detailed and cast with blockouts to allow for the placement of cruciform shear lugs welded to the bottom of CBs which are designed to resolve the shear demands imposed from dynamic seismic loading. To allow for the implementation of CB connections with varying fixity, referred to herein as a Compliant Baseplate, the footings were cast with replaceable anchor (RA) sleeves which facilitate 1-in diameter threaded rods to be inserted to affix the superstructure to the foundation system, subsequently tested, and then removed and replaced with untested anchors. Traditional cast-in-place anchor rods were also provided. Prior to the construction of the steel superstructure, the six footings were installed on the shake table platen, see Figure 3b. Each footing was secured with four 1.75-in diameter high-strength thread bars post-tensioned to 200 kip.
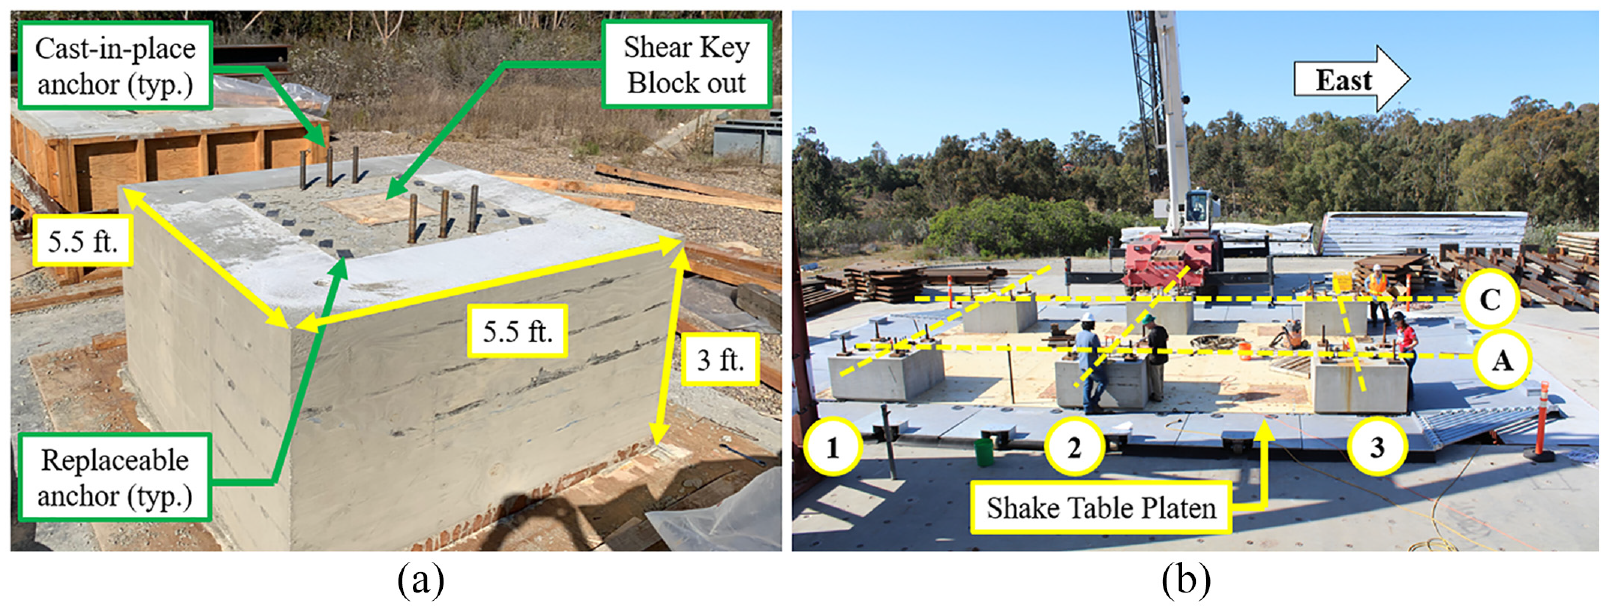
MTB2 foundation system: (a) photograph of a typical interior footing; and (b) photograph of the final placement of the six isolated footings on the shake table platen.
Superstructure design
Design of the MTB2 assumed a high seismic hazard site near downtown Los Angeles, California, USA (Coordinates: 34.05°N, −118.25°W), with a Site Class D (stiff soil). The resulting seismic design parameters per ASCE/SEI 7-16 (American Institute of Steel Construction, Inc (AISC), 2016) are as follows: spectral acceleration at short periods, SS = 1.958 g, spectral acceleration at a period of 1 s, S1 = 0.697 g, and design spectral accelerations, SDS = 1.305 g and SD1 = 0.79 g. Member gravity and seismic design were pursued according to the most current US standards at the time, namely AISC 360-16 and AISC 341-16. All framing and gravity beams used in the building are A992 W14 × 34 and all columns are A992 W12 × 96. Select beams are detailed to have staggered holes along the top flange to facilitate mass attachment. It should be noted that although the beam size for this structure does not comply with the highly ductile member size requirements of AISC 341-16, the shear fuse connection type and beam size are qualified for use in this program from previous testing (Reynolds and Uang, 2019a). Selection of column and beam sizes also considered the force transfer from the BRBs at the beam-to-column joints. Per ASCE/SEI 7-22 (American Society of Civil Engineers (ASCE) and Structural Engineering Institute (SEI), 2022), the system may be traditionally designed using the Equivalent Lateral Force (ELF) procedure which prescribes a Response Modification Factor, R = 8, Overstrength Factor, ΩO = 3, and a Deflection Amplification Factor, Cd = 5.5 for steel SMFs and R, ΩO, Cd equal to 8, 2.5, and 5, respectively, for steel BRBF. The design methodology for this building followed a performance-based design approach which included nonlinear analysis procedures, foregoing the traditional design methods. The summary of seismic analysis and design parameters from the various codified linear and nonlinear static procedures (NSP) is summarized in Table 1, and nonlinear static pushover curves are presented in Figure 4. In codified linear analysis procedures, Vb and T1 are important seismic design parameters defined as the design base shear and first fundamental elastic period, respectively. In the NSP analyses, Δ y and Δ d are defined as the effective roof displacement at yield and target roof displacement, respectively, determined in accordance with (ASCE/SEI 41-17, 2017). Similarly, Vy and Vd are defined as the effective yield strength and base shear at the target roof displacement, respectively. The effective fundamental period in the direction under consideration, Te, differs from the elastic fundamental period by considering the ratio of elastic and effective stiffness and is determined using Equations 7–27 of ASCE 41-17. Note that the bilinear approximations do not attain peak strengths achieved during pushover analyses, as the calculated target displacement according to ASCE/SEI 41-17 is less than the displacement at the maximum achieved base shear. This is largely due to the appreciable overstrength provided in the LFRS fuses. The effective lateral stiffness, Ke, is equal to the slope of the first segment of the idealized bilinear approximation force–displacement curve connecting the origin and effective yield point (Δ y , Vy). Figure 4 reveals the appreciable effective stiffness difference between the BRBF and SMF frames, where BRBFs are nearly six times stiffer. The figure also shows that although the bilinear approximations for the SMF and SMF+CB follow similar behavior up until yield, the post-yield behavior of the SMF+CB is significantly softer because of the inclusion of rotationally compliant CBs with ductile anchor bolts. In the BRB-1 configuration, the X- and Y-directions have similar yield displacements but a stronger and stiffer behavior in the X-direction due to larger and less steeply inclined BRBs.
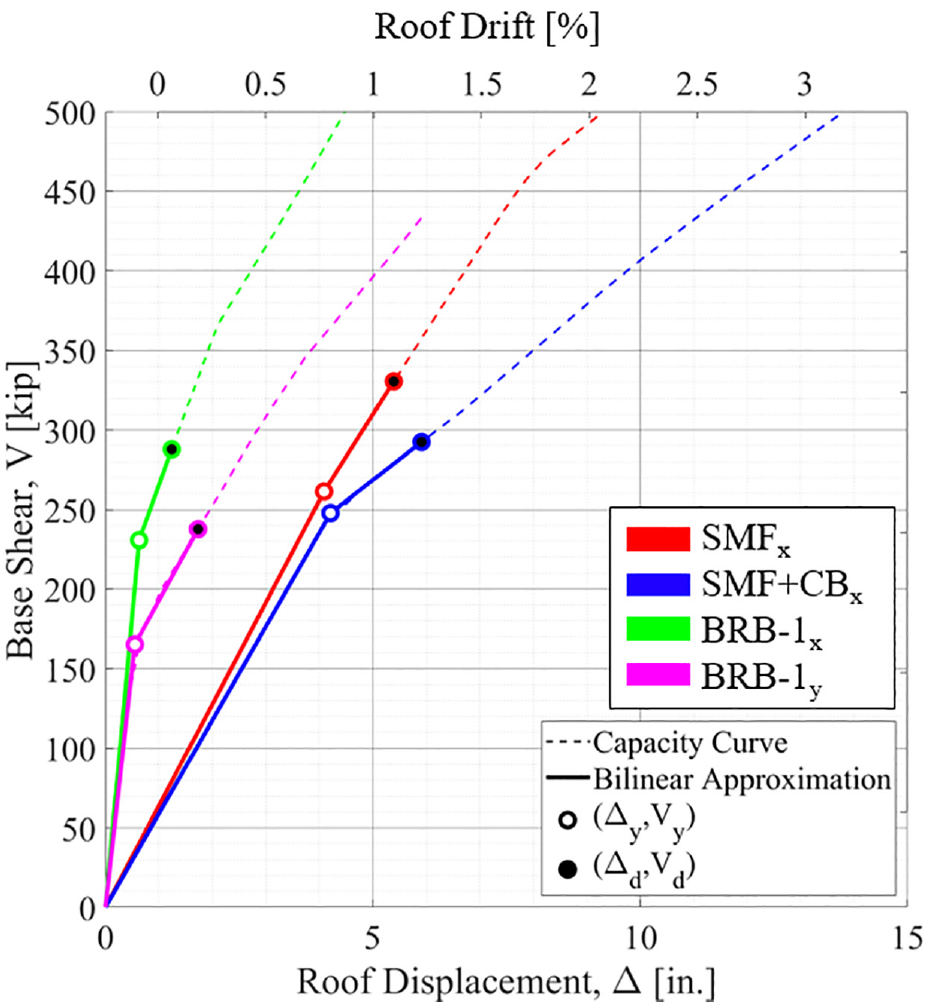
MTB2 capacity curves overlaid with bilinear approximations calculated in accordance with ASCE/SEI 41-17. Note only one curve is shown for the Y-direction (BRB-1y) as the BRBF is consistent across all configurations.
Seismic analysis and design parameters for all three MTB2 configurations
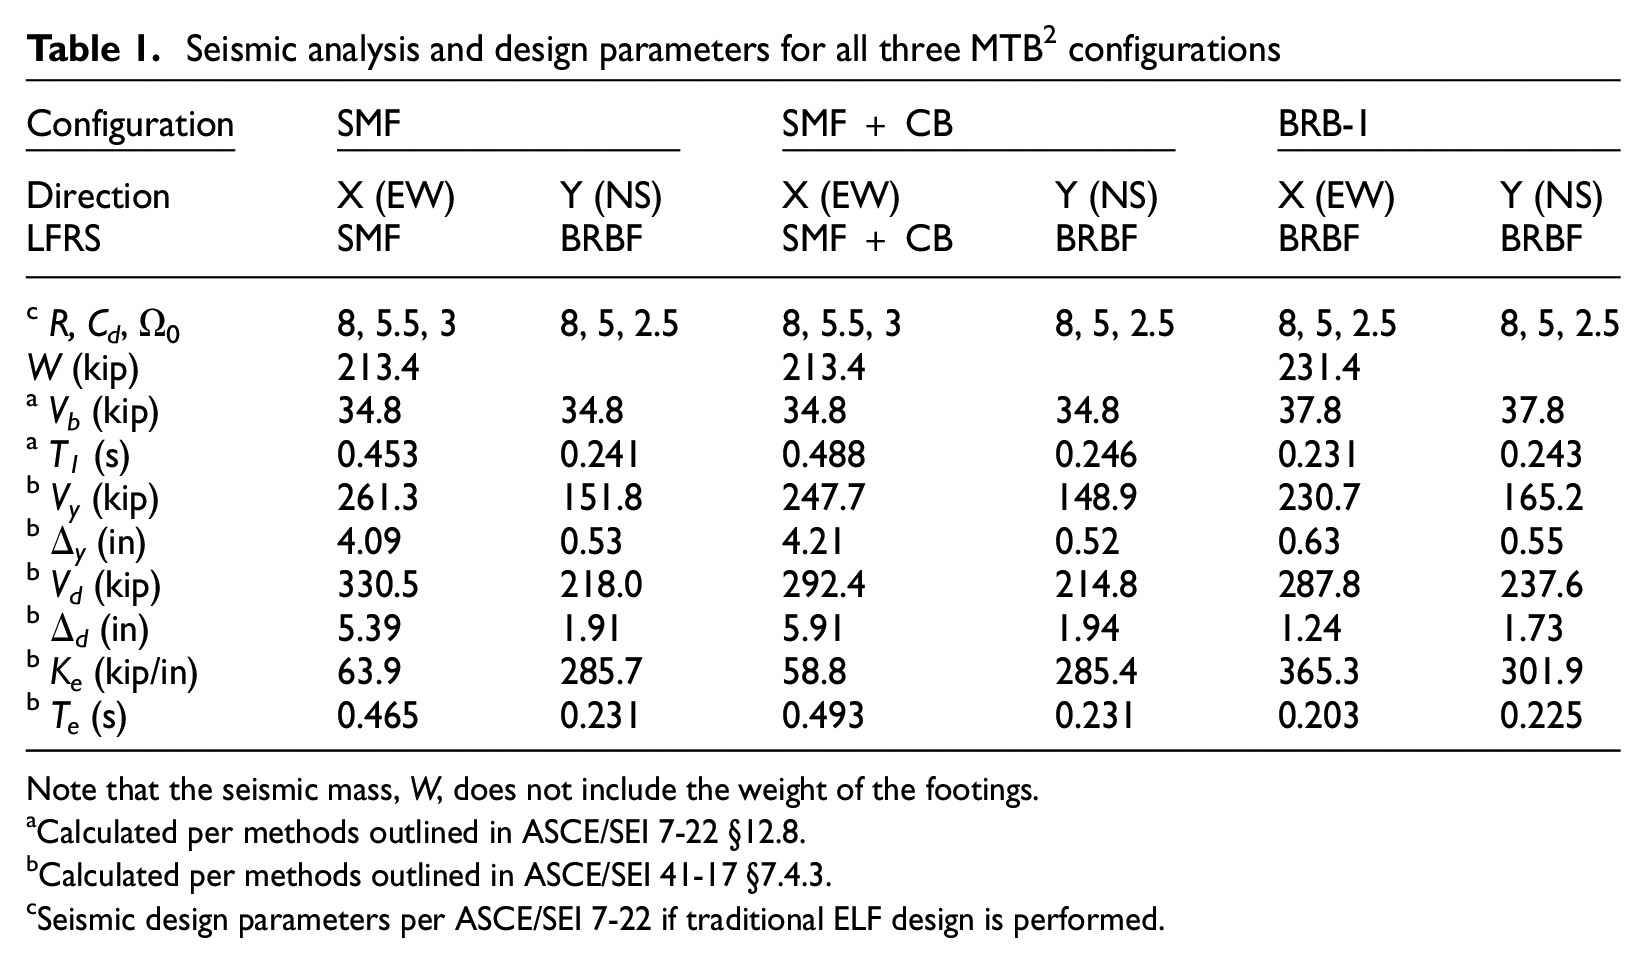
Note that the seismic mass, W, does not include the weight of the footings.
Calculated per methods outlined in ASCE/SEI 7-22 §12.8.
Calculated per methods outlined in ASCE/SEI 41-17 §7.4.3.
Seismic design parameters per ASCE/SEI 7-22 if traditional ELF design is performed.
The primary mass of the specimen was not defined by conventional building dead and live load design, rather guided by targeting dynamic properties of the building model. In this case, it also serves as a rigid diaphragm and is provided by large steel plates, four total per floor, see Figure 1e. In the open areas between the girders of the transverse beams, two modular, drop-in floor systems constructed of steel decking overlaid with poured-in-place concrete are provided at each level. The target floor mass was iterated on to result in natural periods of interest in typical low-rise buildings (targeting 0.2–0.5 s), considering the range of LFRSs integrated into the MTB2 building configuration. In the SMF and SMF + CB configurations, the lumped floor mass at each level is approximately 71.3 kips, while in the BRB-1 configuration, the lumped floor mass is approximately 77.1 kips.
Floor diaphragm design
The floor diaphragm system was specially designed and detailed to function as the primary contributor to the inertial mass of the MTB2 and to effectively transfer seismically induced loads to the LFRS while also facilitating reconfiguration. Notably, the floor diaphragm system is composed of two major components, see Figure 1a. The first component includes four trapezoidal steel plates, each constructed of 2.75-in thick A572-50 carbon steel and weighing approximately 9.5 kips. Four 1.25-in diameter through holes are provided in each plate for lifting. The unique shape of these plates manifests to avoid addition of stiffness near the beam–column connections while also allowing access at these locations for reconfiguration. The plates were the only components of the MTB2 requiring field welding, although purposely minimized with fillet welding to the beam flanges sufficient to assure a factor of safety against shear failure of 3.0.
The second major component of each floor diaphragm system is two concrete-over-metal decking slabs, referred to as modular floor decks (MFDs). The pair of MFDs was designed as modular elements which can be readily dropped in place or removed, from the two interior bays of the building, see Figure 1a. A schematic of a typical MFD is shown in Figure 5. Each MFD was constructed with angles welded back-to-back to form a rectangular perimeter frame where the interior of the frame supports a 20-gage, cold-formed steel deck and serves as formwork for the poured-in-place concrete, which had a 28-day compressive strength of 5.3 ksi. Each deck was also reinforced with a welded wire mesh fabric set atop 0.5-in chairs. The exterior of the rectangular frame was detailed with through holes to match the pattern of holes provided on the top flanges of the flooring beams to ensure ease of installation and adaptability to future test configurations. Each MFD was secured to the supporting gravity beams with 16 7- or 8-in diameter ASTM F3148 bolts (8 bolts per side in the X-direction) and 2 4-in long, ÷-in thick E70 fillet welds on each side in the Y-direction. This connection ensured no slip would occur between the MFD and beams at high levels of shaking.
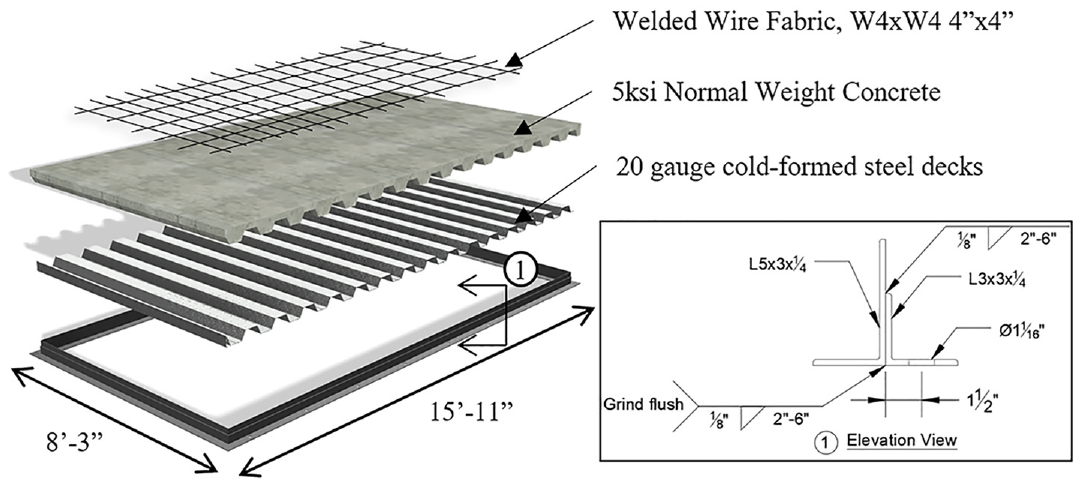
Schematic of components of a typical MFD.
Shear fuses
Replaceable shear fuses are used for the moment frame connections in the EW bays of the MTB2 when the SMF configuration is used. The concept of replaceable shear fuses was originally proposed as an alternative to the traditional steel moment frame joint (Richards, 2019; Richards and Oh, 2019). The moment frame connection detail is illustrated in Figure 6a and b. The connection consists of two major components: (1) elastic top plates: two 0.75-in thick steel plates which connect the top of the beam to extensions welded to the columns; and (2) a yielding fuse plate: referred to as the shear fuse, constructed of a 0.5-in thick steel plate attached to the bottom of the beam to extensions welded to the column, see Figure 6c. All yielding plates in this test program are identical and are particularly designed and detailed with two rounded cut-outs creating the yielding region (Liu et al., 2024). The fuse plate geometry (Figure 6b) limits the moment at the face of the column to less than the plastic moment capacity of the beam, when the fuse plate is yielded and fully strain hardened (overstrength is the tensile/yield strength ratio), ensuring the beam remains elastic. The other connection elements are capacity-designed to remain elastic and to accommodate the inelastic deformations of the fuse, per the design procedure described in AISC 358-22 (AISC, 2022). Extensive monotonic and cyclic quasi-static tests have been performed on shear fuse moment connections of various sizes, detailing to verify and characterize performance metrics for these connections (Reynolds and Uang, 2019a, 2019b). The moment–rotation capacity curve for the shear fuse connections used in this test program is shown in Figure 6d, originally presented in the work by McCall and Richards (2020), with minor modifications to account for the particular geometry. The performance objectives, POs, identified in this figure were selected based on quasi-static cyclic test results of similar connections (McCall and Richards, 2020). It should be noted that considering ASCE 41-17 Table 9–7.1, the LFRS beams would fall into Case 3, where the Immediate Occupancy (IO), Life Safety (LS), and Collapse Prevention (CP) acceptance criteria would be 12.8, 52.7, and 64.8 mrad of beam rotation, respectively. Herein, the POs were granulized into four levels, and related to prior experiments on similar connections.
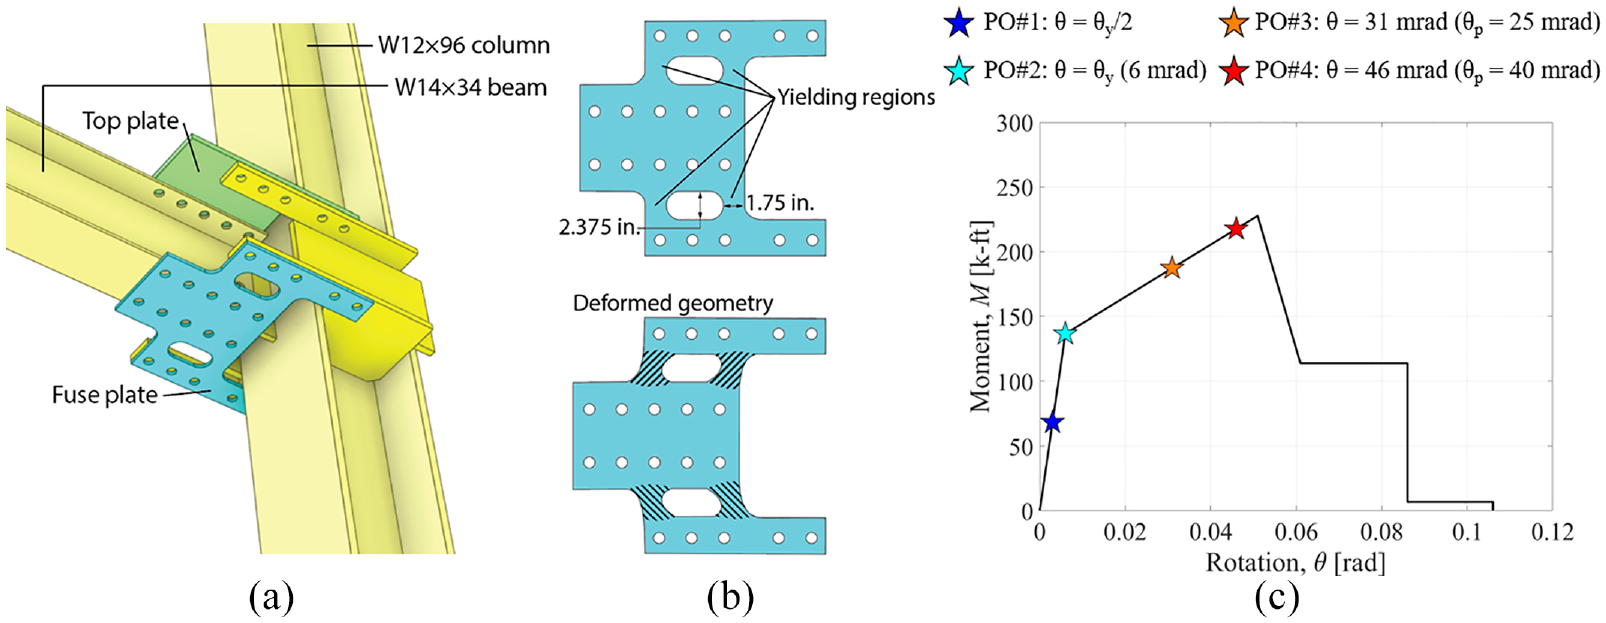
(a) SMF shear fuse connection detail; (b) shear fuse geometry and expected behavior; (c) definition of backbone curve and performance objectives for the SMF shear fuses. The parameters θy = yield rotation, and θp = plastic rotation.
Bucking-restrained braces
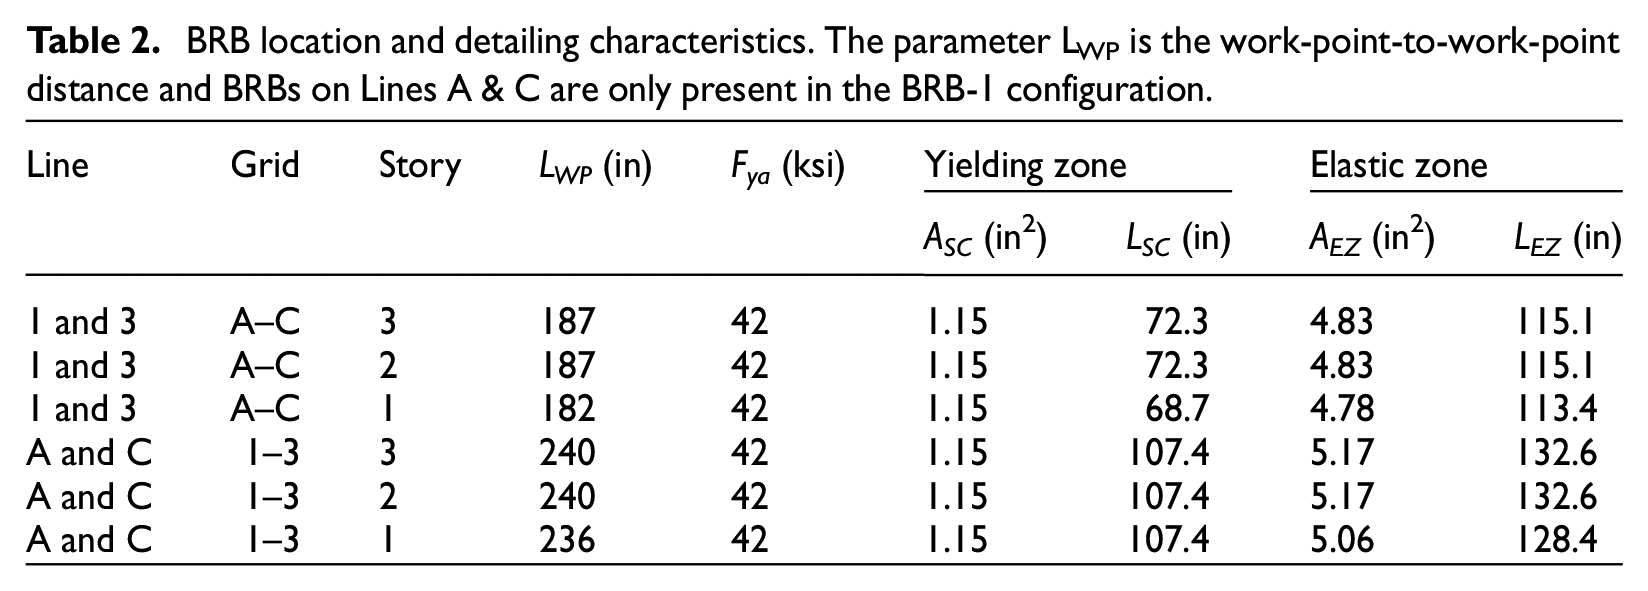
In the Y-direction bays on Lines 1 and 3, for all configurations, and in the X-direction bays of the BRB-1 configuration, BRBs in a chevron configuration provide the LFRS of the MTB2. Y-direction BRBs are configured into single-bay wide chevrons, whereas in the orthogonal direction, the BRBs are in two-bay wide chevrons. In the X-direction, the BRBs are connected to the structure via bolted gussets at the base plates and beam-to-column connections, see Figure 1b, allowing for reconfigurability between the BRBF and SMF systems. In the SMF and SMF + CB configuration, force transfer from the beams to columns is primarily facilitated through the shear fuses which attach these components, while the long-slotted shear tab allows the connection to rotate. However, this connection detail is insufficient for effective force transfer in the BRB-1 configuration once the shear fuses are removed, thus haunch plates are bolted on opposite sides of the beam-to-brace-to-column connections, to allow for force transfer at these connections when the BRBs are in place. In the Y-direction frame bays, BRBs are connected to the superstructure frame via welded gussets on the column webs welded to the beams. Braces are connected to gussets at either ends with four A325 7- or 8-in bolts. Gusset plates are designed per AISC 341-16 (AISC, 2016) specifications to remain elastic throughout the test program. BRBs are constructed with HSS 8 × 8 × 0.25 casings and a Grade 36 steel core. The steel yielding core area in all BRBs is 1.15 in2 with a yield strength, Fya, of approximately 43 ksi. The axial stress–strain backbone curve of the BRBs used for the design of this building is presented in Figure 7a. Table 2 summarizes the location and detailing characteristics of all BRBs used. Yielding of the steel core is designed to occur in the yielding zone as shown in Figure 7b (Williamson et al., 2024).
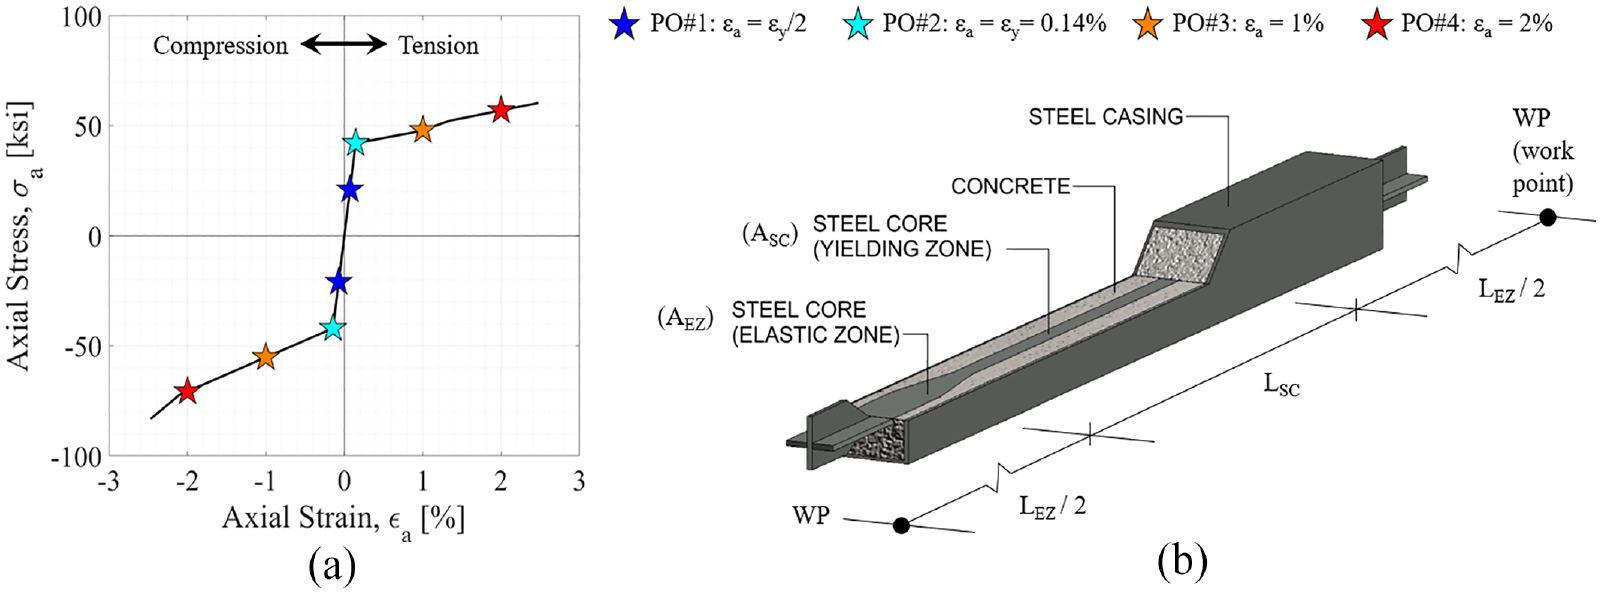
Modeling characteristics for the BRBs: (a) axial stress-strain backbone curve and performance objectives of BRBs used herein. The parameters Δy = yield displacement and ϵy = yield strain; and (b) annotated geometry of BRBs. In addition, LEZ incorporates the length of elastic steel core, gusset plate and portion of beam/column extending to the work point.
BRB location and detailing characteristics. The parameter LWP is the work-point-to-work-point distance and BRBs on Lines A & C are only present in the BRB-1 configuration.
In accordance with ASCE/SEI 41-17 Table 9–8, the IO, LS, and CP acceptance criteria are 0.43%, 1.45%, and 1.93% axial strain, respectively. Typical of BRBs, the compressive strength of the BRB is inherently greater than that in tension, and in this case, at large axial strains, for example at CP, the element is approximately 25% stronger in compression. The target POs presented in Figure 7 were selected, considering the BRB acceptance criteria and used to guide the motion selection and scaling.
Compliant baseplate
Rotationally, compliant column base connections are introduced, while the X-direction frame bay was configured as an SMF, and herein referred to as the SMF + CB configuration. The required flexural strength of column bases in moment frames is addressed in AISC 341-16 (AISC, 2016), which allows the design to be considered in three viable options; one of which is a “partially fixed” base connection designed to achieve a ductile limit state at the column base prior to column hinge formation. This partial fixity is the achieved courtesy of the RAs. The RAs are RA sleeves detailed to provide eight bolt diameters (db) of stretch length beneath the surface of the concrete, satisfying the current ACI 318-19 (American Concrete Institute 318 Committee, 2019) minimum stretch length of 8db, and supported by experimental evidence (Trautner et al., 2014, 2018; Parks et al., 2018). By adjusting the detailing of the baseplate, that is, the number and layout of anchors, varying levels of fixity can be achieved. In the SMF and BRB-1 configurations, all RA sleeves are used to effectively simulate a “fully-fixed” condition. In the SMF + CB configuration, a “partially fixed” base condition is achieved by removing 40% of the RAs to decrease the level of restraint at the base connections and thus forcing the remaining anchors to resolve the axial and bending moments at the base allowing the anchors to yield and stretch. By allowing the base connection to deform inelastically through ductile anchor yielding, increased levels of rotational ductility and energy dissipation at the base can be achieved. Connection details for the exterior and interior baseplates are shown in Figure 8a and b, respectively.
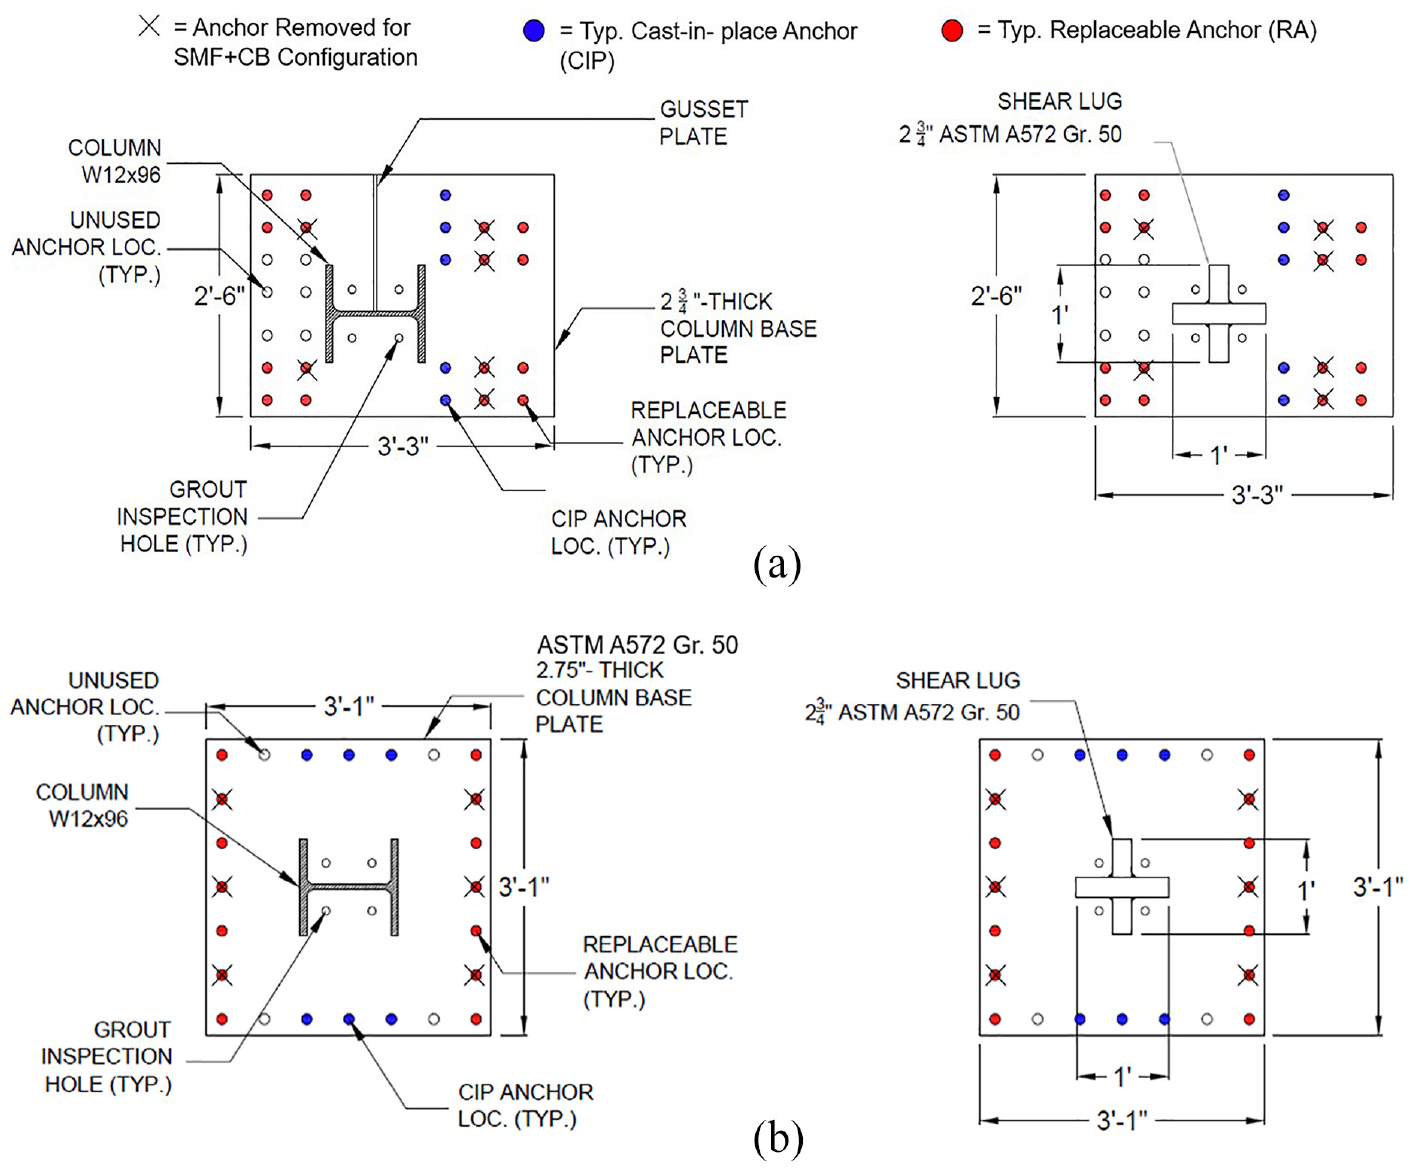
Plan views of the column baseplate and shear lug details for (a) a typical exterior baseplate; and (b) a typical interior baseplate.
Due to the detailing requirements at the column base connections when testing in the braced frame configurations, the baseplates were sized to accommodate gusset plates. In addition, a cruciform shear lug was welded to the bottom of the baseplate directly in the column line. These shear lugs were designed to resolve the biaxial base shear demand at the column base connections such that the anchorage resolved only tension forces due to axial and flexural column demands. The thickness of the baseplate and shear lugs, 2.75 in, was conservatively selected due to available plate stock (A572 Gr. 50), while also assuring the baseplate remained elastic. The sleeves of the RA were detailed to have sufficient radial clearance between the anchor bolt, and the inner surface of the sleeve to assure tension is carried by the anchor and shear is carried by the shear lug (Figure 9a). Complementary single anchor monotonic and quasi-static cyclic tension tests were conducted prior to the implementation in the building specimen (Morano and Hutchinson, 2024). These tests used threaded anchor rods conforming to ASTM F1554 Gr. 36 and proved that ductile anchor failure is always achieved, and a typical force–displacement curve is presented in Figure 9b. Moreover, the RA could be successfully removed and replaced without compromising the embedded anchor sleeve element or surrounding concrete. The final CB details for the SMF + CB configuration were obtained using an iterative design approach with the CBFEM program, HILTI Profis (Hilti Corporation, 2017). The final moment–rotation backbone curves and associated POs are shown in Figure 10 for a typical interior and exterior baseplate.
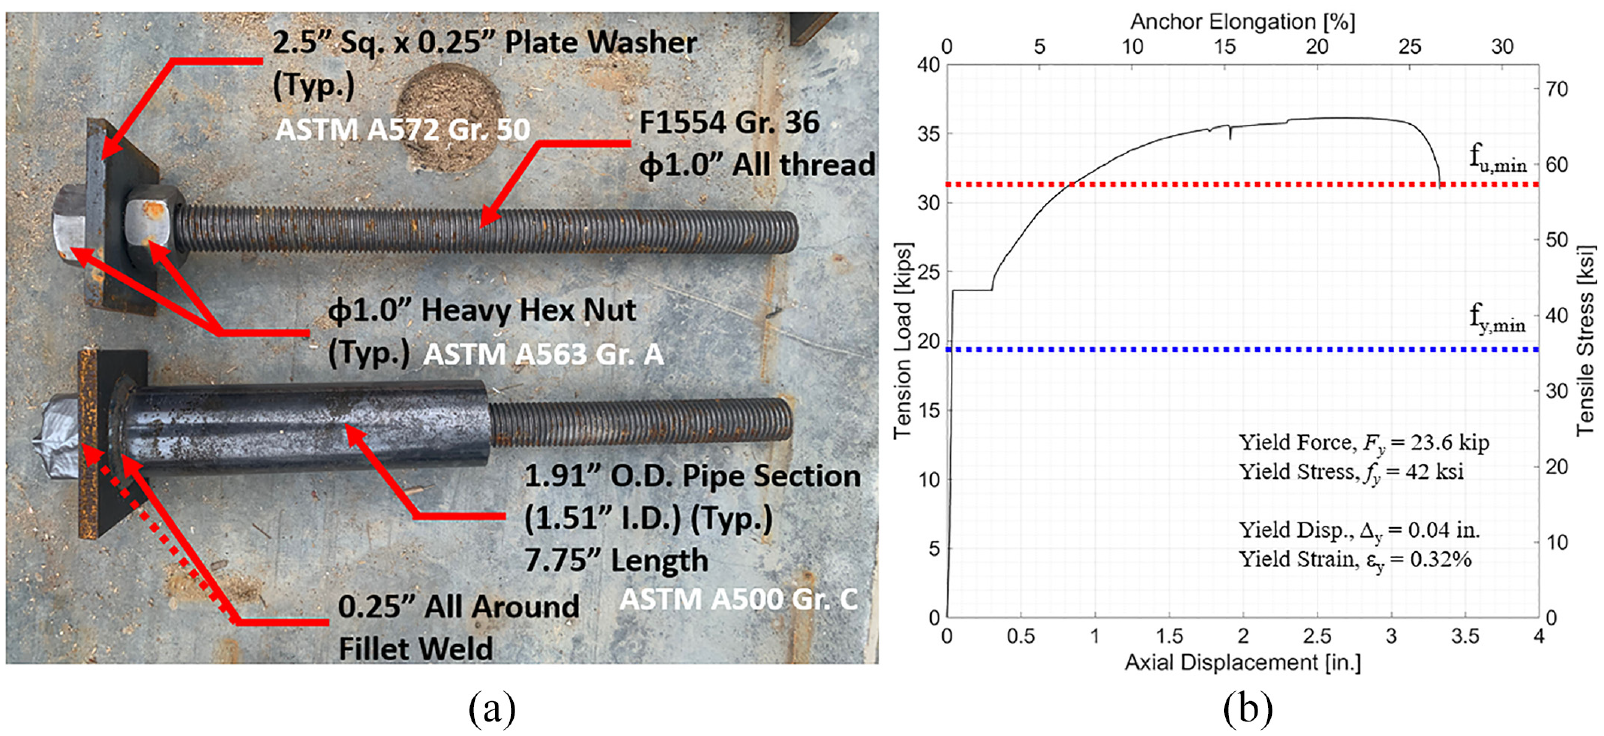
Column baseplate anchorage. (a) Typical conventional CIP anchor compared to typical RA sleeve assembly; and (b) typical backbone for RA with Gr. 36 ASTM F1554-20 strength requirements overlaid (Morano and Hutchinson, 2024). Note that fy,min = 36 ksi and fu,max = 58 ksi.
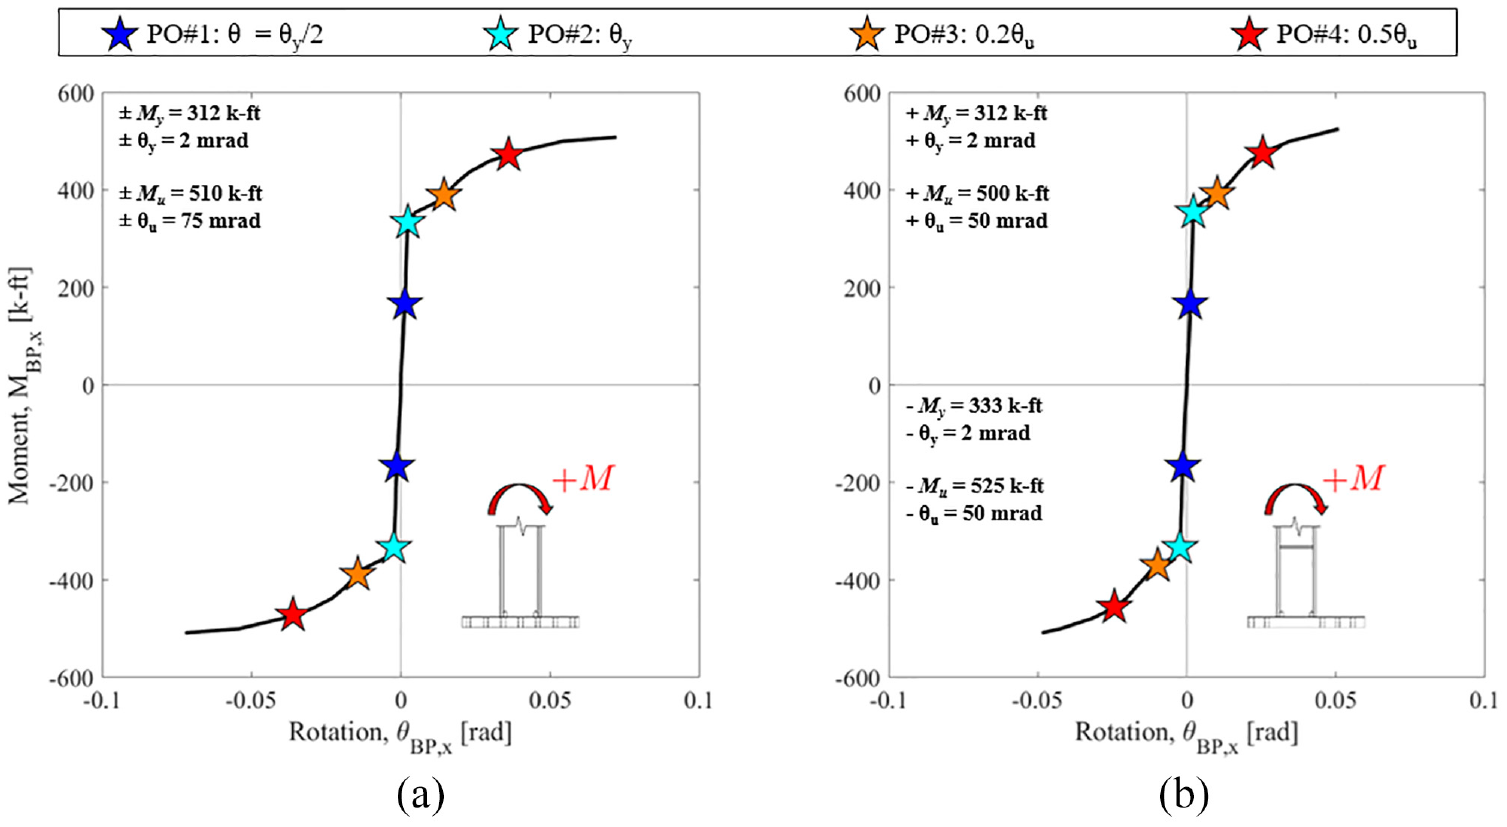
Analytically derived longitudinal (x-direction) moment–curvature backbone curves for: (a) typical interior column baseplate; and (b) typical exterior column baseplate.
Construction process
Construction followed a sequence of phases commencing with the SMF configuration, to the SMF + CB and ending with the BRB-1 configuration. This sequence was selected due to the ease of initial construction of the SMF combined with the rapid removal of anchors and thus reconfiguration to the SMF + CB (simply removing 40% of the installed RAs in the CBs). Completing the program with the BRB-1 configuration required shear fuse removal and installation of longitudinal BRBs. Construction of the SMF configuration took a total of 4 days to complete, while reconfiguration to the BRBF in the X-direction, that is, BRB-1 configuration, required reinstallation of the RAs, removal of the shear fuses, installation of gussets and haunches, and connection of the BRBs. The plumbness of the building was monitored during the initial assembly to the SMF configuration and then during the reconfiguration to the BRB-1. Reconfiguration into the BRB-1 was completed in 2 days, while the deconstruction of the specimen was rapid and completed in just 3 days.
Numerical model
A 3D numerical finite element model (FEM) was developed within the ETABS structural engineering software platform (Computers Structures, Inc (CSI), 2020). Pretest simulations included eigenvalue analyses to determine the baseline predictions of the range of natural frequencies to define the structural mass to provide a realistic range of periods for the designed LFRS configurations. Renderings of the first three mode shapes predicted from eigenvalue analysis are shown in Figure 11. In addition, nonlinear static and dynamic analyses were conducted to verify the member sizes and aid in the design of demand-critical components, such as welds and other structural connections. The nonlinear ductile fuses were modeled with material properties, geometries, and backbone curves, described in the previous sections, allowing for tracking of local limit states of each fuse component, see Table 1. The frame elements are 1D displacement-based line elements with nonlinear moment–rotation hinges located at the beam ends to represent the behavior of the shear fuse connections. All other beam elements not included in the SMF and SMF + CB X-direction LFRS are modeled as shear connections with moment releases at both ends. BRBs are modeled as compound elements with elastic endzones using properties defined in Table 2 and a nonlinear axial-displacement spring colinear with the axis of the brace connecting the elastic endzone elements. Columns are modeled with interacting P-M-M (axial–minor–major moment) hinges at the tops and bottoms of all columns at every story. In the SMF + CB configuration, the six column bases are modeled with zero-length rotational springs, while the column bases in the remaining configurations are modeled as perfectly fixed restraints. A semi-rigid diaphragm assumption was adopted in the FEM model. Steel plates on each floor level are individually modeled as thin-shelled slabs with geometries and material properties to appropriately account for the stiffness and mass they provide to the MTB2, while the MFDs are modeled as one-way membranes modeled with the details described in Figure 5. This model was then used to develop the test protocol by subjecting the structure to earthquake motions iteratively scaled to achieve target POs. To compare the measured test results to the numerical model, achieved shake table recordings were included as the input base excitations in posttest simulations, and sequential nonlinear time history (NLTH) analyses were ran for each configuration such that each ground motion is run sequentially following the completion of the prior base excitation. This method of nonlinear time history analysis allows for the most realistic comparison of measured results to posttest finite element analysis (FEA). In the pre- and posttest nonlinear time history analyses, Rayleigh damping is adopted with 2% damping in the first two modes of vibration based on non-destructive tests of the MTB2 carried out prior to shake table testing (Morano et al., 2024b).
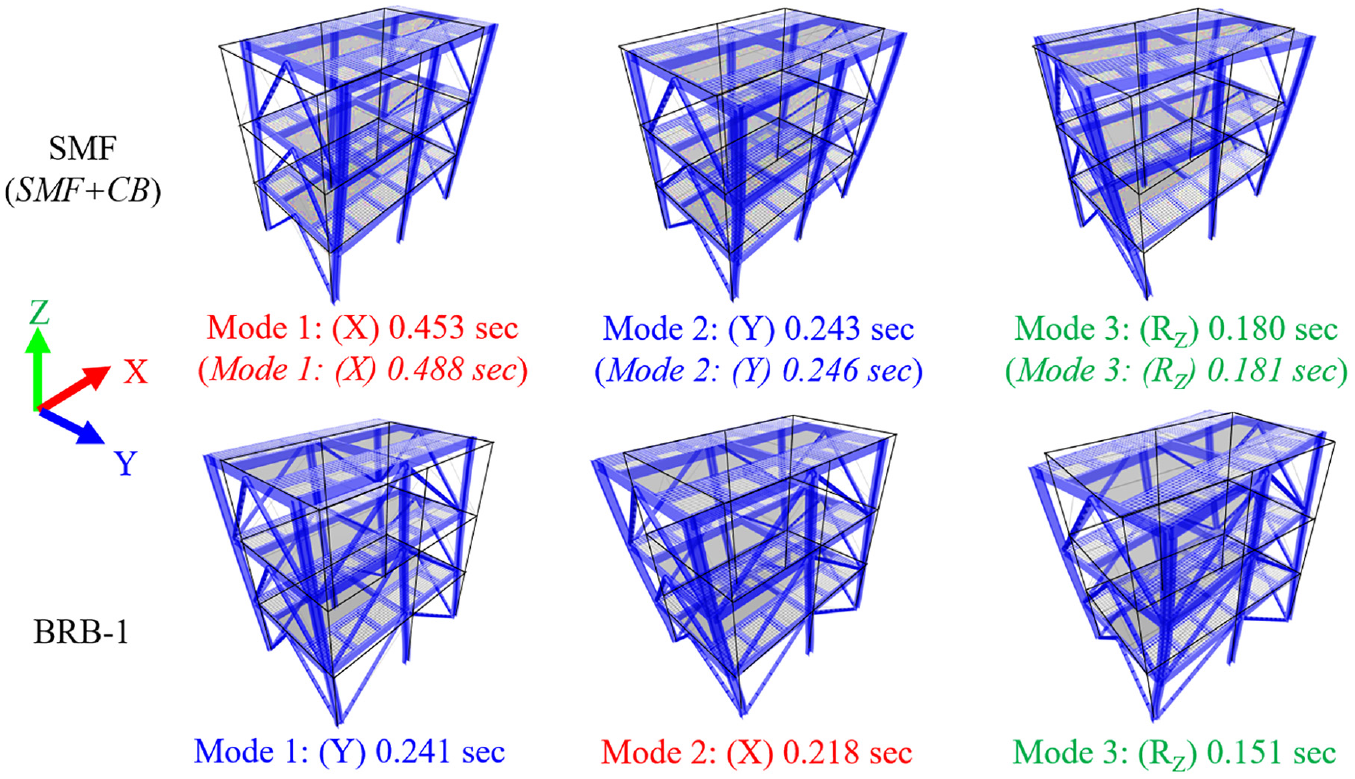
Predictions of the first three modes of vibration (blue, rendered frame) from eigenvalue analysis for the SMF and SMF + CB (top) and BRB-1 (bottom) configurations. The undeformed wire frame highlighted in black emphasizes mode shapes.
Earthquake test protocol
Input motions
Three earthquake seed motions were selected for the test program from the suite of motions used during the LHPOST upgrade to 6-DOF (Van den Einde et al., 2021). These motions included a range of intensity, strong-motion duration, and frequency content. The three motions are the Rinaldi Receiving Station recording from the 1994 Northridge (Mw = 6.7) earthquake, the TCU065 recording from the 1999 Chi-Chi, Taiwan (Mw = 7.6) earthquake, and the Takatori station recording from the 1995 Kobe (Mw = 6.9) earthquake, see Table 3. The corresponding unscaled elastic acceleration spectra compared with the design site spectra per ASCE 7 selected for the specimen are presented in Figure 12.
Original triaxial ground motion records
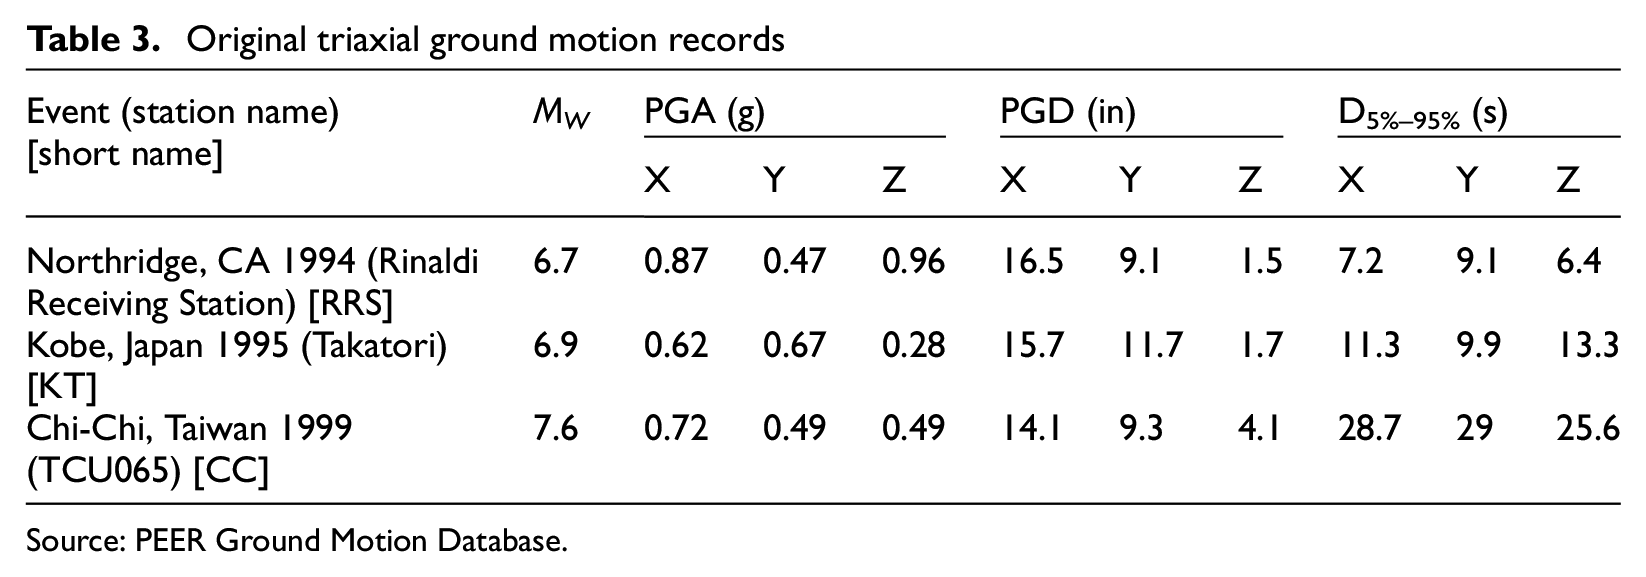
Source: PEER Ground Motion Database.
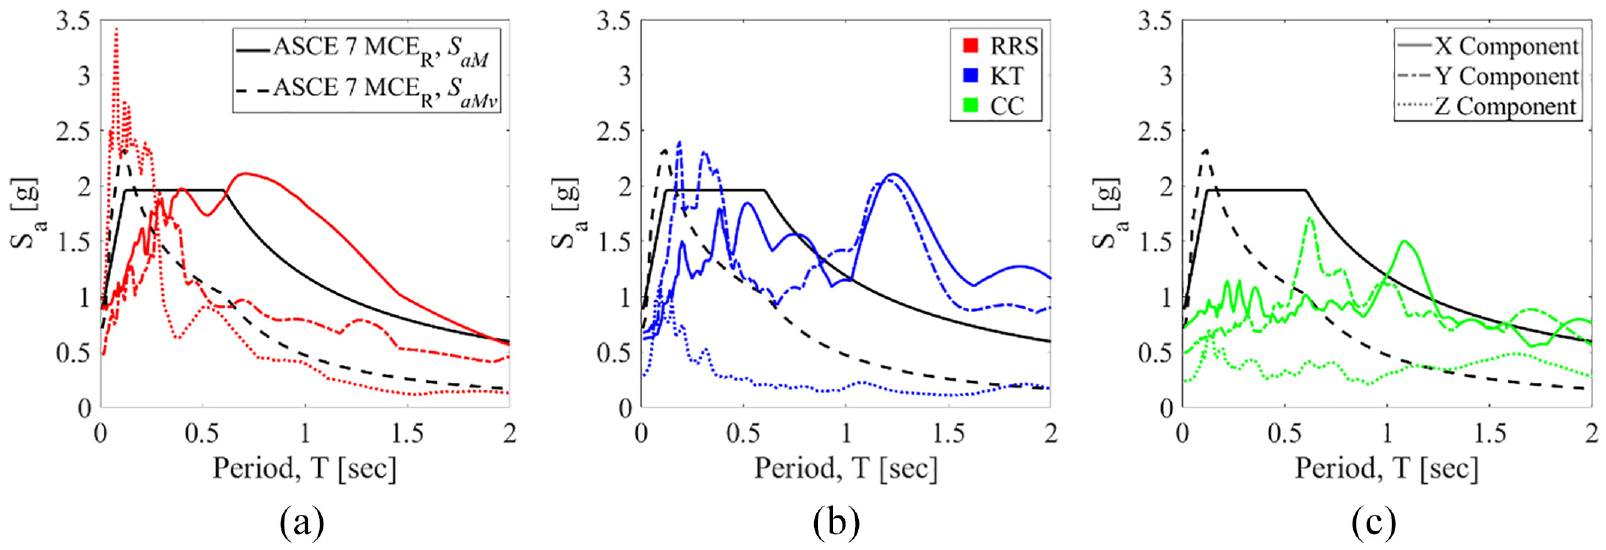
Elastic 5% damped acceleration response spectra of the three seed motions selected for the test program overlaid with the ASCE/SEI 7-22 MCER horizontal (SaM) and vertical (SaMv) response spectra.
Overview of test protocol
A sequence of dynamic tests, including low-amplitude white noise (WN) and earthquake ground motions, were input at the base of the test specimen in each of its configurations. Unidirectional WN tests targeted a 4%g root mean square (RMS) while the combined, bidirectional WN tests targeted 2%g RMS. WN tests had a duration of 64 s, constructed of four 16-swindows with a frequency band of 0.125–25 Hz. The earthquake motions were input in all three translational degrees of freedom (X, Y, and Z), individually and combined. In total, 57 forced vibration tests were conducted, including the 27 low-amplitude WN base excitation tests and 30 earthquake motion tests across all specimen configurations. The earthquake tests were conducted from 12 to 20 May 2022. The primary purpose of sequentially imposing 1-DOF, 2-DOF, then 3-DOF earthquake motions was to evaluate the structural performance of the building specimen and investigate the effects of multi-DOF base excitation, see Table 4.
MTB2 test matrix
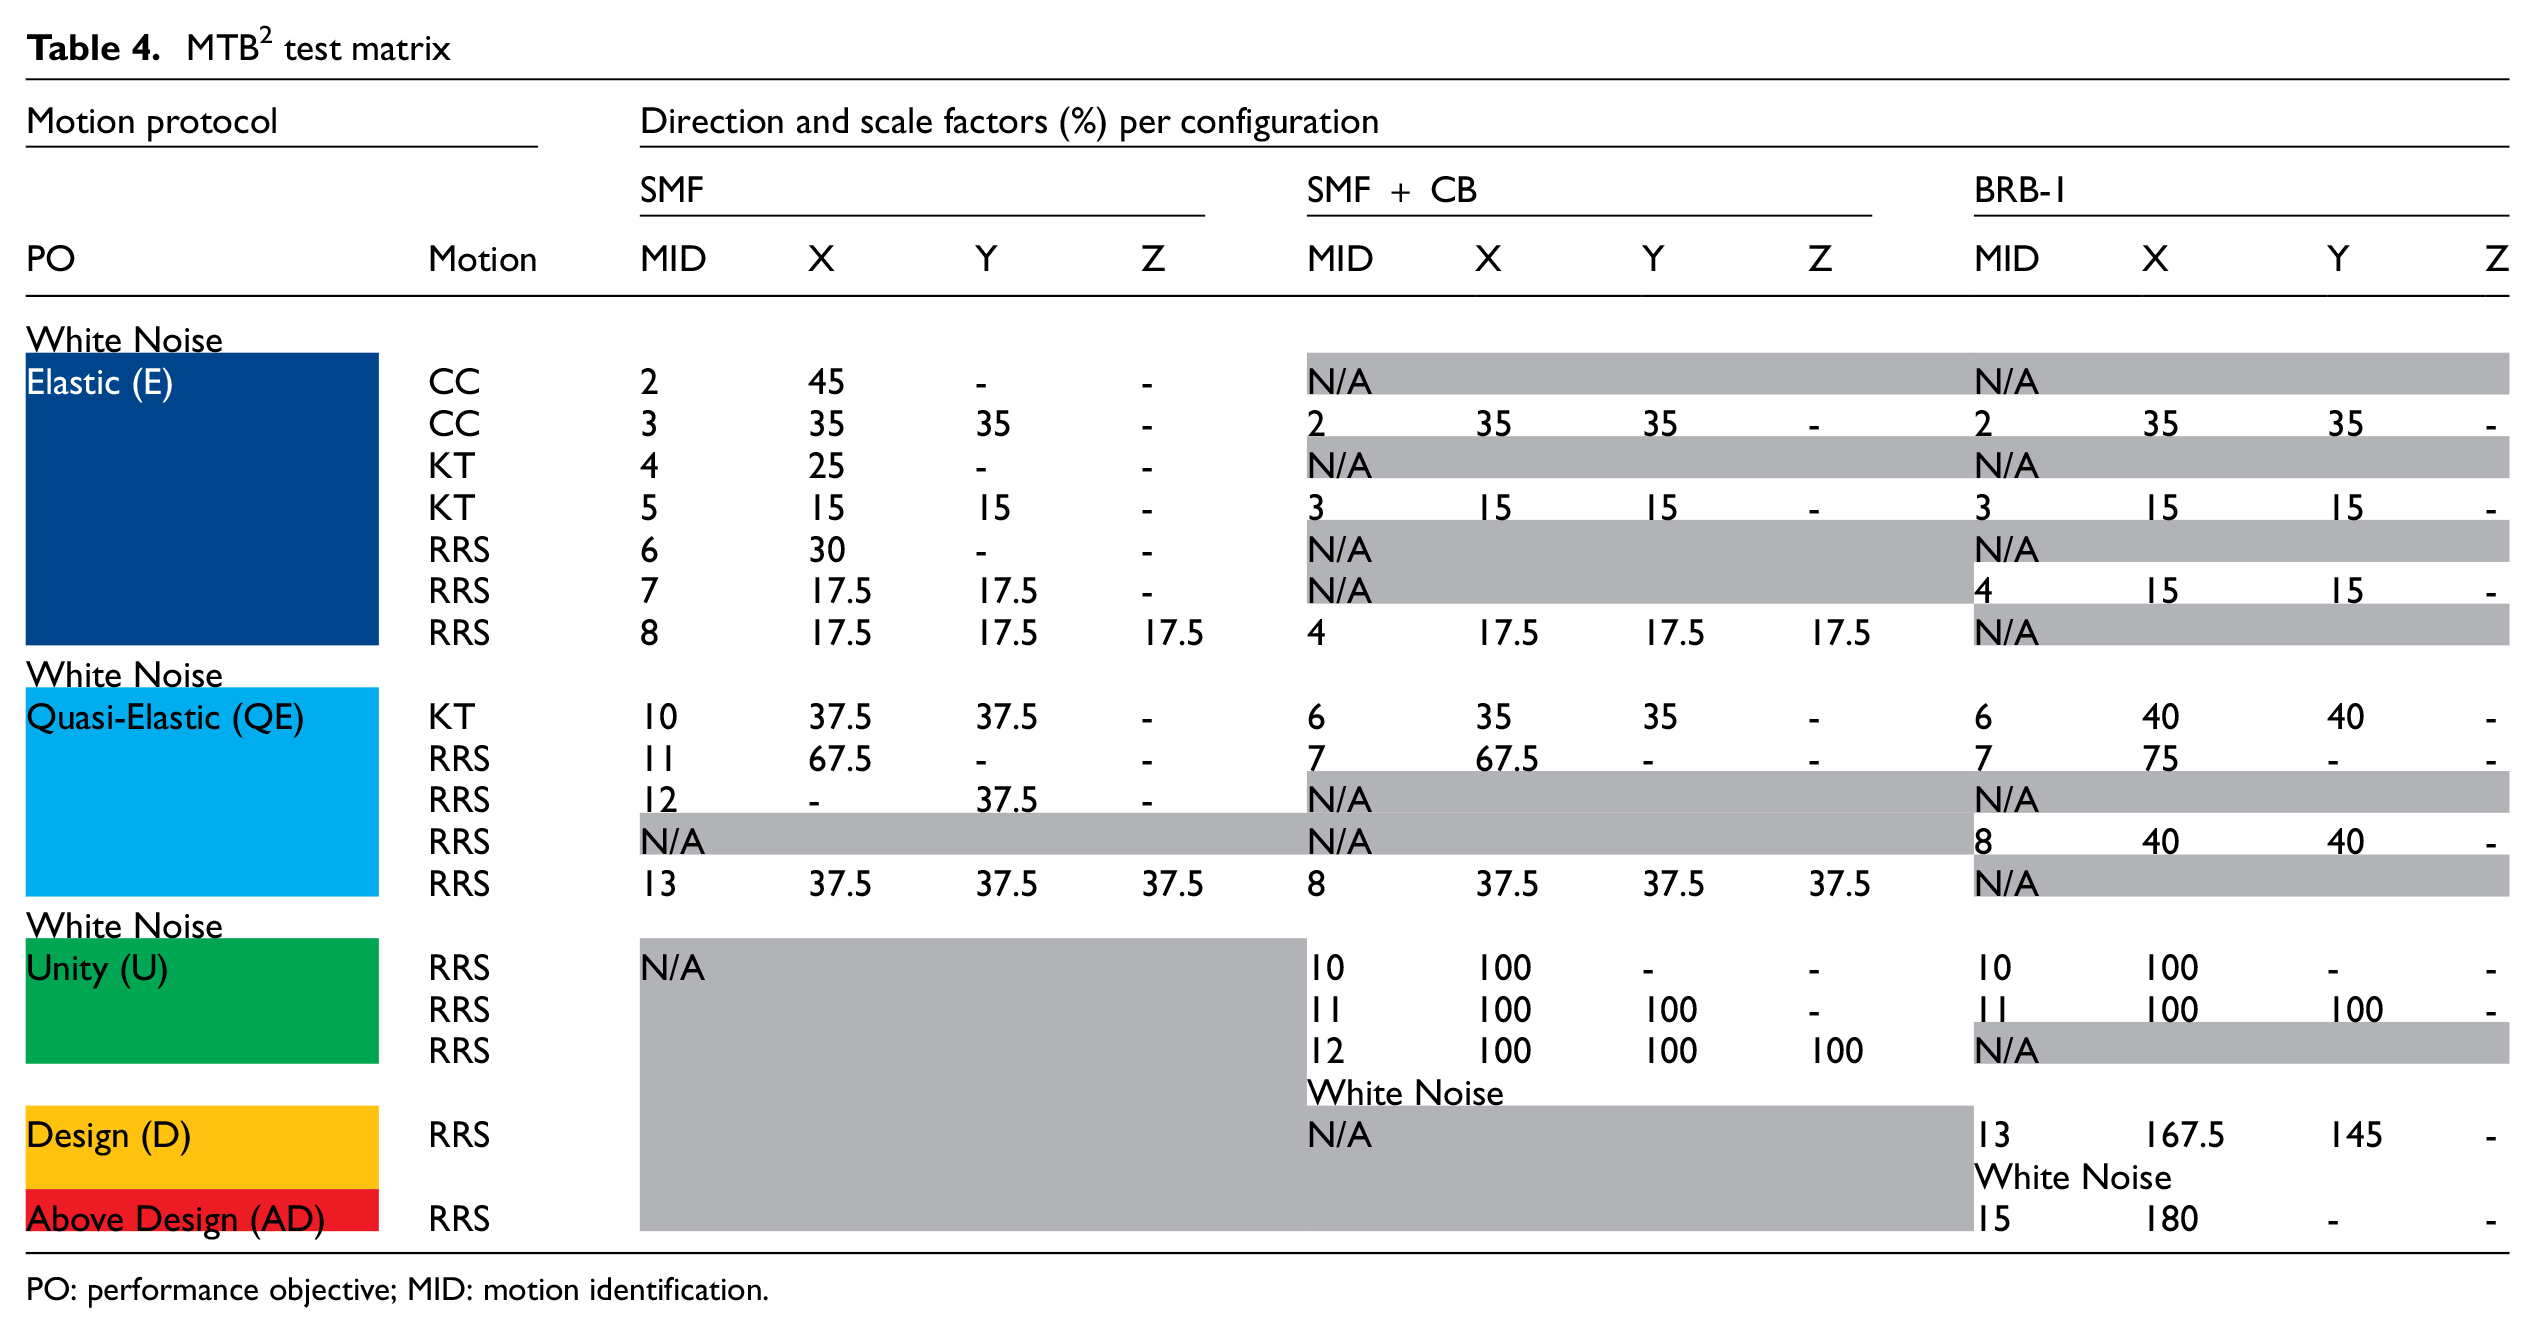
PO: performance objective; MID: motion identification.
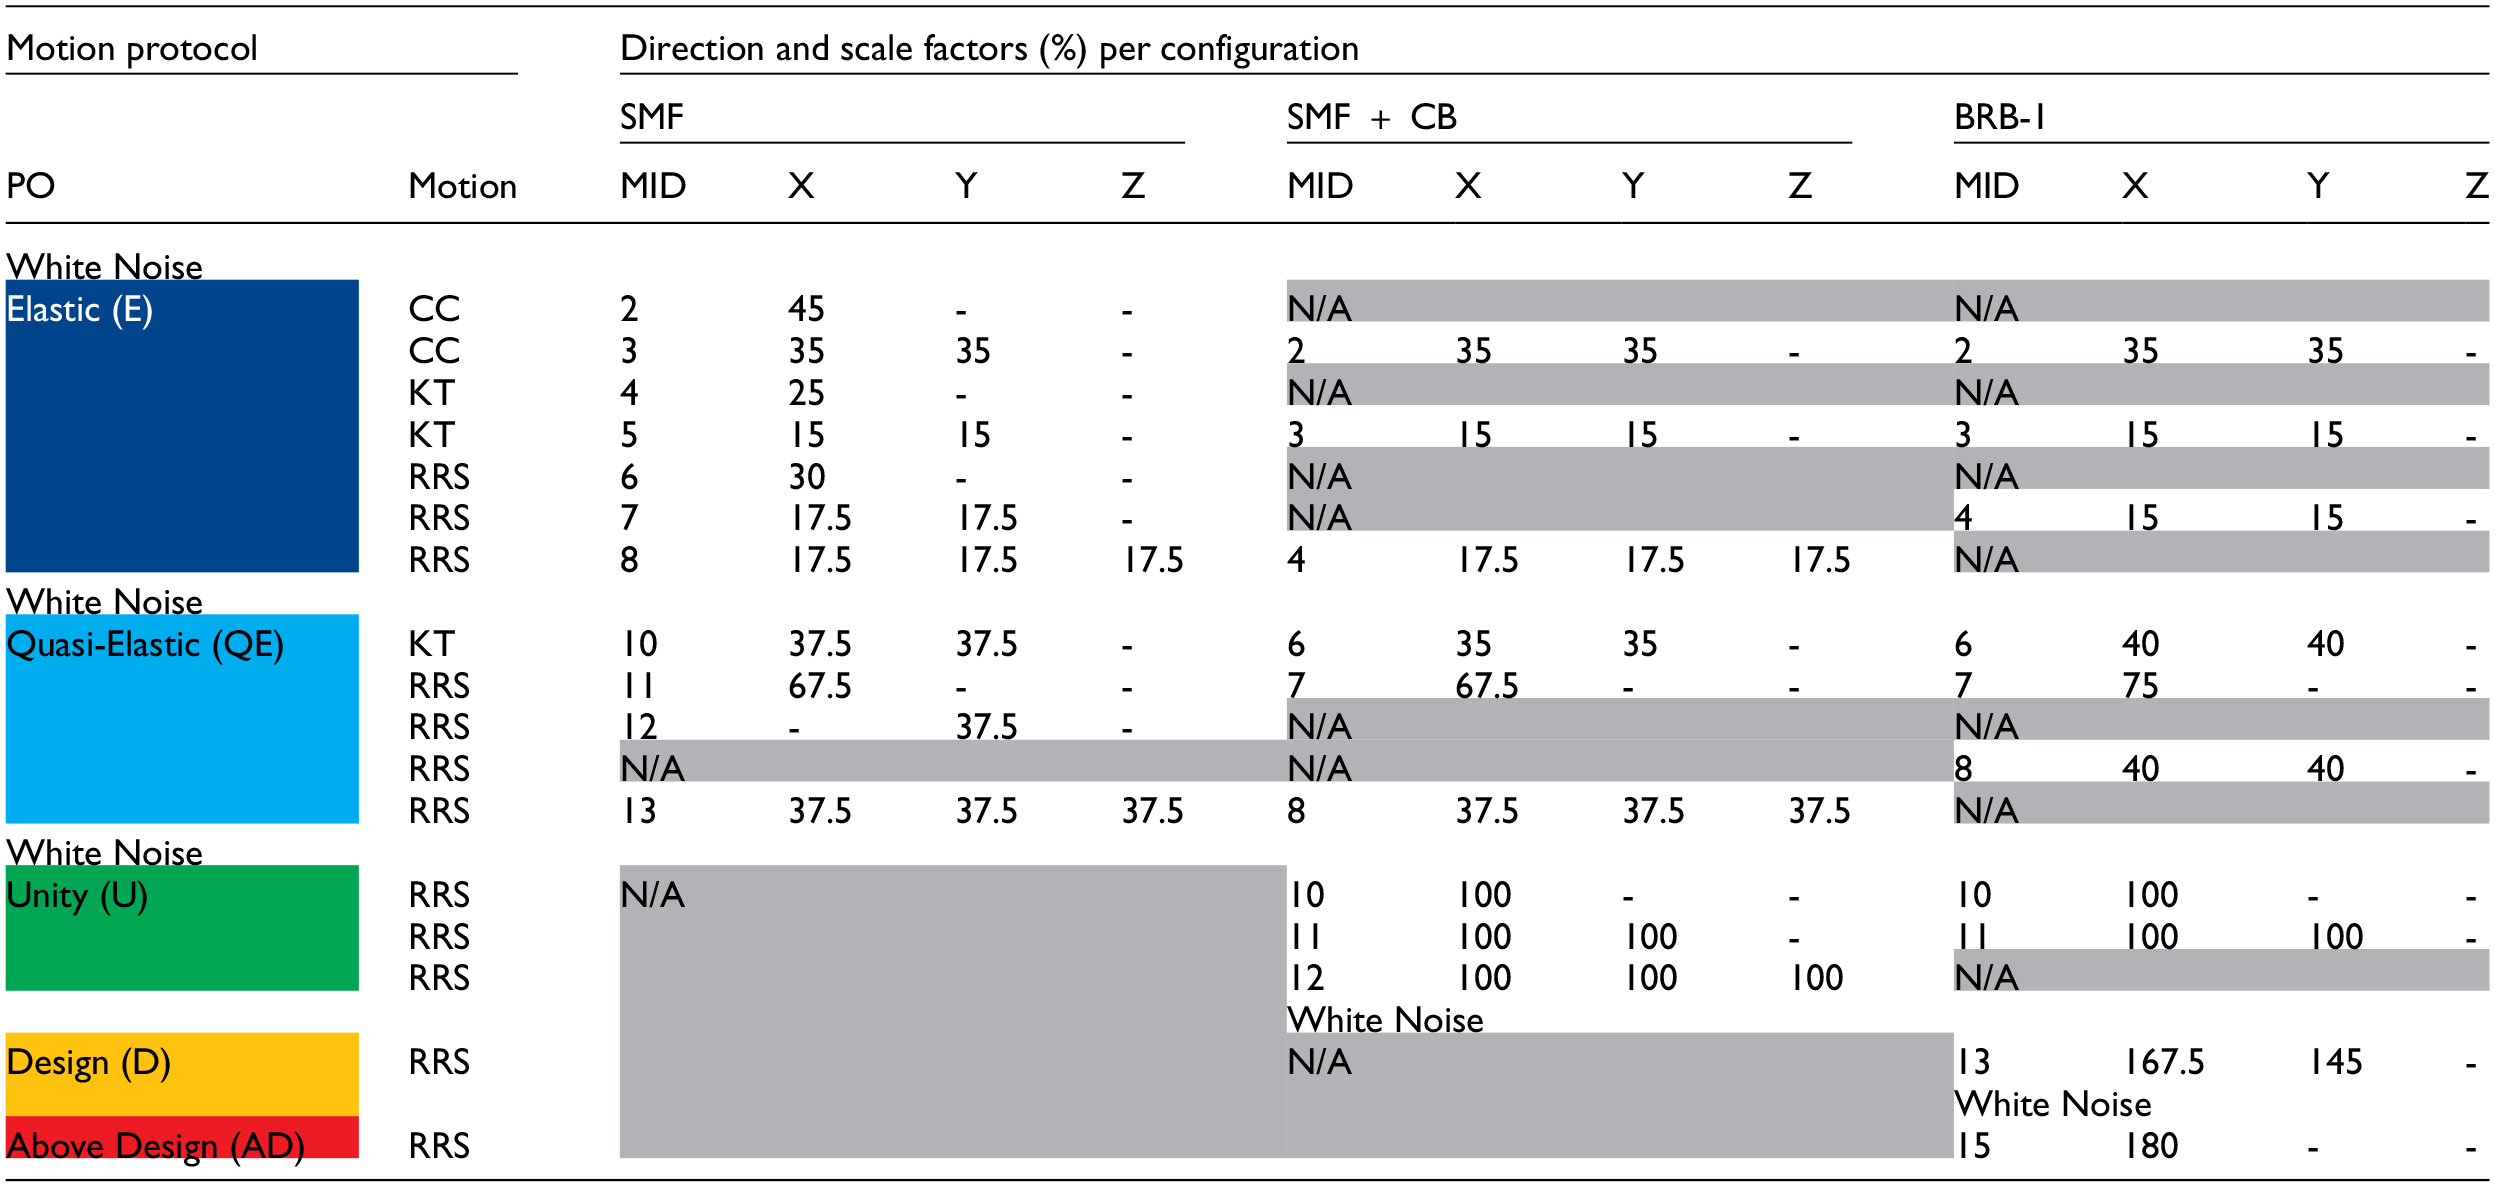
To achieve the desired POs for each specimen configuration, the ground motions were iteratively scaled to achieve the desired limit states using the aforementioned FEM. The motions were not spectrally matched, rather the actual motions were amplitude scaled to achieve the aforementioned limit states corresponding to Figure 6 for the replaceable shear fuses, Figure 7 for the BRBs, and Figure 10 for the compliant baseplates. Elastic motion sequences across all configurations were applied to impose negligible damage to the nonlinear fuses. Quasi-elastic motion sequences were subsequently imposed to achieve first, yielding in approximately one-third of the nonlinear fuses. The SMF configuration was only tested with the quasi-elastic motion sequence, as this assured column hinges would not form. In the SMF + CB configuration, this quasi-elastic sequence was intended to force yielding in the replaceable shear fuses and the most extreme anchors in the compliant baseplates. In the two latter configurations, the unity scaled motions increasing from 1- to 3-DOF input were included for the purpose of evaluating the need to consider MDOF motions in design. During the BRB-1 configuration, 1D and 2D motions were focused on achieving the design and above-design POs. The design level PO for the BRB-1 configuration aimed to achieve 1% strain in the X- and Y-direction BRBs; however, due to displacement limitations of LHPOST6 (to avoid yielding frame members), the scaled amplitude in the NS direction had to be reduced. Thus, the above-design earthquake was run without the Y-component.
Instrumentation
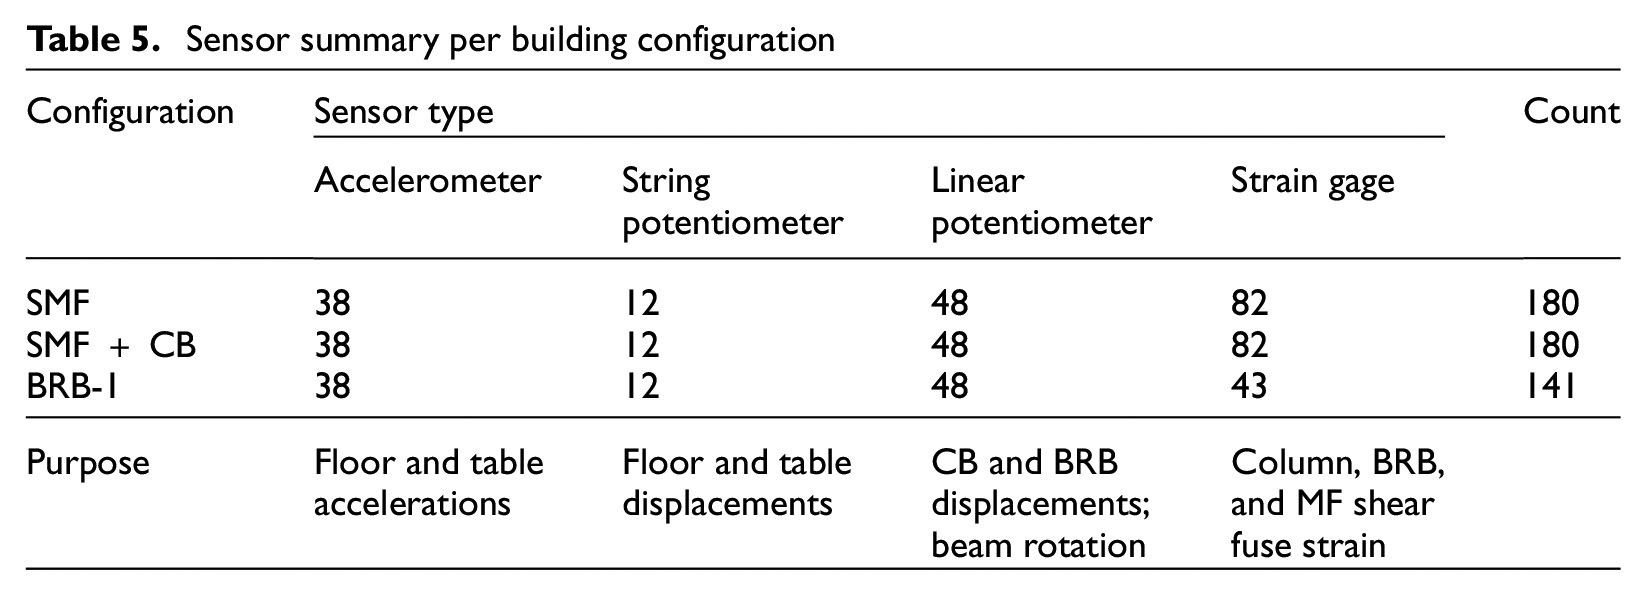
Analog and digital video/still cameras were used to capture the building behavior during all phases of this test program. Specifically, the SMF/SMF + CB and BRB-1 configurations were instrumented with 180 and 141 analog sensors, respectively. Analog sensors included accelerometers, linear potentiometers, string potentiometers, and strain gages, summarized in Table 5. All sensors were connected to a multi-node distributed data acquisition system (DAQ) with a sampling rate of 256 Hz. Video and high-definition cameras were used during the program to capture the physical features of the building specimen’s response. Video cameras included coaxial, GoPro, and high-definition camcorders. These were mounted throughout the interior and exterior of the building to capture the footage of the global structural and local component-level responses. The monitoring system also included unmanned aerial vehicles (UAVs) flown during testing to collect video from aerial views. The DAQ was synchronized with the LHPOST6 controller and the IP video camera recording system.
Sensor summary per building configuration
Results
In what follows, key response measurements are discussed, with the aim of presenting measured dynamic characteristics, global, and local response. Comparison with the design-grade numerical model developed is highlighted to evaluate the robustness of the model.
System identification
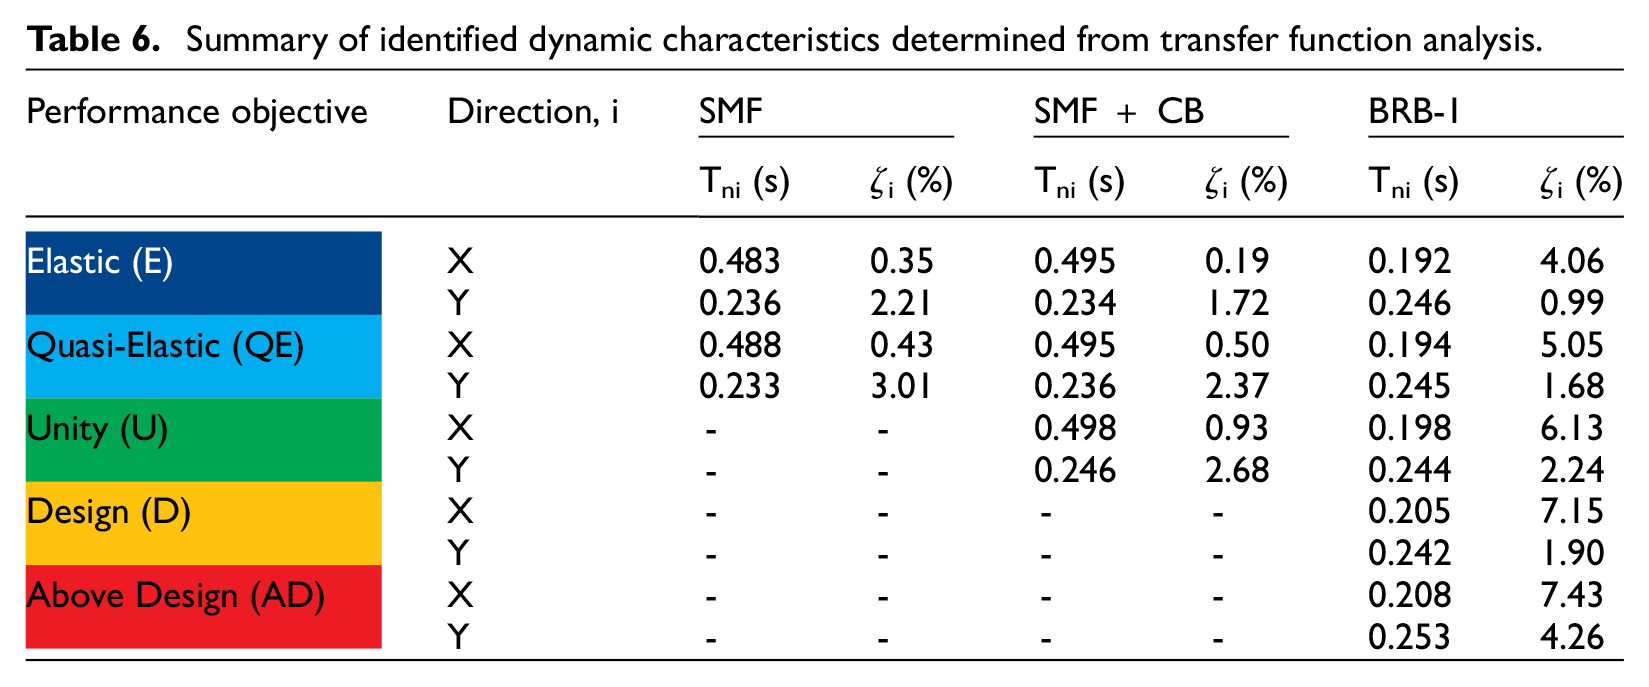
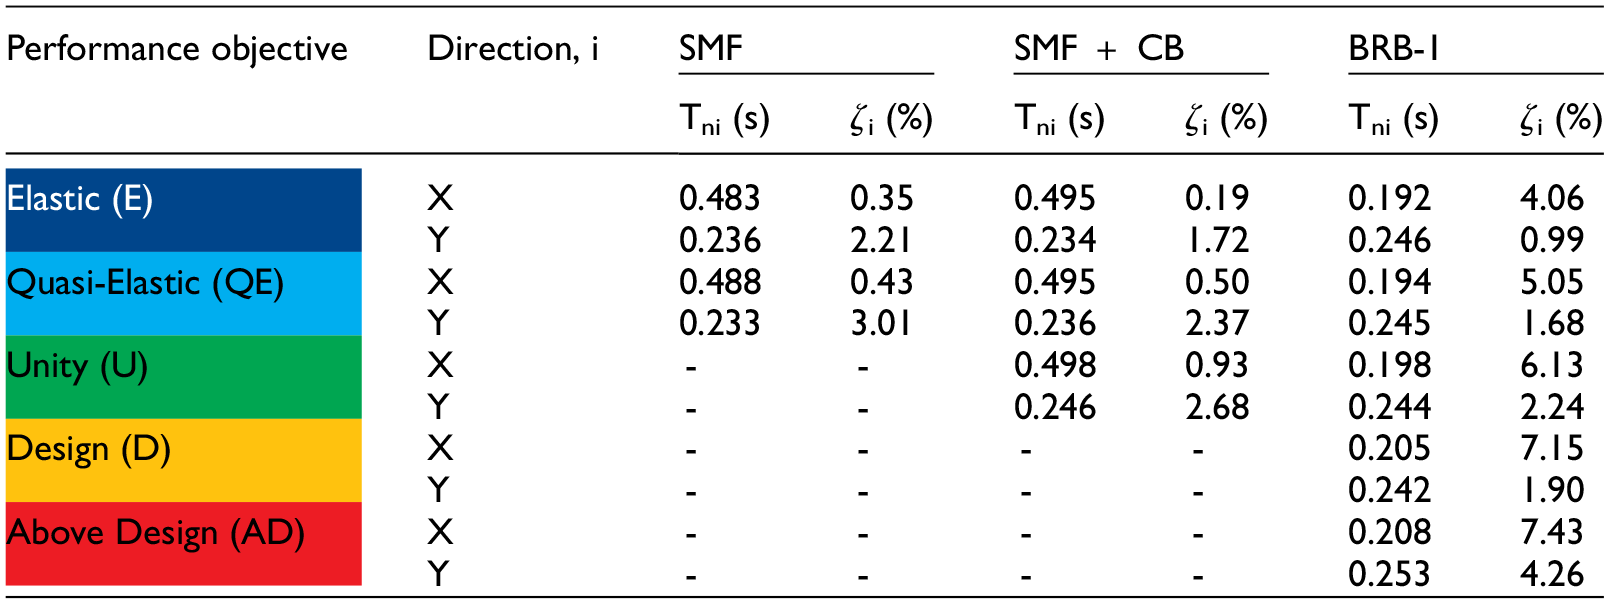
The evolution of modal characteristics was evaluated using frequency domain techniques from low-amplitude WN vibration tests conducted throughout the test program. Specifically, transfer function analysis was performed using WN test responses assuming a single-input single-output system where the frequency response functions (FRFs) were determined for all working sensors, and each superstructure recording (output) was correlated with each platen recording (input) in each direction of interest. The Rational Fraction Polynomial Method (Richardson and Formenti, 1982) was imposed on the FRFs and used to extract natural periods and damping ratios in both the X- and Y-directions, see Table 6.
Summary of identified dynamic characteristics determined from transfer function analysis.
Predominant periods, Tp, are calculated using roof-to-table undamped spectral ratios (Rosenblueth and Arciniega, 1992) for each simulated earthquake test of each configuration. Where the natural period, Tn, of the MTB2 is an intrinsic property of the building based on its mass and stiffness, the predominant period is an intensity- and frequency-dependent characteristic of the ground motion during an earthquake. Figure 13 presents the relationship between the natural periods measured from WN tests compared to the predominant periods determined from each earthquake test for X- and Y-direction input events. Results of the system identification indicate that the predominant periods measured from the Rosenblueth spectral ratios for the KT and CC motions, in general, are within 2% of the natural periods for the all configurations in the X-direction. In an undamped system, the acceleration response of the structure is understood to grow without limit if resonance is achieved. As evident by results presented in Table 6, the system is in fact damped, thus acceleration response will not increase boundlessly in resonance; high levels of floor-level acceleration amplification could be expected to be achieved during the earthquake tests for motions, where Tp and Tn are in proximity to one another.
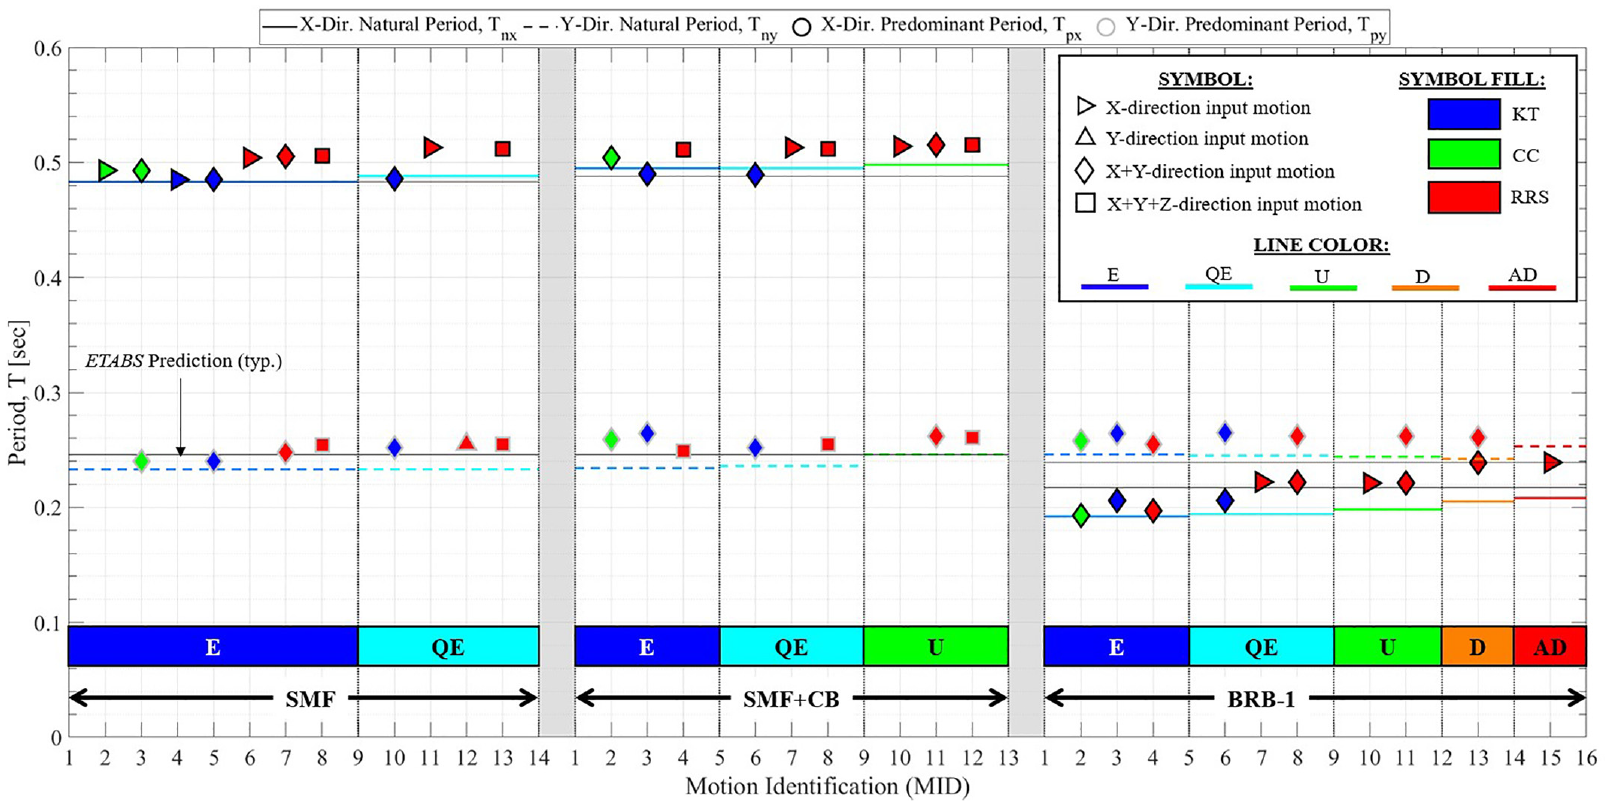
Predominant periods for each seismic test compared to natural periods in X and Y-directions for all three LFRS configurations with FEA predictions overlaid. Note that symbology introduced in the northeast quadrant of this figure is utilized in later plots to present global structural responses unless otherwise noted.
The X-direction natural periods of all configurations increase following each suite of earthquake motions for a given PO, indicating that some level of damage or inelasticity has occurred. Between the SMF and SMF + CB configurations, the X-direction period is increased slightly due to the integration of the rotationally compliant baseplate. In the SMF and SMF + CB configurations, the transverse LFRS of chevron-configured BRBs results in a system approximately twice as stiff in the Y-direction than the X-direction. The BRB-1 configuration results in increasing the X-direction stiffness by nearly 2.5 times, which results in a stiffer system than the Y-direction BRBF. The Y-direction natural periods remain relatively consistent throughout the test program until the building specimen is subjected to the unity (U) motion suite of SMF + CB configuration, indicating this is where some of the transverse BRBs first experience a non-negligible amount of inelastic deformation. The natural periods then remain relatively consistent until the building specimen is subjected to even greater Y-direction excitation in the BRB-1 configuration, after the design (D)-level PO suite, where further inelastic deformation was imposed beyond what was experienced initially in the SMF + CB configuration. The FEA consistently provides a reasonable estimate of both Tnx and Tny across all configurations.
Regarding the system identification damping results presented in Table 6, several key observations are noted. Damping in the BRB-1 configuration ranges from around 4% to 7% through the motion suite in the X-direction, the largest among all LFRS and coincides with an increase in Tnx. Damping in the Y-direction is also beneficially high offering approximately 2% consistently across the suite, with a gradual increase during the SMF and SMF + CB configuration. In the SMF and SMF + CB configurations, the Y-direction damping is consistently larger than the less stiff X-direction LFRS (> 1.5%) but less than that of the X-direction in the BRB-1 direction, likely due to the longer individual BRBs. The relatively smaller damping ratios identified in the X-direction may be due to the nature of the WN excitation capabilities of the shake table, which more readily imparts higher frequency input as the BRBF LFRS is stiffer. Although the Y-direction LFRS is constant throughout the test program, damping in the Y-direction decreases when in the BRB-1 configuration compared to the previous two test configurations. This is likely due to the relative stiffnesses of the orthogonal LFRS where the stiffness is greater in the X-direction attracting higher damping in this direction in this test configuration.
Global structural response
Raw acceleration measurements for all motions were baseline-corrected then filtered using a fourth-order bandpass Butterworth filter with corner frequencies of 0.25 and 30 Hz. Processed acceleration measurements from accelerometers were averaged at each building level then double-integrated and detrended to obtain floor-level displacement time histories used to subsequently obtain interstory drift measurements calculated as the difference of displacements between adjacent floors. Interstory drifts were normalized by the floor height to calculate interstory drift ratios, thus these values are presented as a percentage. Peak positive and negative responses are preserved to characterize the asymmetric demands.
To directly compare structural response between configurations under theoretically identical input conditions, Figure 14 presents the floor-level acceleration response comparison between the SMF + CB and BRB-1 configurations under 100% X and Y RRS base excitation (MID 11). These results show that the peak acceleration response achieved in this motion is comparable between the two configurations on all three floors although slightly higher accelerations are achieved in the SMF + CB configuration. This figure also reveals the proximity of the structures’ first natural period in the X-direction (dashed lines) relative to the peaks of the floor-level acceleration response spectra indicating high floor-level acceleration amplification. Note that additional comparisons with consistent observations may be found in the work by Morano et al. (2024c).
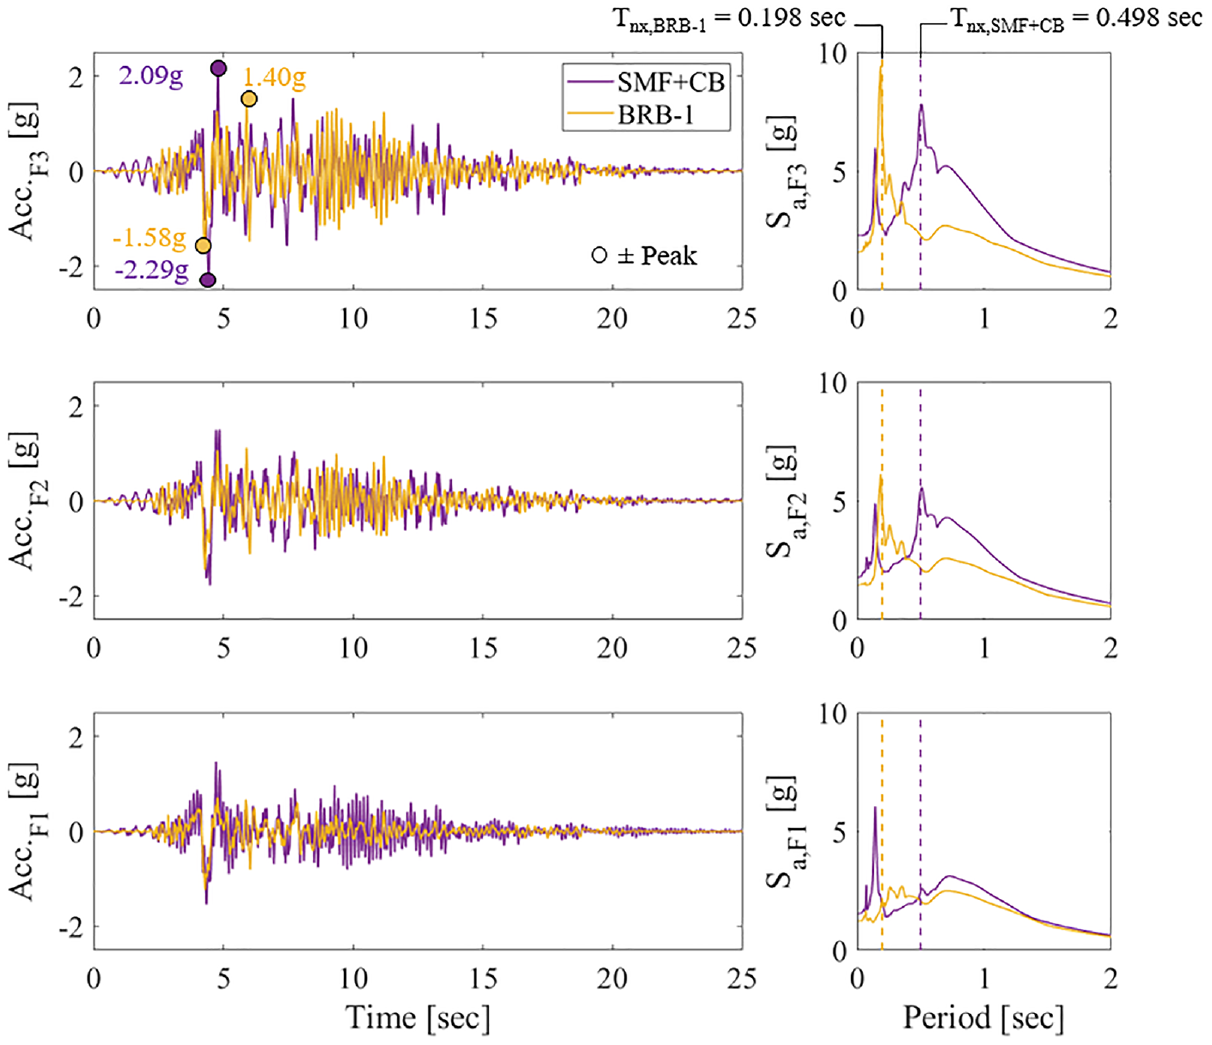
Comparison of X-direction floor level acceleration response in time and frequency domains (floor level acceleration response spectra, ζ = 5%) for the SMF + CB and BRB-1 configurations under identical (target) motion input: 100% X + Y RRS (MID 11).
Figure 15 presents the ratio of peak floor acceleration (PFA) to peak input acceleration (PIA) profiles along the height of the structure. Figure 16 presents the corresponding peak interstory drift ratios (PIDRs) for the three longitudinal LFRS. Because the transverse frames remained constant throughout the test program, PFA, PFA/PIA, and PIDR results from all three configurations in the transverse direction are summarized in Figure 17. The PFA profiles are compared to codified estimates and are useful when designing NSCs. Presently, the design of acceleration-sensitive NCSs requires the estimation of floor-level acceleration amplification. ASCE/SEI 7-22 (ASCE and SEI, 2022) presents two estimation methods for the acceleration amplification factors, Hf. Equation 13.3-4 is permitted when the approximate fundamental period of the structure is known, and Equation 13.3-5 is permitted for use when the period is unknown. In Figure 15, Hf profiles using Equation 13.3-4 are presented using calculated natural period data determined from WN tests at each performance target as summarized in Table 6. Note in Figures 15c and 17b, only one Equation for Hf is plotted because where the LFRS is a BRBF, Equation 13.3-4 is equal to Equation 13.3-5.
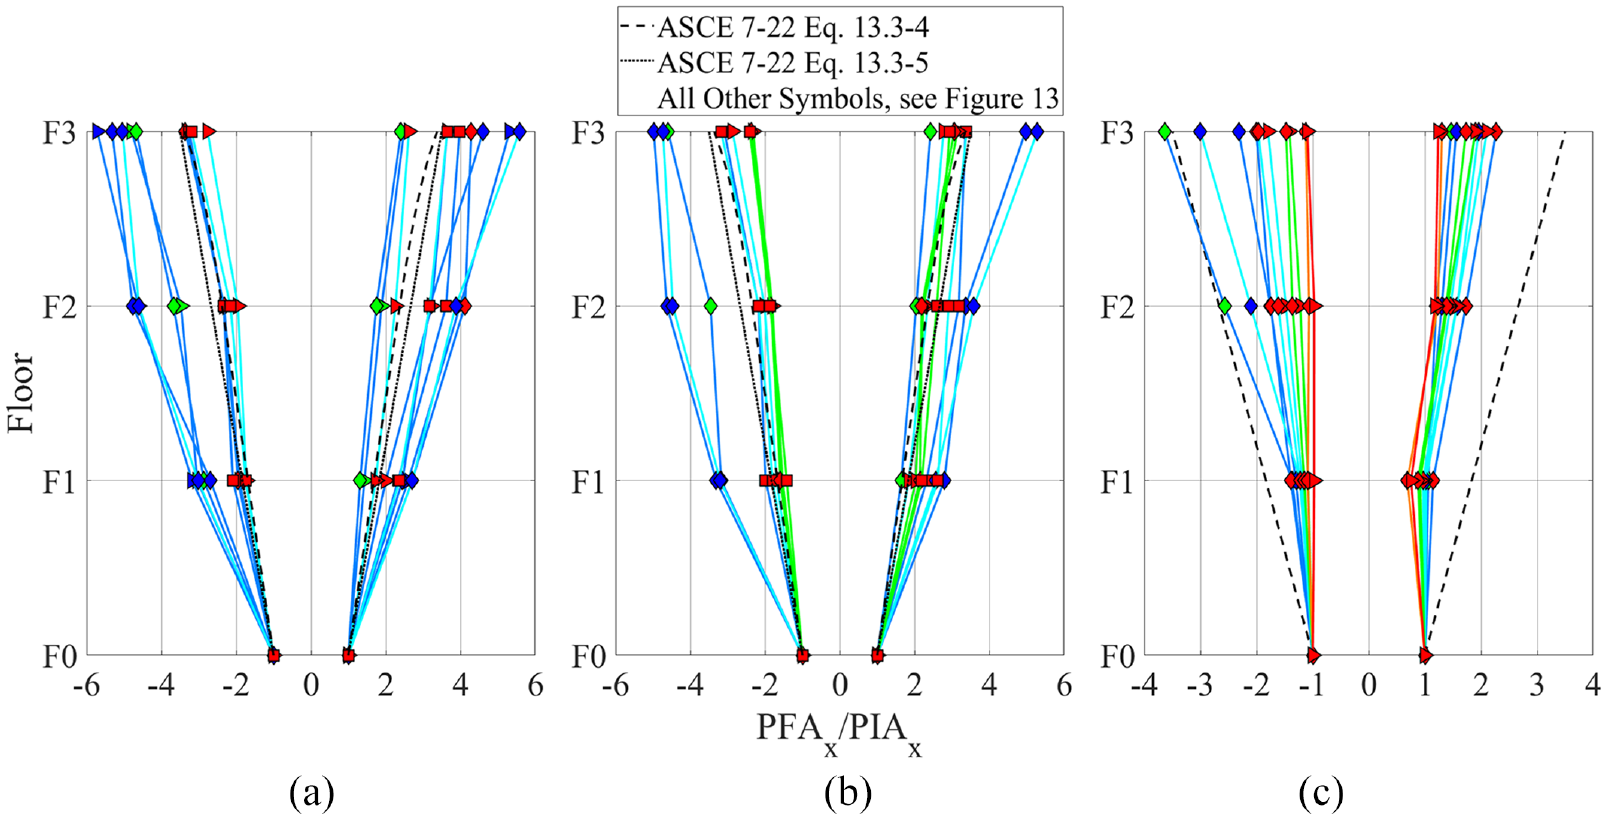
PFA/PIA profiles measured in the X-direction of shaking for (a) SMF configuration; (b) SMF + CB configuration; and (c) BRB-1 configuration. Equations 13.3-4 and 13.3-5 are from ASCE 7-22 (2022). The x-axis limits are not the same across the subfigures.
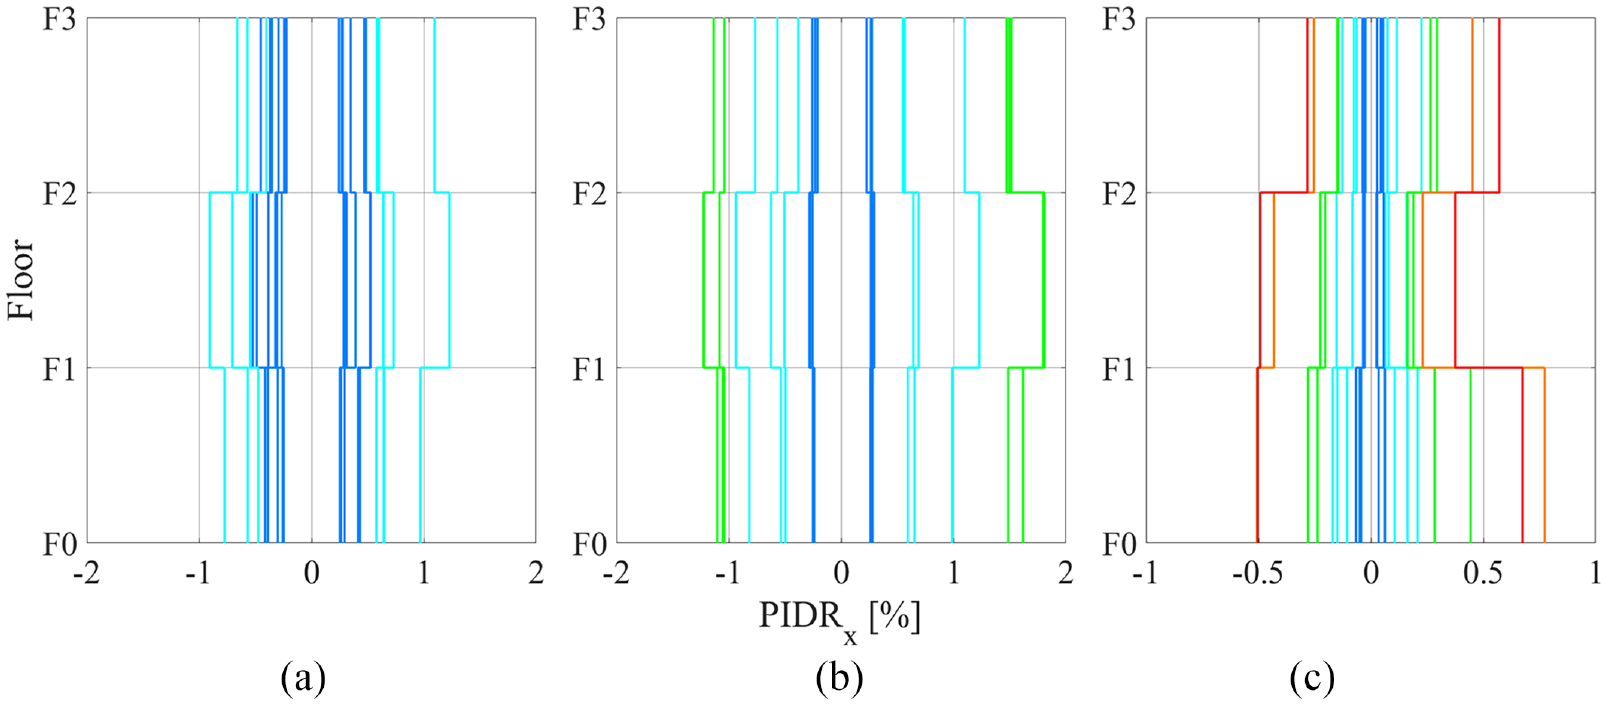
PIDR profiles measured in the E-W (X) direction of shaking for MID containing an X input component for (a) SMF configuration; (b) SMF + CB configuration; and (c) BRB-1 configuration. Legend per Figure 13. The x-axis limits are not the same across the subfigures.
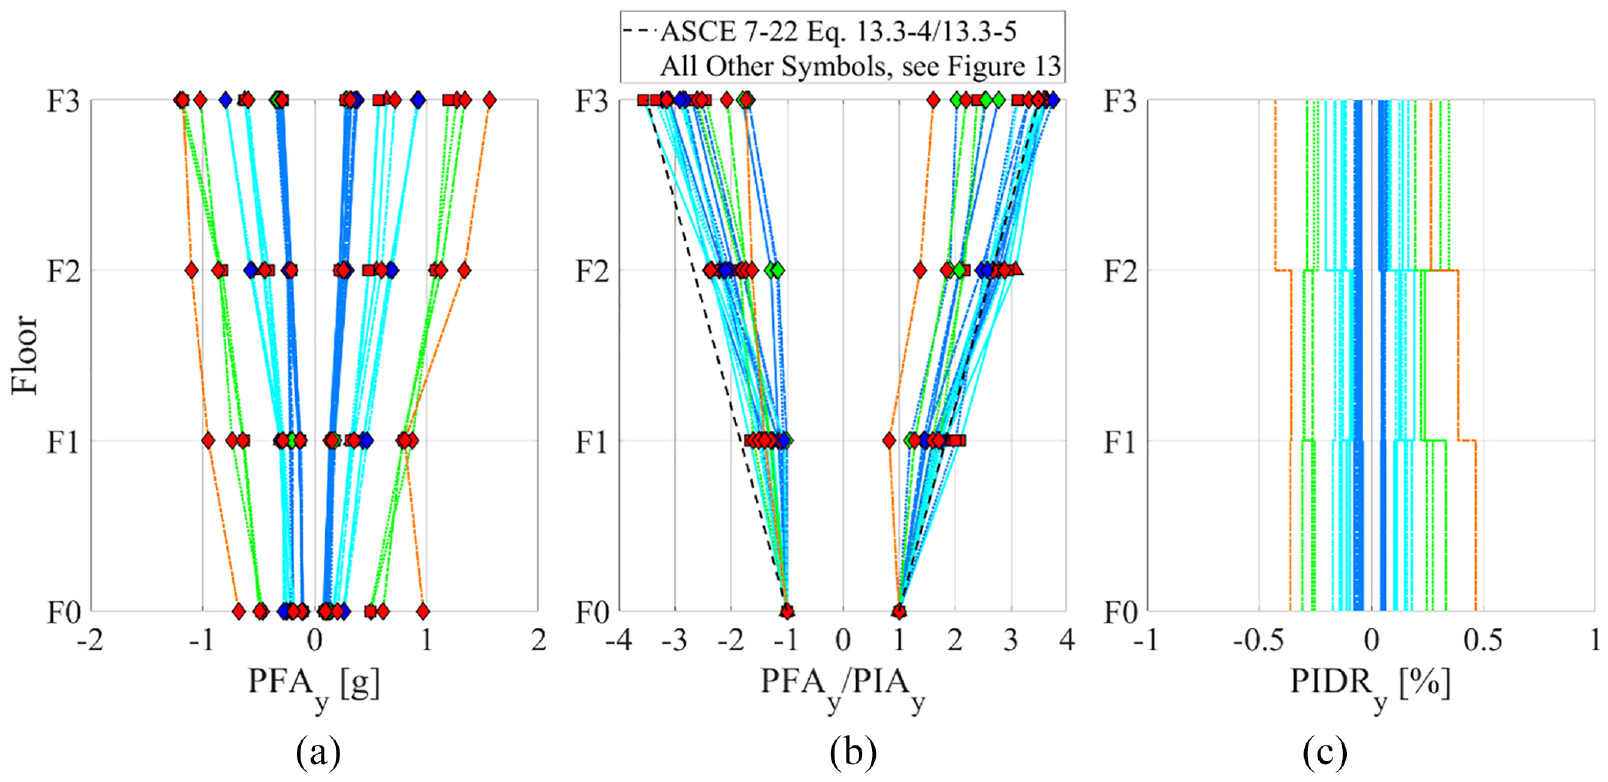
Global response profiles measured in the N-S (Y) direction of shaking across all three configurations with MID containing a Y input component. (a) absolute floor acceleration profiles; (b) PFA/PIA profiles; and (c) PIDR profile.
Figure 15 summarizes the X-direction acceleration amplification trends and indicate a decrease in floor-level acceleration amplification with an (1) increase in ground-motion intensity (PIAx) and (2) an increase in the difference between Tnx and Tpx. In the transverse (Y) direction, although the ASCE/SEI 7-22-codified Hf profile is defined for design-level events, the PFAy/PIAy results presented in Figure 17b indicate that the Hf profile generally overestimates the recorded acceleration amplification profiles from earthquake tests for even elastic-level events. It should be reiterated that in the transverse (Y-direction), the LFRS is a chevron BRBF across all configurations. This result is consistent with the results of the BRB-1 configuration in that across all motions, the codified profile to estimate floor-level acceleration amplification overestimates test results, in general. In addition, a trend realized in the Y-direction results is the general decrease in floor-level acceleration amplification as motion intensity increases.
Figure 18 presents a comparison of floor-level acceleration amplification factors as a function of absolute PIA and percentage difference between the natural and predominant periods in the Y-direction. The percentage difference between natural and predominant periods in the Y-direction ranges between approximately 3% and 13%, and results indicate there is no discernible trend in relation to the calculated acceleration amplification at each floor as shown in Figure 18b. However, there is a trend when compared to PIA shown in Figure 18a. Results indicate that there is a reduction in floor-level acceleration amplification which trends away from the codified estimation as the PIA is increased. Moreover, the results indicate that a level of saturation is being achieved as the results on each floor level approach a value of one at high input accelerations, that is, the PFA realized on all floors is nearly equal to the PIA at large PIAs. This saturation behavior is like that observed in the X-direction of the BRB-1 configuration seen in Figure 15c.
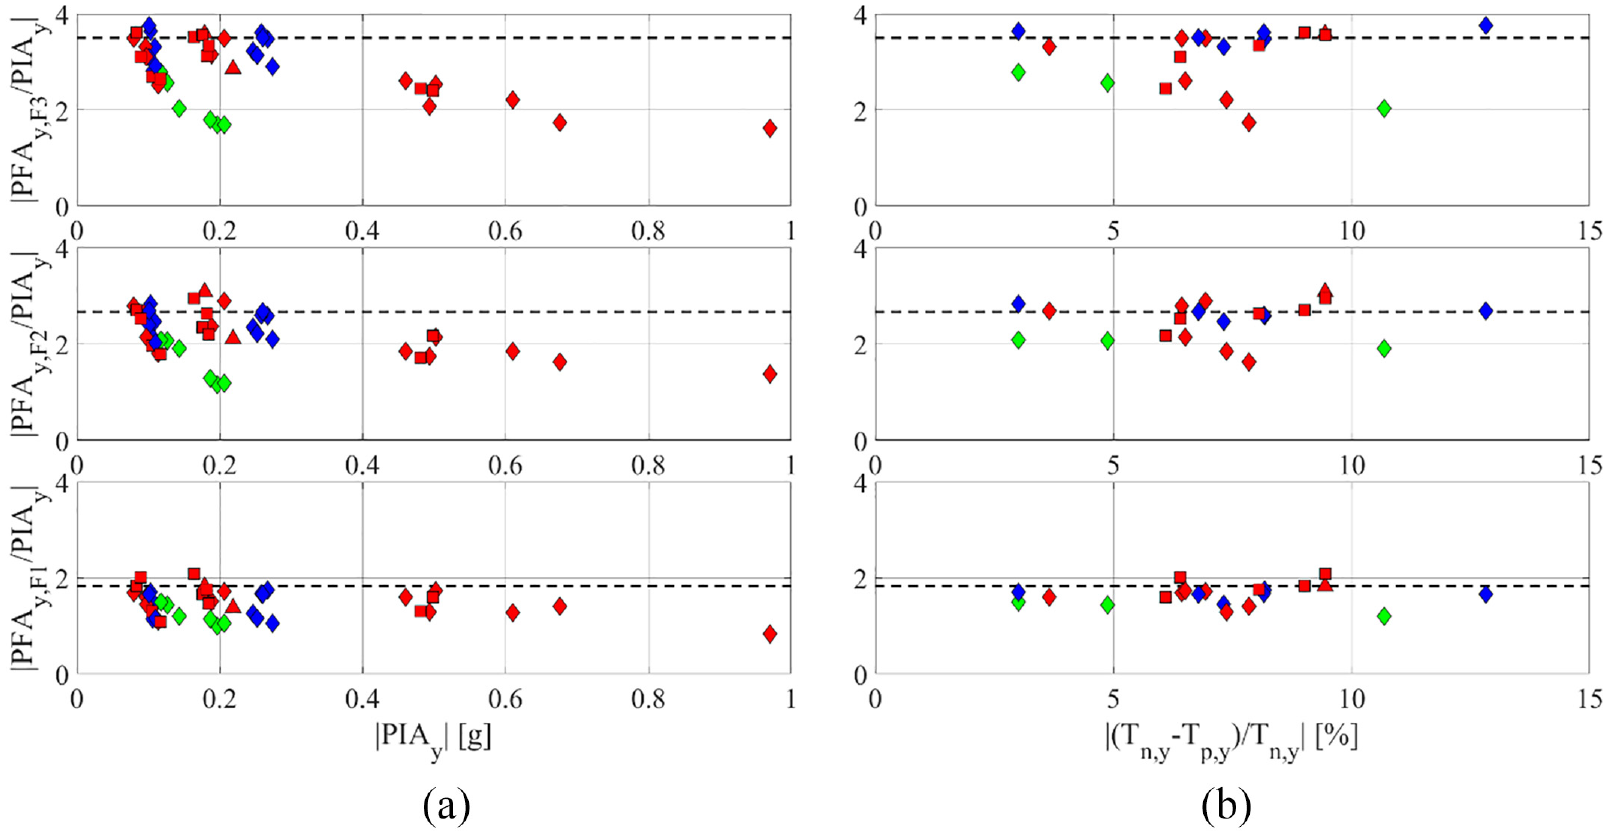
Absolute peak floor level acceleration amplification from all Y-direction tests across the three configurations as a function of (a) absolute peak input acceleration; and (b) percent difference between natural and predominant period. Dashed lines indicate the Hf predictions at each floor level.
X-direction PIDR results shown in Figure 16 indicate an increase in PIDR with an increase in input motion intensity, in general, across all configurations. The largest PIDR in the SMF configuration is achieved at the highest scaled X-direction QE motion (MID 12) and equal to nearly 1.25%. In the SMF + CB configuration, the highest PIDR is achieved in one of the three unity motions (MID 12) and equal to nearly 1.80%; it should be noted that the largest PIDR is almost equal across all three unity motions. The largest X-direction PIDR in the BRB-1 configuration is achieved in the largest biaxial (2-DOF) input motion (MID 13) and nearly equal to 0.8%; however, although this peak PIDR is realized on the first story, greater PIDRs are realized on the remaining floors for the highest scaled X-direction input motion (MID 15) as shown in Figure 16c. It is notable that the largest PIDR results realized are all in the positive X-direction due to the directionality of the input RRS seed motion. Results of the PIDR for the SMF and SMF + CB configurations presented in Figure 16a and b, respectively, indicate that the greatest PIDR is realized in the second story of the MTB2 for all POs with nearly symmetric response of PIDR which increases as motion intensity increases on average. For the BRB-1 configuration, the greatest PIDR is realized on the first floor with asymmetric response in the positive and negative directions of shaking with the smallest PIDR in the positive X-direction being realized on the second story. In the Y-direction, PIDR results presented in Figure 17c show that the largest PIDRs in general are achieved in MID 13 of the BRB-1 configuration, which is the test including the highest scaled Y-direction input component. The largest PIDR realized from this test is achieved in the first story and is approximately 0.5%.
To evaluate the evolution of stiffness throughout the test program, base shear versus roof drift hysteresis response is determined for all motions. Examples of these curves are presented in Figure 19, one for each configuration at the highest level of ground-motion scaling in the X-direction of acceleration input. Then, by determining the peak negative and positive roof displacements, which are indicated on these plots by solid-colored circles, a secant line can be connected between the two and the slope of this line is defined as the secant stiffness, Ksec. The base shear versus roof drift histories are compared to the NLTH FEA using the achieved table motions. Figure 19 demonstrates a favorable comparison between the estimated capacity and measured base shear versus roof drift across all configurations. A more comprehensive comparison of the NLTH to the measured response of each configuration is reported in Figure 20, which compares the measured and estimated peak roof-level displacements for all tests in the X- and Y-directions of shaking. Results in Figure 20a show that, in general, the SMF and SMF + CB measured results are greater than those predicted from FEM simulations while the BRB-1 results match closer to predictions. Nevertheless, approximately 50% of measured results are within 20% of FEA predictions. Y-direction results, where the transverse frame is consistent throughout all configurations, presented in Figure 20b reveal better correlation to simulation results where over 60% of results are within 20% of predictions. This comparison reveals that FEA reasonably captured the measured displacement response of the MTB2. To further interrogate the displacement response of the MTB2, Figure 21 reports the measured to predicted PIDRs. In the X- and Y-directions, measured interstory drift response is predicted by FEA with approximately 70% of results within 20% accuracy on Stories 1 and 2. The largest discrepancy between measured and predicted results is within Story 3 for the X- and Y- directions, where less than 10% of results are accurately captured by FEA. This finding indicates that the measured response is generally less stiff than that predicted by the numerical model on Story 3, particularly in the Y-direction. However, it should be noted that the PIDRs recorded in Story 3 are significantly lower than those on the first two stories, where simulations are far more accurate and the larger PIDRs would be ultimately selected for design.
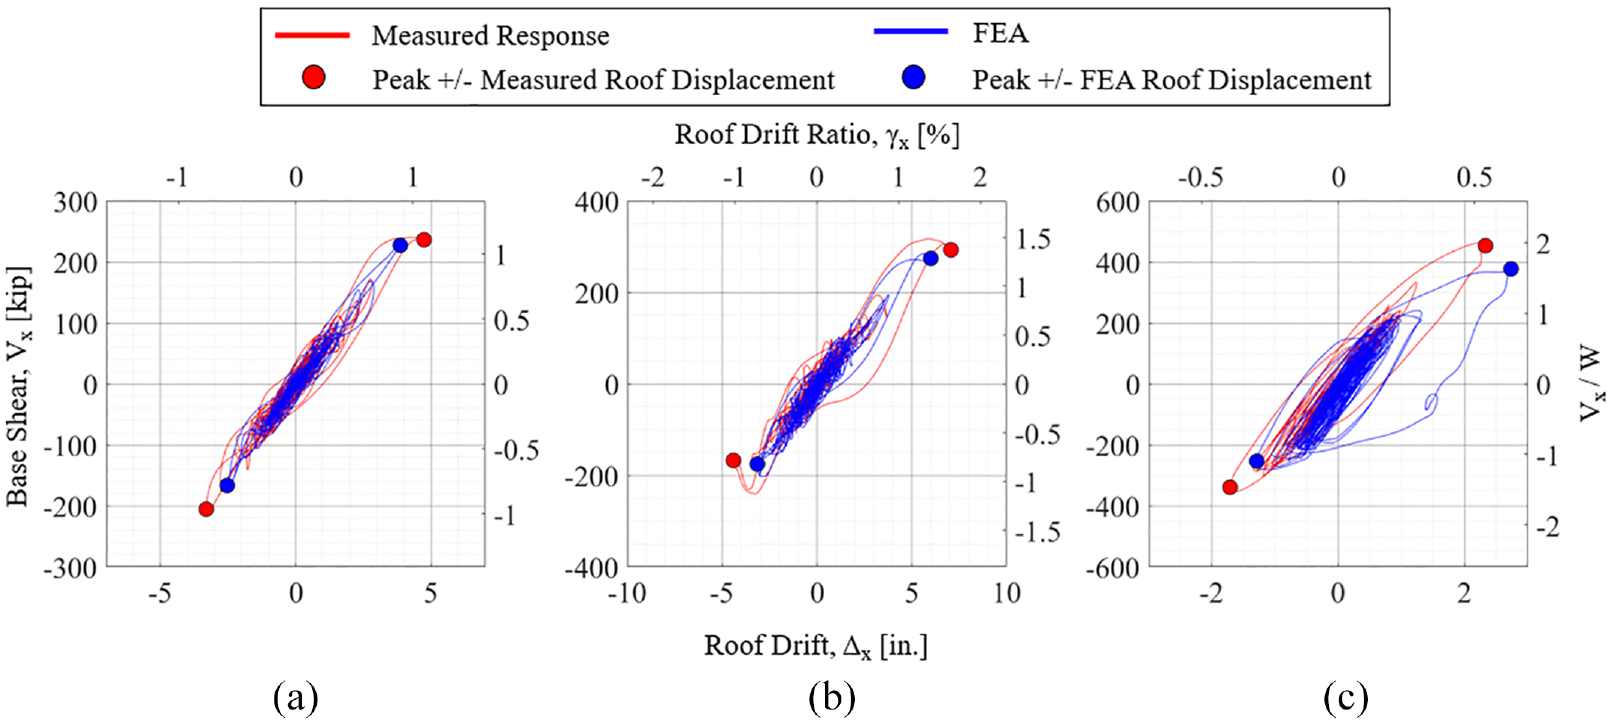
Base shear versus roof drift hysteresis (largest X-direction input) comparison of measured response versus FEA: (a) SMF configuration MID 11; (b) SMF + CB configuration MID 13; and (c) BRB-1 configuration MID 15.
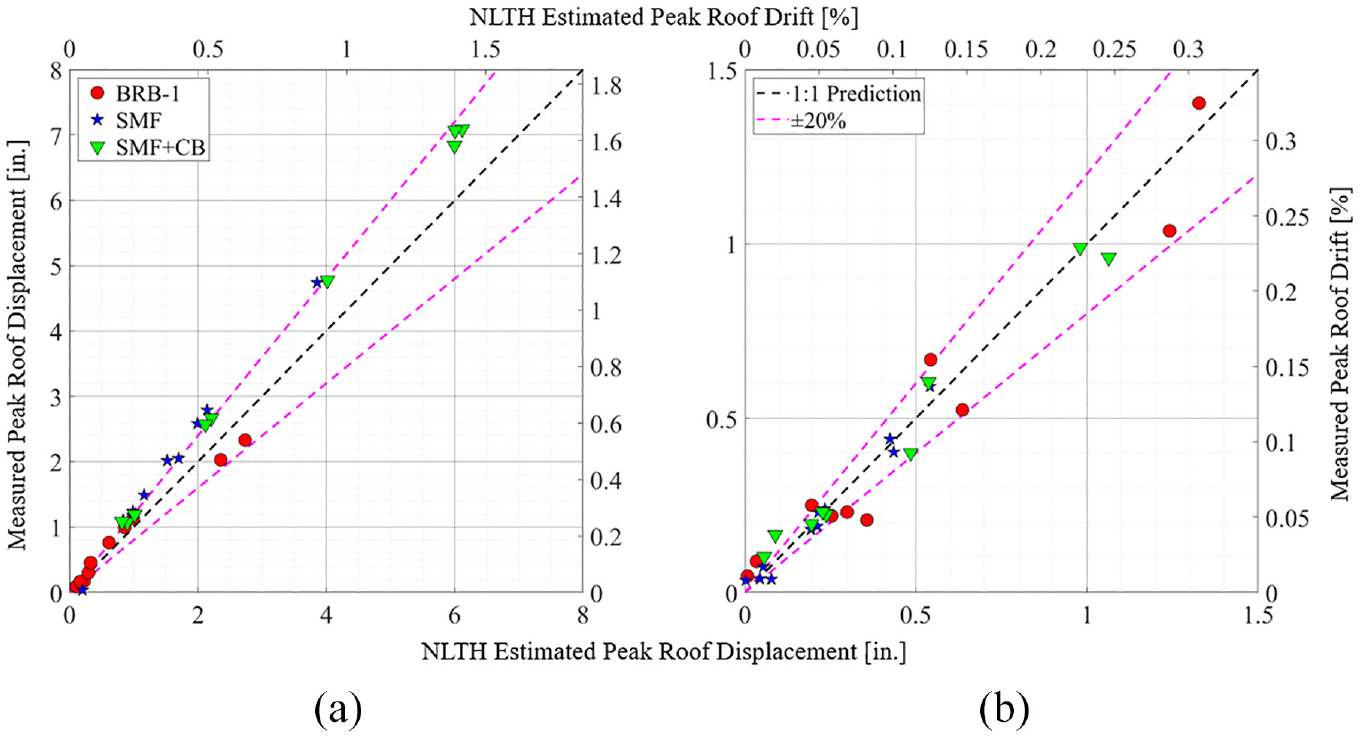
Peak roof drift estimated from NLTH FEA compared to the measured peak roof drift for all ground motion tests in (a) the X-direction; and (b) the Y-direction.
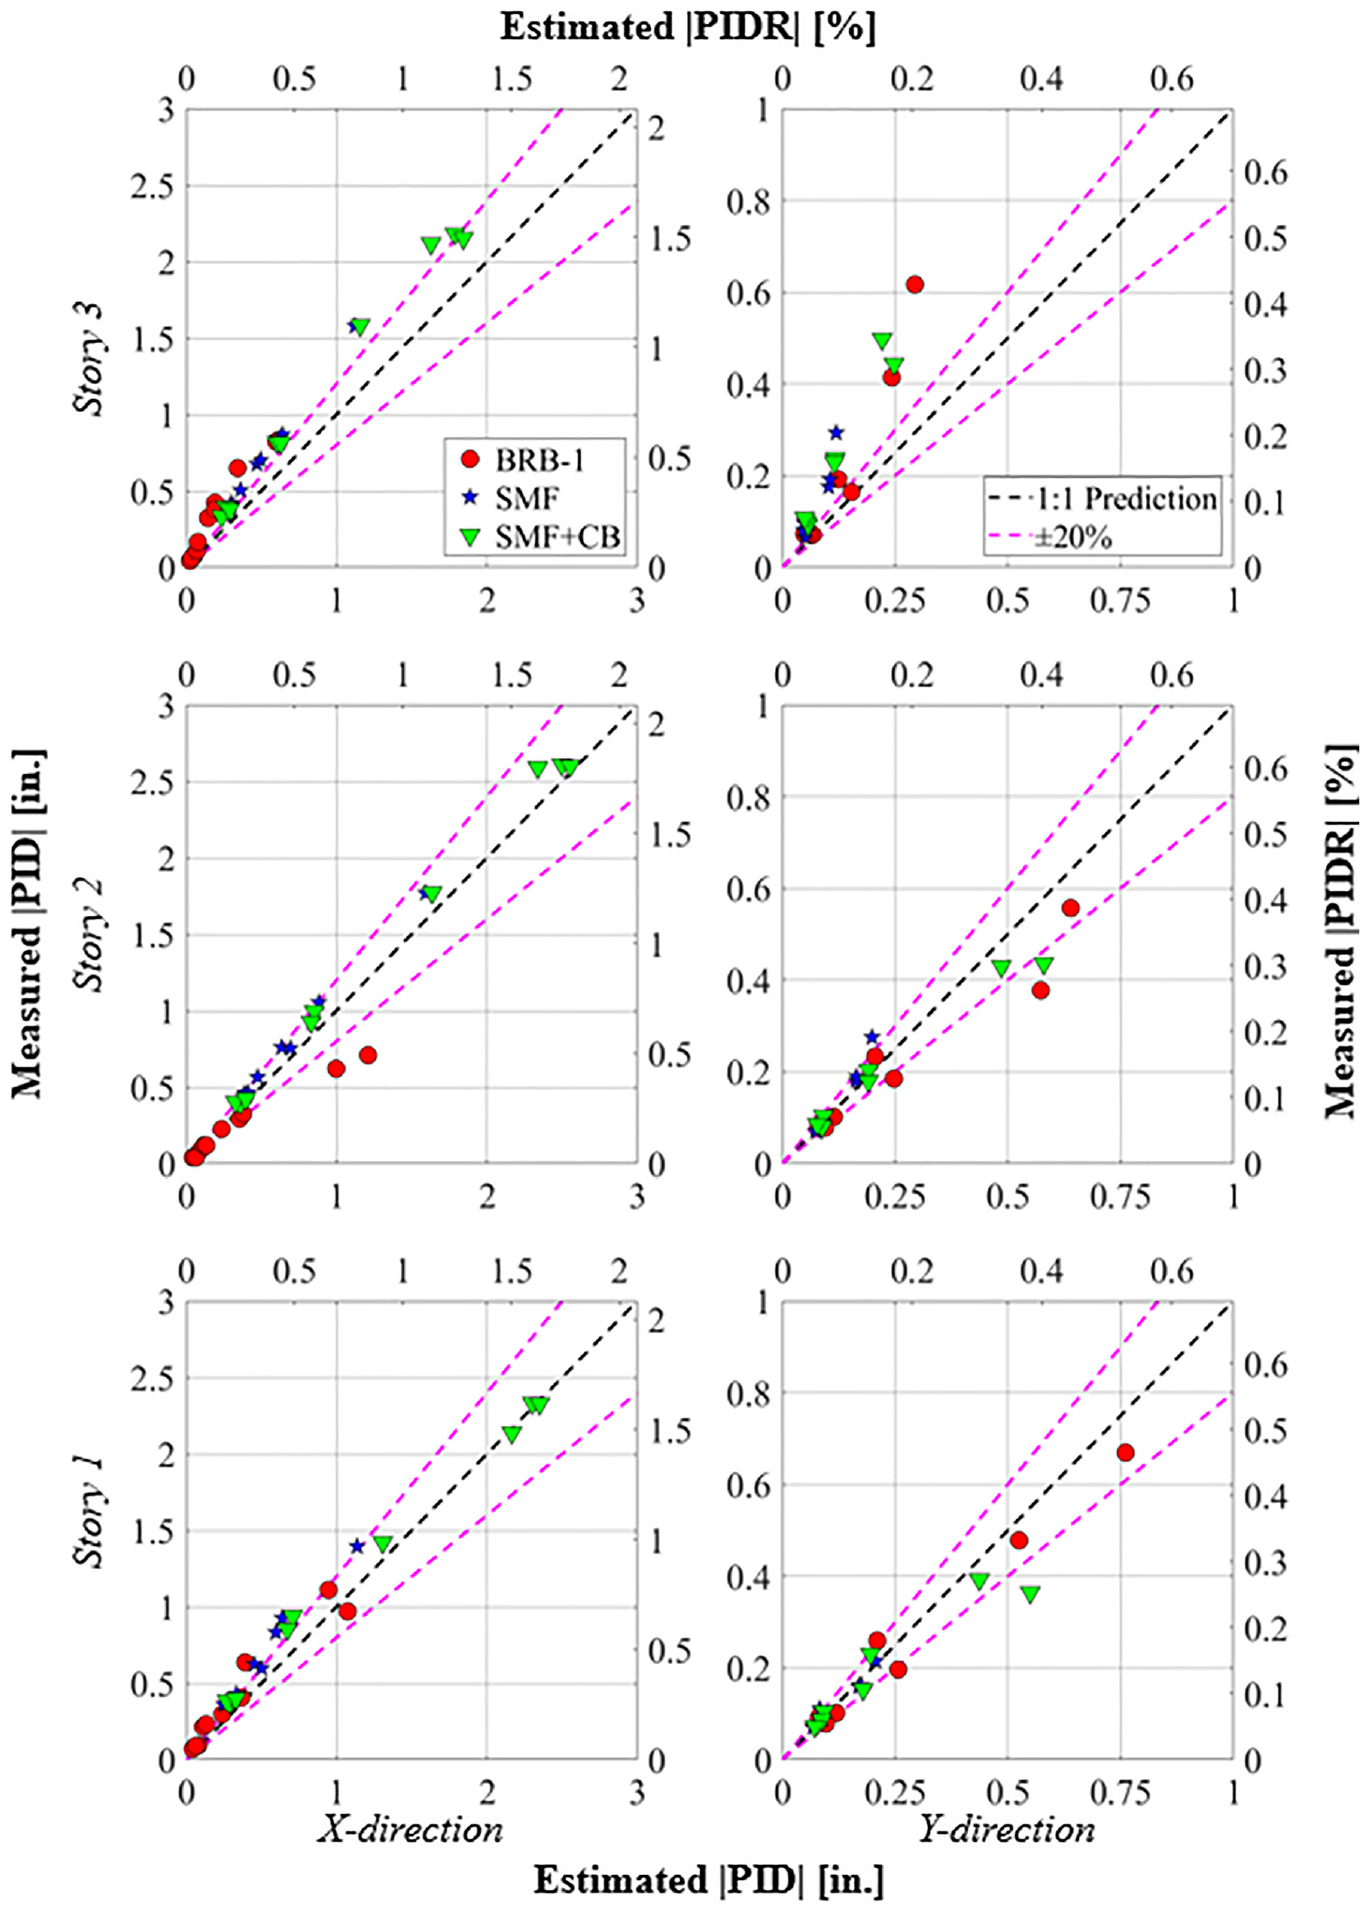
Peak interstory drift estimated from NLTH FEA compared to the measured peak interstory drift at each floor level for all ground motion tests in the X- and Y-directions.
A key characteristic of the backbone curves determined from NSP is the effective stiffness of a given configuration and direction, Ke, defined in ASCE 41-17 and summarized in Table 1. Figure 22 presents the evolution of secant stiffnesses, defined as the secant line through peak positive and negative roof drifts of hysteresis curves typically shown in Figure 19, for all three configurations and directions of shaking. More specifically, Figure 22b and c present the secant stiffness degradation relative to the ASCE 41-17 effective stiffness for the X- and Y-directions, respectively. Results indicate a linear reduction in stiffness with increasing peak roof drift. It should be noted that y-intercepts of the equations determined by linear regression presented in these figures are in some cases greater than 1.0, indicating the structure is initially slightly stiffer than the effective stiffness predicted by NSP. The greatest reduction in stiffness was realized in the BRB-1 configuration where, at a roof drift of approximately 0.5%, there is nearly a 50% decrease in stiffness from the effective stiffness, see Figure 22b.
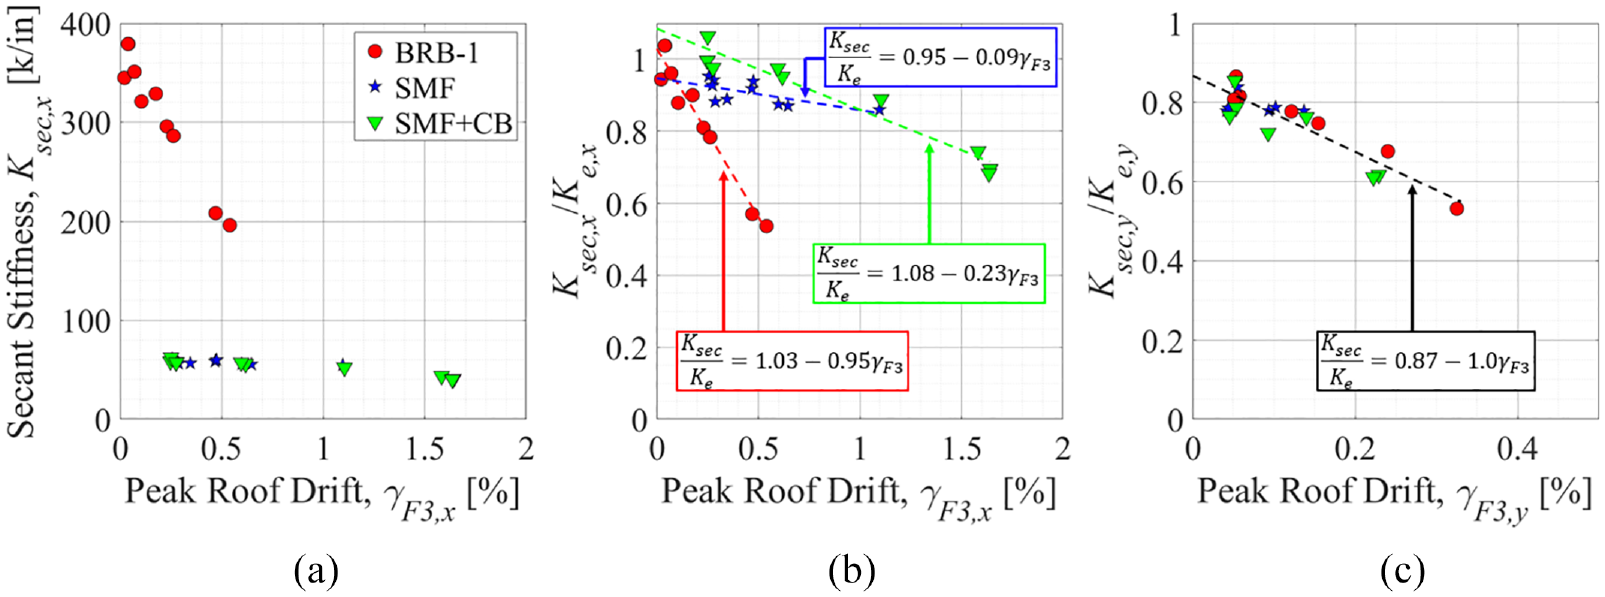
Evolution of secant stiffness determined from test results. (a) absolute secant stiffness of all three configurations in the X-direction; (b) relative stiffness degradation of all configurations in the X-direction; and (c) relative stiffness degradation of all configurations in the Y-direction. The effective stiffness Ke is estimated per ASCE 41-17 (Table 1).
These tests reveal that the inclusion of partially restrained CBs (SMF + CB configuration) caused the secant stiffness to be reduced approximately 100% more than that of the “fixed” base SMF configuration. It is important to note that this reduction is valid through the completion of the quasi-static suite for each frame case, as the SMF was not tested beyond quasi-elastic performance limits. In the Y-direction, results similarly indicate that the SMF + CB configuration, in general, falls beneath the linear trend line plotted in Figure 22c. Finally, results indicate that the relative reduction in stiffness for BRBF in the transverse direction is similar and degrades at a nearly 1:1 rate with respect to the percentage of the roof drift. Figure 23 presents the peak roof drift ratio (PRDR) and base shear for all three configurations in both primary directions of shaking. Effective stiffnesses determined from codified procedures and summarized in Table 1 are plotted as solid lines against the test data and indicate that the models reasonably capture the building response in the linear regime. Nonlinear response is evident where measured secant stiffness reduces with increasing PRDR.
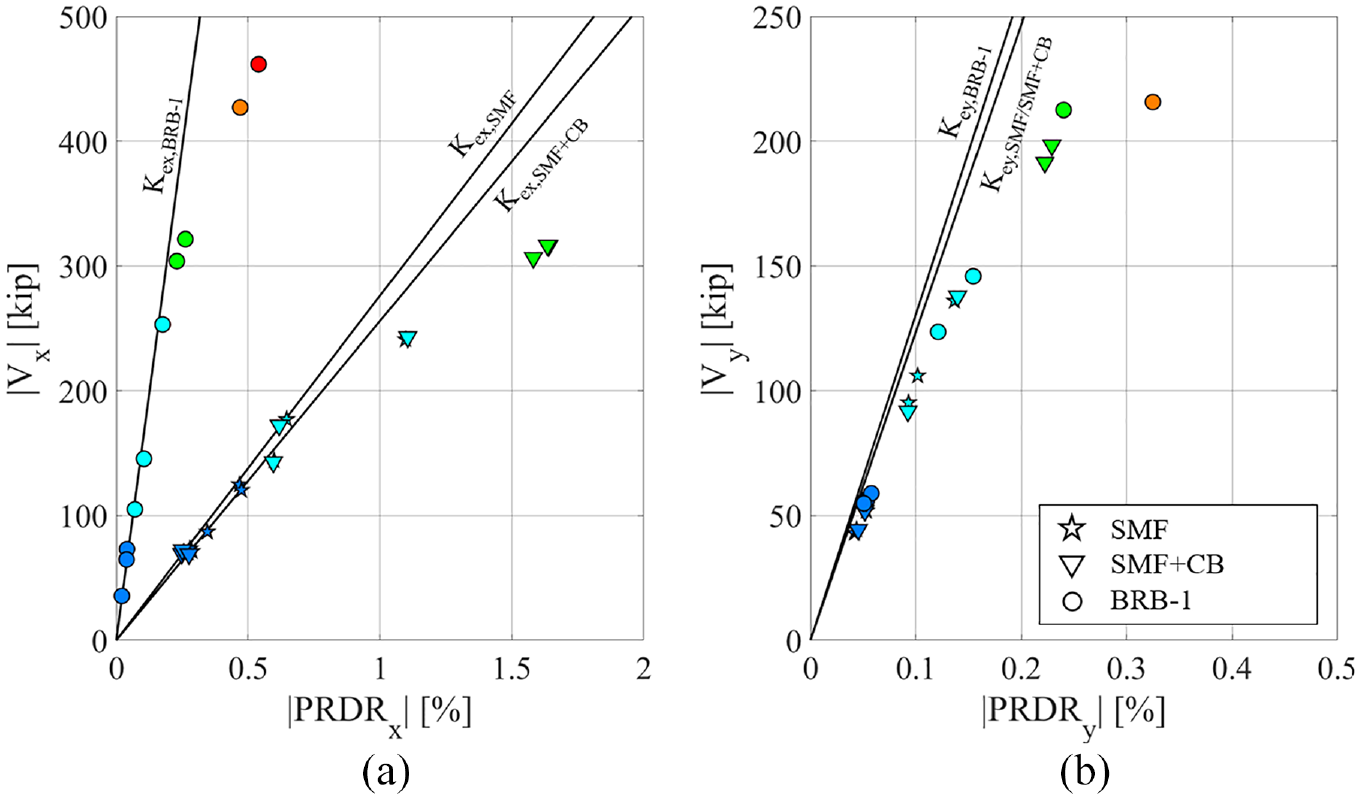
Peak base shear forces versus peak roof drift ratios for three building configurations with estimated effective stiffnesses determined from NSP in (a) the X-direction; and (b) the Y-direction. The marker colors correspond to the PO level defined in Table 3.
Component-level response
To evaluate the contributions of the various nonlinear fuses to the global response, each of the baseplate rotation, replaceable shear fuse joint rotation, and BRB axial deformations are calculated using the systems of linear displacement potentiometers installed on the various components. The total roof drift ΔF3 is then assumed as the sum of drift due to rigid base rotation, ΔF3,BP, the nonlinear response of the superstructure fuses in the direction of interest, ΔF3,SS, and the remaining drift due to the elastic contributions from steel elements, ΔF3,E, see Figure 24 and Equation 1:

Three vertically oriented linear displacement potentiometers were used to determine the kinematics of a given CB, with four CBs instrumented with linear displacement potentiometers, the rotations about the X- and Y-axes, θBP, were then calculated and averaged to estimate the total rigid base rotation of the building. The contribution to total roof drift from the ductile replaceable shear fuses was calculated using one linear displacement potentiometer installed at mid-height of the web, and one at the bottom flange; with their distance known, this allows direct calculation of shear fuse rotations, θSF. Note that the linear displacement potentiometers on Floor 2 were not fully functional; therefore, the rotations at Floor 2 were calculated as the average of the beam rotations at Floors 1 and 3. Floor-level displacements due to beam rotations, δi, were then determined assuming inflection points at mid-height floor-to-floor above and below the beams as shown in Figure 24a. The BRB contribution in the Y-direction was calculated using the average of axially oriented displacement potentiometers placed at either end of the yielding core of the BRBs, to determine the axial strain, ϵBRB. The horizontal component of displacement at a given floor is determined by the geometry of the BRB pairs. The summation of the BRB contributions at each story, δi, accounts for the total roof drift due to the ductile BRB element fuses, see Figure 24b. The elastic contribution to total roof drift of the building, ΔF3,E, is then assumed as the remainder of the summation of rigid base and nonlinear fuse responses from the total roof drift. Note that the computed ΔF3,E is the summation of elastic deformations from various elements throughout the superstructure, such as columns, beams, gussets, and plates, and bolt slip at interconnections of structural elements.
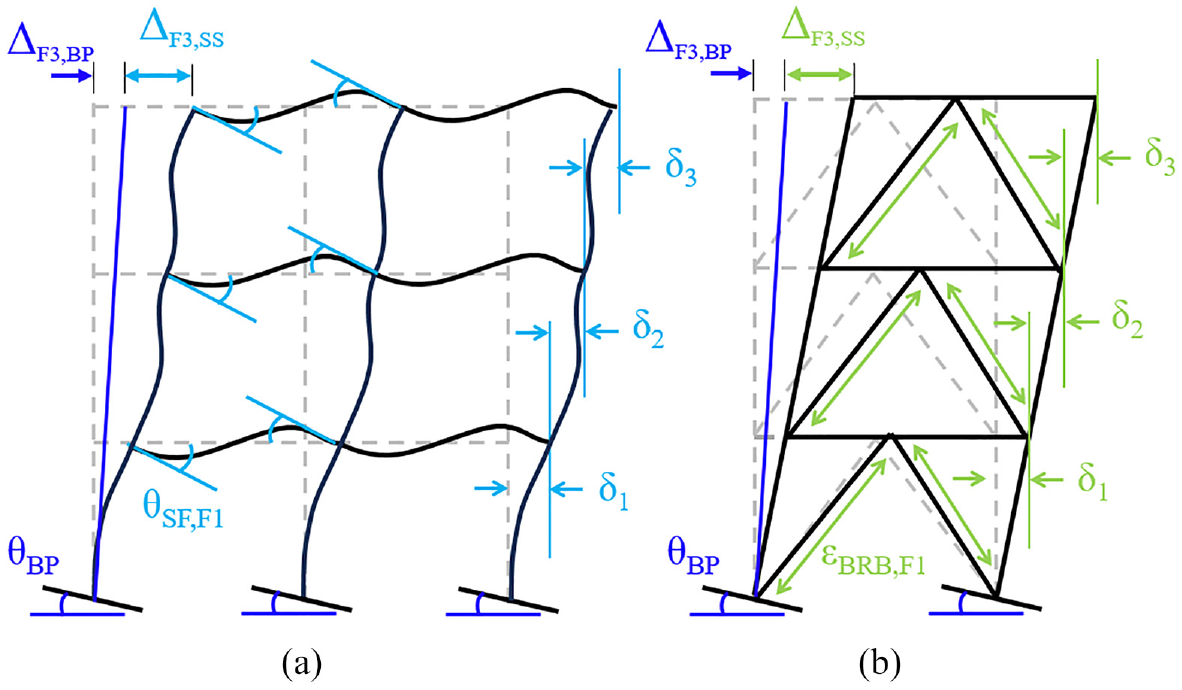
Determination of displacement contributions for SMF + CB configuration: (a) X-direction contributions from replaceable shear fuse joints and baseplates; and (b) Y-direction contributions from buckling restrained braces and baseplates.
Figure 25 presents the contributions of rigid baseplate rotation and nonlinear fuse response to the total roof drift in both the X- and Y-directions. Results presented in Figure 25 show that the rigid rotation of the partially restrained CBs due to anchor stretch contributes nearly 15% of the total roof drift measured in the most intense earthquake motion (MID 13). Results also indicate that the compliant base contributes a relatively larger proportion of roof drift as additional DOFs of excitation are imposed, for example with 10% contributed at 100% X only (MID 10) and up to 15% when Y and Z inputs were introduced (MID 12 and 13). Even in the elastic range of scaled input motions, the CBs contributed approximately 5% of the total roof drift in the X-direction. In the elastic motion suite, the percentage contribution of total roof drift from elastic response is approximately 50%. This contribution was reduced significantly by the suite of unity motions where the elastic contribution decreased to 10%–20%, where most of the roof drift is due to the ductile fuses in either direction of shaking. In fact, at unity, the shear fuses and transverse BRBs contribute 70%–80% of the total roof drift in their respective direction of shaking. Furthermore, results also indicate that although the compliant baseplates were designed for integration in the X-direction SMF LFRS, rigid base rotation is achieved in the Y-direction with BRBF. Across all tests, up to 10% of the total roof drift in the Y-direction can be attributed to rotation of the CBs. The consistent contribution of the compliant baseplates is likely due to the inherent rotational stiffness of the column bases about the X-axis in the SMF + CB configuration allowing rigid rotation without exercising the ductility as much as the orthogonal direction.
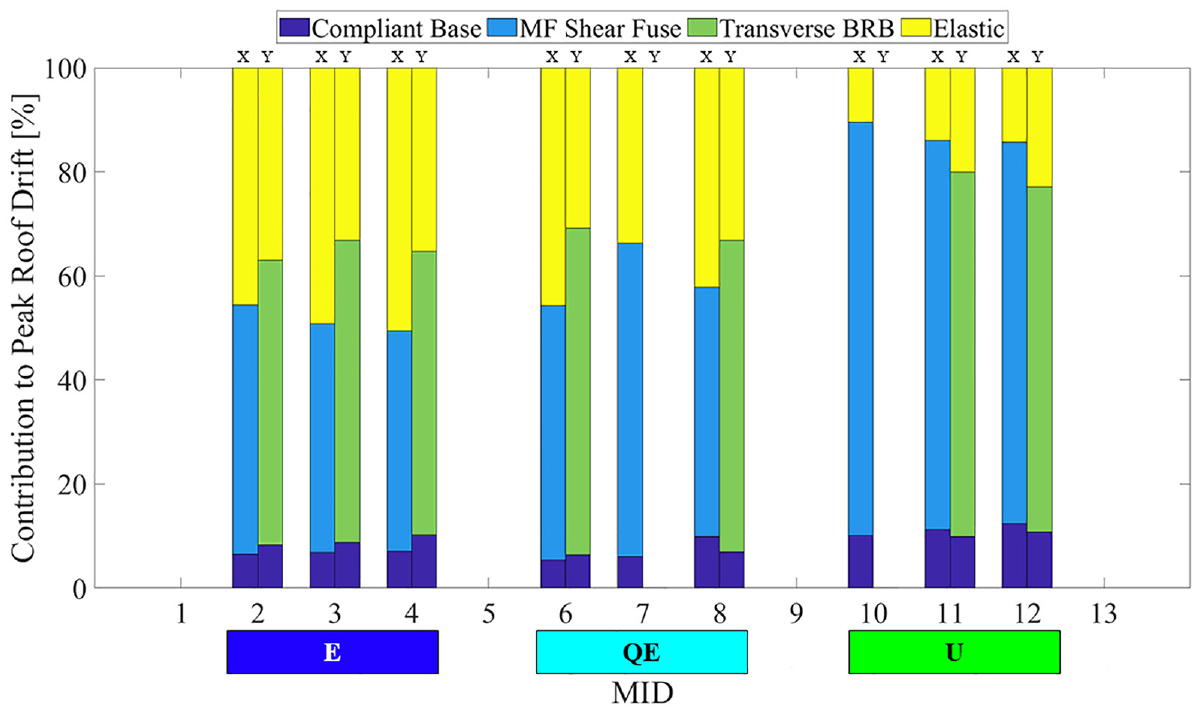
Contributions of rigid column baseplate rotation and superstructure response due to ductile fuses to the total peak roof drift in the X and Y directions for the SMF + CB configuration tests.
Conclusion
A shake table test program was performed at UC San Diego’s LHPOST6 facility on a full-scale three-story steel-framed structure reconfigurable to three different LFRSs, namely an SMF, an SMF in combination with partially restrained CBs (SMF + CB) and buckling-restrained braces (BRB-1). System identification was performed on each configuration using WN tests and induced earthquake motions. Period elongation is observed as the targeted PO is increased throughout a given configuration indicating nonlinearity and inelastic plastic deformation in the ductile fuses has occurred. A design-grade FEM reliably captured the fundamental periods and mode shapes of the building in each of its configurations and directions of shaking as verified with system identification results. Experimentally measured damping consistently increases with increased shaking intensity (~3%–7%). In the BRB-1 configuration, the damping values are larger in the X-direction (single brace per bay) compared with the Y-direction (chevron brace per bay) indicating that the size and configuration of the BRBs has a non-negligible influence on the system damping in BRBFs.
Roof-level acceleration amplification (PFA/PIA) profiles are also examined and compared with design code profiles. For the SMF configurations, acceleration amplification ranged from approximately 2.5 to 6.0, while amplification for the stiffer BRB-1 configuration ranged from approximately 1.0 to 3.5. In the Y-direction, where a chevron BRBF was used across all configurations, roof-level acceleration amplifications ranged from approximately 1.5 to 3.5. The ASCE/SEI 7-22 codified acceleration amplification profiles, compared with the design target PO motion were nominally underestimating floor-level acceleration amplification for the SMF LFRSs, while generally overestimating the results for the stiffer BRBF LFRSs. Furthermore, results imply that as the absolute PIA is increased, a general trend in the reduction of floor-level acceleration amplification is realized. More specifically, results from the BRB-1 configuration indicate that the PFA/PIA profile approaches uniformity and saturation along the total height of the structure at very intense input excitations around 2 g. This result is also consistent with the BRBFs in the tests, including Y-direction input. The proximity of the natural period of the building to the predominant period of the input motion influences the floor-level amplification, as is expected. As the distance between the two periods is decreased, there is an increase in floor-level amplification, which reveals evidence of resonance.
The rigid rotation of the baseplate during the earthquake tests allowed the ductile anchors to yield and accommodate a portion of the total roof drift, which would typically be accommodated by yielding of the column near the baseplate. These results contribute to the growing evidence that anchors in base plate connections detailed with a stretch length of 8db beneath the concrete surface are well suited to provide deformation capacity in seismic applications. Overall, a moderate level of displacement ductility was achieved in this study due to the availability of a rotationally compliant column base. In elastic performance-scaled motions, most of the roof drift was attributed to the elastic deformation of the structure in both directions of shaking. This is significantly reduced to 10%–20% at unity scaled ground motions. During the unity scaled motions, most of the roof drift is attributed to the SMF shear fuses and BRBs. However, rigid rotation of the column bases due to the partially restrained CBs contributed as much as 15% of the roof drift at the largest intensity earthquake input. The inclusion of partially restrained baseplates also results in more significant softening of the system, approximately 10% larger, as compared to the traditional SMF system. Nonlinear FE simulations demonstrate reasonable comparisons to the measured responses. Notably, the FEM accurately captures the peak absolute interstory drifts experienced by the structure in both directions which may be used for design of drift-sensitive NSCs and accurately captures the peak absolute roof drift ratios.
Implications for design and future research
An important takeaway for the designer proposing to adopt the considered LFRS tested in a 3D configuration herein is that, despite the use of 3-DOF input excitation, comparative response results in terms of acceleration, drift, and story shear demands are observed using 1-DOF input of the same target intensity. This finding implies that the current practice in the design of structural systems, which uses independent isolated directions of earthquake shaking of planar frame bays, may continue with relative confidence.
Finally, the shake table tests of the reconfigurable steel-framed building proposed for reuse by future researchers and referred to as the MTB2, was configured with each of its lateral force-resisting frames in this program and demonstrated its ability to perform as intended when subject to a range of performance-scaled earthquake motions. POs spanned from elastic to above design for each targeted yielding component while preserving elastic behavior of the main steel structural members. The only damage observed in all shake table tests was, as intended, to the shear fuses, BRBs, and stretch length anchors, all of which are replaceable. The authors anticipate that this study is one of many efforts that will use the MTB2, as its primary components are available to be reassembled and support research of various structural and NSCs in conjunction with the unique 6-DOF large outdoor shake table facility at UC San Diego. Interested users of data from this program may find all necessary documentation, data, metadata, including FE models curated within the Design-Safe Data Depot Repository (Hutchinson et al., 2024).
Footnotes
Acknowledgements
The authors thank the industry sponsors, namely CoreBrace LLC, DuraFuse Frames, SME STEEL, Verco steel, AISC, and Hilti Corporation for materials provided in support of construction of the testbed building discussed herein. Design and fabrication drawing support of CoreBrace and SME STEEL are also greatly appreciated. Asbury Steel conducted the assembly, reconfiguration, and disassembly of the specimen of the MTB2. The first author was supported by a Hilti fellowship. They also thank Prof. Gilberto Mosqueda and Louis Lin for their contributions at various stages to the project. Support of technical staff onsite at the LHPOST6 facility, namely Dr. Koorosh Lotfizadeh, Abdullah Hamid, and Alex Sherman; as well as Powell Laboratory staff, are greatly appreciated.
Declaration of conflicting interests
The author(s) declared no potential conflicts of interest with respect to the research, authorship, and/or publication of this article.
Funding
The author(s) disclosed receipt of the following financial support for the research, authorship, and/or publication of this article: The authors acknowledge the support of the National Science Foundation (NSF) Cooperative Agreement No. CMMI-1520904, which provided supplemental resources in conjunction with the aforementioned industry support to design and execute the presented shake-down testing of this modular building resource to advance its equipment inventory. The support of all parties is greatly appreciated. Opinions, findings, and conclusions or recommendations expressed in this material are those of the author(s) and do not necessarily reflect the views of the sponsoring agencies and companies.