
Abstract
The February 6, 2023, Kahramanmaraş earthquakes (Mw7.8 and Mw7.6) in Southeast Turkey ruptured a 300 km section of the East Anatolian Fault, resulting in severe ground motions. These two strong earthquakes occurred 9 hours apart and were followed by large-magnitude aftershocks. Strong ground motions from the Kahramanmaraş earthquakes were recorded by more than 280 strong motion stations.
Nine base-isolated hospital buildings located at distances less than 50 km from the ruptured fault were subjected to strong ground shaking. This paper examines five of the nine hospitals for which seismic isolation designs were available to the authors. The ground motions acting on these hospital buildings were recorded by strong motion stations situated in close proximity. Consequently, the February 6 earthquakes have presented a unique opportunity to assess the seismic performance of base isolation systems during severe earthquakes. All five hospitals were equipped with double spherical sliding (friction pendulum) seismic isolation devices.
Subsequently, the authors conducted site visits to the hospitals following the February 6 earthquakes and collected data on maximum and residual response displacements at their isolation levels, as well as on the seismic response of structural and nonstructural components. The maximum response displacements measured at the isolation levels are compared with the maximum displacements calculated by nonlinear response history analysis under the ground motions recorded at the strong motion stations in close proximity to the hospitals.
Keywords
Introduction
On February 6, 2023, at 04:17 (01:17 GMT), an Mw7.8 earthquake occurred on the East Anatolian Fault with a focal depth of 8.6 km (AFAD, 2023; METU EERC, 2023). The total length of the ruptured fault segment was approximately 300 km, with major surface displacements on the order of 3–7 m. Approximately nine hours later, another Mw7.6 earthquake occurred in the region again. Both events occurred on the East Anatolian Fault Zone (EAFZ), one of Turkey’s two major active fault systems.
Consistent with the characteristics of the East Anatolian fault system, the fault mechanism of both earthquakes is left-lateral strike-slip. A total of 280 strong-motion stations operated by AFAD (AFAD, 2023; Gülkan et al., 2007) that are located within 450 km from the zone of energy release have recorded strong ground shakings.
The focus of this study is to investigate the seismic performances of base isolation systems in five hospitals situated in close proximity to the ruptured faults, which were subjected to significant ground shaking during the February 6, 2023, earthquakes. All five hospitals were isolated with double spherical sliding systems. The main reason for limiting the study to investigating the base isolation systems exclusively, rather than extending it to a comprehensive seismic performance evaluation of the hospital buildings, is the availability of detailed data. Despite the isolator designer and producers providing the entire data for seismic isolation systems, including their mechanical characteristics and site-dependent seismic hazard, it has not been possible to obtain the structural models and design details of the isolated hospital buildings. Nevertheless, an assessment of the seismic isolation system performances following the sequence of large-scale events is believed to provide valuable information to the earthquake engineering community.
The information obtained from the five base-isolated hospitals reported here is unique for a particular reason. Field data on spherical sliding systems that were subjected to actual severe earthquake excitations in the past is limited. Furthermore, earthquake response data on seismic isolation is available only for a limited number of buildings that were isolated with natural rubber, high damping rubber, or lead rubber bearings (LRB). The LRB-isolated USC Hospital during the Mw6.8 1994 Northridge earthquake (Celebi, 1996) was located 36 km from the epicenter and performed very well. The displacement capacity of the isolators was 260 mm whereas the measured peak displacement was 36 mm. The only seismically isolated building in Kobe during the Mw6.9 1995 Kobe earthquake was 30 km away from the epicenter (Clark et al., 2000) and did not sustain any structural damage. The LRB isolated Christchurch Women’s Hospital performed very well during the Mw7.1 2010 Darfield earthquake in New Zealand (Gavin and Wilkinson, 2010). A strong motion station 250 m from the hospital recorded peak ground acceleration (PGA) and peak ground velocity (PGV) values of 0.20 g and 50 cm/s, respectively. The Mw9.0 2011 Tohoku earthquake was the largest in the modern history of Japan. A total of 327 buildings along the eastern coast of Japan, which were isolated with rubber isolator bearings, were affected by the earthquake at fault distances longer than 150 km. All buildings were reported to have remained undamaged (Kasai et al., 2013).
February 6, 2023, earthquake sequence
The Mw7.8 earthquake was initiated on a smaller Narlı fault in the south, then jumped to the north and ruptured the Pazarcık-Erkenek fault segments towards NE and the Amanos segment toward SW with some time delay (Figure 1, AFAD 2023). The spatial distribution of aftershocks indicates that the earthquake rupture reached Antakya (Hatay) in the south and terminated in the north near the rupture of the Elazığ earthquake in 2020. The total rupture length is approximately 300 km, with major surface displacements on the order of 3–7 m. Ten minutes after the main shock, a strong aftershock with Mw6.8 occurred just to the west of the main shock hypocenter.
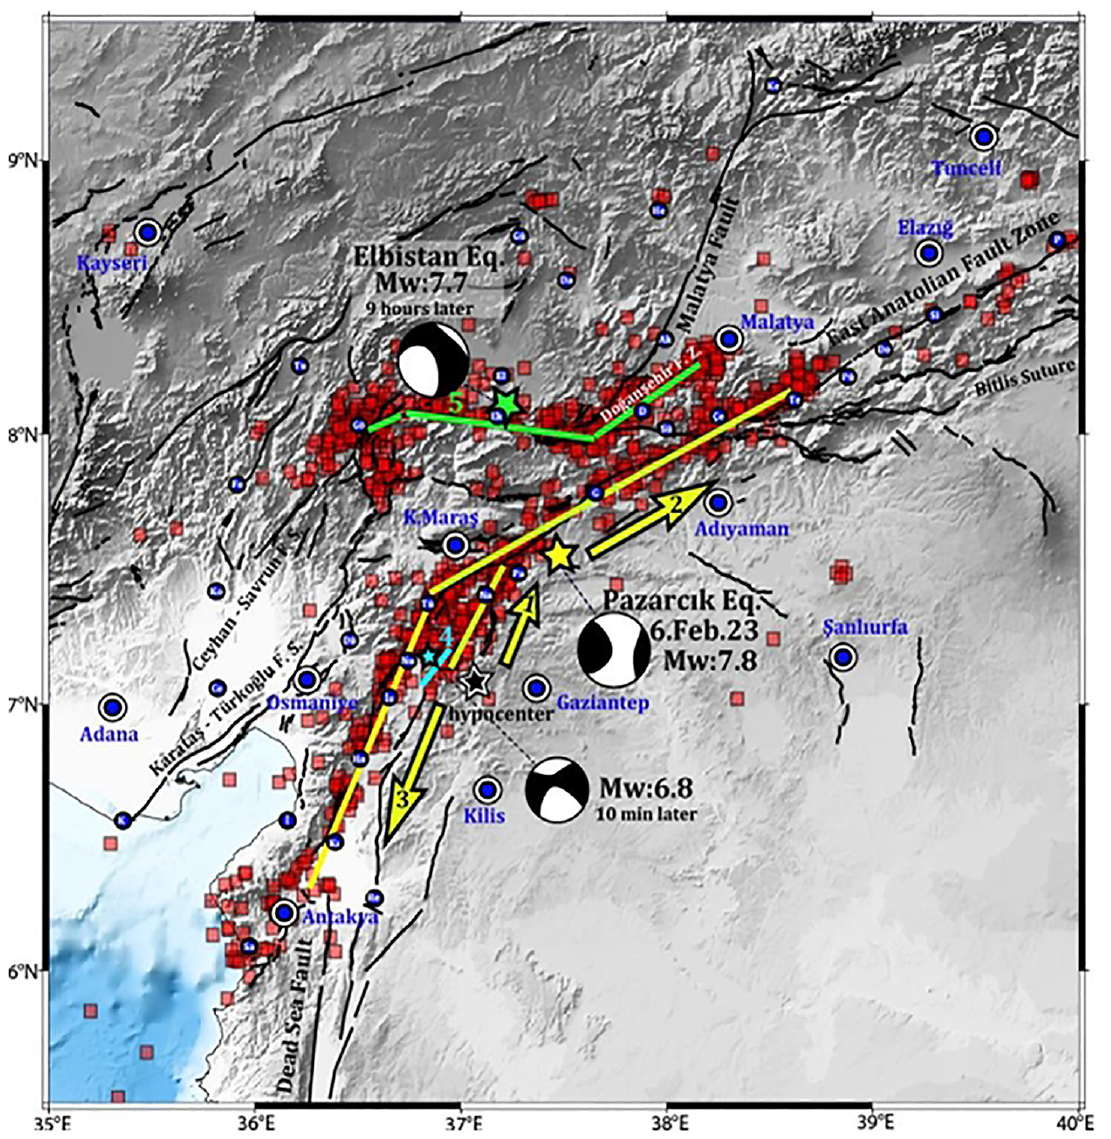
Rupture planes and aftershocks (AFAD, 2023) along with global moment tensor solutions of February 6 earthquakes. Ruptures are numbered in time, and arrows indicate the inferred rupture direction of the Mw7.8 earthquake. Green lines show rupture segments of the second event of the day.
Nine hours later, the second most powerful Mw7.6 Elbistan earthquake occurred along the Çardak-Sürgü fault segment, exhibiting a unique example of short-term earthquake triggering. The total rupture length was approximately 160 km, with major surface displacements in the order of 3–4 m.
Intensity distribution
The PGV distribution map inferred from the initial strong motion recordings of the Mw7.8 earthquake is depicted in Figure 2 (AFAD, 2023). The PGV distribution is preferred over the PGA because the PGV, as a scalar intensity measure, represents the ground motion intensity more accurately than the PGA over medium and long periods. The approximate locations of the base-isolated hospitals are also marked on the map. Figure 2 illustrates that the locations of base-isolated hospitals are close to the ruptured fault, and they were subjected to significant ground shaking that was recorded by strong motion instruments located at short distances from the hospitals.
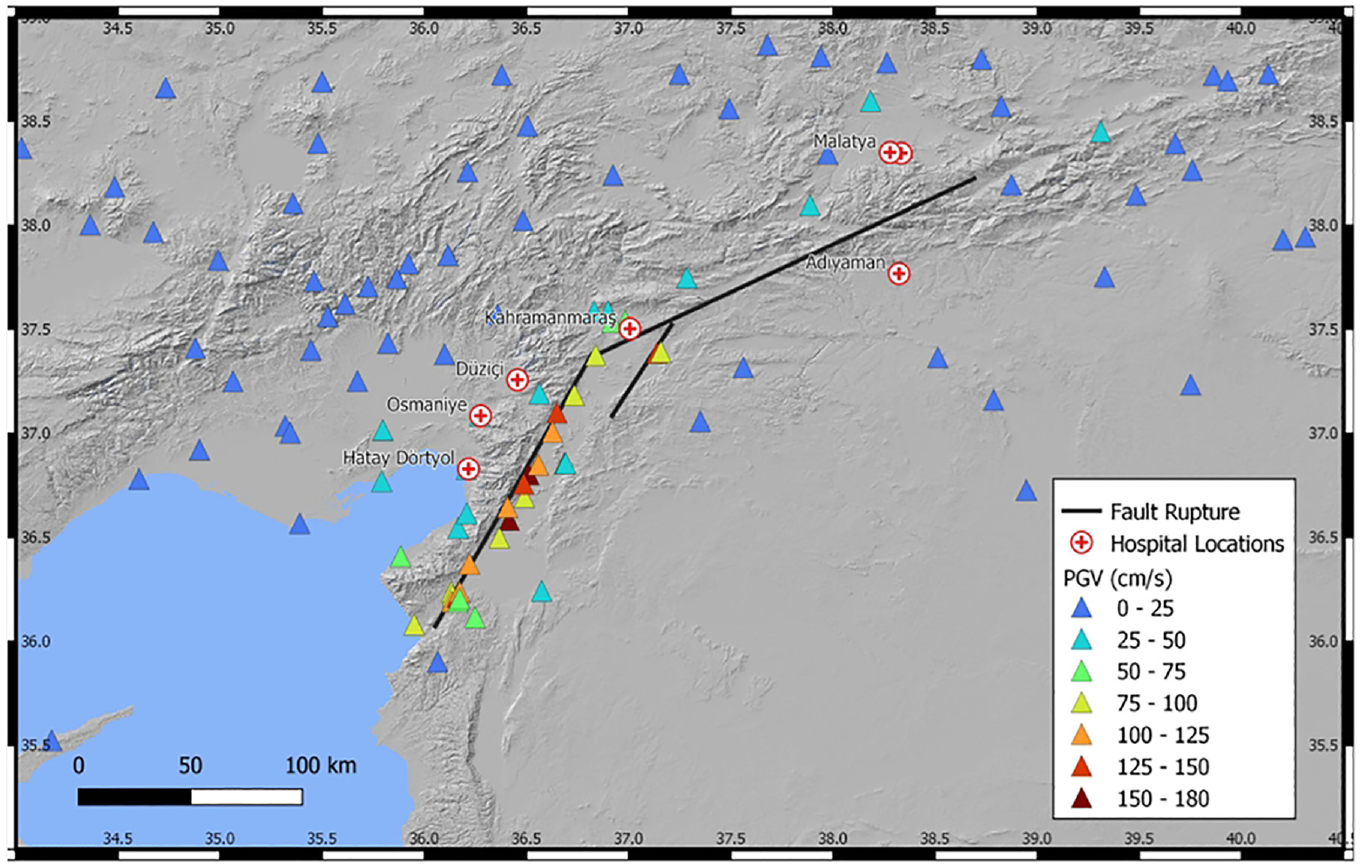
PGV distribution of the Mw 7.8 earthquake was recorded at strong motion stations and the locations of the base-isolated hospitals.
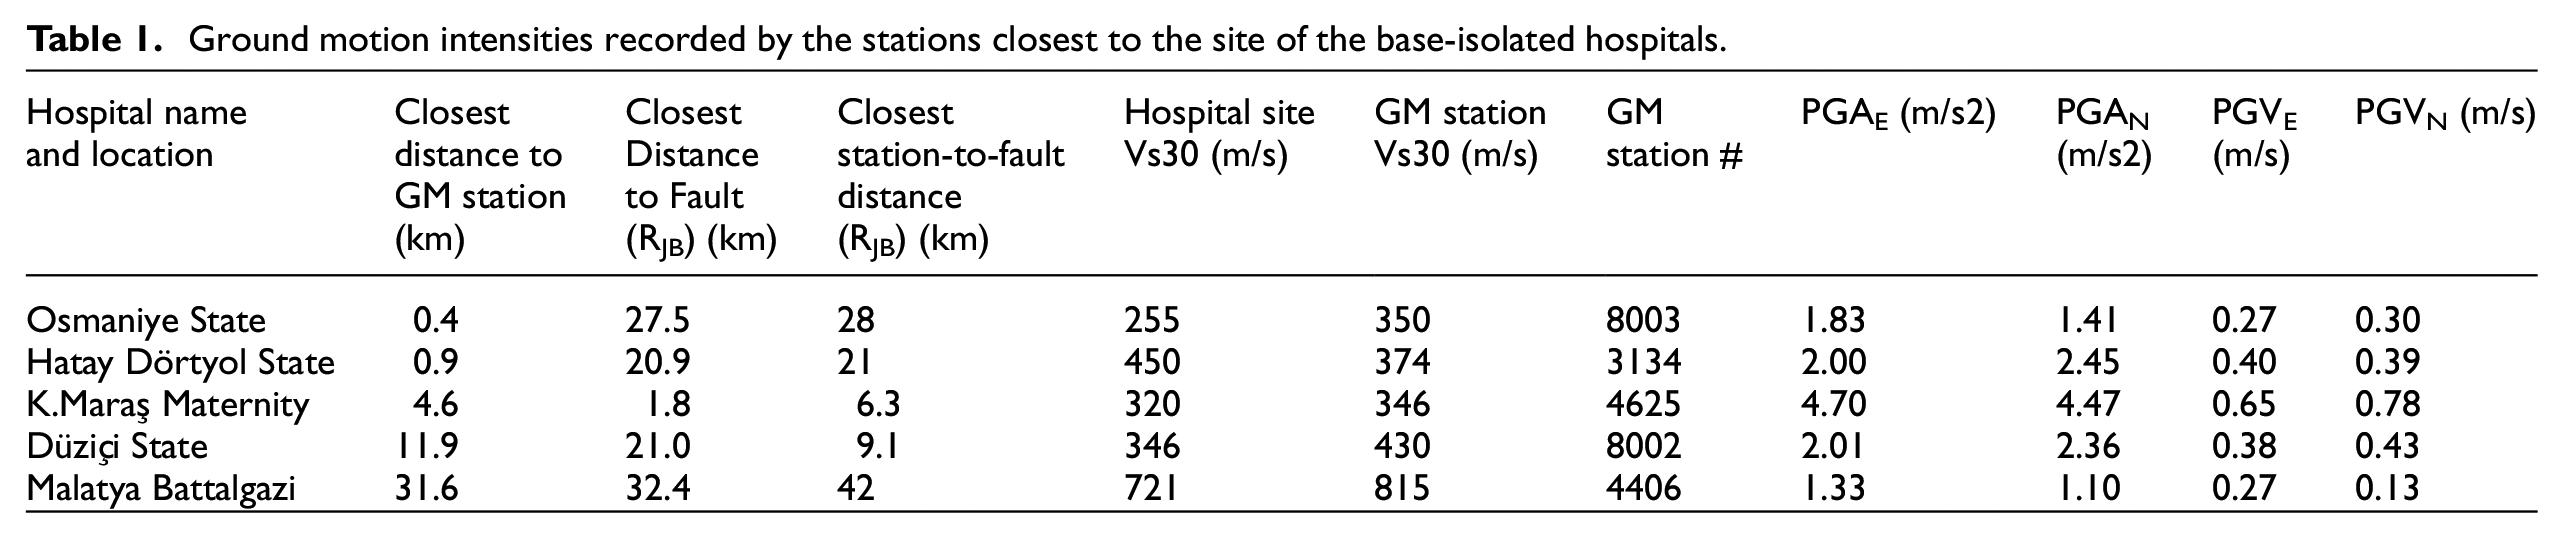
The ground motion intensities recorded at the stations closest to each investigated hospital are presented in Table 1. It is observed that the Vs30 values measured at the hospital site and at the closest strong motion station are similar. These values were obtained from the geotechnical site investigation reports of the hospitals and the strong motion stations, provided by the hospital contractors and AFAD, respectively. The PGA and PGV values were recorded at the closest ground motion station, identified by the station number in the seventh column. It must be acknowledged that the free-field intensities presented here represent the PGA and PGV values on the foundation only approximately due to the incoherence of ground motion and the averaging effect of the base slab.
Ground motion intensities recorded by the stations closest to the site of the base-isolated hospitals.
Post earthquake investigations of the base-isolated hospitals
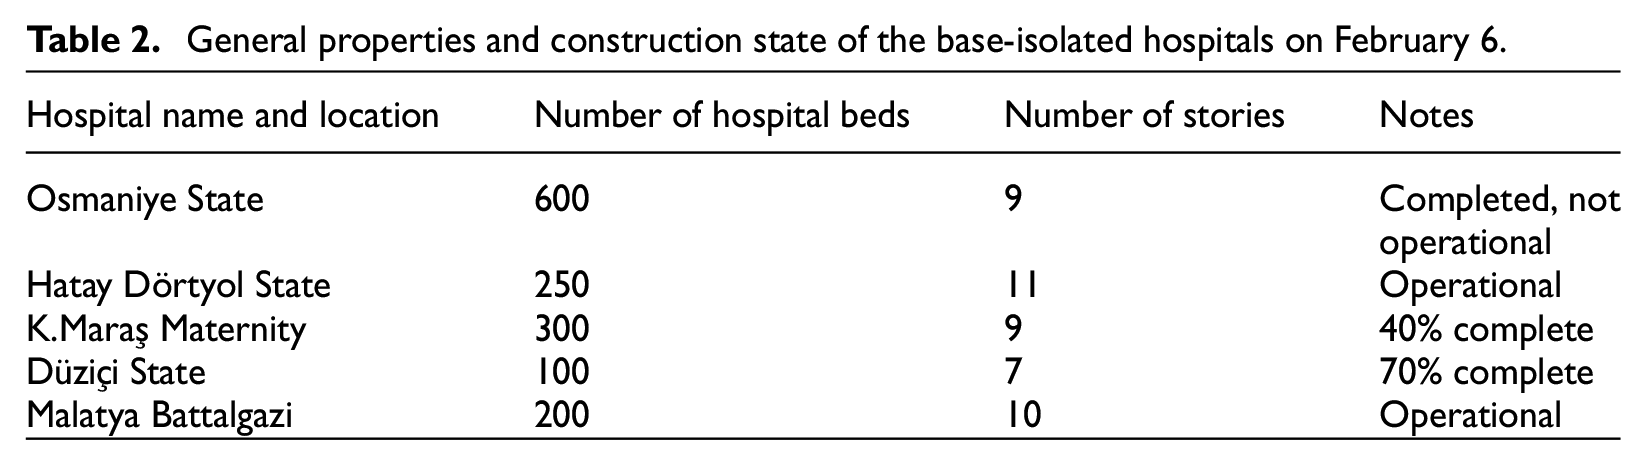
The locations of the investigated seismically isolated hospitals are marked in Figure 2, in proximity to the ruptured fault and the strong motion stations. Table 2 presents the general properties of the hospital buildings and their construction completion states during the earthquake. The structural system of all buildings is a reinforced concrete moment frame, with aerated concrete masonry infills. It should be noted that structural health monitoring systems were not yet installed in any of the base-isolated hospital buildings investigated in this study.
General properties and construction state of the base-isolated hospitals on February 6.
Osmaniye State Hospital
Acceleration and displacement spectra of ground motions recorded at a station 0.4 km from the hospital site are shown in Figure 3. The MCE uniform hazard spectrum, with a return period of 2475 years, is also shown in the same figure as a reference intensity value. MCE spectra are provided in the Turkish Seismic Code (AFAD, 2018) for all geographical locations in Turkey. They are constructed using the two-point smooth spectrum definition based on short-period and 1-second spectral accelerations obtained from probabilistic seismic hazard analysis (PSHA). In order to obtain the MCE spectra, local soil conditions are taken into account. The aforementioned information is applicable to all five hospital sites considered in this study.
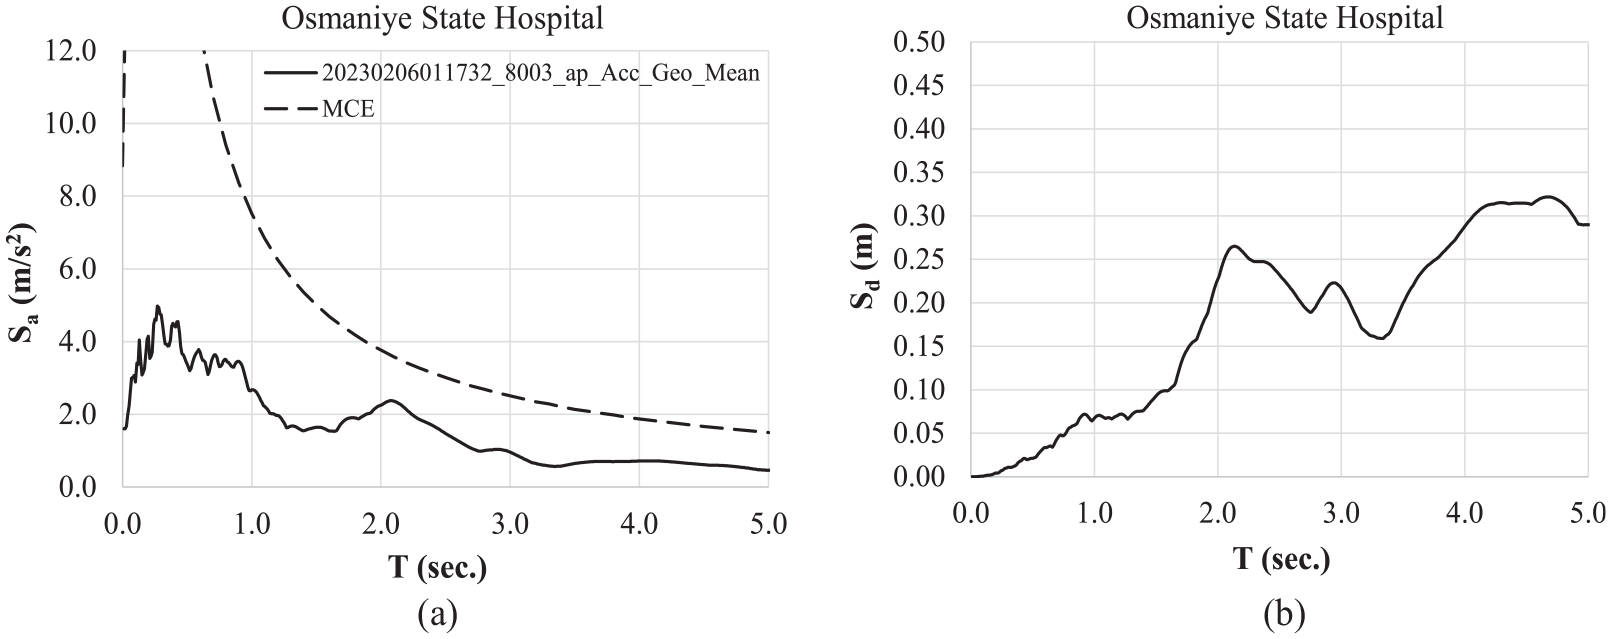
5% damped MCE spectra of the Osmaniye State Hospital, and the geometric mean acceleration and displacement spectra of ground motions recorded at a strong motion station 0.4 km away from the hospital during the Mw7.8 earthquake.
The maximum isolator displacement was measured at 100 mm, both with an endoscopic camera (twice the distance swept by the sliding pad) and an analog displacement-measuring device (Figure 4b). The isolators exhibited 25 mm of residual displacement, which was visually observed from the final position of the isolators (Figure 4c). The seismic gaps were maintained in accordance with the relevant specifications, thus allowing the seismic isolators to move freely during the earthquake.
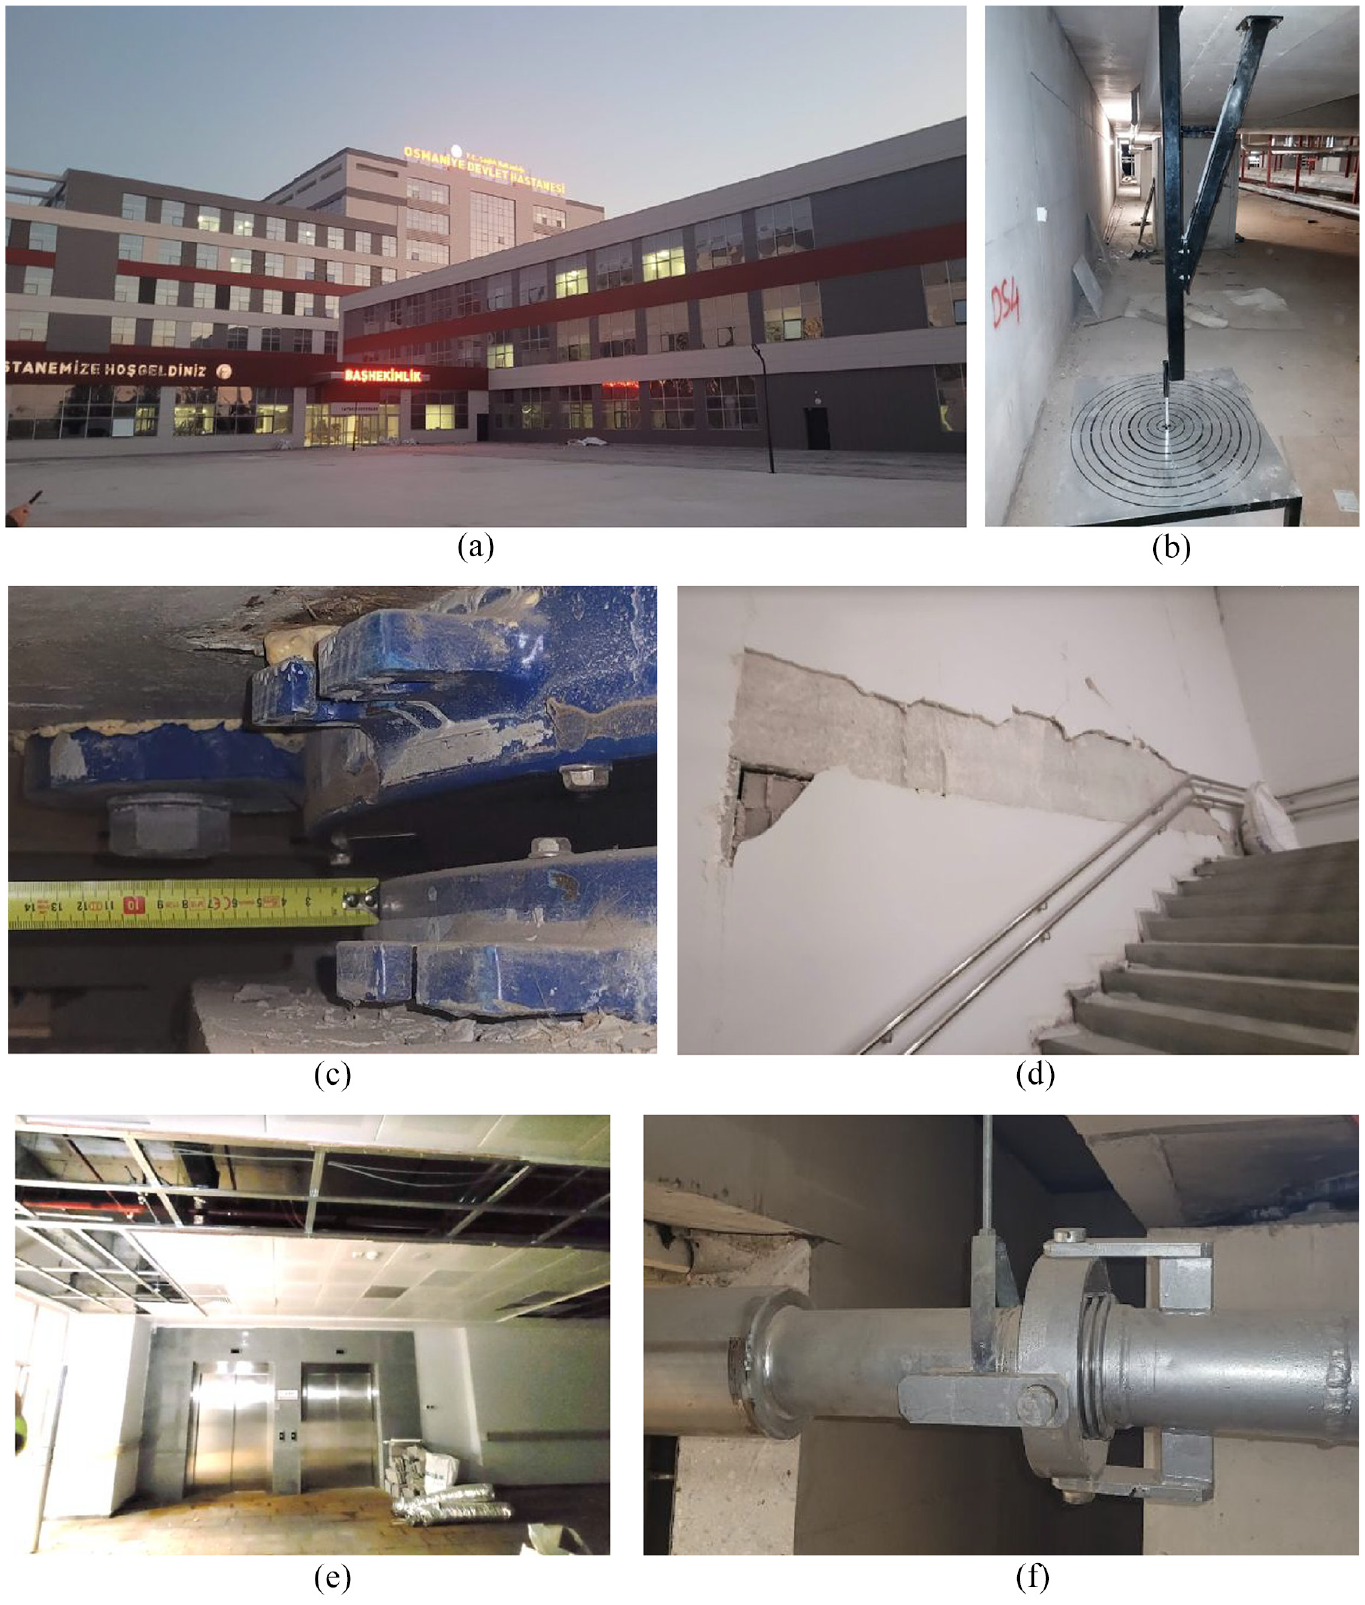
(a) General view. (b) Displacement measurement system. (c) 25 mm of residual displacement measured at seismic isolators. (d) Nonstructural damage at stairwell. (e) Extensive flood damage at the upper stories and the resulting rust residue. (f) Seismic compensator at the isolation level.
Although the primary focus of the paper is the seismic performance assessment of the base isolation systems of the hospitals as indicated in the title, the seismic performances of the nonstructural (architectural and mechanical) components are also assessed for the hospitals investigated herein. The seismic performance of base isolation systems is not entirely independent of the seismic performance of nonstructural components. The damage threshold to avoid service level performance is very low.
Evidence of displacement in seismic compensator devices installed at the water pipes was observed at the isolation level (Figure 4f). These devices are simply flexible elbows that permit water pipes to adapt to the displacements between the isolated superstructure and the foundation without fracturing.
No evidence of structural damage was observed in the structural system following the earthquake. Nonetheless, some nonstructural damage was observed in the stairwells of the isolated superstructure (Figure 4d). Moreover, the fire suppression system had failed due to inadequate seismic detailing, which in turn caused flooding of the suspended ceilings (Figure 4e) and consequently damaged the electrical components connected to the suspended ceilings.
Hatay Dörtyol State Hospital
Figure 5 depicts the acceleration and displacement spectra of ground motions recorded at a station 0.91 km from the hospital, accompanied by the MCE spectra. The maximum displacement of the isolator was measured at 40 mm using an endoscopic camera, which is twice the distance swept by the sliding pad. No residual displacement was observed.
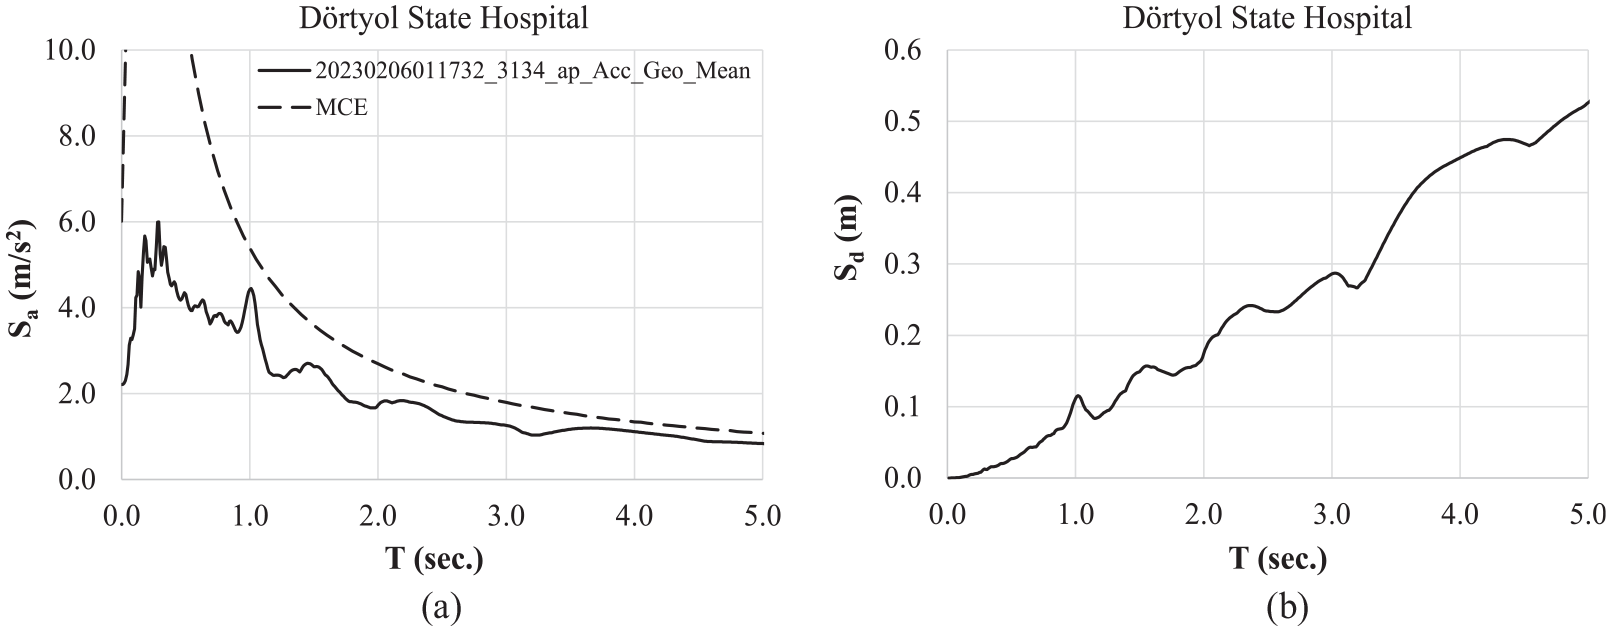
Five percent damped MCE spectra of the Hatay Dörtyol State Hospital and the geometric mean acceleration and displacement spectra of ground motions recorded at a strong motion station 0.9 km away from the hospital during the Mw7.8 earthquake.
The isolated superstructure exhibited no evidence of structural or nonstructural damage (Figure 6a). No significant damage has been observed in the well-constructed seismic gaps, except for minor deformations resulting from earthquake action (Figure 6b). The minor collision between the building and the pavement (Figure 6c) did not result in any constraints on the isolator displacements.
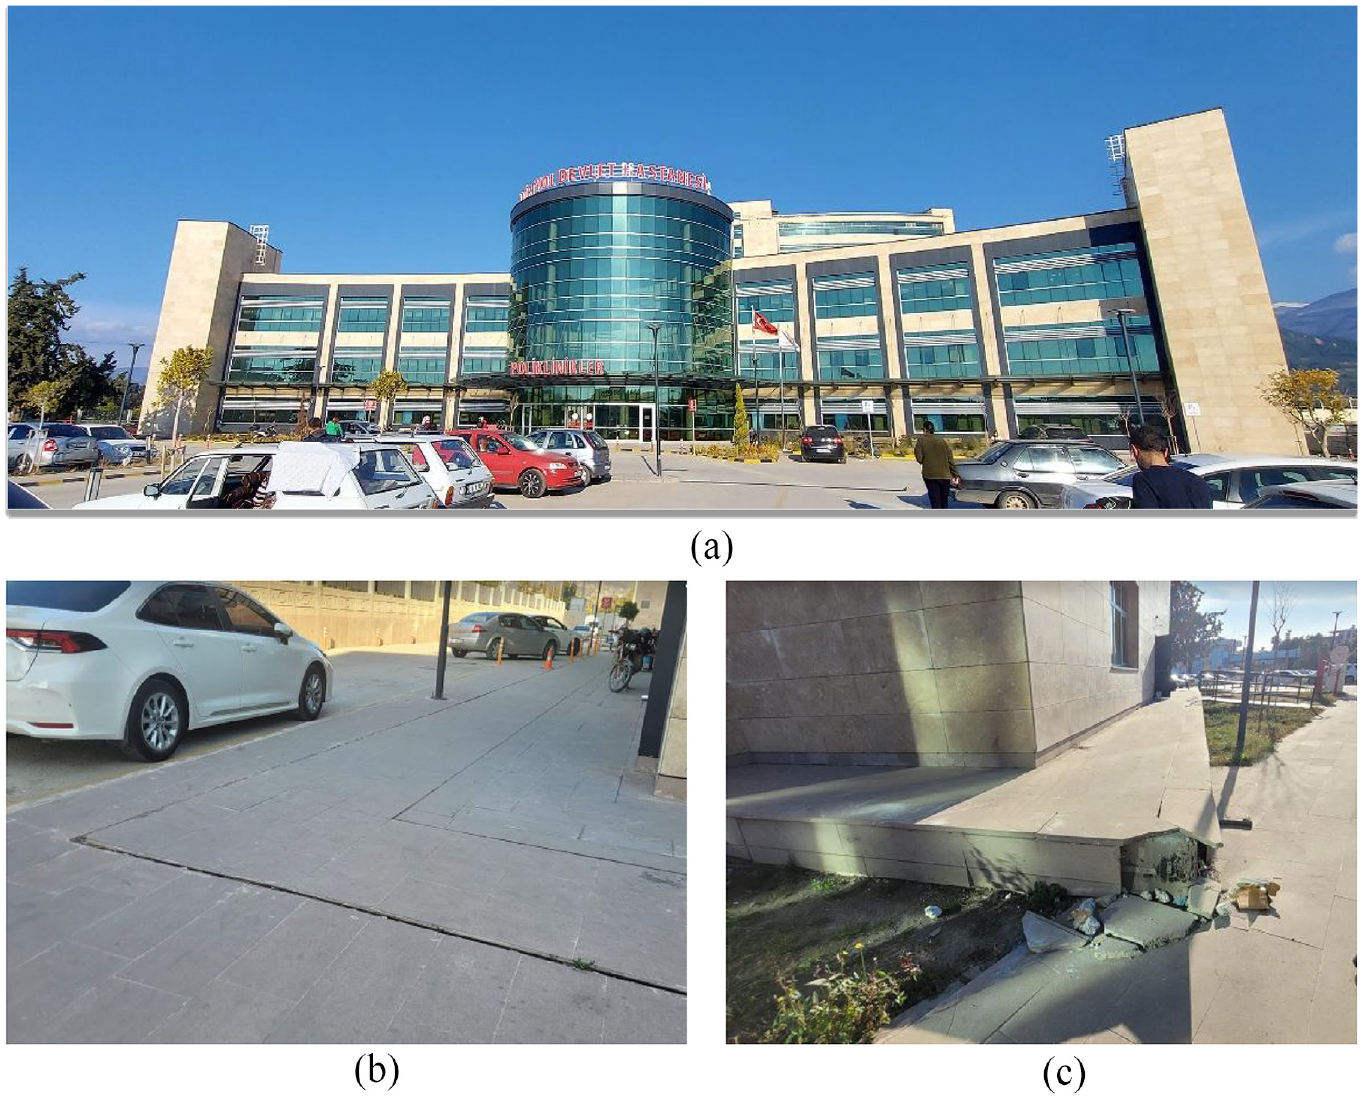
(a) General view. (b) Hinged platform covers of the seismic gaps along the perimeter.(c) Minor collision damage between a corner of the isolated structure and the pavement in Hatay Dörtyol Hospital.
Kahramanmaraş Maternity and Children’s Hospital
Acceleration spectra of ground motions recorded at a station 4.6 km from the hospital are shown in Figure 7, along with the MCE spectra obtained from PSHA.
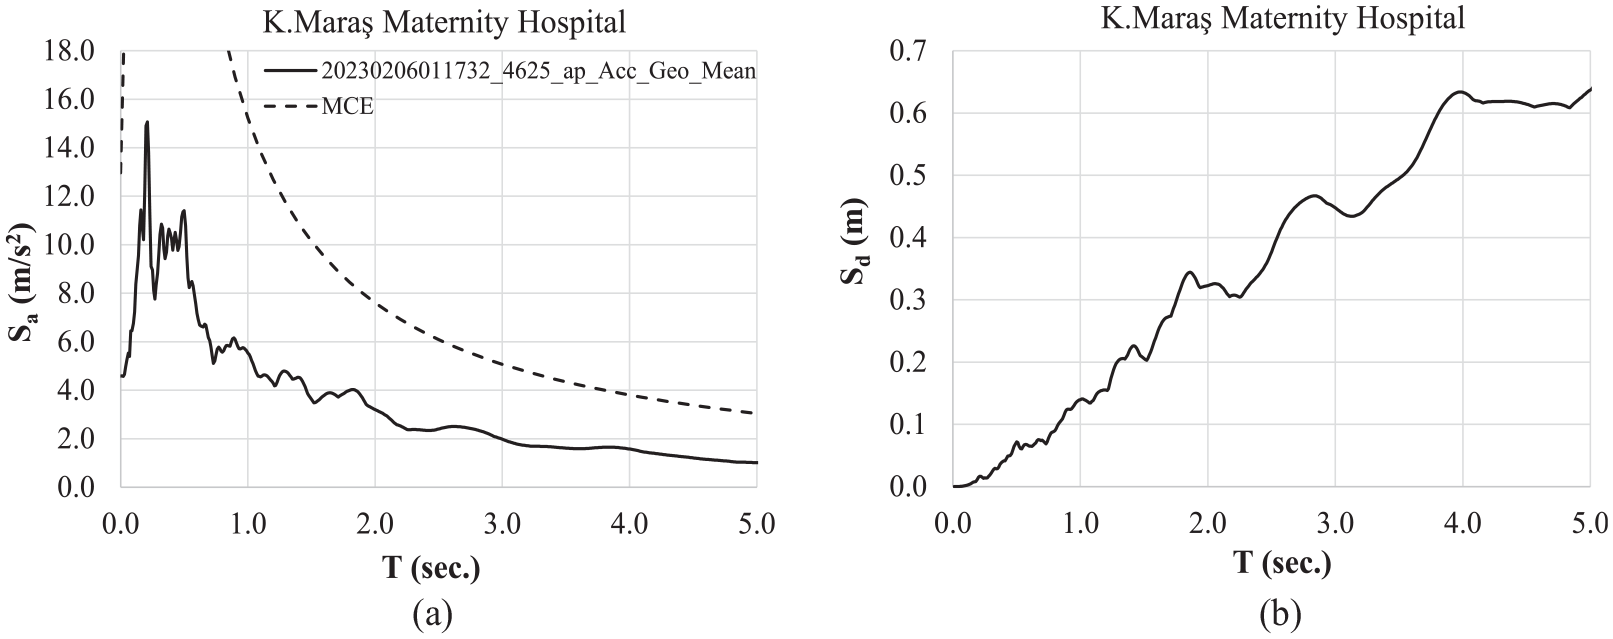
Five percent damped MCE spectra of the Kahramanmaraş Maternity Hospital and the geometric mean acceleration and displacement spectra of ground motions recorded at a strong motion station 4.6 km away from the hospital during the Mw7.8 earthquake.
The hospital complex was under construction at the time of the earthquake. The structural framing of the blocks depicted in Figure 8a had not been completed, except for the nine-story block situated behind. Our assessment is based on observations made of the completed nine-story block. The construction materials for the partition walls had already been stacked on their floors, which resulted in the majority of the final mass of this block being realized during the earthquake.
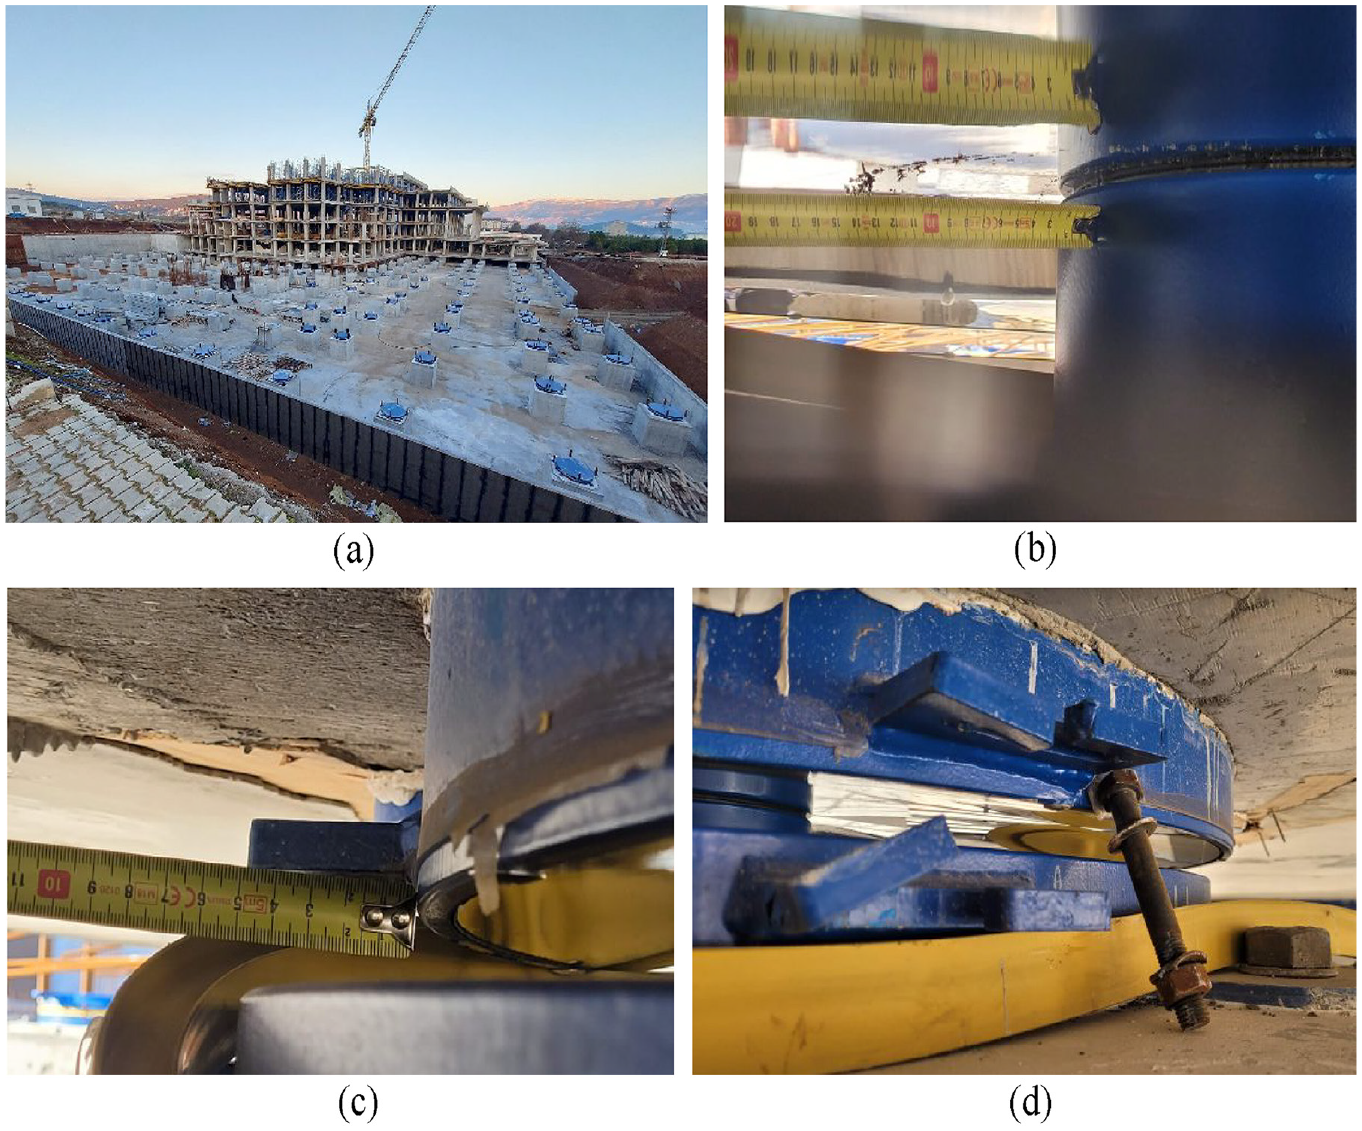
(a) Various phases of construction in Kahramanmaraş Maternity and Children Hospital Construction Site. (b) The farthest friction material marks from the core (black circular dotted line) are measured as 100 mm. (c) Residual displacement of 45 mm between top and bottom isolator plates.(d) Dislodged retainer bold and deformed connection flanges of one of the activated seismic isolators.
The seismic isolators that had been installed were triggered during the earthquake response. The maximum displacement observed in the isolators was 200 mm (Figure 8b). It should be noted that the total displacement is the sum of the sliding along both top and bottom plates, which is twice the 100 mm shown in the figure. The residual displacement was 45 mm (Figure 8c).
The presence of visual evidence of disconnected and deformed temporary retainer bolts was observed (Figure 8d). It was observed that the bolts were not unlocked during the earthquake. Given the limited resistance provided by these bolts, it is unlikely that they constrained the isolator displacement during seismic response. The framing system of the constructed block, as depicted in Figure 8a, exhibited no signs of damage or cracking in the reinforced concrete members.
Düziçi State Hospital
The hospital building in the Düziçi district is 30 km northeast of Osmaniye city center. At the time of the earthquakes, the reinforced concrete works had been completed, while the construction of infill walls and the electrical and mechanical installations were ongoing. A general overview of the construction status following the February 6 event is presented in Figure 9.
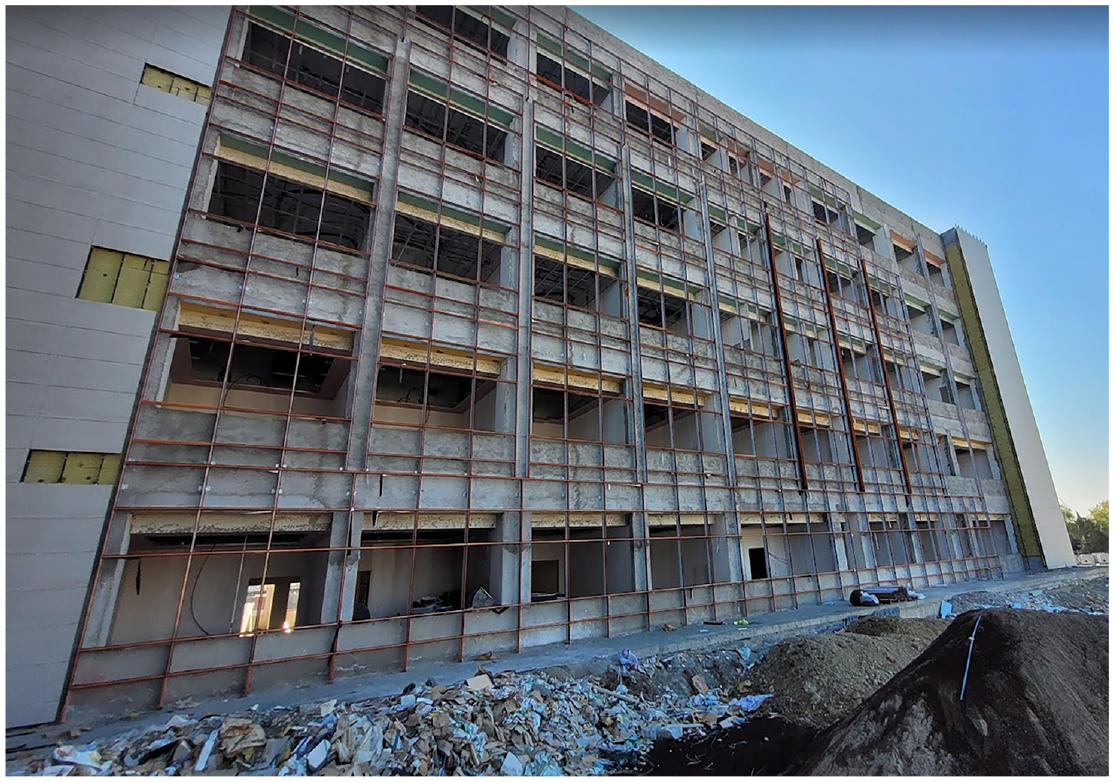
Düziçi State Hospital under construction.
Acceleration and displacement spectra of the ground motions recorded at a station 12 km from the hospital, and the MCE spectra are shown in Figure 10.
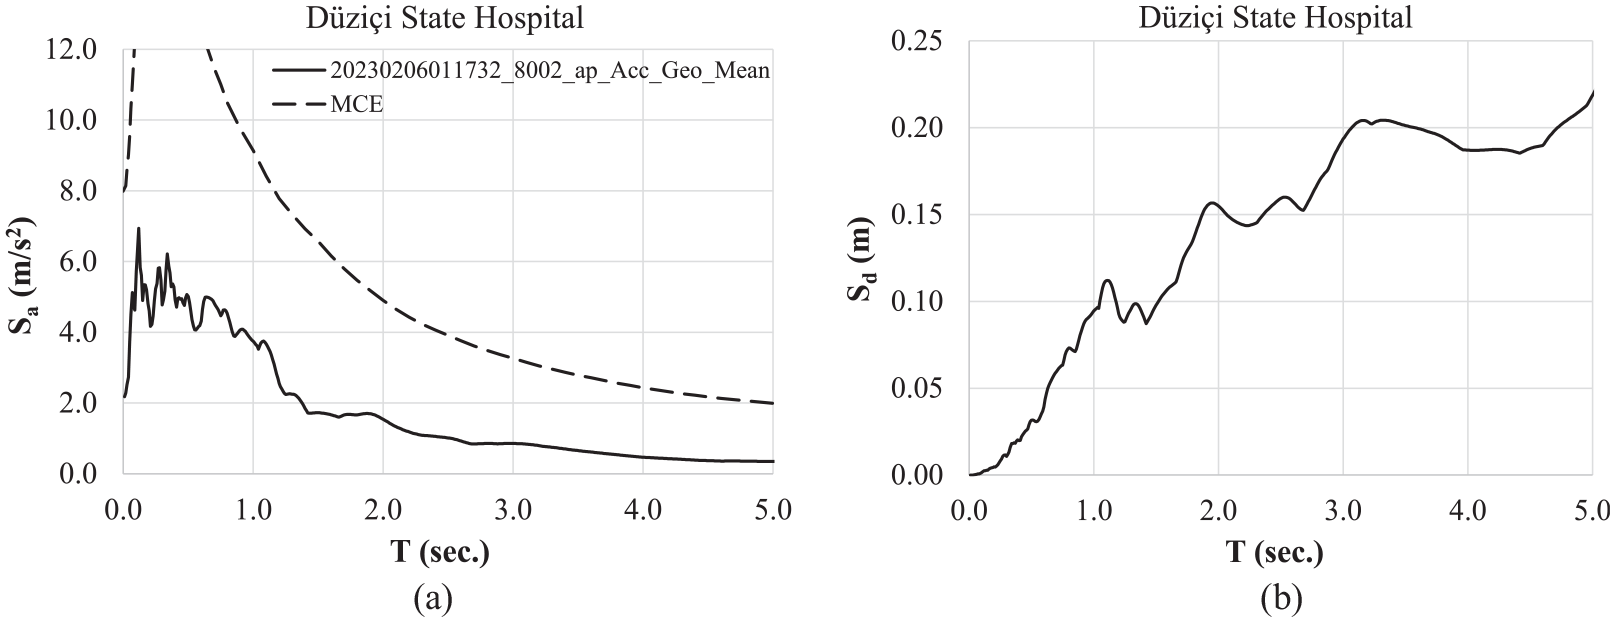
Five percent damped MCE spectra and geometric mean acceleration and displacement spectra of ground motions recorded at a strong motion station 12 km away from the hospital during the Mw7.8 earthquake.
The maximum isolator displacement was measured at 80 mm, with no residual displacement observed. Upon examination of the displacement marks around the perimeter of the superstructure, it was determined that the structure exhibited only one direction of movement. A more detailed examination of the walls surrounding the ramp that provides access to the isolation story revealed that a portion of the reinforced concrete wall was constructed within the seismic gap (Figure 11a, b). Cracking and damage were observed at this portion of the walls (Figure 11a, b). Although the free movement of the isolated superstructure was somewhat constrained in one direction, no damage was observed at the upper floors (Figure 11c, d).
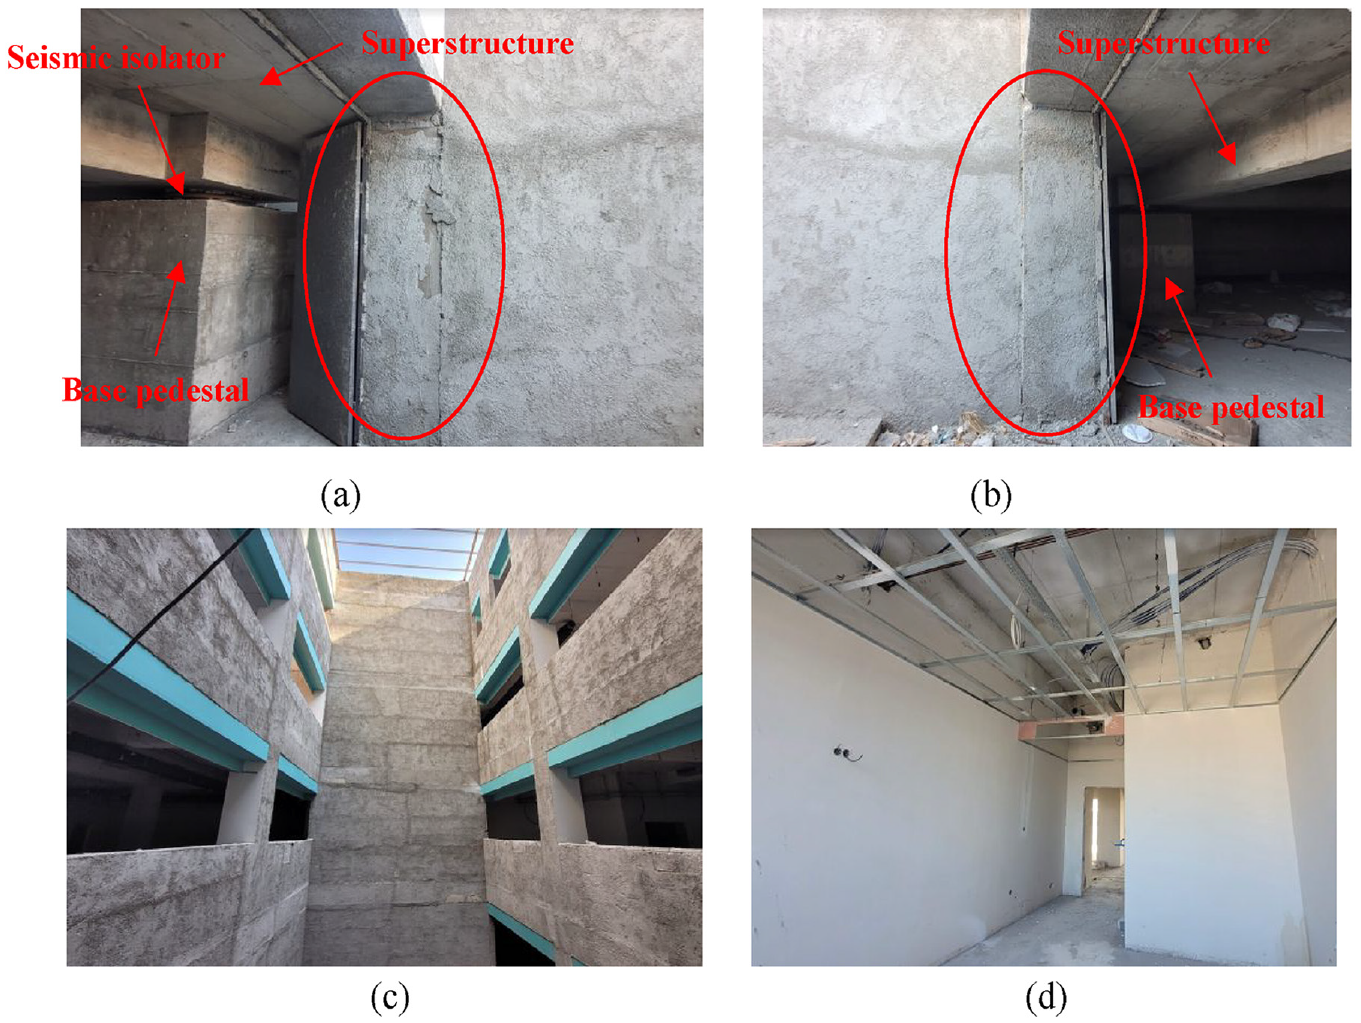
(a) The reinforced concrete wall segment (circled) that was constructed in the seismic gap at the entrance of the isolation story. (b) The opposite side of the entrance part of the wall in the seismic gap is damaged. (c) Completed and plastered walls at the upper stories of Düziçi State Hospital showed no damage.
Malatya Battalgazi State Hospital
The Battalgazi State Hospital was subjected to both earthquakes (Figure 12). The hospital remained operational throughout the earthquakes.
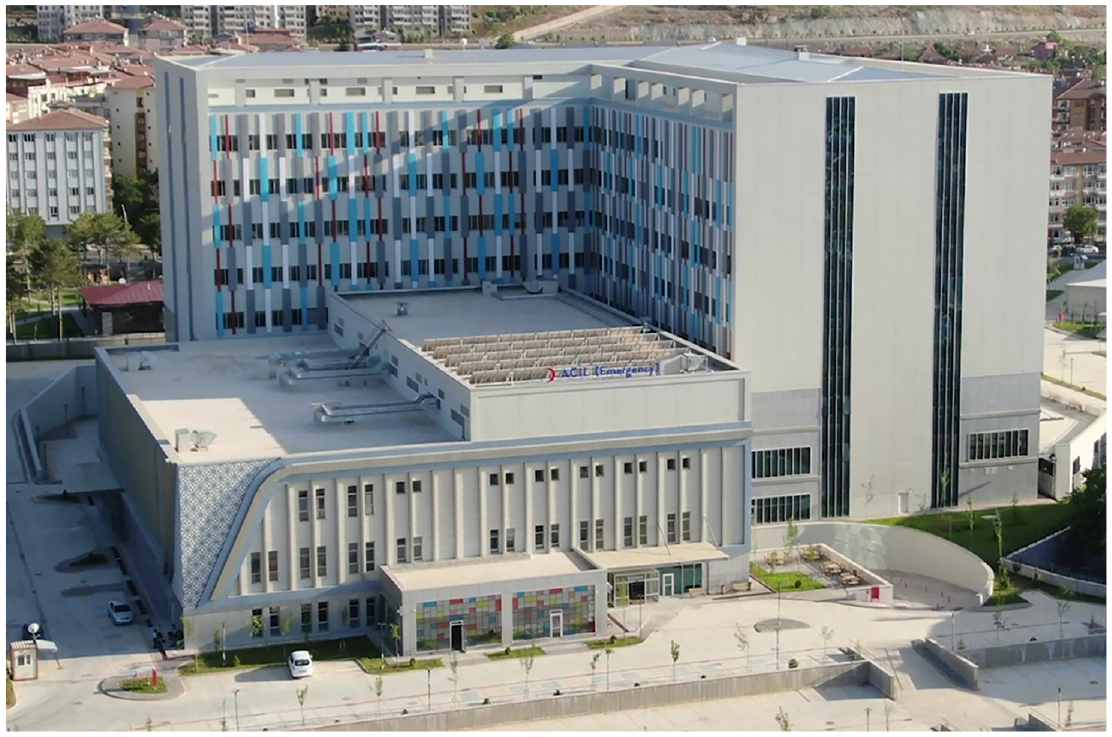
Malatya Battalgazi State Hospital.
Acceleration and displacement spectra of ground motions recorded at a station 31 km from the hospital and the MCE spectra are shown in Figure 13.
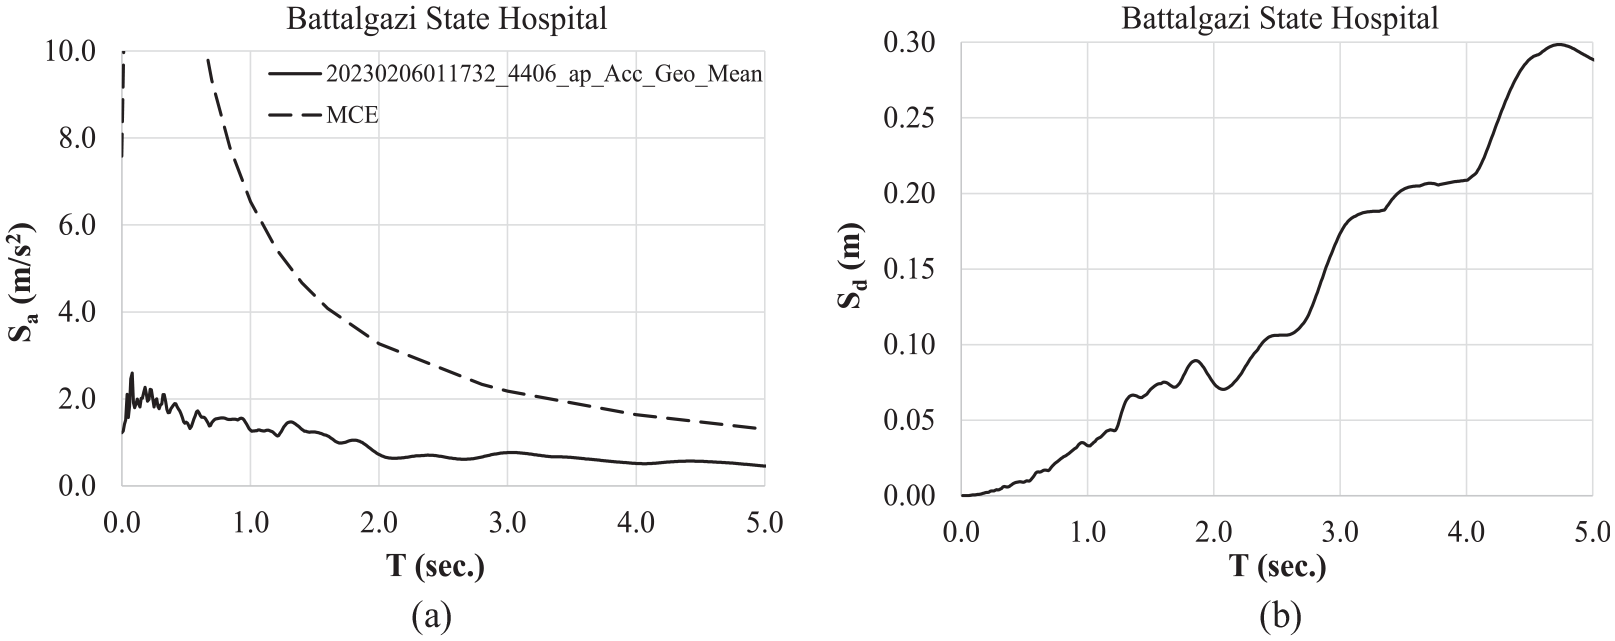
Five percent damped MCE spectra and the geometric mean acceleration and displacement spectra of ground motions recorded at a strong motion station 32 km away from the hospital during the Mw7.8 earthquake.
In both events, seismic isolators were activated. The maximum displacement was calculated to be 160 mm by measuring the distance between the slider marks (the farthest being 80 mm, as illustrated in Figure 14a) from the core of the friction pendulum on one side. A residual displacement of 10 mm was subsequently measured (Figure 14b).
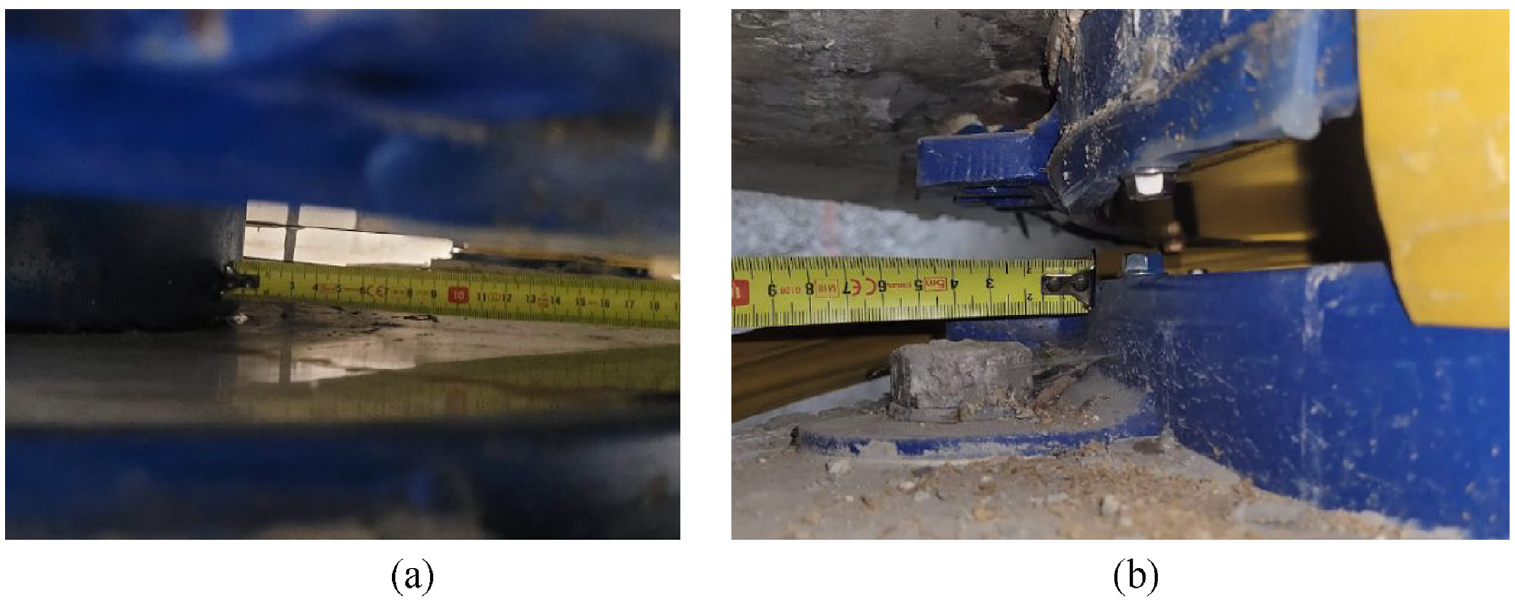
(a) Maximum distance of the Teflon markings on one plate of the isolator (80 mm).(b) Residual displacement of 10 mm between isolator plates.
The seismic isolators were located at the parking level of the hospital building. Accurate measurements were taken from the isolators beneath the elevator core, which are positioned at a lower elevation than the majority of the isolators (Figure 15). A rigid framing is present both above and below the isolator interface (Figure 15a). Upon closer examination of the parking level, it was observed that the seismic detailing for mechanical and electrical installations was well-designed. No apparent deformation or damage was observed in these installations.
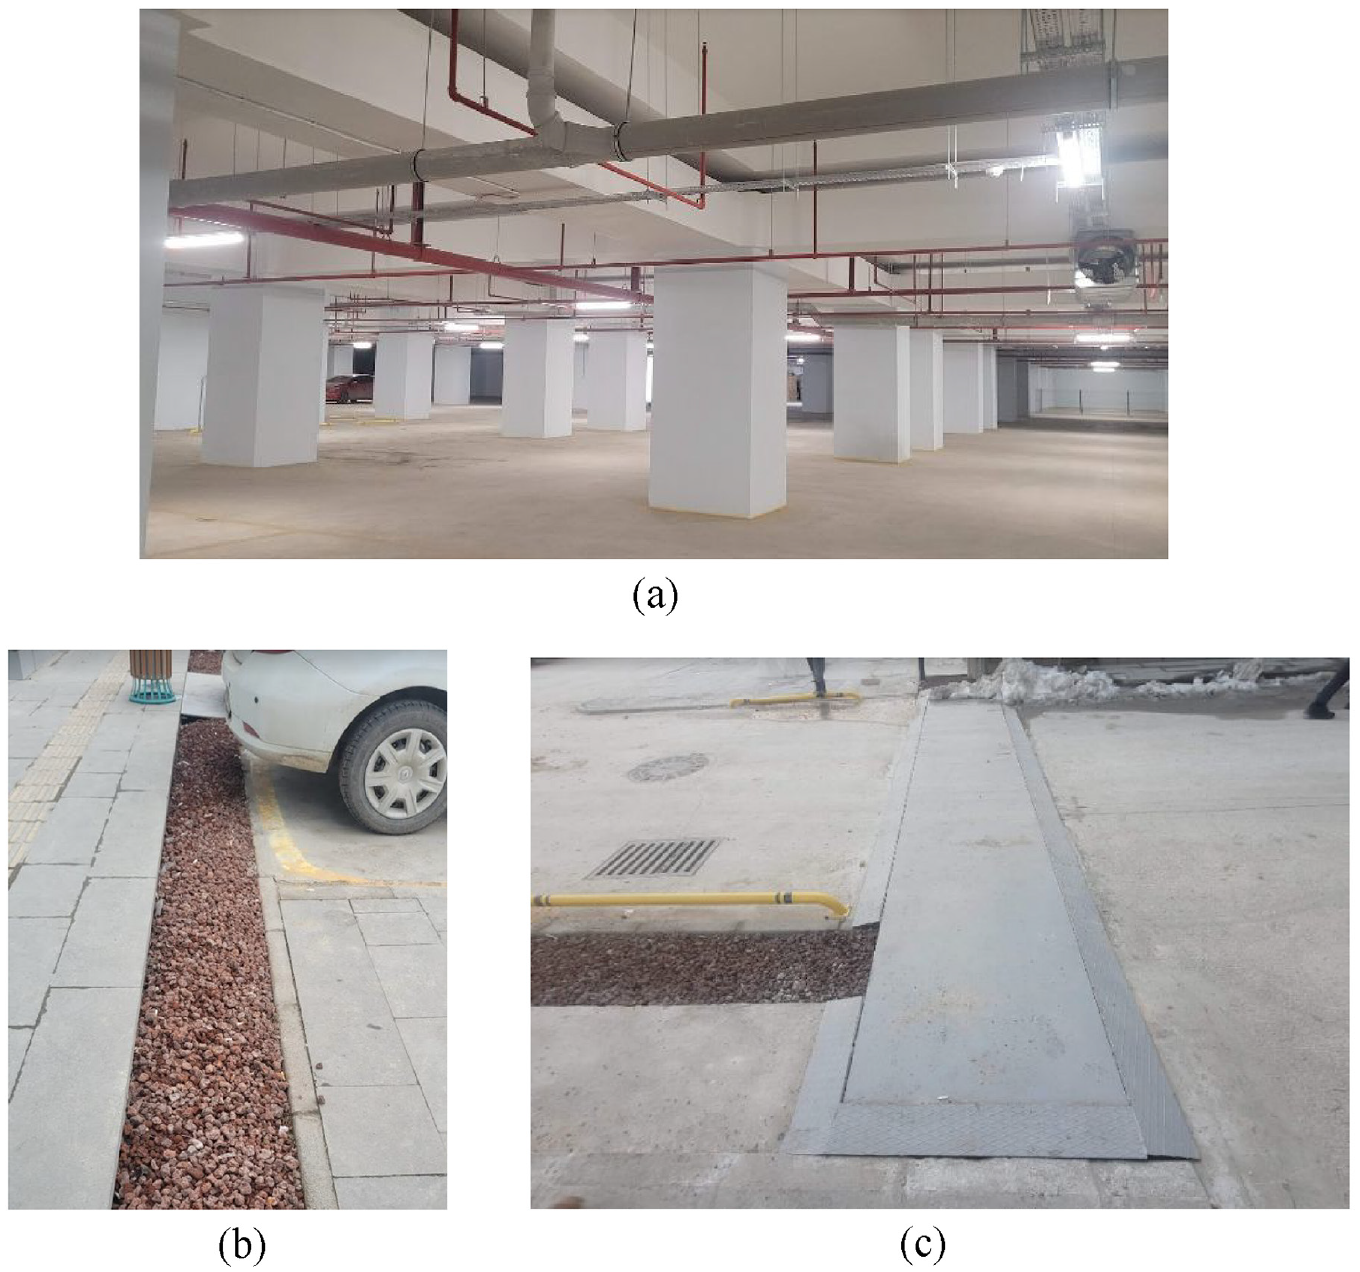
(a) Seismic detailing of mechanical and electrical installation at the parking story. Stiff framing at the isolator interface (top of the columns) is also shown. (b) Detail of seismic gaps around Battalgazi State Hospital. (c) Steel ramp over the seismic gap that allows for free movement of the isolated superstructure (left) of the hospital.
The landscaping around the superstructure perimeter has been constructed with full consideration of seismic gaps. The gap width of 450 mm was filled with crushed pumice, which allows for free deformation around the perimeter (Figure 15b, c). Furthermore, all entrances and access ramps were designed in such a way that the superstructure is free to displace during an earthquake. The application of seismic detailing was effective, resulting in the superstructure sustaining only minor damage, including cracking of infill walls.
Design basis of spherical sliding isolation systems
The design basis for seismic isolation systems considered in this study is outlined in Chapter 14 of the Turkish Building Earthquake Code (AFAD 2018). This chapter is similar in basic principles to Chapter 17 of the ASCE-SEI 7-16 (2016). These basic principles are explained in detail in the existing literature for double spherical sliding (friction pendulum) bearings (Constantinou, 2004; Fenz and Constantinou, 2006) and triple spherical sliding (triple pendulum) bearings (Fenz and Constantinou, 2008; Sarlis and Constantinou, 2016).
Following Chapter 14 of AFAD (2018), the total design displacement (including torsional rotation) is calculated either by the equivalent lateral force procedure (ELF) or the response spectrum analysis procedure when ELF is not applicable. The design spectrum is the site-specific 5% damped MCE spectrum (uniform hazard spectrum with a return period of 2475 years) that has been amplified by a factor of 1.3 in order to approximately account for the maximum direction (AFAD, 2018). The design parameters for a friction pendulum device, as depicted in Figure 16a, are the coefficient of friction µ and the equivalent radius of curvature Req. The latter is approximately twice the curvature radius of the curved surface for double spherical sliding systems. Lower-bound, force-deflection properties are considered in calculating the design displacement.
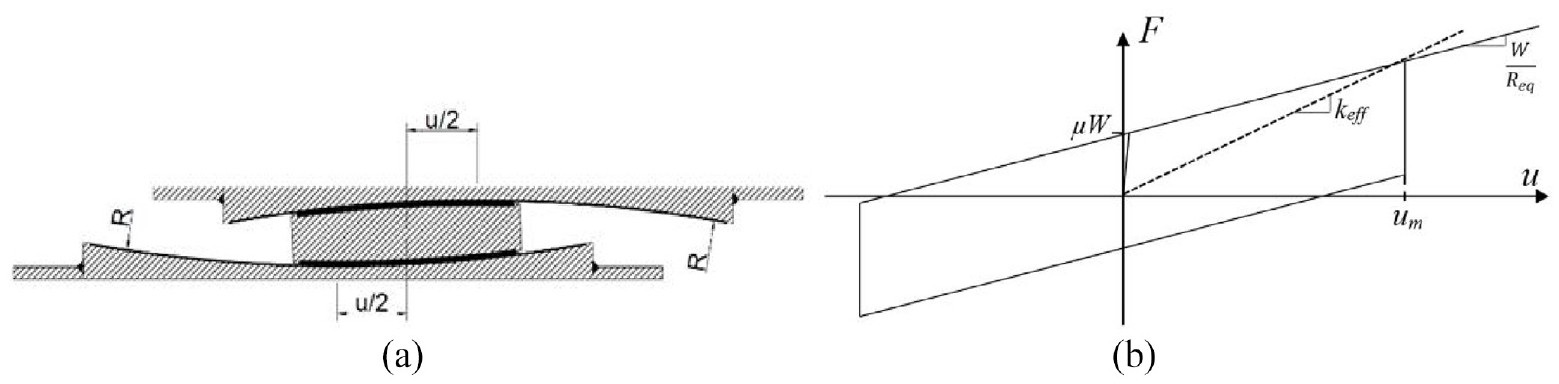
Section view of a double spherical sliding isolator (left), and its lateral force-displacement cyclic response under a lateral force couple F acting at the top and bottom plates (right).
The isolator producer selects the friction material and specifies the required radius of curvature that satisfies the design displacement limit (lower bound force-deflection behavior) and the base shear force limit (upper bound force-deflection behavior). The final verification of the design is based on the results of the response history analysis of the combined isolation-superstructure model under a set of 11 pairs of horizontal ground motions (AFAD 2018) and their corresponding vertical components. The ground motions used for analysis are selected from events with a similar tectonic regime and exhibit magnitudes and fault distances that are generally consistent with those controlling the target spectrum. The selection is based on the criterion that the mean spectrum matches the target design spectrum as closely as possible. The design is then subject to design review by an independent consultant.
Response analysis of the isolated hospitals
Seismic responses of base-isolated hospital buildings have been calculated under the ground motion pairs recorded by the associated strong motion stations indicated in Table 1 (column 7), by employing a simple two-degree-of-freedom nonlinear model where a rigid mass block representing the superstructure is attached to the isolation system. This approach is primarily based on the assumption that lateral displacements of the isolated system are dominated by the isolator displacements. The same assumption is valid in calculating the maximum displacement given the ASCE 7–16 ELF procedure.
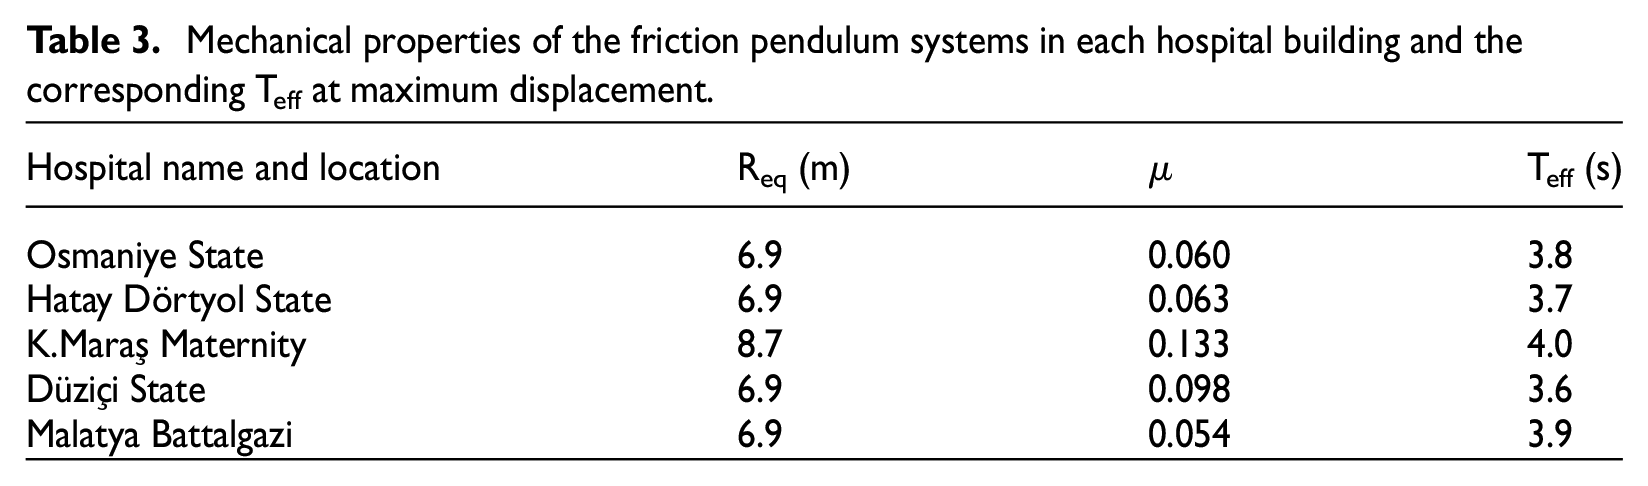
The basic mechanical properties of the isolation systems installed in each hospital are summarized in Table 3. They are provided by the isolator producer, based on the prototype tests, in conformance with the European norms EN 1337-2 (2005) and EN 15129 (2009). The friction coefficient µ is indicative of constructing the force-deflection behavior shown in Figure 16. Vertical loads on the isolators (W in Figure 16) are also provided to us by the isolator producer.
Mechanical properties of the friction pendulum systems in each hospital building and the corresponding Teff at maximum displacement.
Isolator displacements are calculated by nonlinear response history analysis under the biaxial ground motion pairs by employing the hysteresis model shown in Figure 16, with the mechanical properties given in Table 3. Displacement traces on the horizontal plane and displacement time histories in both orthogonal directions are presented in Figure 17a–f, separately for each hospital. MCE (2475 years) and DBE (475 years) displacement demands calculated from the ELF procedure with nominal hysteresis properties are also marked as circular radii on the horizontal plane. These displacements are calculated by the authors in this study.
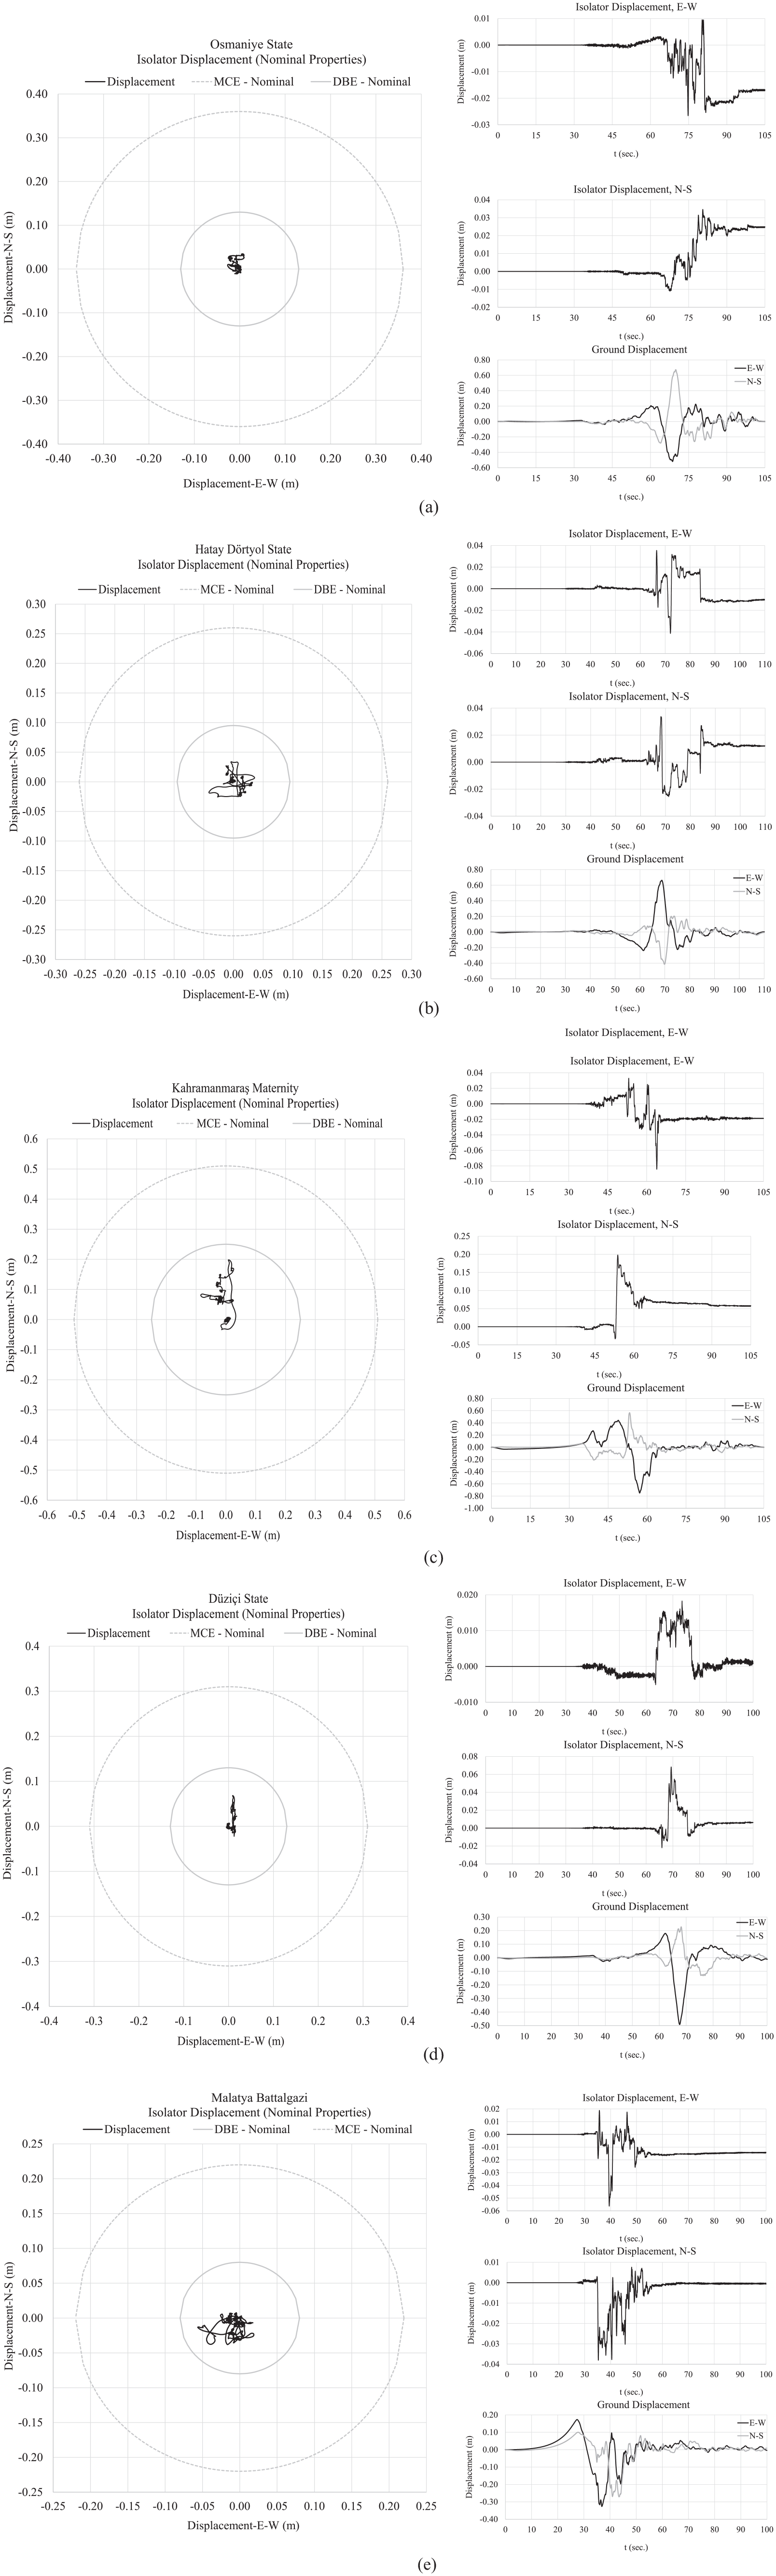
Isolator displacement traces, and the biaxial displacement time histories under the recorded ground motion pairs: (a) Osmaniye State Hospital, (b) Hatay Dörtyol Hospital, (c) Kahramanmaraş Maternity Hospital, (d) Düziçi State Hospital, and (e) Malatya Battalgazi Hospital.
Although the recorded near-fault ground motions were produced by a massive fault rupture exceeding 300 km, the calculated displacements from nonlinear response history analysis are seemingly lower than the PSHA estimates of the 2475-year design displacements.
The maximum displacements calculated from the response history analysis, the maximum displacements measured physically on the isolators after the earthquake, and the design displacements calculated under the MCE design spectra are presented in Table 4.
Calculated and measured displacement performances of the base-isolated hospitals.
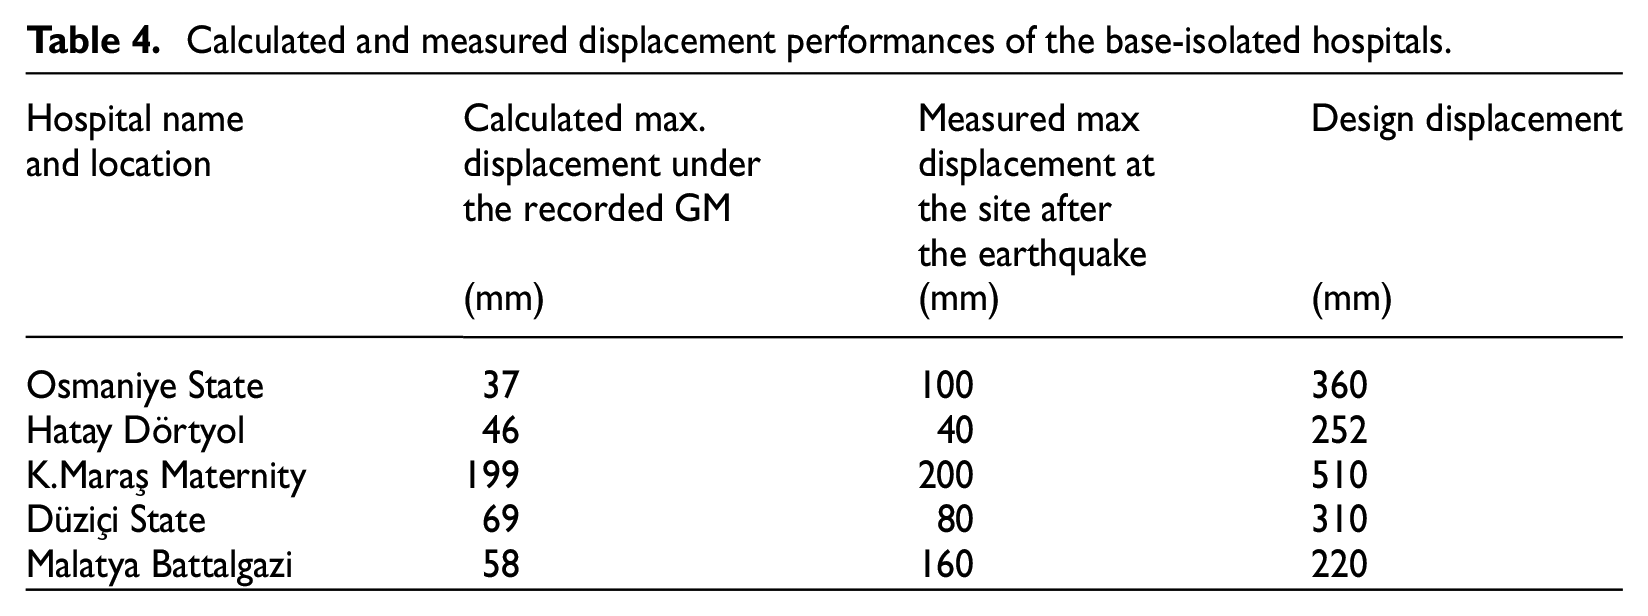
The calculated and measured maximum displacements are shown in Figure 18 for comparison. For two hospitals in this figure (Osmaniye and Malatya Battalgazi), the computed displacements are notably smaller than the measured displacements. In Osmaniye, although the hospital and the strong motion station are very close, the hospital is on soft soil (Vs30 = 255 m/s) whereas the strong motion station is on stiff soil (Vs30 = 350 m/s). In Malatya Battalgazi, both the hospital and the strong motion station are on stiff soils (Vs30=725 and 815 m/s, respectively). However, the distance between the hospital and the strong motion station is the longest (31.6 km). Furthermore, the hospital is closer to the fault (32 km) compared to the fault distance of the strong motion station (42 km). These characteristics are given above in Table 1.
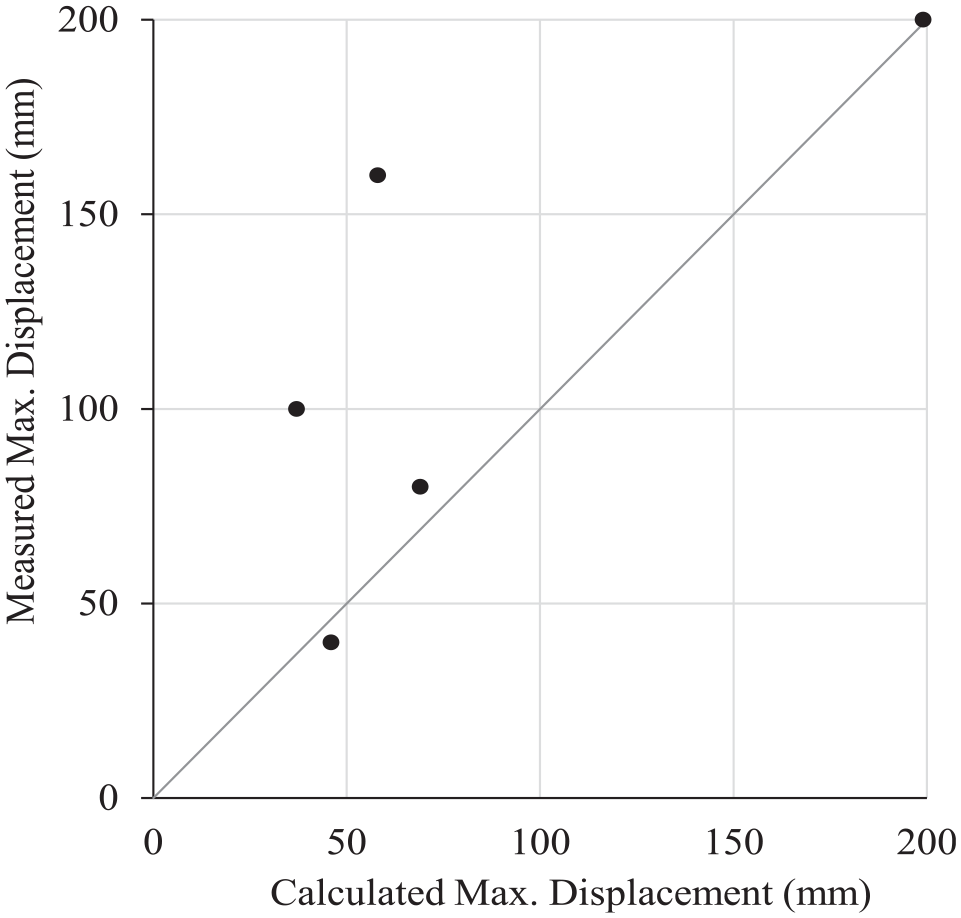
Correlation of calculated and measured isolator displacements. Units in mm.
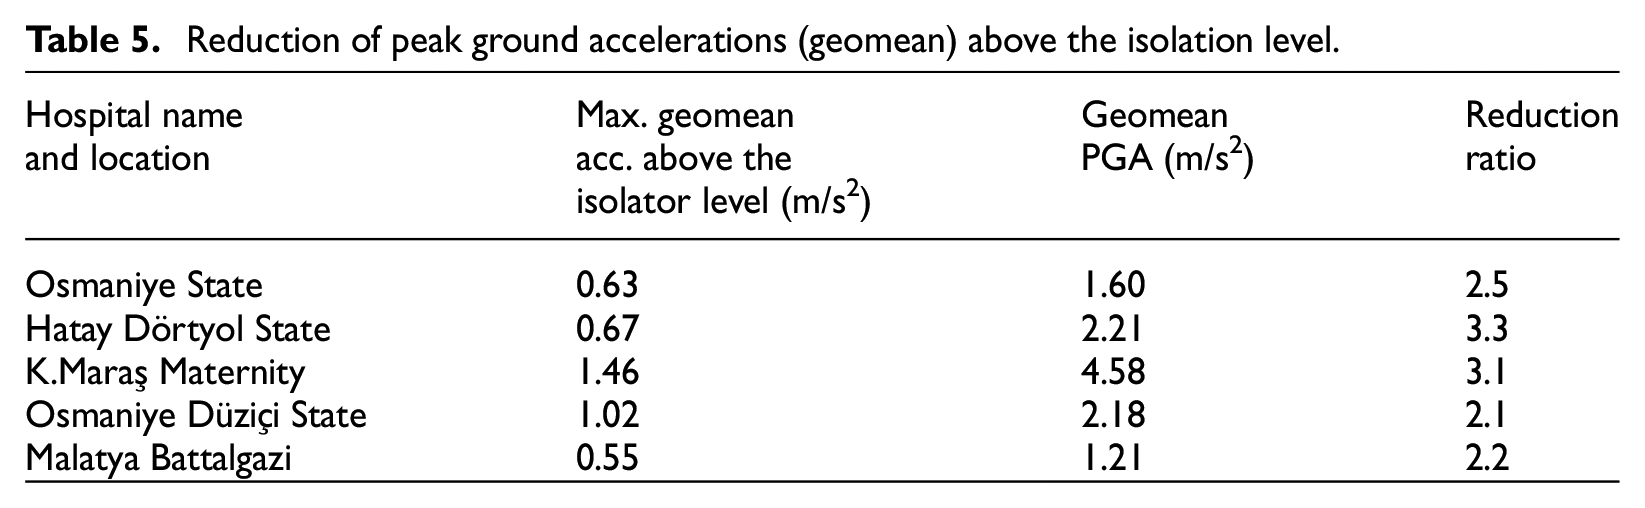
The base isolation systems in each hospital building effectively reduced the peak accelerations above the isolator level, as demonstrated in Table 5, according to the analytical results obtained herein under the recorded ground motions. The maximum acceleration is the maximum geomean value of the acceleration vector obtained from the response history analysis of the 2-DOF nonlinear system, and PGA is the geomean of the two orthogonal PGA components.
Reduction of peak ground accelerations (geomean) above the isolation level.
Conclusions
The following conclusions are drawn from the five base-isolated hospital buildings investigated after the February 6, 2023 earthquakes by the authors, and analyzed under the ground motions recorded at close strong motion stations (less than 30 km) via simple analytical models.
The structural systems of all hospitals were completely undamaged after the two massive earthquakes. None of the recorded motions in the proximity of the hospitals created demands greater than the corresponding MCE design spectra, indicating the effectiveness of seismic isolation.
As a result, the measured displacements of the isolators in all five hospitals are found to be significantly less than their design displacements. The undamaged structural systems of the hospitals after the earthquakes, noted in the previous statement, are a natural consequence of low isolator displacements as well as significantly reduced accelerations above the isolation level.
However, a preliminary investigation of the isolated hospital buildings with reinforced concrete structural framing systems revealed that the seismic isolation measures did not prevent damage to nonstructural components that were not detailed according to the seismic codes.
The maximum physically measured isolator displacements are predicted with good accuracy by nonlinear time history analysis of simple rigid mass models in three hospitals where the differences in soil properties and fault distances between the hospital and the associated strong motion station are small.
Footnotes
Acknowledgements
The authors would like to thank Mr. Ömer Ülker of Ülker Consulting and Mr. Uğurcan Özcamur of TIS Inc. for providing the information on the seismic isolation designs of hospitals reported in this study.
Declaration of conflicting interests
The author(s) declared no potential conflicts of interest with respect to the research, authorship, and/or publication of this article.
Funding
The author(s) received no financial support for the research, authorship, and/or publication of this article.