
Abstract
Traditional unreinforced masonry structures are extremely vulnerable to seismic events, featuring large losses in many countries worldwide. This study focuses on the seismic assessment of a traditional masonry structures located in Faial Island—Azores (Portugal), which was hit by an earthquake of M w = 6.2 on 9 July 1998. A set of analyses was conducted through a probabilistic performance-based seismic approach, employing a stochastic finite-fault ground-motion simulation method to derive region-specific records and nonlinear numerical models to compute the capacity of the building. Subsequently, analytical fragility curves were derived considering different seismic scenarios. The results show a significant probability of the structural typology to reach moderate to extensive damage in the case of the specific earthquake, as observed in reality. The study holds significant importance in regions with limited recorded seismic activity, as they offer potential benefits for seismic risk management and mitigation strategies.
Keywords
Introduction
The Azores archipelago is composed of nine volcanic islands located in the mid-Atlantic (see Figure 1a), approximately 1500 km west of Portugal. This region is situated on the boundary between the North American and Eurasian tectonic plates characterized by frequent seismic activity. The seismicity of the Azores plateau can be divided into three main areas: (1) the eastern group of islands composed of São Miguel and Santa Maria; (2) the central group, which includes Terceira, Graciosa, São Jorge, Pico and Faial; (3) the western group, which comprises Flores and Corvo islands. The eastern group (1) is the most seismically active region, with frequent small earthquakes and occasional large events. The central group (2) is also seismically active but experiences fewer earthquakes than the eastern group, while the western group (3) experiences the least seismic activity.
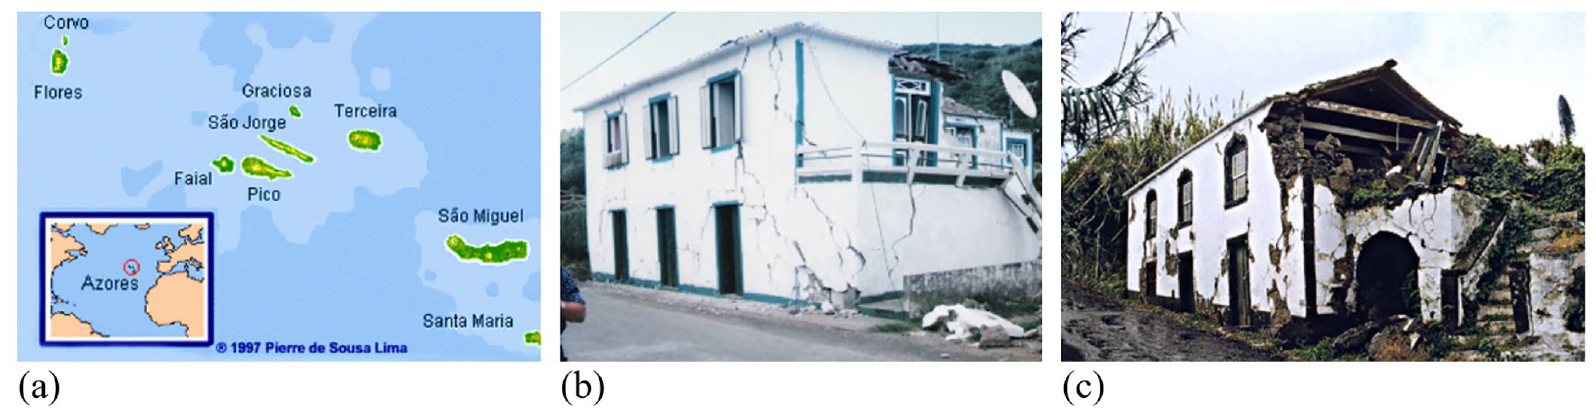
(a) Azores archipelago. (b) and (c) Examples of damage suffered by buildings in the 1998 Faial earthquake with M w = 6.2 (Costa et al., n.d.; Neves et al., 2012).
Despite some regions of the Azores archipelago being currently considered in the range of low-to-moderate seismic intensity levels, they have been affected in the past by large earthquakes. Faial Island was hit by an earthquake with M w = 6.2 in 1998 (Morais et al., 2021). In this regard, the nature of the observed damage was mainly associated with the traditional and predominant building typology in that region, which is mostly characterized by stone masonry walls and flexible timber floors, making these structures highly vulnerable to seismic actions (Costa and Arêde, 2006). Following the earthquake, several inspections were conducted in the buildings, which determined that roughly 50% required minor repairs, 30% required extensive repairs, and 20% needed to be demolished (Neves et al., 2012). Some examples of damage suffered by buildings are depicted in Figure 1b and c.
The past major event in Faial Island raised the interest of researchers in evaluating the seismic damage of different structures in the region and in predicting their behavior for future earthquakes (Bernardo et al., 2022a). In this sense, several studies can be found in the literature regarding the seismic performance of different structures. For instance, the research carried out in the work by Guerreiro et al. (2000) identified and described the damage modes and possible collapse mechanisms of 30 masonry churches based on in situ observation. The observed damage was correlated with the structural typology, seismic action level, quality of masonry, and the existence of previous retrofit or structural interventions. Likewise, the work of Neves et al. (2012) was conducted in three stages, including a comprehensive description of the building stock; a damage grade classification based on the observed damage mechanism; and finally, the seismic vulnerability assessment of the building stock. A probability of collapse of about 30% was found for moderate-to-high intensities (VII and VIII within the European macroseismic scale (EMS) 98 scale) (Grünthal, 1998). Ferreira et al. (2017) addressed the seismic vulnerability of the old city center of Horta in Faial Island through the analysis of 192 buildings using a simplified vulnerability assessment method. The authors estimated the number of collapsed and unusable buildings considering different intensities and associated their results with the low resistance and high vulnerability of the building stock. More recently, Maio et al. (2017) assessed the seismic vulnerability of two stone masonry buildings in the Faial Island using the N2 Method (Code, 2005) and the Capacity Spectrum Method (CSM) (Council, 1996), for a set of ground-motion records representative of the 1998 Faial earthquake. The authors highlighted the potential application of retrofitting solutions considering the in-plane seismic response. It should be noted that most of these investigations have been limited to the availability of recorded accelerograms and post-damage in situ observations. In this regard, reliable seismic risk assessment demands region-specific hazard definition and proper characterization of earthquake ground motions. Given the lack of recorded accelerograms characteristic of large-magnitude events in regions of moderate levels of seismic hazard, the use of simulated records is a suitable alternative. Ground-motion simulations can be employed as input for vulnerability models to predict damage scenarios at urban scale (Antonietti et al., 2021).
The seismic performance assessment of structures requires region-specific ground-motion definition. Given the lack of recorded accelerograms characteristic of large-magnitude events in regions of moderate levels of seismic hazard, the use of simulated records is a suitable alternative. Recent studies have implemented simulations and validated their use in earthquake engineering practice. Among them, Zonno et al. (2010) implemented the stochastic finite-fault method (Motazedian and Atkinson, 2005) to reproduce synthetic time series representative of the islands affected by the 1998 Faial Earthquake in the bedrock by validating the simulations at one near-fault station. The simulated data were used for damage estimation by comparing the mean damage index (Dolce et al., 1999) and macroseismic method (Lagomarsino and Giovinazzi, 2006). Burks and Baker (2014) focused on the validation of ground-motion simulations by proposing a list of proxy parameters for the response of engineering systems, including the correlation of spectral acceleration (Sa) across periods, the ratio of maximum-to-median Sa across all horizontal orientations, and the ratio of inelastic-to-elastic displacement. They emphasized that the interperiod correlation structure of ground-motion simulations should align with that of an empirical model, such as the work by Baker and Jayaram (2008). Similarly, Dreger et al. (2015) compared simulated and empirical residuals of RotD50 peak spectral accelerations (PSAs) for 12 earthquake events. Later, Bijelić et al. (2018) assessed the performance of two tall buildings (20 and 42 stories) under comparable sets of simulated and recorded motions, leading to the identification of bias induced by differences in correlations of spectral values in some of the stochastic ground-motion simulations. Bayless and Abrahamson (2018) directly investigated the impact of interperiod correlation on ground-motion simulations in structural assessment, underscoring the inadequacy of tested stochastic finite-fault simulations in addressing such correlations, which could lead to undesired variability in structural response or underestimation of dispersion and nonconservative estimations in risk assessment, prompting modifications to the stochastic point-source approach by Boore (1983) to enhance its ability to account for them. Wang et al. (2019) suggested an alternative method to enhance interperiod correlations in simulations through postprocessing techniques. Alternatively, Altindal and Askan (2023) demonstrated that accounting for uncertainty in the primary input-model parameters of scenario-based simulations implicitly addresses variability similar to empirical models. However, they observed that their simulations tend to overestimate interperiod correlation compared to existing literature (Baker and Jayaram, 2008), potentially due to the flattened spectral amplitudes of simulated motions when contrasted with real records. The authors suggested that this phenomenon could potentially lead to increased seismic demands, prompting a deeper investigation into using these ground motions as input for structural response history analysis. Finally, it is important to note that, as highlighted in the work by Burks and Baker (2014), the interperiod correlation gains particular significance in the context of seismic demands on multiple-degree-of-freedom systems, especially those subjected to excitation at multiple periods.
Literature review reveals that limited studies have investigated the use of simulated motions for seismic assessment of masonry structures. Hoveidae et al. (2021) investigated seismic damage to a historic masonry monument in Tabriz, Iran, for different scenario earthquakes using stochastically simulated ground-motion records, while Karimzadeh et al. (2021) addressed the influence of ASCE/ SEI 7–16 (Loads, 2017) and Eurocode 8 (EC8) (Code, 2005) ground-motion selection criteria for estimating the seismic demand of masonry structures considering both real and simulated suites of records. Karimzadeh et al. (2024a) conducted a recent investigation into the efficacy of simulations of the 1998 Faial earthquake through site-based (Rezaeian and Der Kiureghian, 2010) and finite-fault (Atkinson and Assatourians, 2015) stochastic approaches against real records for seismic assessment of masonry prototypes. Despite differences in engineering demand parameters (EDPs) estimated through real and simulated records, the authors noted that simulated records show promise for estimating seismic demands on these types of engineering structures. However, they emphasized that the validation of simulations is highly dependent on the specific application and that the accuracy of simulations may vary depending on the parameters under analysis.
The scope of this work is deriving fragility curves of traditional masonry buildings located on Faial Island through structural numerical analysis and simulated ground motions. This study represents the first comprehensive investigation of its kind in this region, providing essential information to support future risk studies. The obtained results in terms of expected damage are compared with the post-earthquake damage observations in 1998 to validate the methodology employed. Due to the scarcity of real records corresponding to the instrumental area in the region, simulated records are alternatively employed in this study. The simulated datasets used in this study are derived from the work by Karimzadeh et al. (2024b), where the stochastic finite-fault method based on dynamic corner frequency algorithm (Atkinson and Assatourians, 2015; Motazedian and Atkinson, 2005) is implemented to generate region-specific records. Subsequently, ground-motion selection is conducted from these simulated record datasets for various scenario events of magnitudes ranging from 5.0 to 6.6 accounting for dispersion in terms of peak ground acceleration (PGA). Nonlinear numerical models are then constructed for different buildings to estimate their seismic capacity. Subsequent analyses are conducted through a probabilistic performance-based seismic approach to compute the response of the buildings for different seismic scenarios. The computation of uncertainty in the seismic demand is estimated using cloud analysis. Finally, numerical fragility curves are derived considering different seismic scenarios, demonstrating a large probability of these structures to reach moderate to extensive damage stages for large-magnitude events. The results show a satisfactory prediction from the point of view of numerical damage estimates and those observed in situ.
Seismic action modeling
This study focuses on the Azores plateau in Portugal as the study area for the modeling of seismic action. This region is dominated tectonically by the Azores triple junction between the North American plate, the Eurasian plate, and the African plate. The central and eastern parts of the plateau are characterized by a diffuse and complex deformation zone, which underwent shearing under a dextral trans-tensile regime. More in detail, the study area comprises only five islands, namely Faial, Pico, São Jorge, Terceira, and Graciosa. The following sections describe the ground-motion simulation and selection approaches with the corresponding results.
Ground-motion simulation approach and results
This study employs the simulated dataset generated in the work by Karimzadeh et al. (2024b) based on the stochastic finite-fault ground-motion simulation methodology (Atkinson and Assatourians, 2015). In this approach, the simulation algorithm, proposed in the work by Motazedian and Atkinson (2005) and based on the original FINSIM code by Beresnev and Atkinson (1998), is improved from the suggestions of Boore (2009). This approach considers multiple factors, such as earthquake magnitude, fault geometry, slip distribution, density, rupture velocity, and strike to identify the fault rupture. The method combines the source contribution with attenuation parameters and site effects to obtain the seismic signal in the time domain at any observation site. In the stochastic finite-fault method, the ruptured fault plane is divided into smaller sub-sources represented as a grid, with each sub-source assumed to be a point-source with a ω−2 source spectrum as proposed in the work by Boore (1983). The sub-sources rupture with a time delay that depends on their distance from the hypocenter, and the time domain summation of the contributions from the delayed sub-sources is carried out to obtain the final ground-motion simulation (Atkinson et al., 2011). It should be emphasized that this method offers only one random horizontal component for the ground-motion records.
The study by Karimzadeh et al. (2024b) performed the simulations within the EXSIM12 platform (Atkinson et al., 2011) to model the acceleration time series of the scenario events. In their study, 23 scenario events featuring varying magnitudes M w ranging from 5.0 to 6.8 with a bin size of 0.1 were simulated due to the rupture of different active fault planes in the region. Madeira et al. (2015) found that the fault length indicates a maximum expected magnitude of 6.8 within the region. It is important to note that these simulations were not limited to a single fault but instead involved various active faults in the Azores Plateau, as referred to in Figure 2, thus covering the aleatory region-specific uncertainty using the proposed framework. All simulations were accomplished in 359 nodes inside all islands with a grid size of 1 km (as shown with triangular symbols in Figure 2) and were performed in the bedrock. Region-specific input parameters provided in the work by Karimzadeh and Lourenço (2022) and Karimzadeh et al. (2024a), based on simulation validations against observed motions from the 1998 Faial (M w = 6.2) event, were adopted to calibrate the simulation parameters for these events. However, to account for the uncertainty associated with the parameters representing source and attenuation effects, key parameters such as hypocenter location, stress drop, pulsing percentage, quality factor, and kappa were handled as random variables. Regional models with probability distribution functions (PDFs) and their ranges were implemented using the study by Carvalho et al. (2016). For every event, 30 Monte Carlo simulations were performed, each with distinct combinations of input parameters. Therefore, each scenario event was simulated using 30 different random input-model parameters, resulting in a total of 690 simulations performed at 359 sites. Further information can be found in the research conducted by Karimzadeh et al. (2024b).
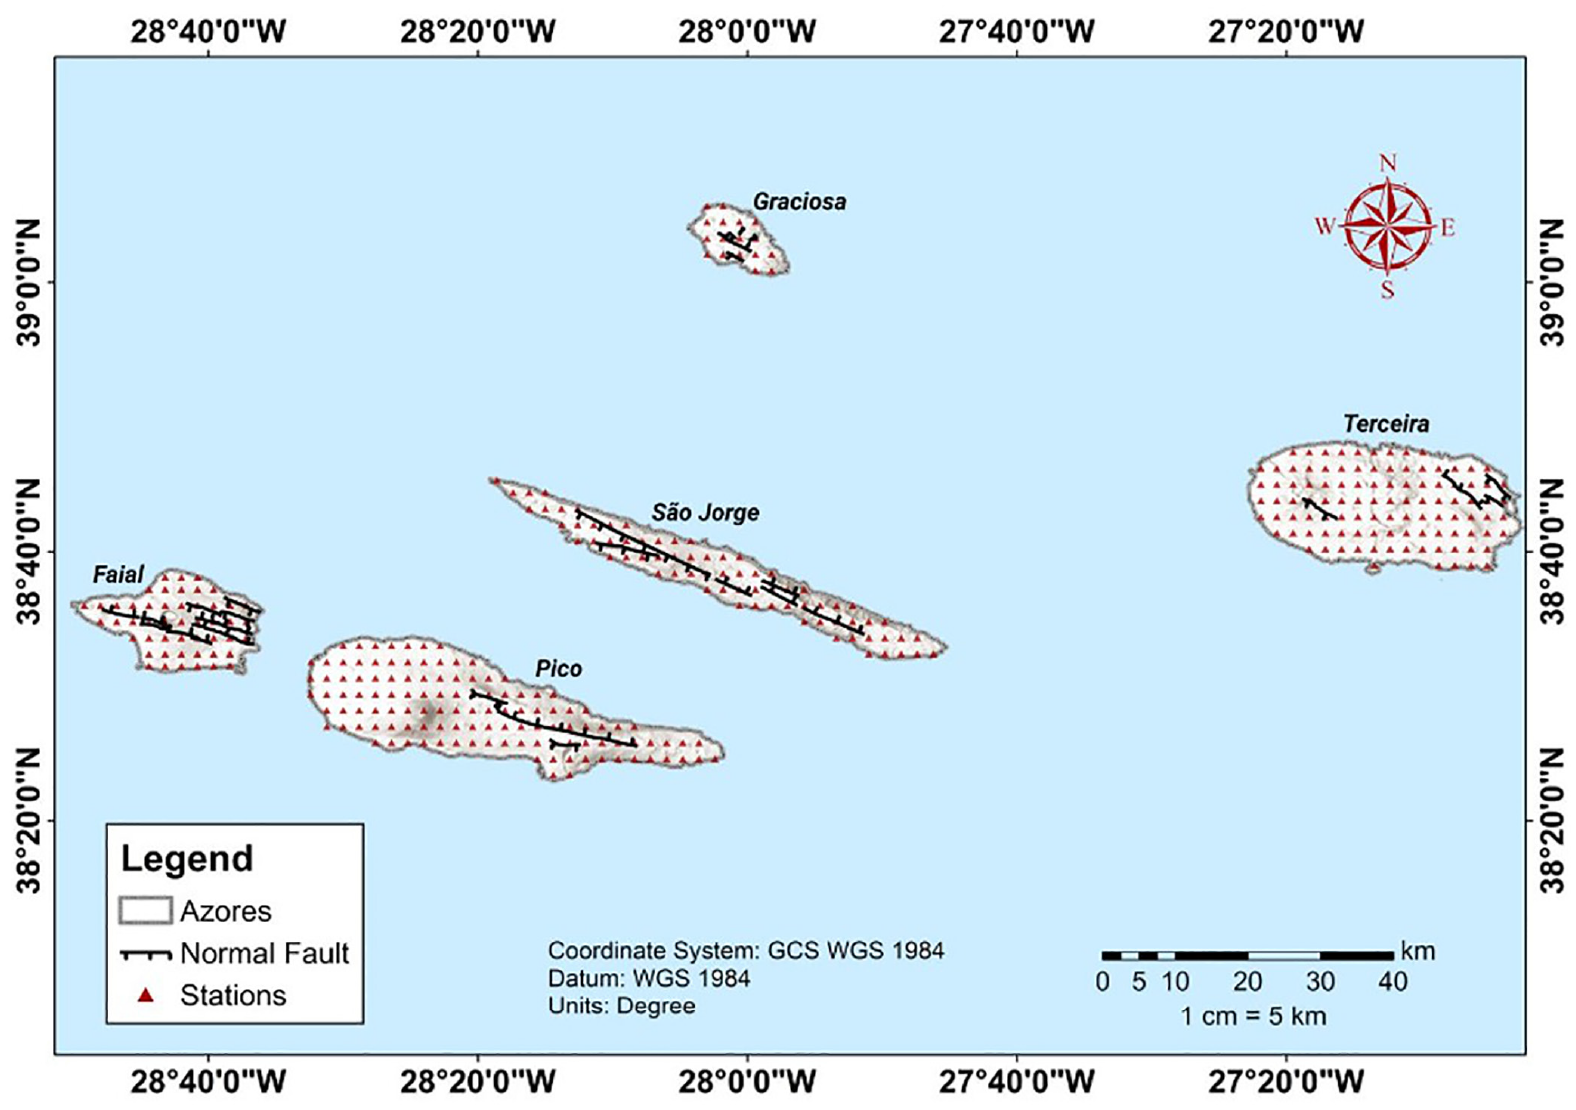
The study area showcasing tectonic plates, with triangular symbols indicating the used stations for ground-motion simulations. The black dots in each fault show the faulting mechanism, which is normal.
The results of simulations carried out for different scenario events in the region effectively demonstrate the inclusion of aleatory uncertainty through stochastic simulations. This aspect is further exemplified by computing the 5% damped pseudo-Sa values of the simulated dataset for randomly chosen stations situated at the center of each island. These computations are performed for a sample scenario event with the largest magnitude (M w = 6.8) due to a fault rupture in Faial Island, and the resulting Sa values are plotted in Figure 3. A comprehensive representation of the Sa values at each station is given, including the individual mean, median, standard deviation (std), minimum (min), and maximum (max) values for all simulations. This information is useful in providing a clear understanding of the variability in the dataset and the potential range of Sa values that could be observed at each station. The range of probable spectral values demonstrated by the plotted Sa values serves as evidence of the stochastic behavior of the dataset. This observation is similarly observed across other scenario events due to ruptures occurring in other active faults within the region. Moreover, as the distance from the nearest island, such as Faial, to the farthest one, such as Terceira, from the ruptured fault plane increases, the peak value of Sa shifts toward longer periods, and there is also attenuation in terms of the amplitudes. This pattern aligns with the physical characteristics of distance-dependent damping in ground motions.
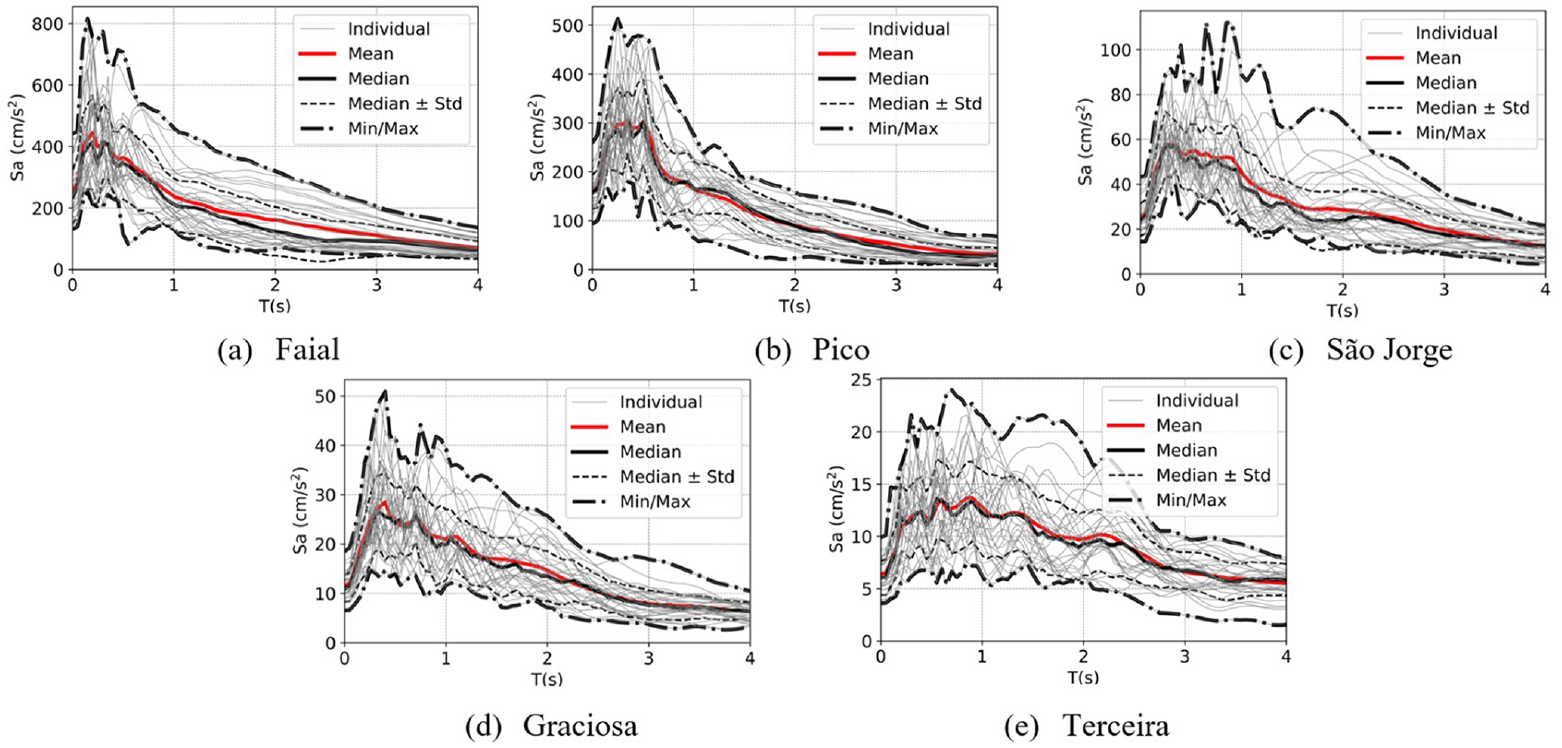
Damped (5%) Sa for stations in the center of Azores Islands.
Finally, it is crucial to emphasize that, because of the scarcity of empirical data and the lack of a suitable backbone ground-motion model, further validation of simulations (e.g. interperiod correlation) seems challenging. As indicated in the research by Karimzadeh et al. (2024b), the simulated dataset from the stochastic approach faces challenges in precisely capturing the coherent, long-period pulses that impact the features of ground motions near faults, particularly in the context of peak ground velocity (PGV) and PSA at extended periods. However, given that this investigation focuses on masonry structures, primarily characterized by short periods, it is believed that using these record sets poses minimal discrepancies for their seismic assessment, as supported by findings in the research conducted by Karimzadeh et al. (2024a), where an engineering validation of the simulated dataset was carried out for masonry prototypes in this region. Yet, it is important to note that before implementing these datasets in broader engineering applications, it is imperative to conduct additional validations, taking into account inherent limitations of stochastic finite-fault approach. Furthermore, it is essential to acknowledge the inherent case dependency in validation processes and emphasize the importance of employing a robust approach. In addition, recognizing the challenges in accurately capturing interperiod correlation of real records through stochastic simulations is crucial, as it can introduce uncertainty in seismic demand estimation, especially when multiple periods of the structure are excited.
Ground-motion selection approach and results
At this stage, sets of simulated records are selected for M w values of 5.0, 5.1, 5.2, 5.5, 5.6, 5.8, 6.0, 6.2, 6.4, and 6.6, respectively. Each suite corresponds to a specific value of M w in which 10 records are selected to cover the PGA dispersion for each scenario earthquake. On top of that, it has been extensively demonstrated how masonry constructions are highly sensitive to acceleration intensities, normally correlated with the PGA metric (Calderoni et al., 2016; Koc et al., 2023; Penna et al., 2014b; Tomić et al., 2021). Figure 4 shows the Sa of the 10 sets of the selected records, covering the distribution of PGA for each scenario earthquake. Changes in spectral amplitudes are clearly noted within all 10 scenarios selected for the analysis. Spectral amplitudes sequentially increase as with M w , reaching PGA values larger than 1000 cm/s2 for some of the simulations with M w ≥ 6.2. Furthermore, the distribution of spectral amplitudes is consistent with the observations after 9 July 1998, earthquake in the Faial Island (M w ≥ 6.2; Catita et al., 2005; Matias et al., 2007). It should be noted that the accuracy of the simulation methodology, adopted in this research to characterize the seismic action, was formerly examined in the work by Karimzadeh et al. (2024a) from an engineering standpoint. This research showed the consistency of the simulated dataset (Karimzadeh et al., 2024b) in terms of structural response predictions of monumental masonry against real records available from four stations near the site of the event (epicentral distances less than 150 km). However, broader applications in engineering practice require additional validations, considering inherent limitations.
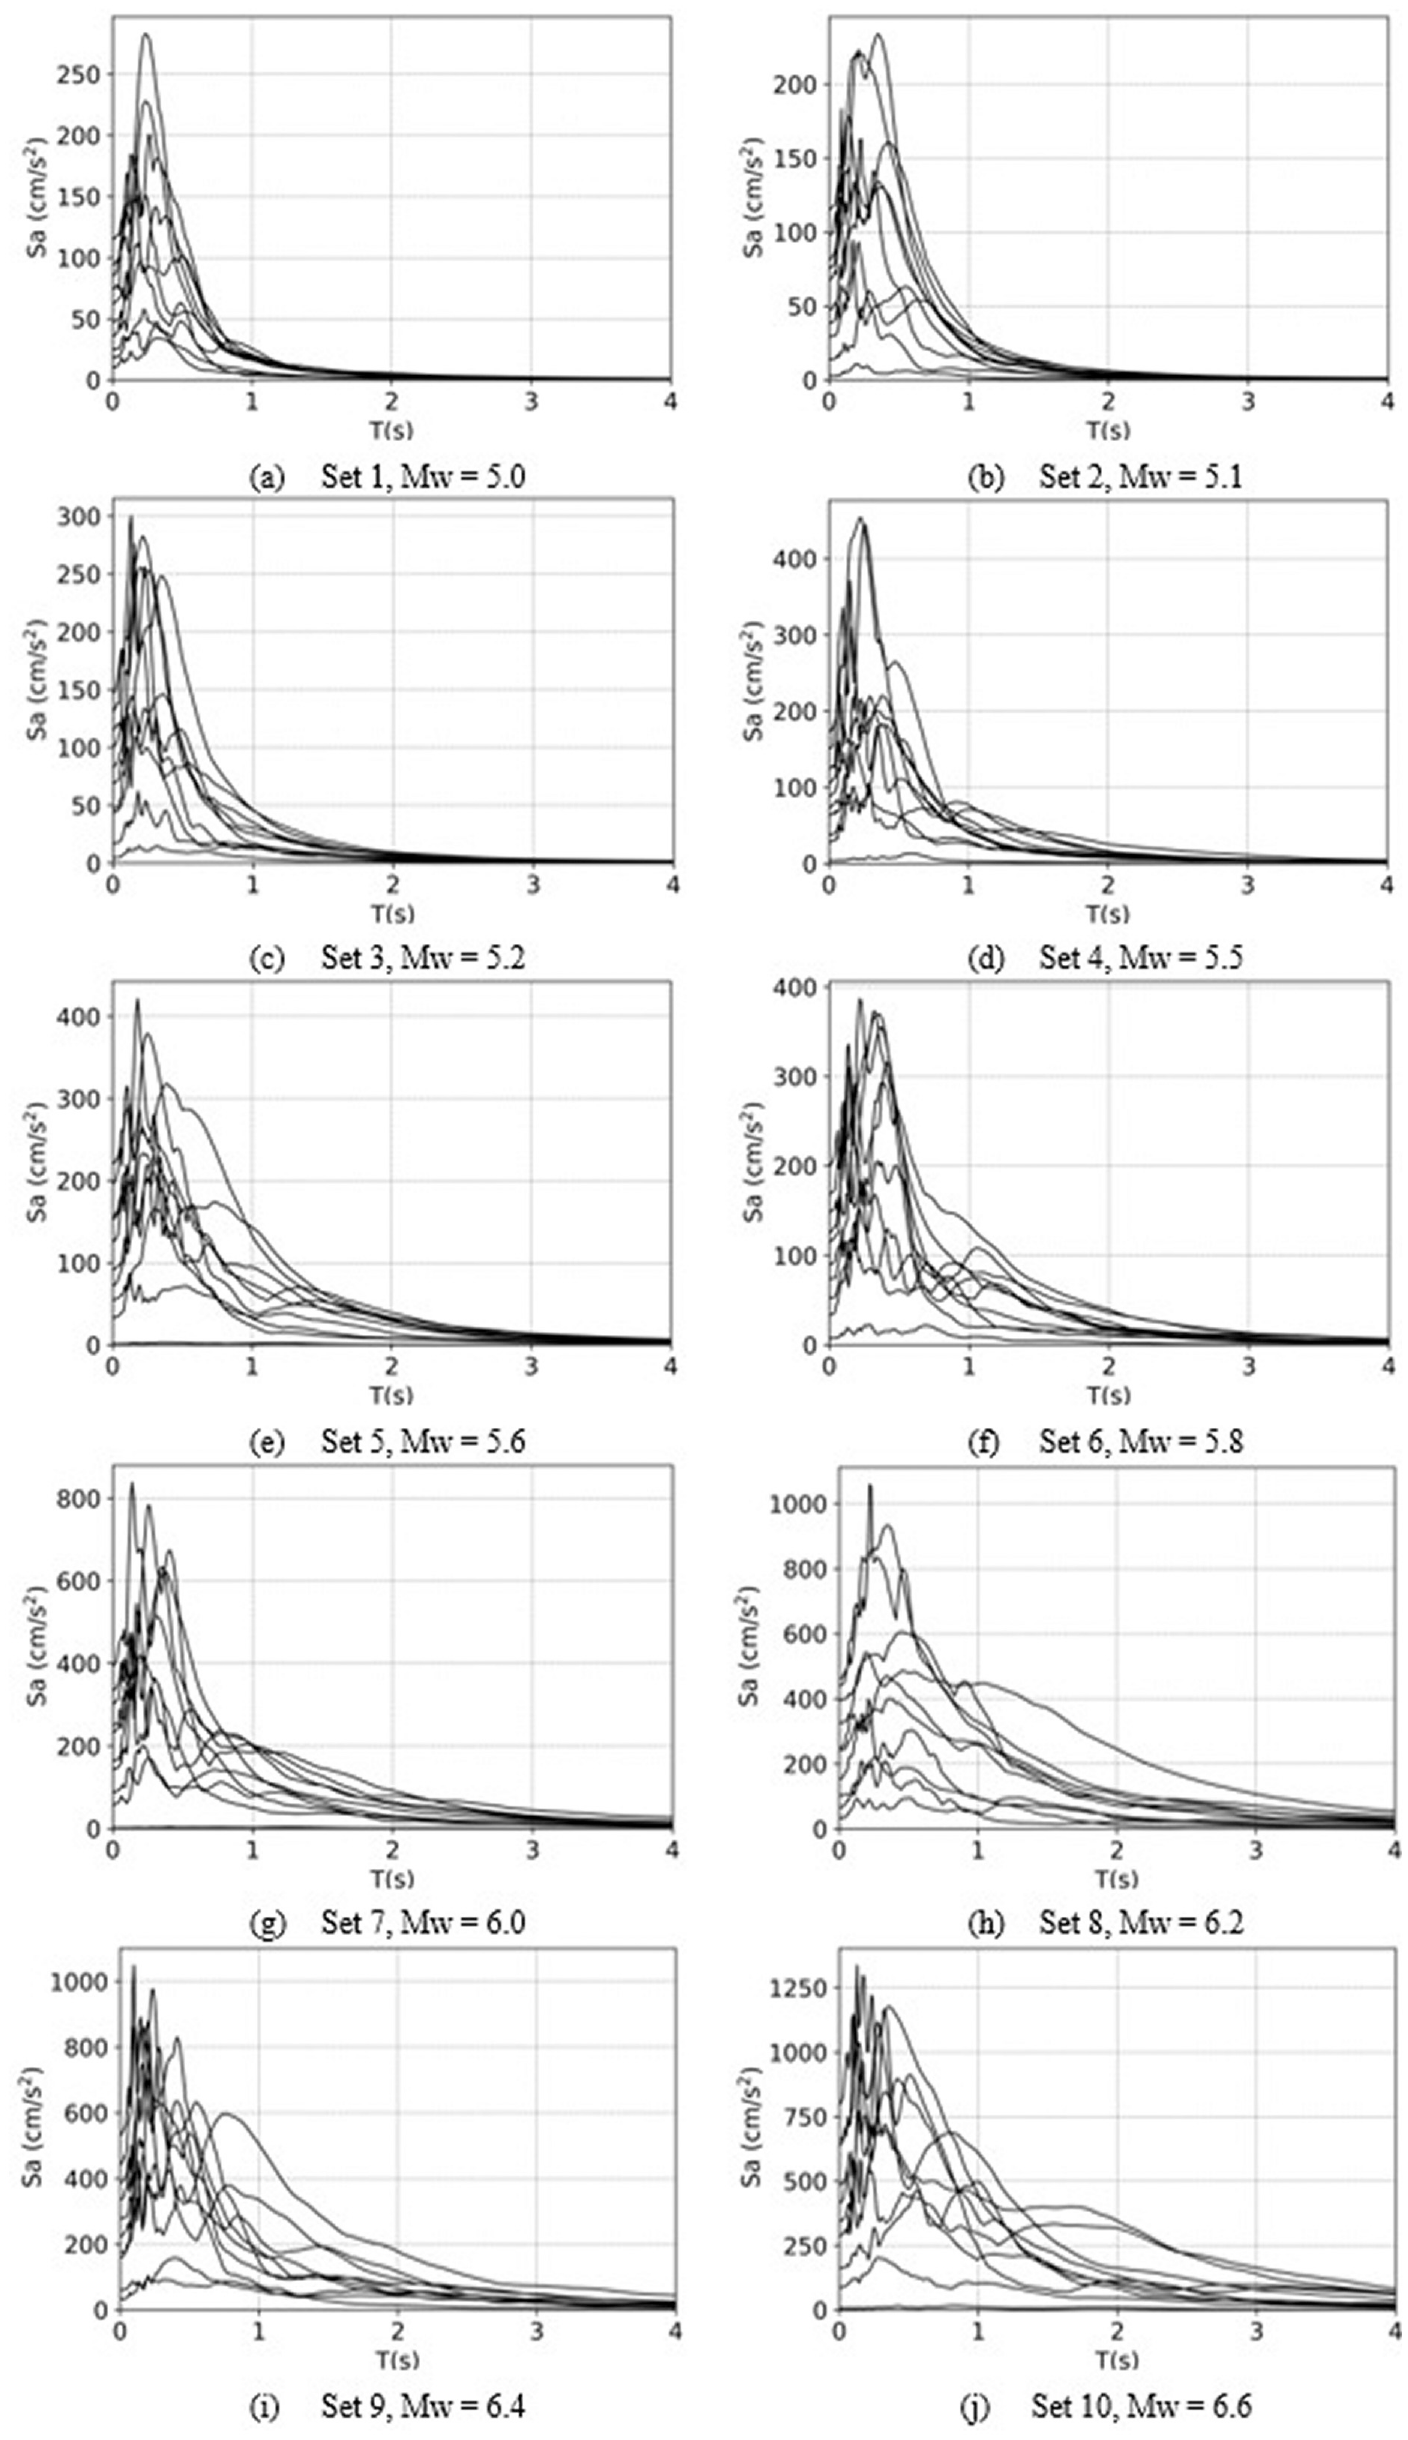
Sets of selected records for each scenario earthquake.
Structural capacity and seismic response
This section defines the representative building typologies analyzed in the scope of the present work and the corresponding tridimensional numerical models. The seismic response of the buildings is computed for different scenarios presented in the previous section by considering a performance-based approach.
Building typology description
The traditional construction in Faial reflects the island’s history and cultural heritage, which is an important part of its identity. The building stock on the island has evolved over time to meet the practical needs of the local population and can be classified according to various construction system types, including the type of vertical resisting structure, type of floor, and roof structure. A clear characterization of the building stock in Faial Island is presented in the work by Neves et al. (2012). In the scope of this study, the construction type analyzed corresponds to the Unreinforced Masonry (URM) buildings composed essentially of stone masonry load-bearing walls and timber floors. This typology represents around 60% of the building stock in Faial Island and is considered one of the most vulnerable types of structures in case of seismic ground motions (Neves et al., 2012).
The type of construction under interest involves buildings up to 3 stories high with regular geometry (see Figure 5). In rural areas, isolated buildings with a single story or 2-story height are more typical, as the population density is generally lower and the need for housing is not as great. These types of buildings may serve as houses, agricultural buildings, or small commercial structures. In contrast, in urban areas, 2- or 3-story buildings are more common and are typically enclosed in an aggregate. These buildings often serve as housing or mixed-use buildings that include both commercial and residential spaces. An important aesthetic aspect of these buildings is the size and arrangement of the openings in the facades that depend essentially on the location of the building (rural or urban), building purpose, and the social class that could also influence the architectural style. Usually, large windows are found in urban areas, while in rural regions, the windows are smaller and placed high up in the walls, which helps to protect the walls against strong winds and rain.
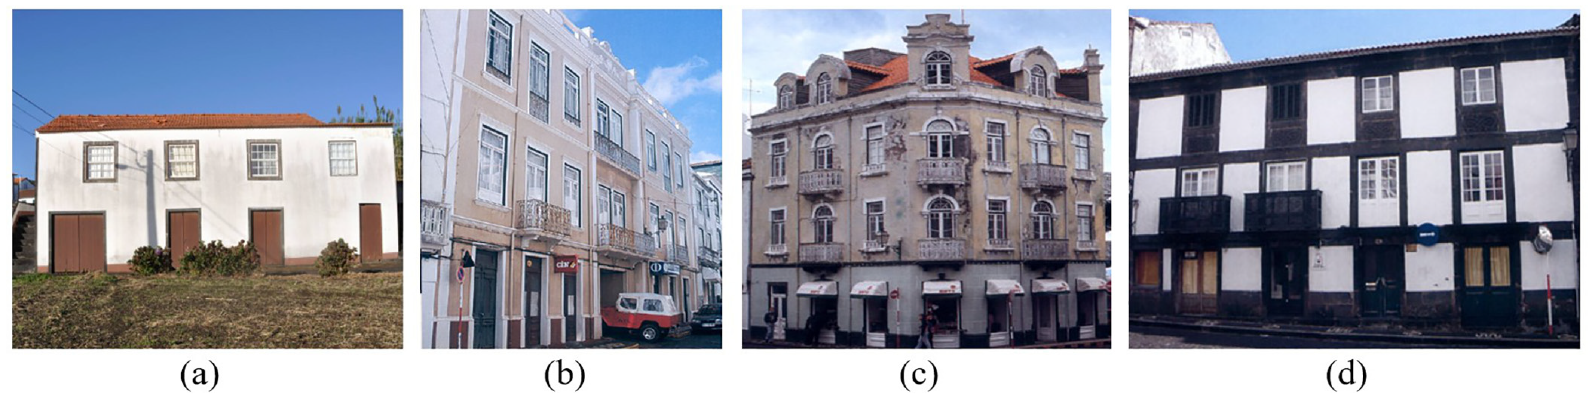
Example of the traditional building construction on Faial Island—Neves et al. (2012).
Regarding the structural system, the exterior walls (main facade, back façade, and gable walls) are made of volcanic stone masonry (basalt, trachyte and volcanic tuff) and can be single-, double- and three-leaf, usually filled with rubble, mud, and lime mortar. The thickness of walls is generally consistent, measuring around 0.66 m (known as a côvado), but other thicknesses can also be found in the range of 0.65–0.70 m. The interior walls are often composed of mixed timber-masonry walls (frontal walls) with thickness ranges from 0.12 to 0.15 m, or light timber walls made of vertical and diagonal boards filled in and covered with mortar (tabique walls). The foundation system supporting the load-bearing walls is usually made of rubble stone masonry. The floors are usually made of timber planks with a thickness around 22 mm, and timber joints spaced each 0.40 m and simply supported on the stone masonry walls. The roof can take on various forms, but the most common typology is a two-sloped pitched timber truss structure. Further information can be consulted in the work by Costa (2002) and Costa et al. (2008b).
Numerical modeling and assumptions
The geometry layout of the structural typologies used in the current study was extracted from the synthetic database generated by Bernardo et al. (2022a) and adapted for the population of the building stock in Faial Island, according to the information presented in the work by Neves et al. (2012) and Costa et al. (2008b). Thus, three different main configurations were adopted, as shown in Figure 6 (Archetypes A1, A2, and A3). The number of floors ranges from 1 to 3 stories high. The walls thickness is depicted in Figure 6. According to the survey carried by Bernardo et al. (2022a), a constant wall thickness was considered in the entire high of the buildings. Note that these buildings are representative of the population of the building stock observed in the urban regions, which has greater importance in the context of seismic risk assessment.
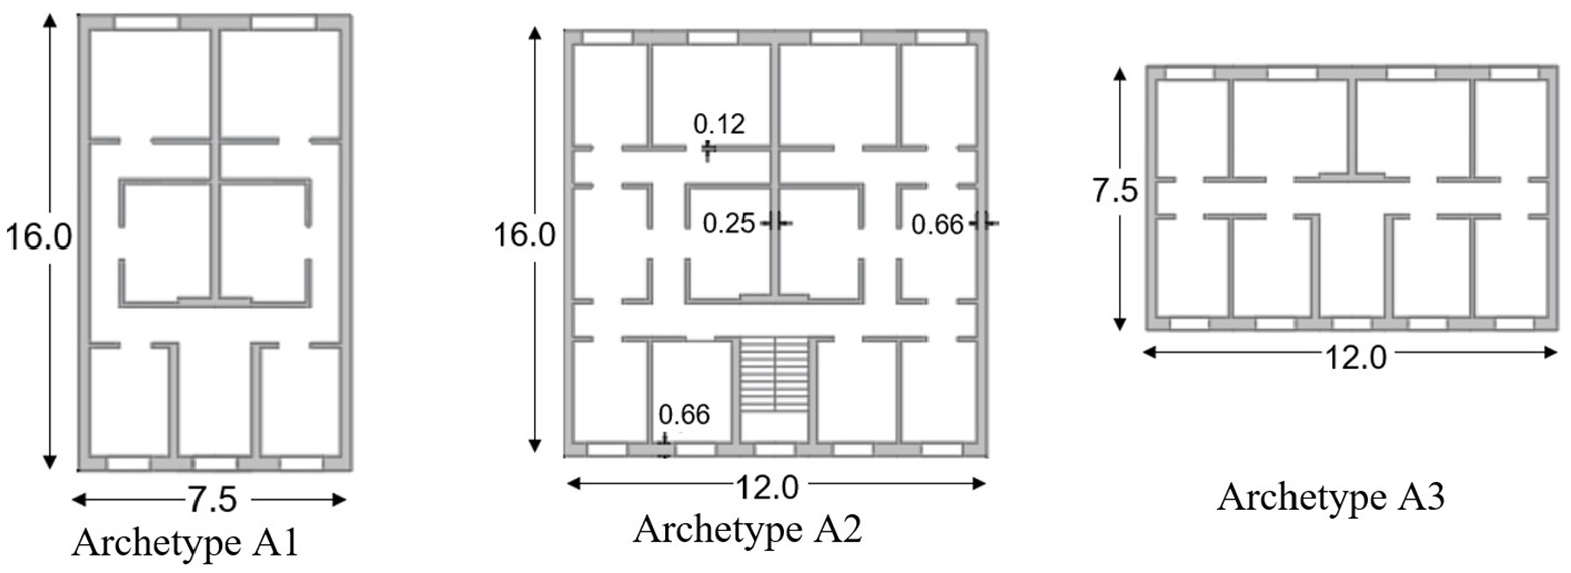
Archetypes adopted to represent the population of buildings stock in Faial Island.
Regarding the numerical modeling strategy adopted to develop the tridimensional models of the buildings, an Equivalent Frame Method (EFM) is employed. This method uses a nonlinear macroelement formulation available in the TreMuri research program (Penna et al., 2014a), which accounts only for the in-plane failure mechanisms. The in-plane response of the walls adopts a frame-type representation, wherein each wall with openings is modeled by assembling the piers and spandrel beams (macroelements), connected by rigid area (nodes). The nodes are non-deformable, while the inelastic response is governed by the nonlinear deformations of the macroelements. The failure modes accounted for by the macroelement are the following: (1) shear response and (2) flexural rocking of the panel.
The shear response (1) is controlled by a constitutive model that expresses the nonlinear relationship between the shear stress and the relative deformation of the panel. The ultimate shear strength is provided by an equivalent shear model that uses the Turnsek–Cacovic criterion, with two phenomenological parameters that account for the effect of the diagonal cracking or sliding along the joints: ct that expresses the shear deformability in the inelastic range, wherein the amplitude in the inelastic displacement is proportional to the product GCt (G is the shear modulus); and βs that controls the slope of the softening branch in the post-peak region. The flexural rocking (2) is modeled by a unilateral contact model with zero-length springs, located at the interface of the element, which follows a bilinear constitutive model in compression and a no strength capacity in tension, capable of evaluating the cracking effects during rocking motion. The unloading branch of the curve has equal initial stiffness to allow an increased energy dissipation and the possibility of modeling the accumulation of displacements. The model includes a nonlinear relation for rocking damage to consider the ultimate compressive strength (toe crushing). Further details regarding the macroelement formulation used can be found in the work by Penna et al. (2014a). A drift threshold of 0.55% and 1.0% was adopted for the elements controlled by shear and flexure, respectively, which are in line with the values recommended by EN 1998-3.
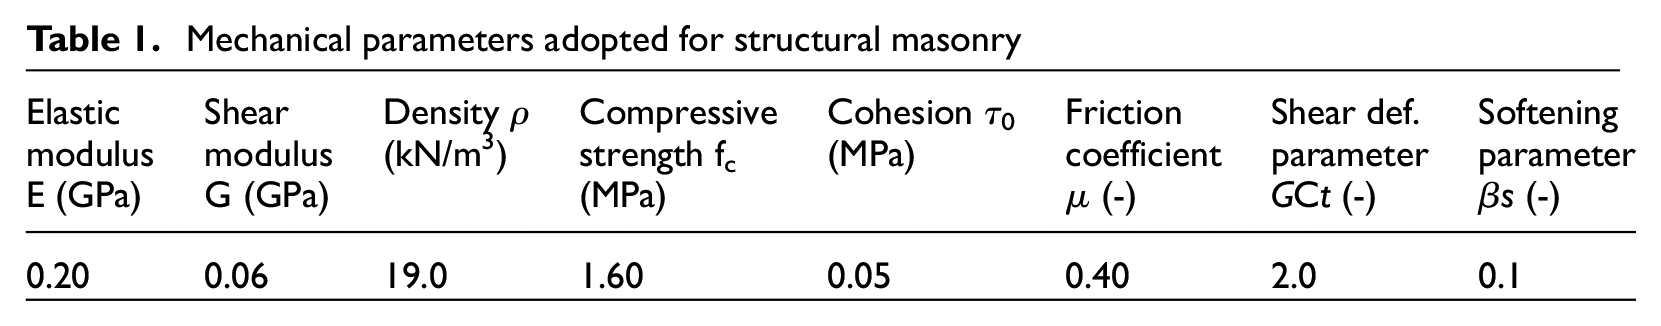
The parameters adopted to characterize the mechanical properties of the nonlinear are defined at a macroscopic scale and are summarized in Table 1. These properties were obtained from the previous experimental research on Faial Island carried out in the work by Costa (2002) and Costa et al. (2008). The values of GCt and βs were defined according to the suggestions of Penna et al. (2014a). The interior-tabique walls assuming a bilinear force-deformation constitutive law with the following properties: E = 0.1 GPa; G = 0.002 GPa, and fc = 0.50 MPa (Simões et al., 2018).
Mechanical parameters adopted for structural masonry
The horizontal floor diaphragms were considered flexible and modeled as a two-dimensional orthotropic membrane element, defined by four nodes with two displacement degrees of freedom each. Table 2 summarizes the equivalent mechanical properties adopted for the flexible floor diaphragm, after Bernardo et al. (2022a). The connections between floor walls were modeled through equivalent rigid link beams at the floor level to simulate medium-to-weak connections with the following properties: Area = 4e−4 m2; Inertia = 2e−4 m4, and E = 30 GPa, according to the work by Bernardo et al. (2022a) and Simões (2018).
Mechanical parameters adopted for the flexible floor diaphragm (Bernardo et al., 2022a)
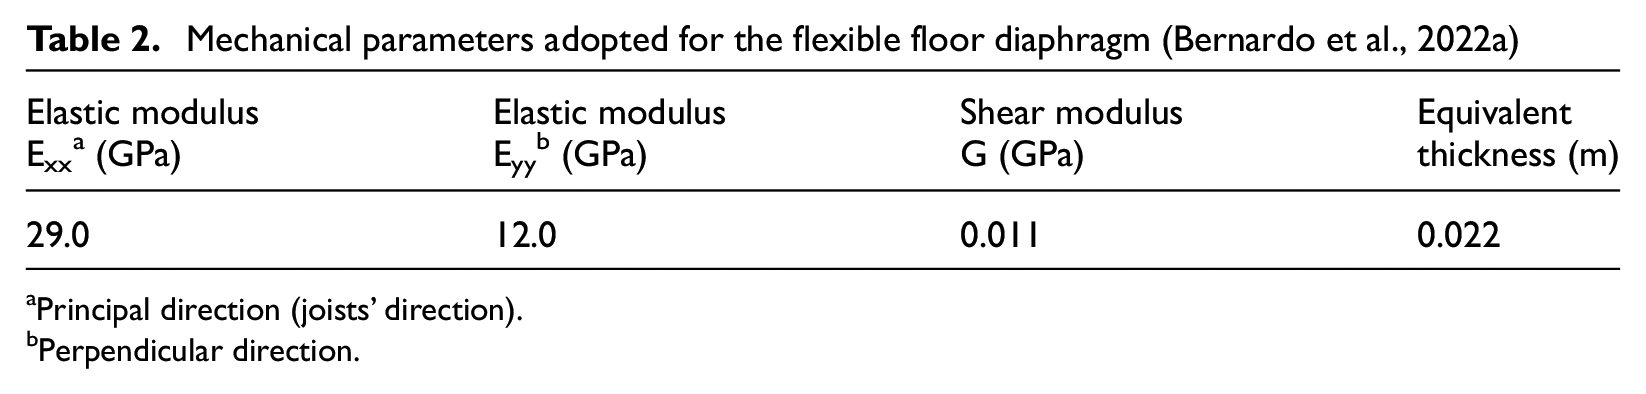
Principal direction (joists’ direction).
Perpendicular direction.
Figure 7 presents the developed numerical models from 1 to 3 stories high by considering the previous assumptions for a total of nine typologies analyzed. It is important to emphasize that although the geometry and material properties are considered deterministic, the uncertainty in the characterization of the building stock will be accounted for by the dispersion values associated with material properties, construction details/quality, and analytical models to simulate the structural components.
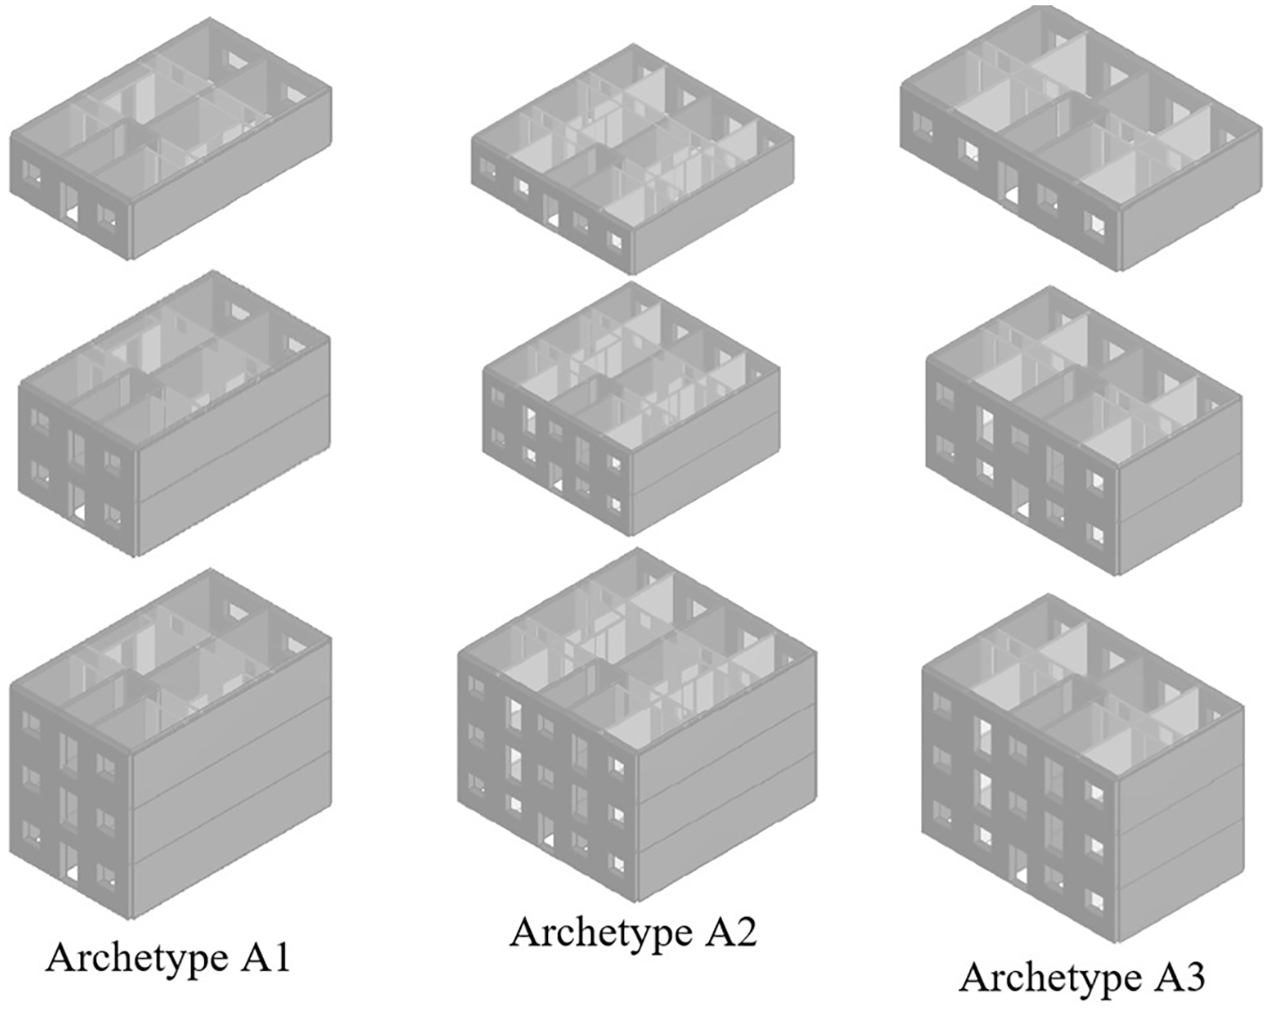
Tridimensional numerical models of the buildings: Archetypes A1, A2, and A3.
Seismic performance
The buildings are analyzed in the longitudinal direction (parallel to the main façades), which present greater vulnerability according to the work by Bernardo et al. (2022a). This conclusion is mainly attributed to the presence of openings in this direction that affect the overall structural integrity and response of the structures. Although the vast majority of buildings in urban regions are enclosed in aggregated, the structures were considered isolated since the aggregate effect slightly increases the seismic performance in the direction considered, as evaluated in the work by Bernardo et al. (2022b). It should be noted that this conclusion is restricted to buildings with similar geometric and materials characteristics, and especially with similar heights. Therefore, the results presented are limited to buildings or aggregates of buildings that follow these assumptions.
The capacity of buildings was estimated from nonlinear static analysis using an adaptive load pattern (adaptive pushover analysis) (Rofooei et al., 2007) with an inverse triangular first ratio pattern. In this sense, the distribution of inertial forces to simulate seismic loading is proportional to the damage, which means that the applied damage pattern is proportional to the displacement shape in the previous incremental step, being more realistic than conventional pushovers in case of masonry buildings with in-plane failure mechanisms. In the work by Mendes and Lourenco (2010), unexpected results were found in case of masonry buildings controlled by out-of-plane failure mechanisms.
The control node was selected at the top level of the building and the base shear was measured until reaching 20% decay of the maximum shear strength, as recommend by the EN 1998-3 (EC8-3) (NP EN 1998-3, 2017) for a global safety verification.
Figure 8 exhibits the capacity curves for the typologies analyzed (Archetypes A1, A2, and A3 with 1 to 3 stories high) and expressed in terms of Sa and spectral displacement (Sd). As can be readily seen in Figure 8, the values of Sa decrease with the number of floors and the highest values of Sa are noticed for archetypes with longer facades. This reflects the importance of exterior walls in the global capacity of the buildings, that is, most of the inertia forces are concentrated/absorbed by the exterior walls given their higher mass compared to the interior walls. Regarding the values of Sd, higher values are obtained for archetypes with a higher number of interior walls in the direction of seismic action, which means that although the maximum capacity of Sa is mostly controlled by the in-plane exterior walls slenderness, the interior wall density in the direction of seismic action play an important role in the ductility of these structures. These conclusions were also stated in the work by Bernardo et al. (2022a).
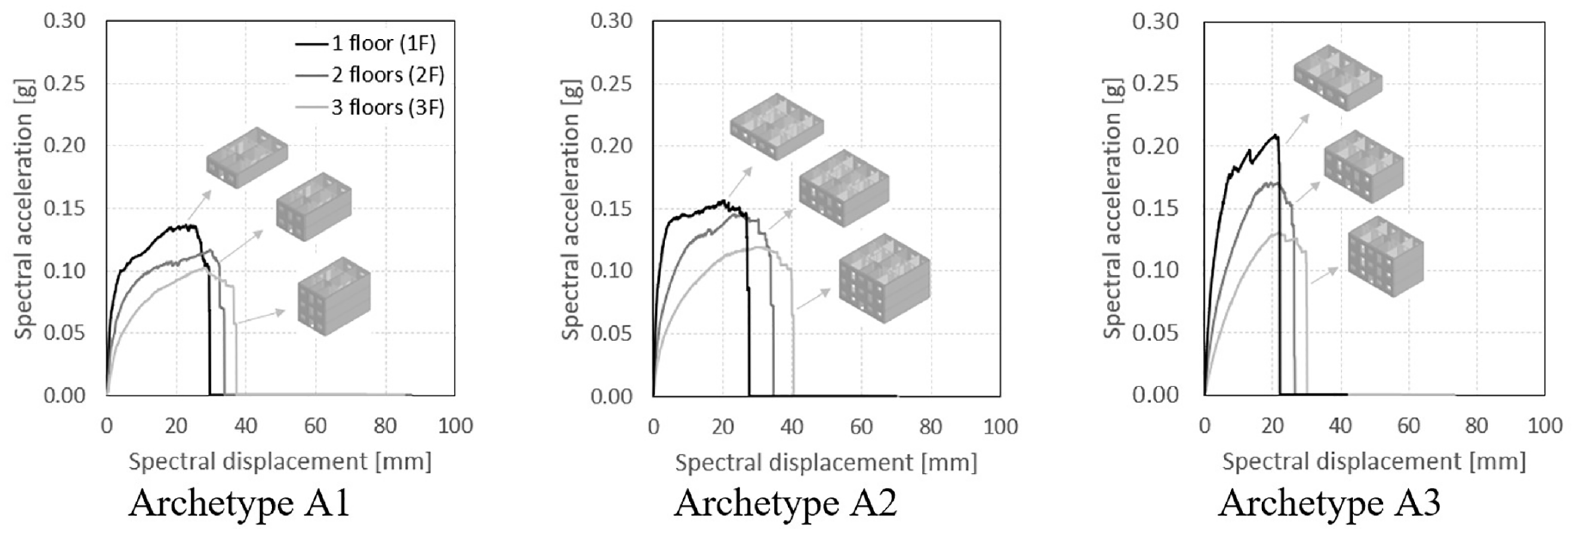
Capacity curves for the archetypes adopted (Archetypes A1, A2, and A3 with 1 to 3 stories high).
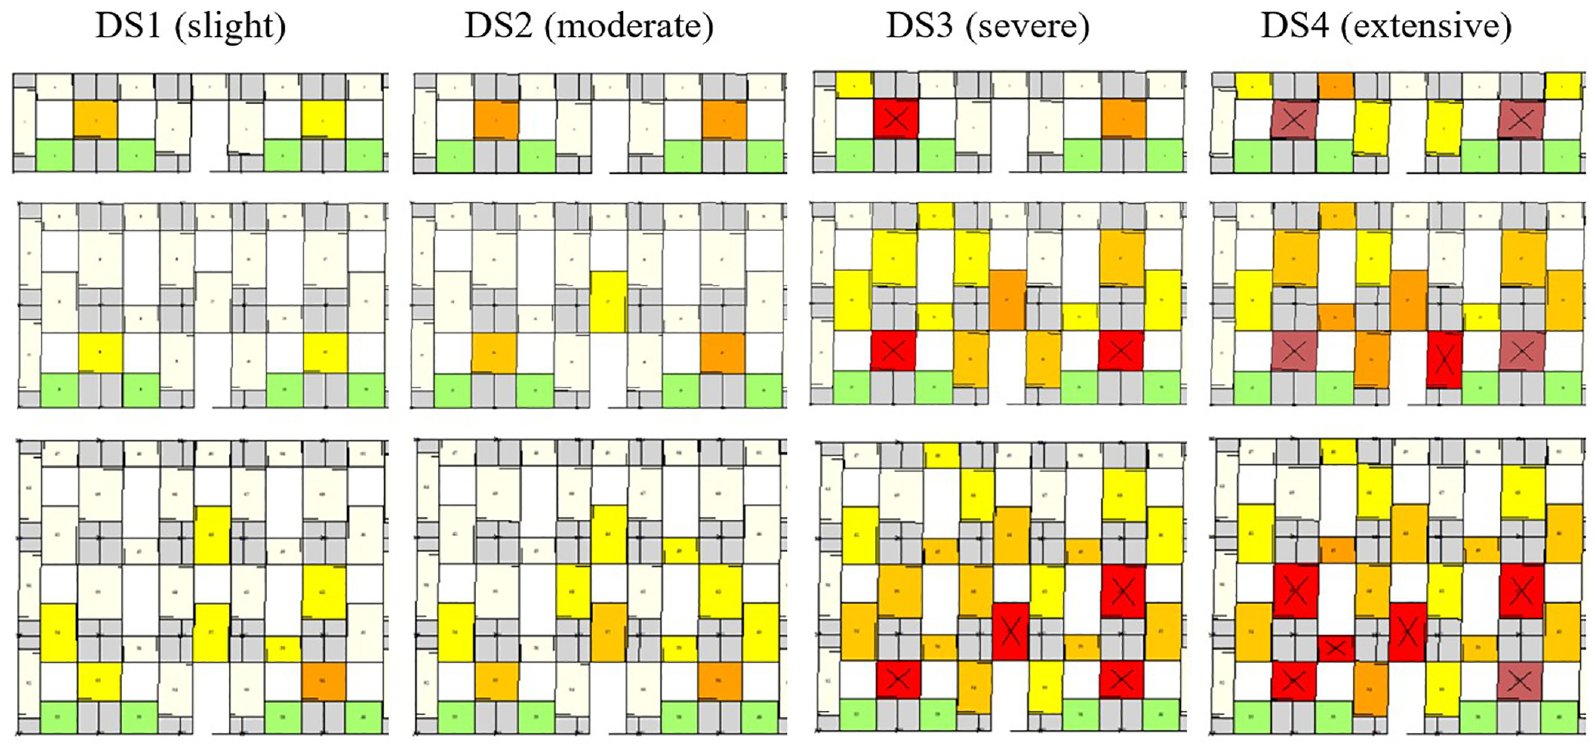
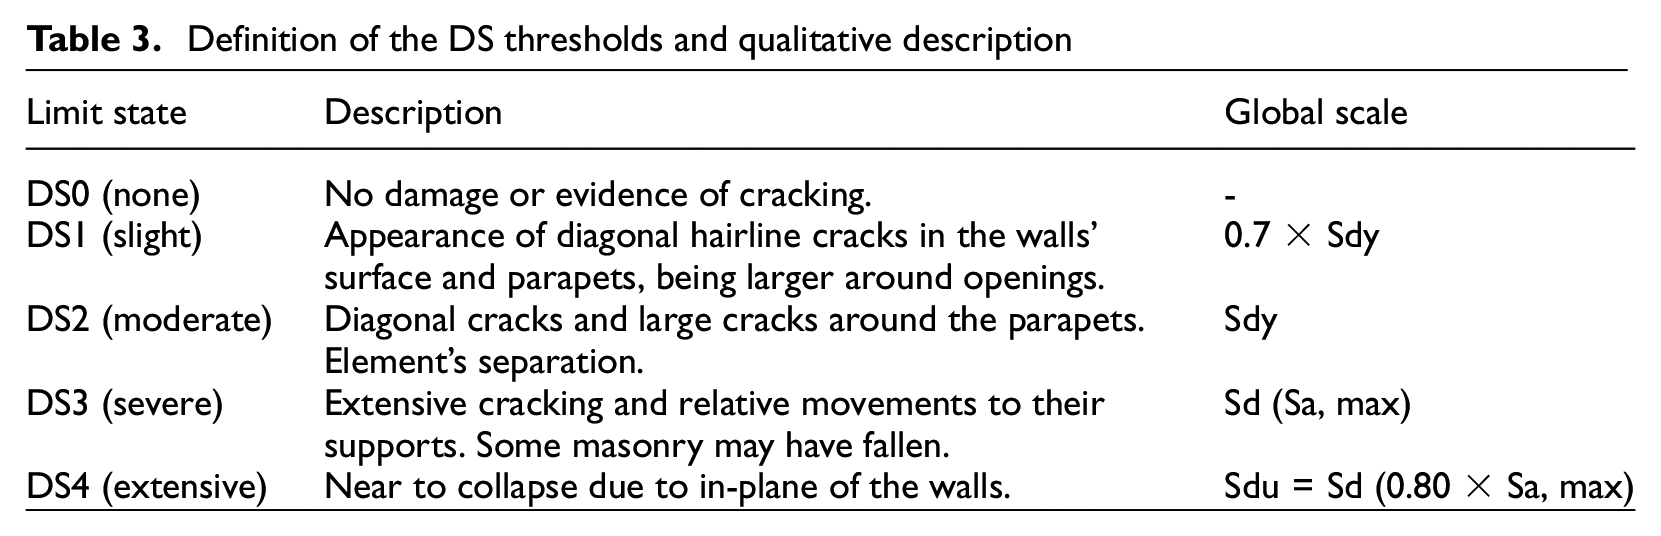
The damage states (DSs) considered in this study were defined at global scale in the capacity curves as a function of the yielding (Sdy) and ultimate displacement (Sdu) (Barbat et al., 2008; Bernardo et al., 2022a). The ultimate displacement was considered at 20% decay of the maximum shear strength and corresponds to the collapse prevention (Near Collapse) performance level defined in EC8-3, while the yielding displacement corresponds to the immediate occupancy (Damage Limitation) performance level in the standard. The yielding point was estimated considering a bilinear elastic-perfectly plastic capacity curve, based on the equal energy principle, until the ultimate displacement was reached (20% decay of the maximum shear strength), as recommended by EC8-3. The other limit states were identified in the original nonlinear capacity curves and validated through the observation of the damage patterns depicted in Figures 9 to 11. The thresholds for the DS are considered, and the qualitative description is presented in Table 3.
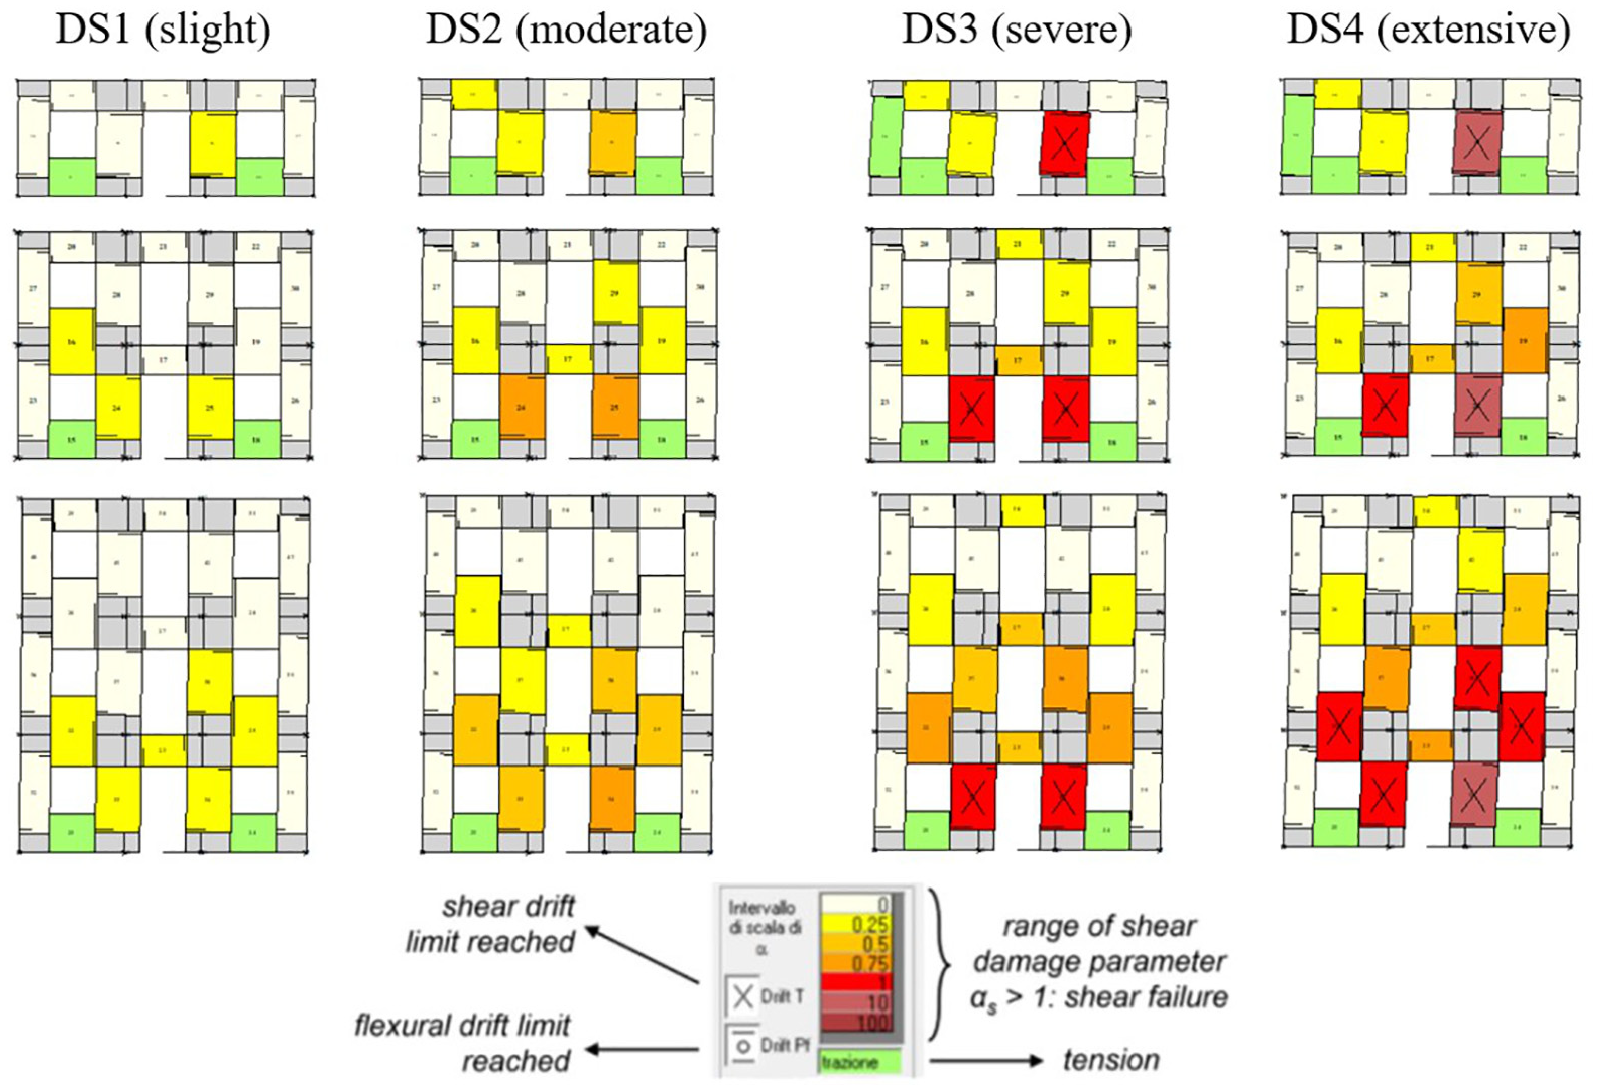
Damage pattern for the damage states considered: Archetype A1 and different stories.
Damage pattern for the damage states considered: Archetype A2 and different stories.
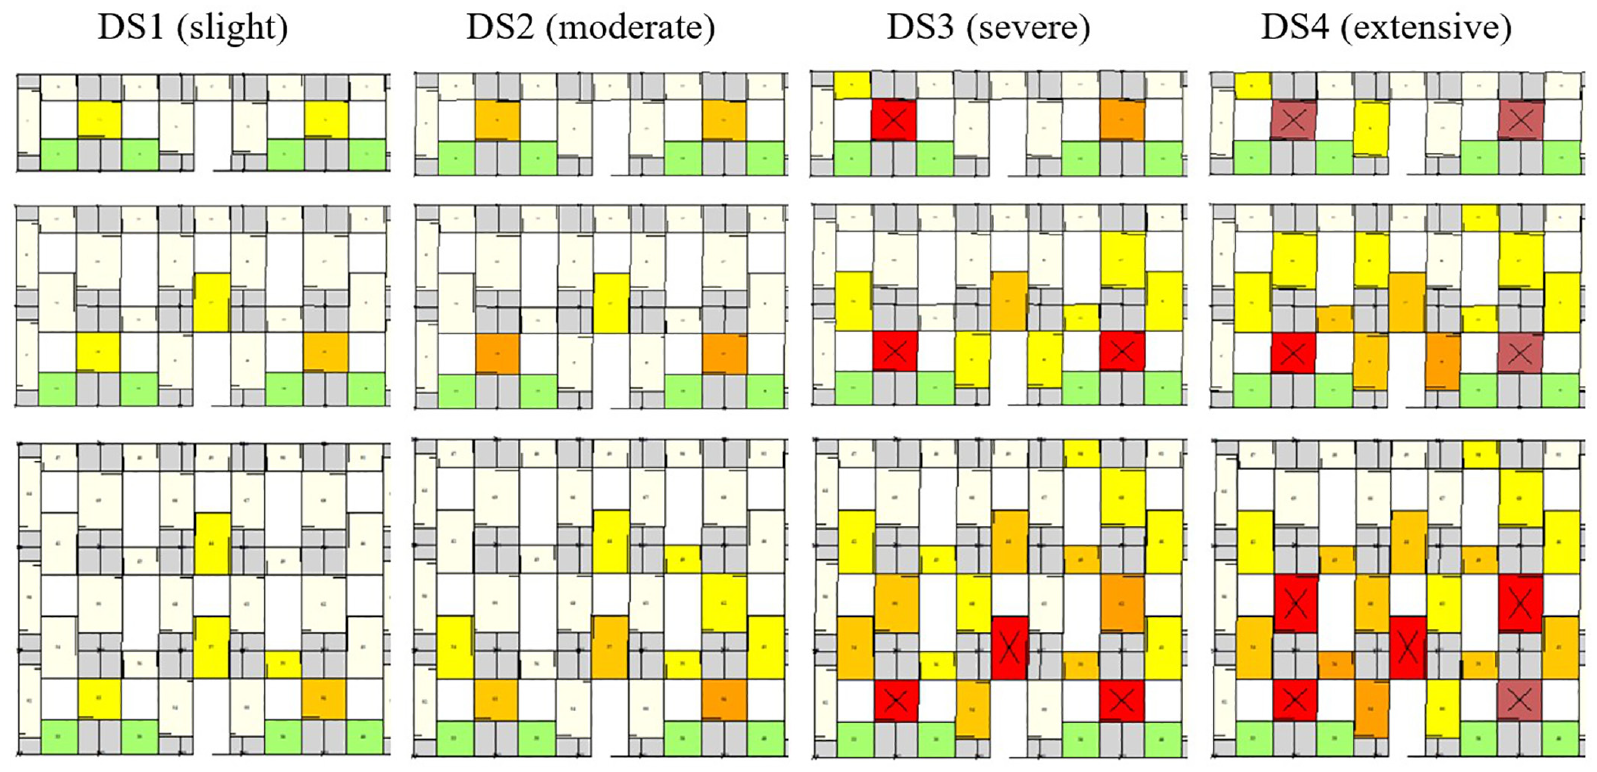
Damage pattern for the damage states considered: Archetype A3 and different stories.
Definition of the DS thresholds and qualitative description
Figures 9 to 11 exemplify the damage patterns observed in the main façade for the different archetypes and limit states considered (DS1, DS2, DS3, and DS4). The meaning of the color scale presented is related to the damage parameter αs that controls the macroelement behavior: (1) αs = 0 means undamaged elements; (2) 0 < αs ≤ 1 the elements become gradually damaged until reaching the maximum capacity strength (αs = 1); (3) αs > 1 behavior in the post-peak phase (softening). As can be seen in these figures, the damage starts at the base level and is propagated over the building height, where the main failures of elements occur for limit state DS3, which is in line with the qualitative description in Table 3. Another important aspect is the comparison between the damage pattern obtained for the Archetypes A2 (Figure 10) and A3 (Figure 11); despite the same facade size, the damage achieved for the same DS seems to be higher in A3, which can be justified by the lower density of interior walls that it exhibits.
The seismic performance of the structures analyzed was evaluated through the improved Capacity Spectrum Method (CSM) (FEMA, 2005). The CSM is widely used for evaluating the response of structures to earthquake ground motions. The improved CSM incorporates the damping of the structures in the analysis leading to more realistic results, which means that the nonlinear behavior of the structure under large deformations is used to achieve more accurate results compared to linear models (Gencturk and Elnashai, 2008).
To obtain the performance point (PP) of the structure for a given seismic action, the capacity spectrum of the structure is intersected with the response spectrum for the same level of dissipated energy and damping level. Note that, both capacity spectrum and response spectrum should be defined in the ADRS (Acceleration–Displacement Response Spectrum) format. Thus, to determine the PP, the iteration procedure according to FEMA 440 (FEMA, 2005) was used, where the capacity curve and response spectrum intersect for the same level of dissipated energy. This also indicates that the damping resulting from the capacity spectrum corresponds to the reduction factor of the response spectrum of the seismic action. The procedure was computed for different archetypes under different seismic scenarios with M w = [5.0, 5.1, 5.2, 5.5, 5.6, 5.8, 6.0, 6.2, 6.4, 6.6] according to section “Seismic action modeling.”Figure 12 presents the PPs for the different archetypes considering 10 randomly seismic scenarios (10 different series) of M w = 6.0.
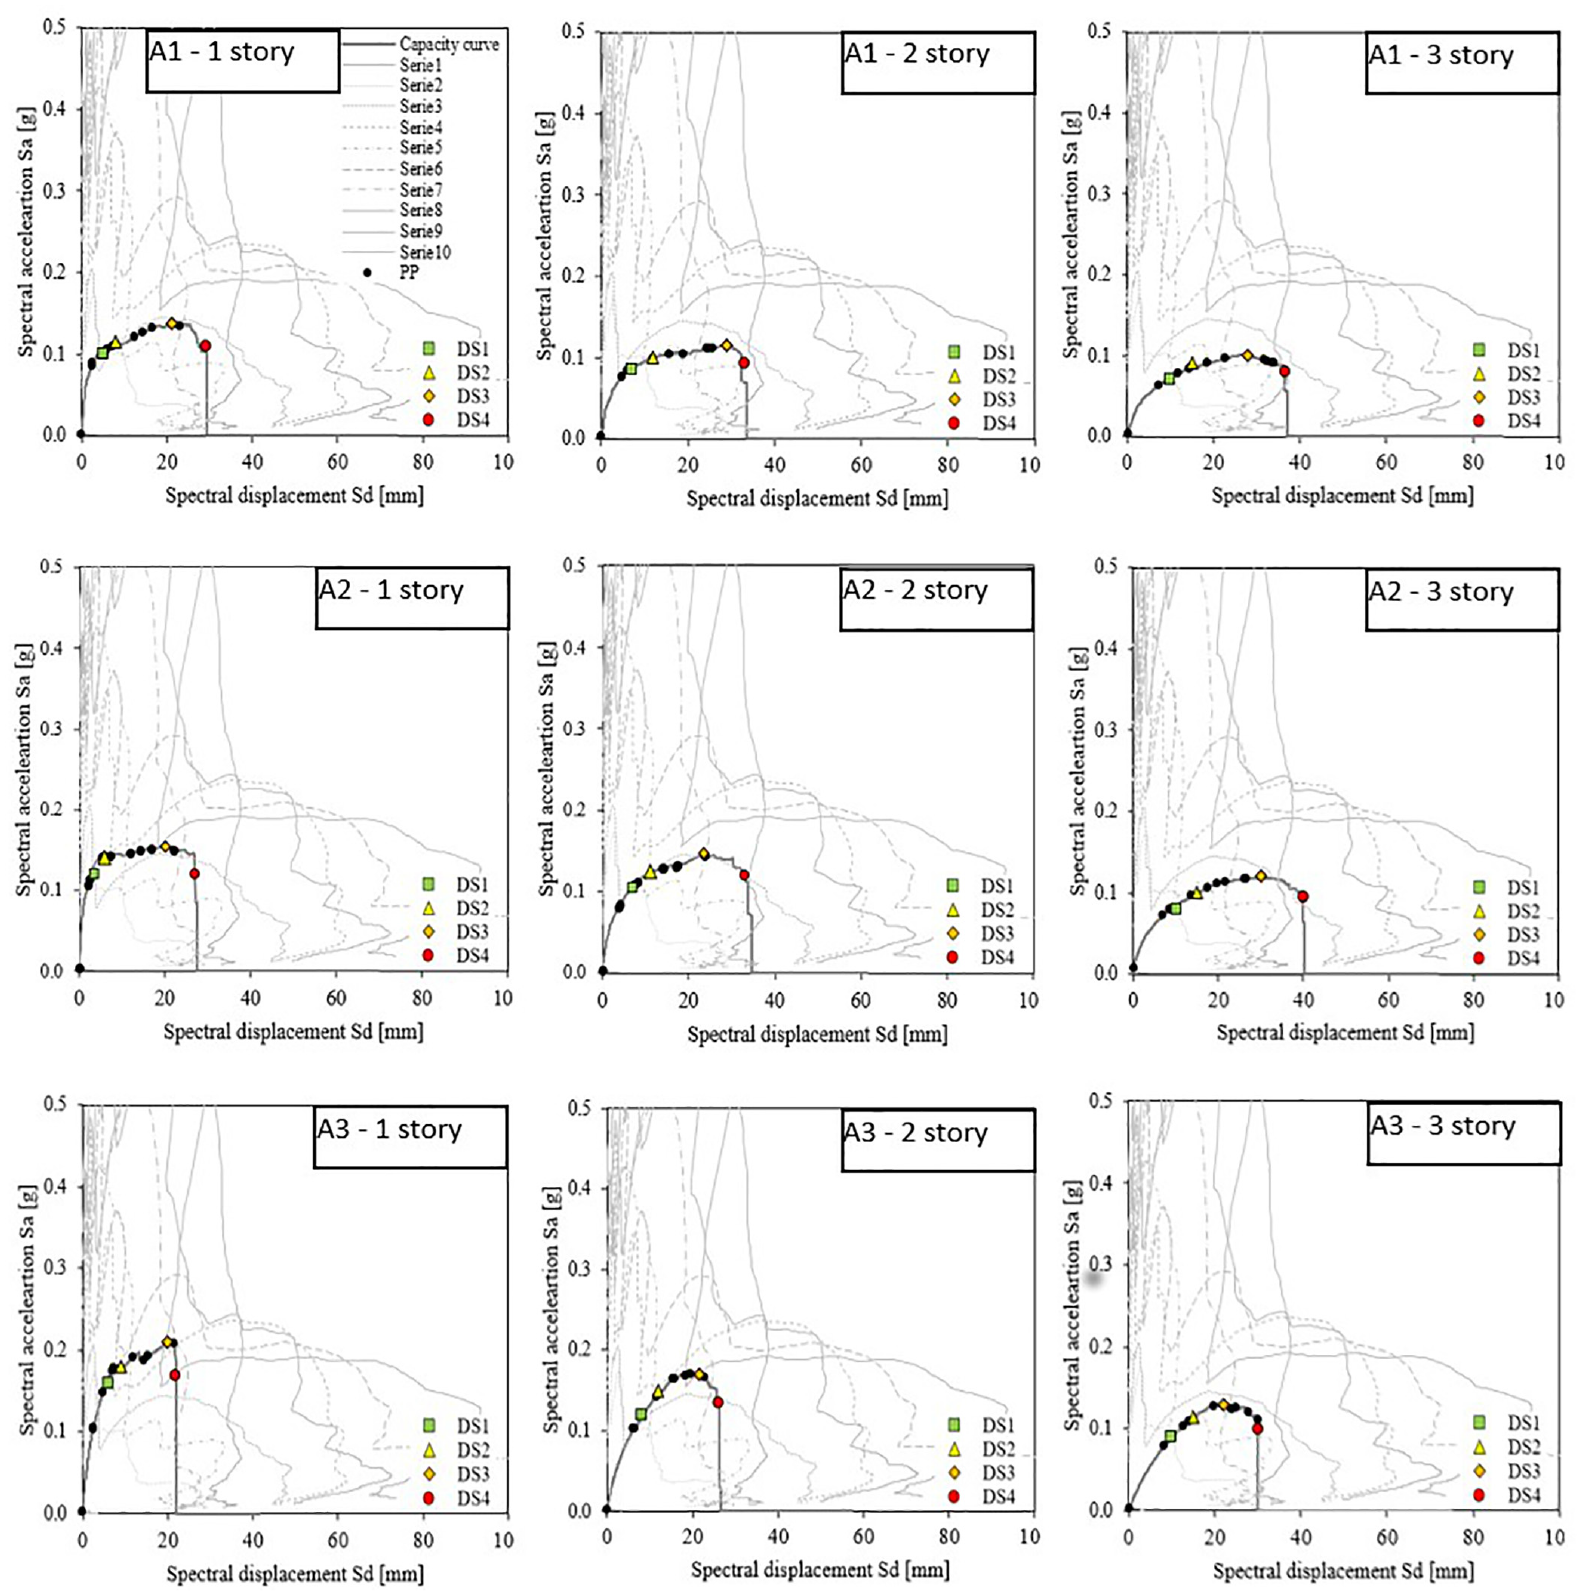
Seismic performance for the archetypes adopted and different scenarios of M w = 6.0.
The dispersion in the seismic demand βD in terms of Sd (taken as EDP) was computed by fitting a power regression model equation to the cloud of points that corresponds to the PPs of the structures (each archetype per Si) subjected to different seismic scenarios (10 series) for different M w (from 5.0 to 6.6). Figure 13 shows the results for the different archetypes with the empirical data (PP) and the best-fitted power function with the corresponding regression coefficients. The values of βD depicted in Figure 13 can be easily obtained by the standard deviation of the logarithmic error between the analytical power-law function fitted and the empirical data. Note that, the range considered for the best analytical approximation to the set of data considered only the limit state DS4 (near collapse) to avoid the contribution of PPs for levels of deformation of the structure beyond this final limit state.
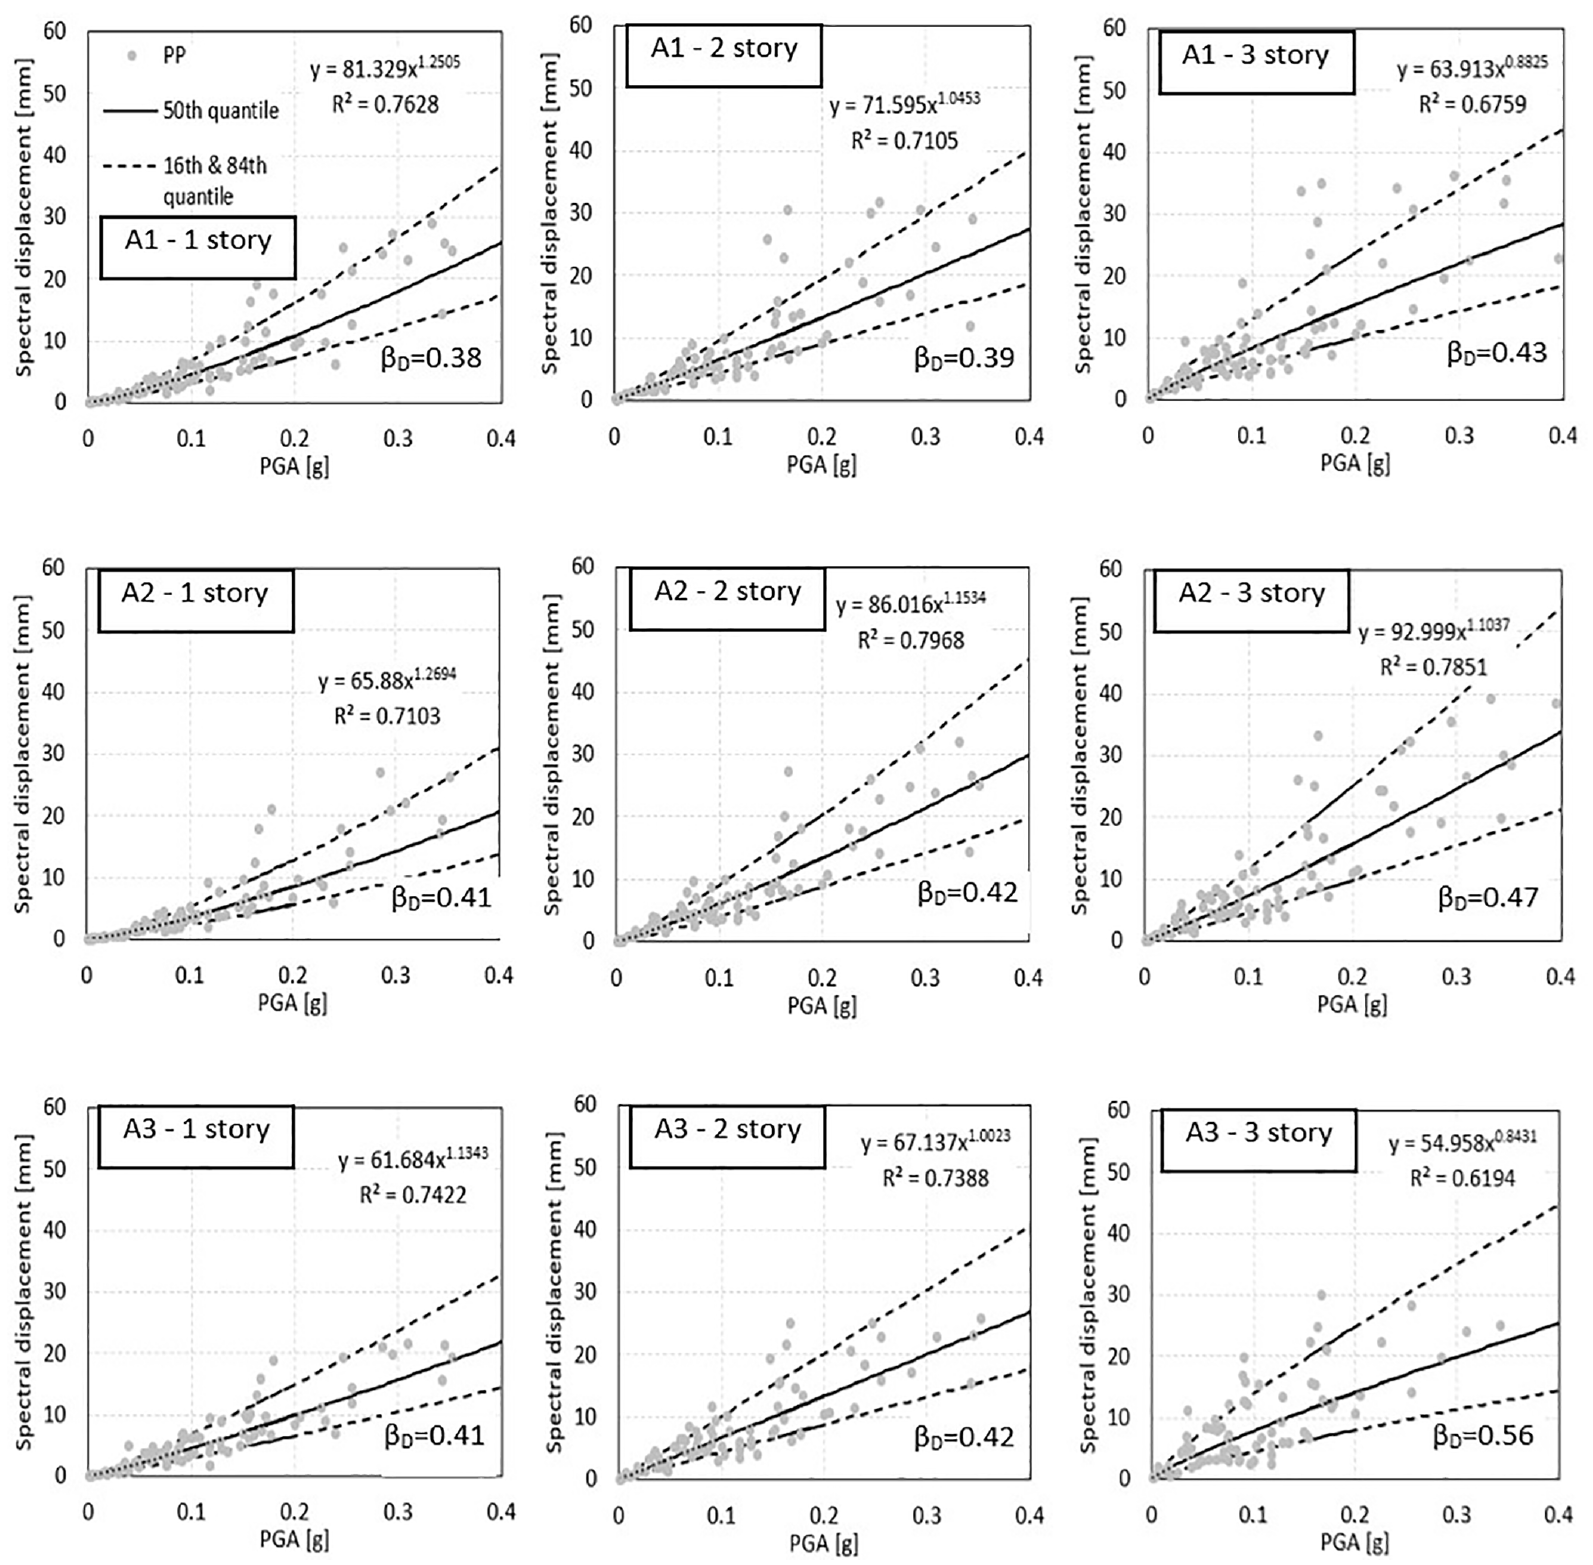
PPs (Sd) for different seismic intensity levels corresponding to the different scenarios considered and seismic demand computation.
Through analyzing the response of the structures in Figure 12 for different seismic scenarios with M w = 6.0, it can be seen that as the height of the building increases, the performance level tends to reach the maximum capacity defined by the near-collapse limit state (LS) more quickly, as the maximum strength of the buildings is also lower. The same trend is also found for buildings with lower deformation capacity/less ductility. This relies essentially on the ratio of masonry walls in the seismic action direction, as buildings with a higher ratio can exploit greater values of deformation and consequently have a better performance. Naturally, this observation is restricted to buildings governed by in-plane mechanisms, in which out-of-plane mechanisms are prevented from occurring.
The dispersion values in the seismic
Seismic analytical fragility curves
The seismic fragility curves derived in this section describe the probability of reaching or exceeding a given DSi (see Table 3) for a certain seismic intensity level, expressed in terms of
where
Figure 14 shows the fragility curves for the analyzed typologies and the median Sd (EDP) for the seismic scenarios of M
w
= 5.5, 6.0, 6.2, and 6.6. Note that M
w
= 6.2 was the magnitude of the Faial earthquake in 1998. In addition, fragility curves are also computed in terms of IM (PGA), see Figure 15, as a function of the limit states defined in the capacity curves and through the relationship between PGA-
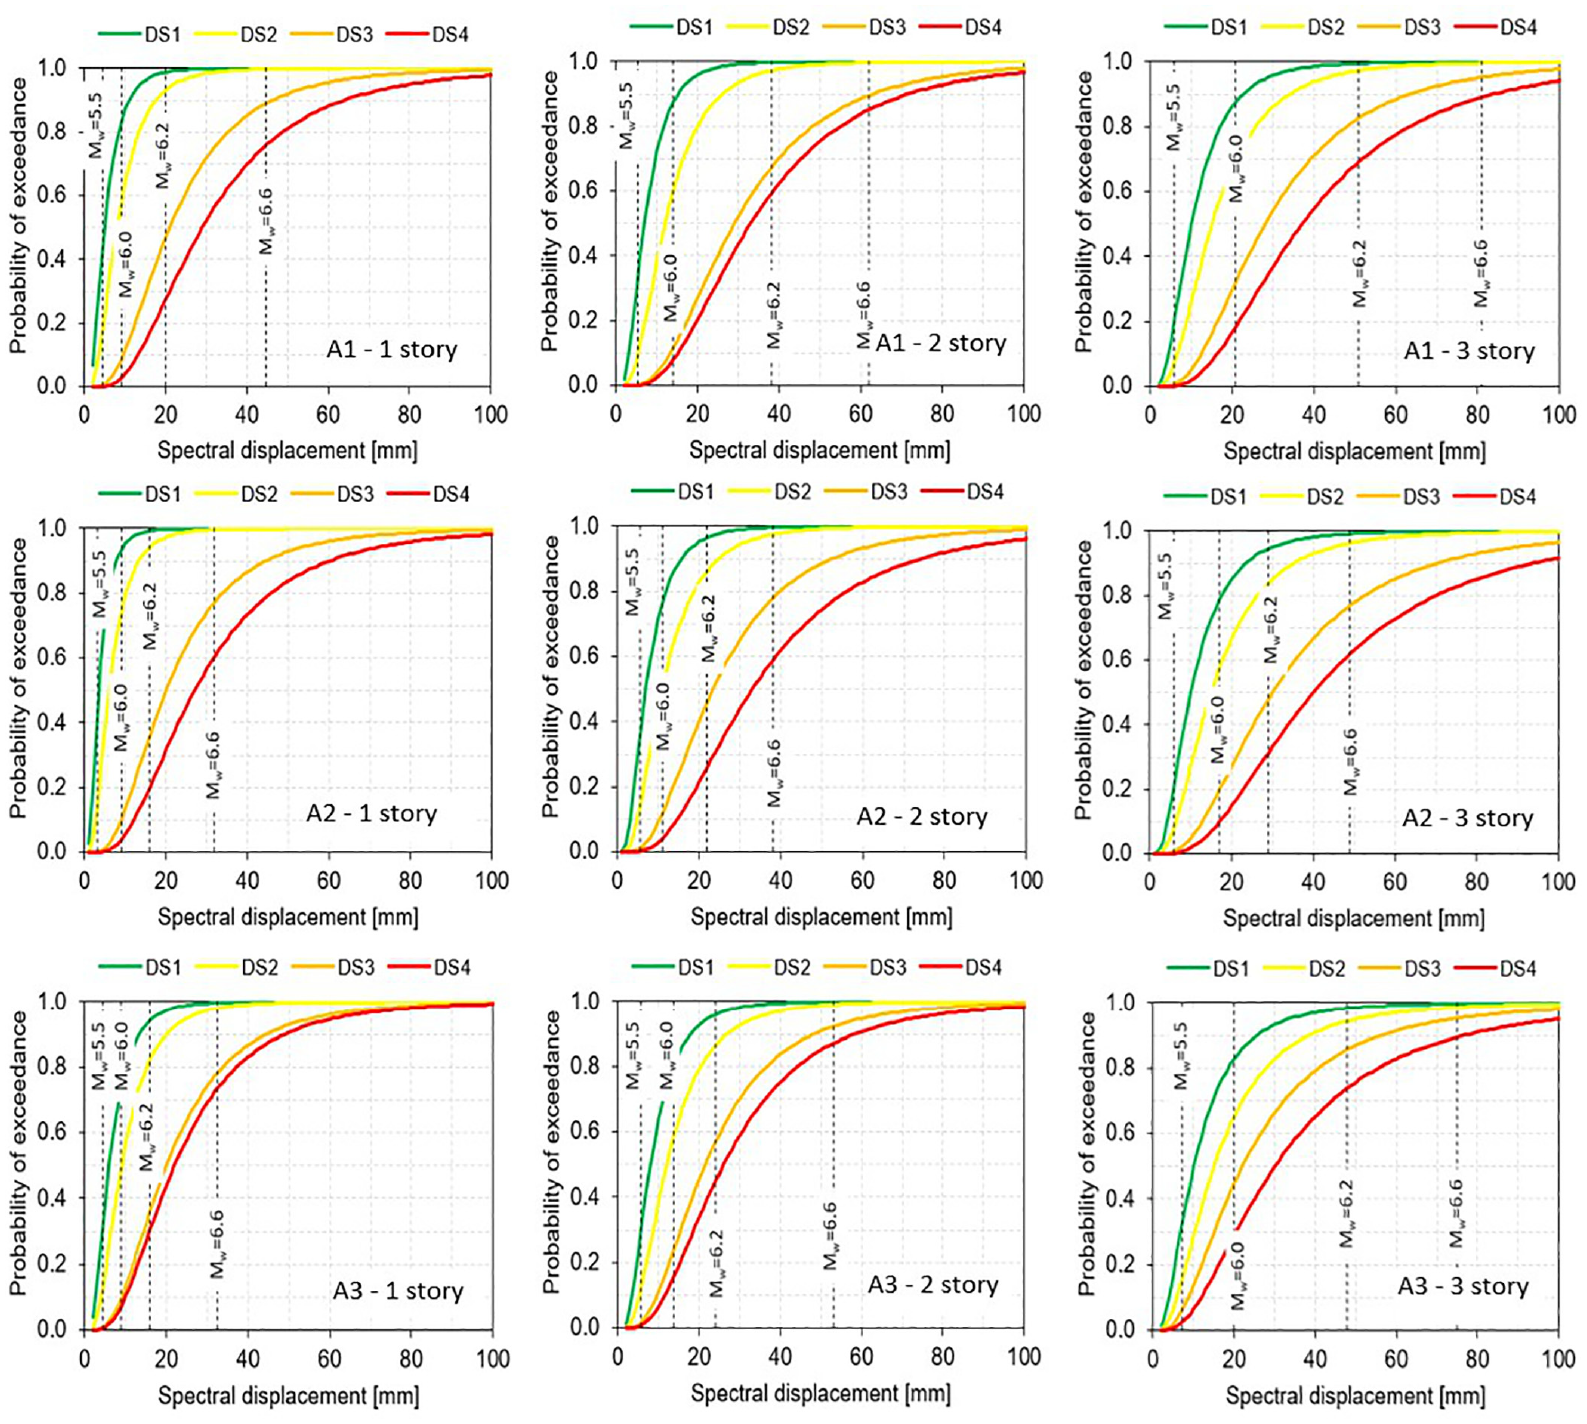
Seismic fragility curves in terms of EDP (Sd) for the archetypes analyzed.
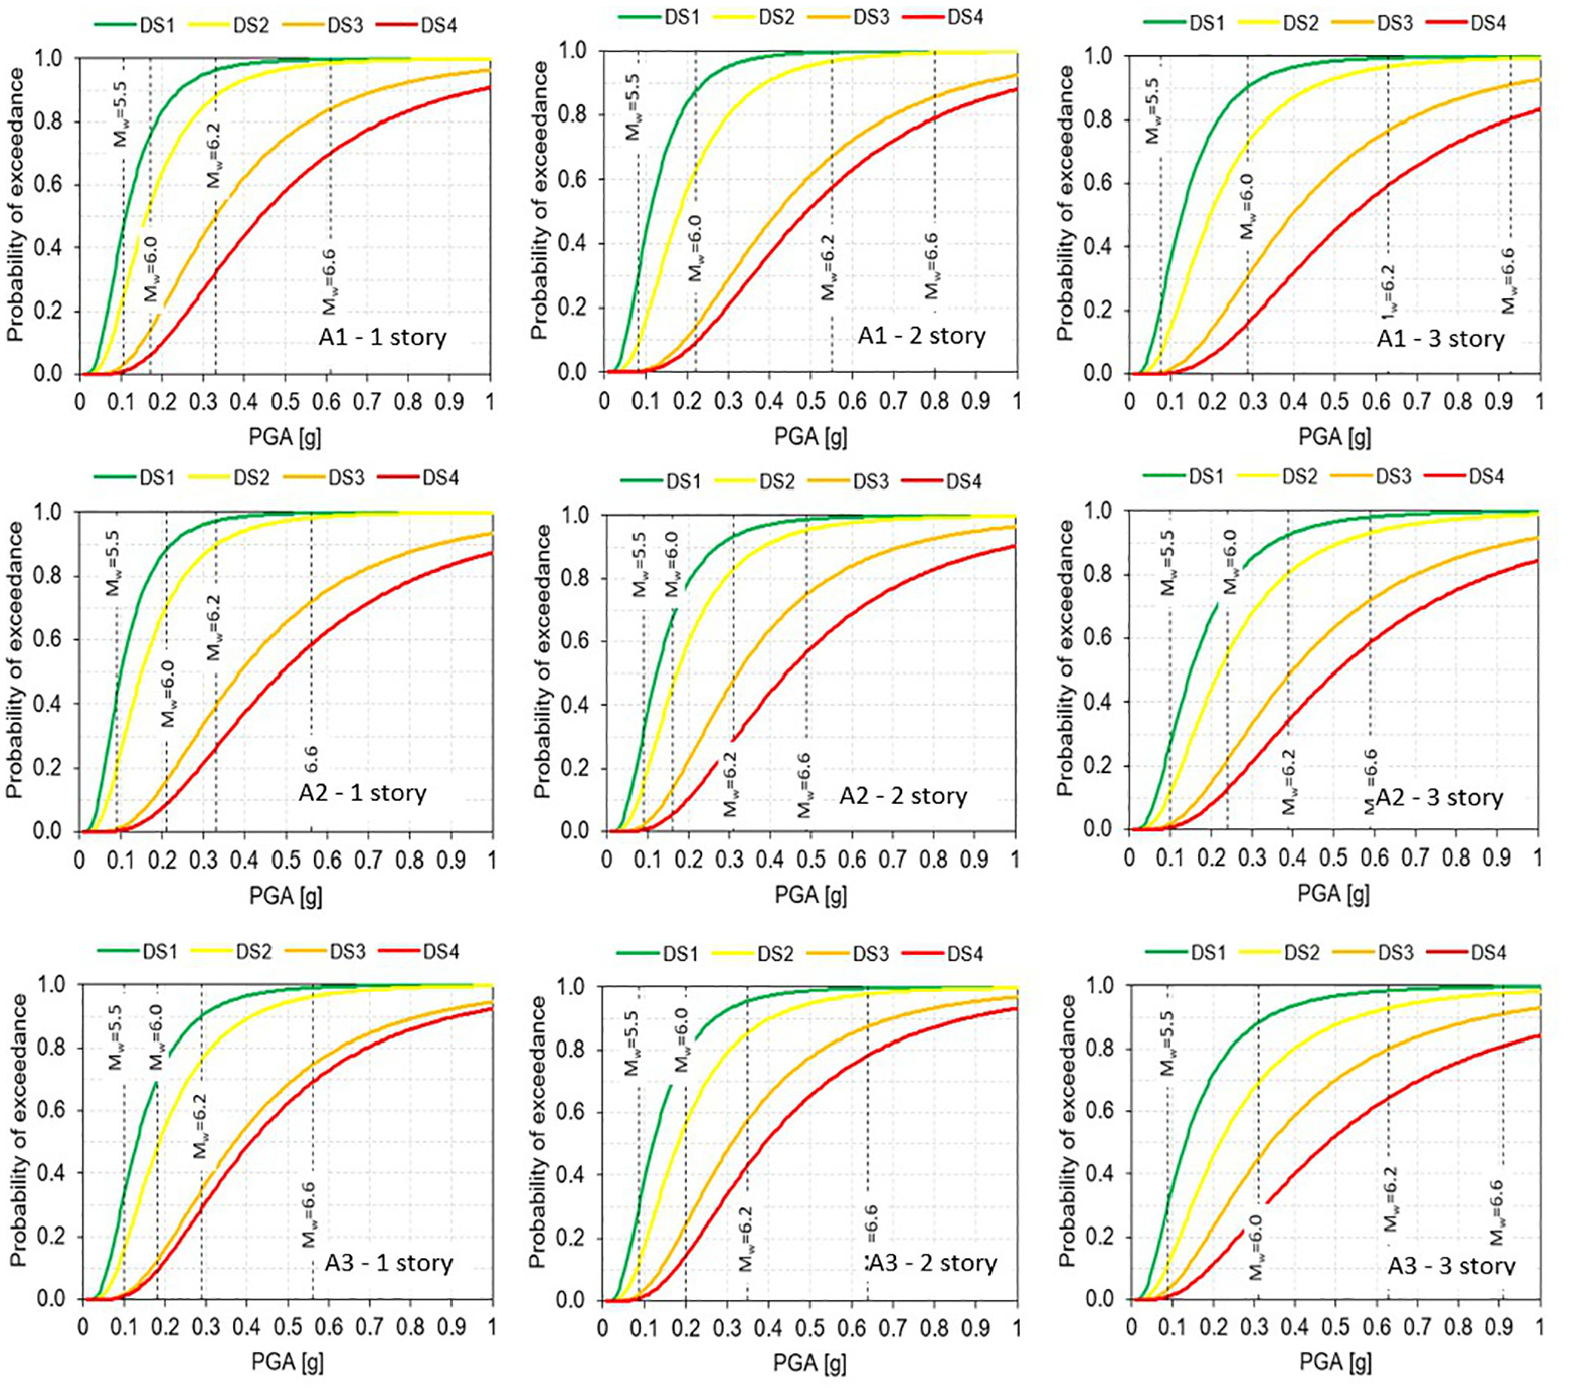
Seismic fragility curves in terms of IM (PGA) for the archetypes analyzed.
Table 4 summarizes the probability of occurrence of a given limit state in each typology for a certain M w considering the results of Figure 15. As can been seen, a significant probability of occurrence of moderate to extensive damage for seismic scenarios larger than M w = 6.0 is achieved, independently of the building typology. Notwithstanding, the typology that seems to have a better seismic performance, namely for higher seismicity levels, corresponds to the Archetype A2. In contrast, typologies with Archetypes A1 and A3 achieved a similar damage level. This mostly reflects the ratio between the area of walls and floor area, as previously discussed. Furthermore, the probability of occurring a given damage also seems to increase with the number of stories.
Probability of occurrence of different limit states for different typologies and scenarios

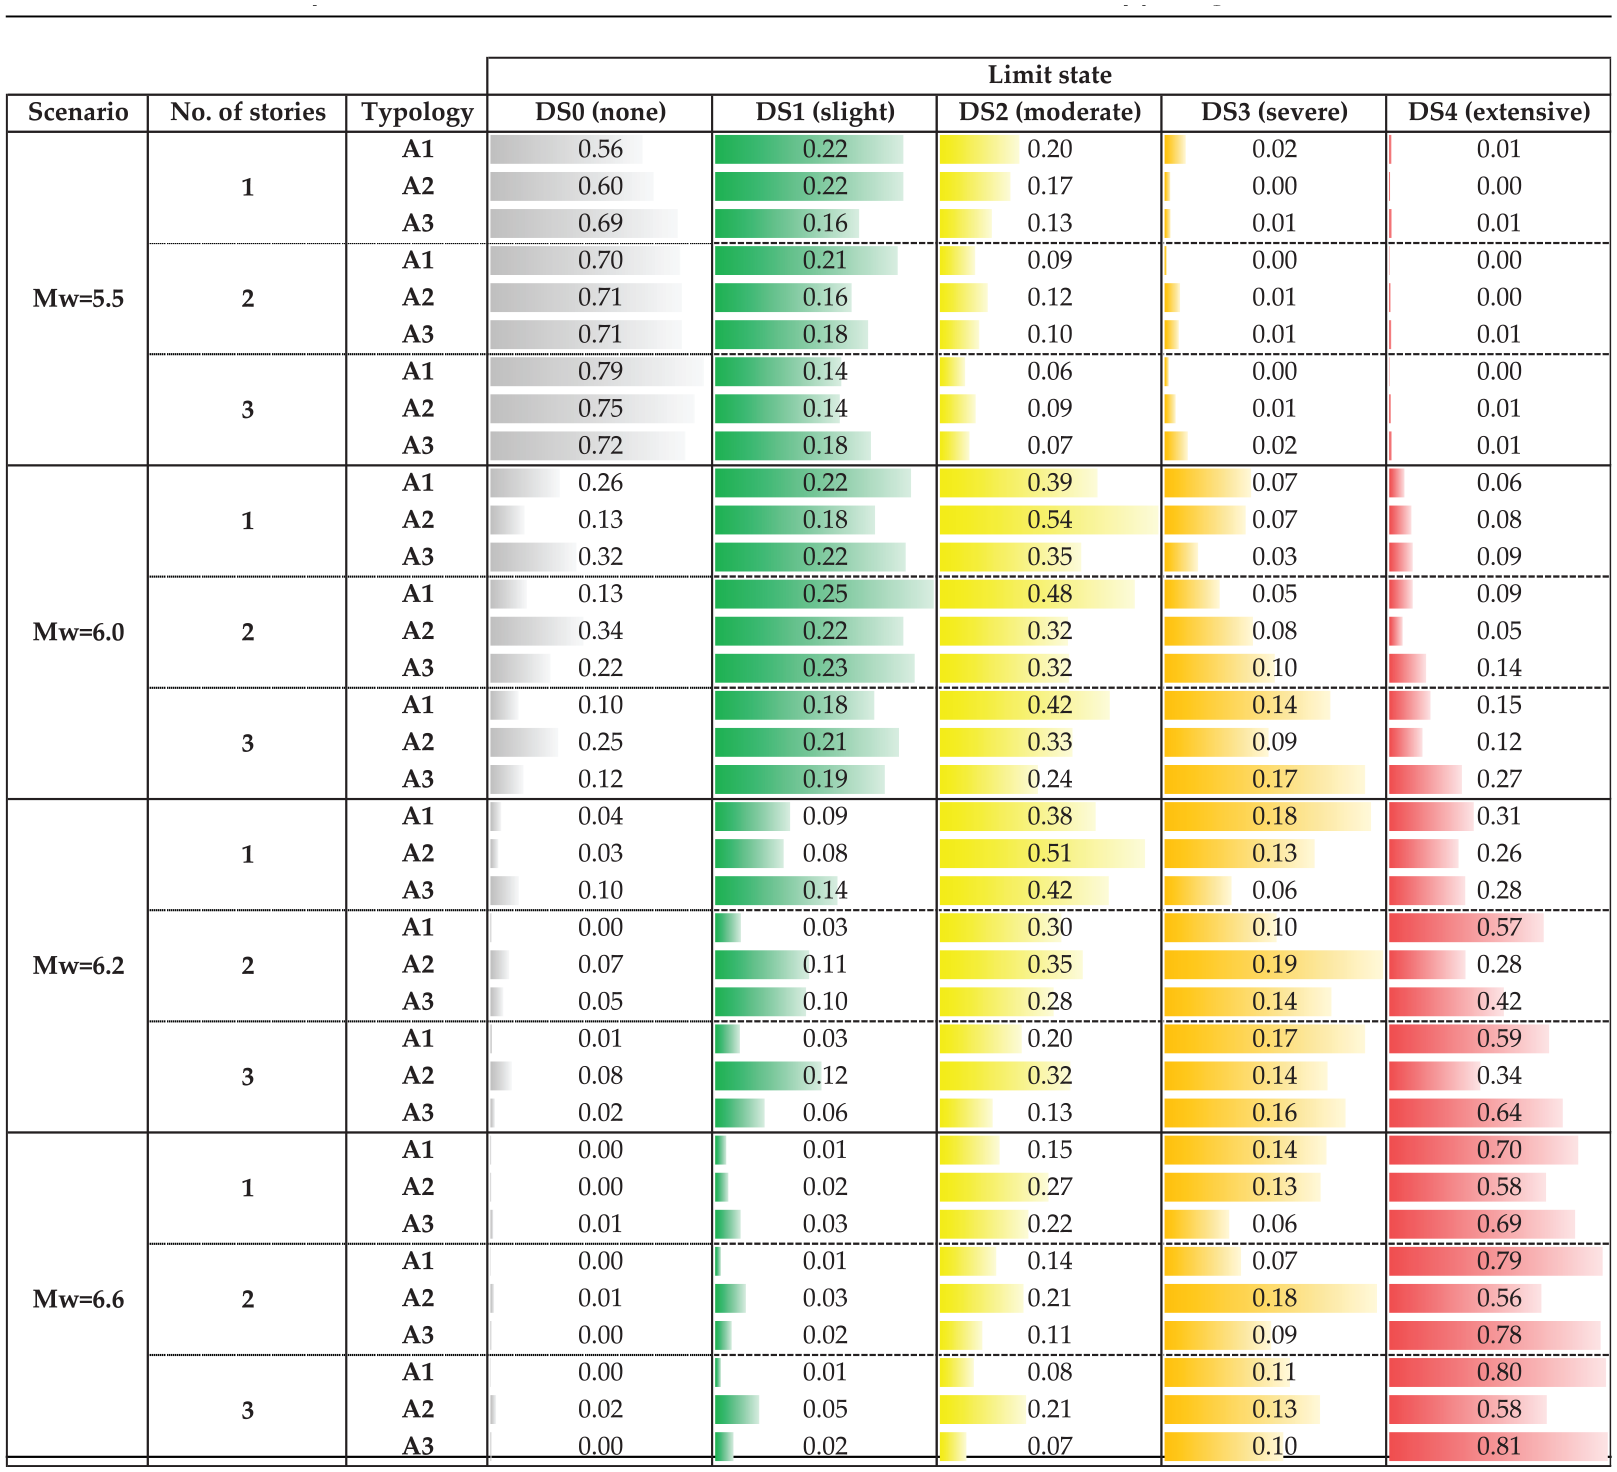
For M w = 5.5, most of the damage is slight, with a low probability of occurrence of moderate damage (less than 15%). Note that the current standard for Portugal (EC8) considers a seismic action with a 10% probability of exceedance in 50 years (475-years return period) which roughly corresponds of an event with M w = 5.0 for the region of Faial, and therefore, the expected damage is lower than the one for an event with M w = 5.5. For M w = 5.5, the average probability of occurrence of a given SD (1-DS0) between archetypes seems to increase with height; however, this conclusion is not so evident for higher Mw.
In the case of a scenario with M w = 6.0, the likelihood of buildings not being damaged is low (34% maximum); the sum of the probability of attaining moderate-to-severe damage ranges from 44% to 69%, being the moderate damage the most expected. Finally, for the scenarios of M w = 6.2 and M w = 6.6, the probability of occurrence of severe and extensive damage is much higher: for instance, in the case of an event with M w = 6.2 (estimated M w of the Faial earthquake in 1998), a mean probability of 41% is achieved for extensive damage (DS4—near-collapse LS) by aggregating all the typologies considered. Note that, according to post-earthquake damage assessment (Neves et al., 2012), 30% and 20% of the buildings required major repairs or even needed to be demolished, respectively. Therefore, the results achieved for the M w = 6.2 are also in line with in situ observations.
Conclusion
This work derived fragility curves of traditional masonry buildings on Faial Island (Azores, Portugal) using structural numerical analysis and simulated ground motions for several scenarios, providing important information for future risk studies. The results were validated with the post-earthquake damage observations of 1998 Faial earthquake (M w = 6.2). The ground-motion records used in this study are sourced from the work by Karimzadeh et al. (2024b), encompassing a total of 23 region-specific scenarios with magnitudes ranging from 5.0 to 6.6, generated in bedrock through the stochastic finite-fault methodology based on a dynamic corner frequency concept (Atkinson and Assatourians, 2015). Afterward, suites composed of 10 simulated records covering the PGA dispersion for each scenario defined by M w values (5.0, 5.1, 5.2, 5.5, 5.6, 5.8, 6.0, 6.2, 6.4, and 6.6) were selected.
The seismic input was used to estimate the seismic performance of traditional buildings represented by different archetypes. The main assumptions and procedures for the probabilistic assessment of seismic performance considered are summarized below: (1) definition of the geometry and material properties of the representative buildings based on the synthetic database generated by Bernardo et al. (2022a) and the survey of Faial’s building stock carried out by Neves et al. (2012) and Costa et al. (2008); (2) development of numerical models where only in-plane behavior is considered; (3) estimation of seismic performance using the improved CSM method; it is worth mentioning that in the estimation of the structure’s performance through the CSM, some improvements can be made to lead with multiple solutions resulting from non-smooth single records (e.g. Nettis et al., 2021); (4) calculation of the relationship between PGA (IM) and Sd (EDP) to assess the dispersion of seismic demand (cloud analysis); and (5) derivation of numerical fragility curves to estimate the probability of occurrence of a given limit state.
The results of the simulations have revealed that the stochastic behavior of seismic actions can be captured through simulations. The variability and unpredictability of seismic actions have been demonstrated to be sufficiently accounted for in these simulations. As a result, the use of simulations facilitates the selection of an adequate number of seismic records, even in regions where recorded motions are scarce or limited. The ability to rely on simulations to generate synthetic seismic records has proven to be a valuable tool for earthquake engineering, where the availability of accurate data is essential for the design and analysis of structures.
The previous ground-motion simulations were used on three archetypes of buildings representative of the building stock in the urban regions of Faial with 1 to 3 stories high. The nonlinear seismic performance of these structures subjected to different scenarios was computed to investigate the expected damage. Subsequently, analytical fragility curves were derived, considering the uncertainty in the capacity and response of the structures, allowing to evaluate the likelihood of reaching different damage states for multiple M w scenarios.
The results from the fragility analysis led to conclude that, regardless of the building typology, there is a significant probability of achieving moderate to extensive damage for seismic scenarios with M w larger than 6.0. Furthermore, a large probability (greater than 60%) was found for buildings to reach near-collapse performance, specifically above M w = 6.4 scenarios. Thus, there is a large vulnerability of these buildings when subjected to moderate seismicity levels. Furthermore, the results achieved are in line with the observation of post-earthquake damage in the region, where it was reported that around 30% and 20% of the buildings needed extensive repairs or even demolished, respectively, due to extensive damage suffered. Further studies accounting the soil amplification at surface should be developed to take account of site conditions and evaluate its effects on the buildings performance.
Finally, it is worth noting the importance of these studies in regions where recorded motions are limited, providing potential benefits for seismic risk management and mitigation strategies since it is possible to capture the random characteristics of earthquakes and to predict the damage for a certain seismic scenario. However, before using ground-motion simulations, it is crucial to consider the inherent case dependency in validation processes, enhancing the robustness of the approach. It is also crucial to recognize the challenges in capturing appropriate interperiod correlation of real records through simulations, which can introduce uncertainty in seismic demand estimation, particularly where multiple periods of the structure are excited.
Footnotes
Declaration of conflicting interests
The author(s) declared no potential conflicts of interest with respect to the research, authorship, and/or publication of this article.
Funding
The author(s) disclosed receipt of the following financial support for the research, authorship, and/or publication of this article: This study was funded by the STAND4HERITAGE project that has received funding from the European Research Council (ERC) under the European Union’s Horizon 2020 research and innovation program (grant no. 833123), as an Advanced Grant. This work was also partly financed by FCT/MCTES through national funds (PIDDAC) under the R&D Unit ISISE (reference UIDB/04029/2020). This work is partly financed by national funds through FCT—Foundation for Science and Technology (grant no. UI/BD/153379/2022) attributed to the fourth author.
Data and resources
The simulated dataset generated in the work by Karimzadeh et al. (2024b) based on the stochastic finite-fault approach was adopted for the purposes of this research (https://doi.org/10.1002/eqe.4040). The numerical models representative of the building stock in the Azores (Portugal) were taken from the research of Bernardo et al. (2022a, 2022b) (![]() ).
).