
Abstract
Recent earthquakes have demonstrated that code-conforming modern (i.e. post-1970s) reinforced concrete (RC) buildings can satisfy life safety performance objectives. However, the accumulated earthquake damage in these modern buildings raised concerns about their performance in future events, contributing to widespread demolition and long-term closure of damaged buildings. The economic and environmental impacts associated with the demolition and long-term closure of modern buildings led to societal demands for improved design procedures to limit damage and shorten recovery time after earthquakes. To address societal demands, this study proposes a damage-control-oriented seismic design approach that targets functional recovery by ensuring structural component demands do not exceed the damage-control limit state (DLS) under design-level events. Herein, DLS is defined as the post-earthquake state beyond which the strength and deformation capacity of a structural component is compromised, and its performance in a future event cannot be relied upon without safety-critical repair. This study proposes a methodology to determine component deformation limits for the design of structures for damage control. Using the developed methodology, we propose component rotation limits for RC beams, columns, and walls. The seismic performance and capability of buildings designed using the proposed design approach to satisfy recovery-based performance objectives is demonstrated through nonlinear response history and recovery analyses (using the ATC-138 methodology) of four archetype frame buildings, designed per New Zealand standards to different beam deformation limits. The analyses show that building codes can achieve functional recovery using the proposed component deformation limits without the need for sophisticated recovery analyses.
Keywords
Introduction
Current seismic design provisions in building codes (ASCE/SEI, 2016; CEN, 2004; GB 50011-2010, 2010; Standards New Zealand, 2004) provide criteria regarding the required stiffness, strength, and ductility for lateral load-resisting systems. The seismic design philosophy entails identifying the desirable hinging mechanism under strong ground shaking and then detailing these hinges to withstand expected inelastic deformations.
In terms of performance objectives, modern design code requirements focus on life safety with moderate damage allowed in structural components under design-level ground shaking. Generally, modern codes ensure that a low probability of partial or total collapse is achieved in buildings subjected to rarer events. For example, ASCE/SEI 7-16 adopts a 10% (or lower) probability of collapse for Risk Category II (Normal) structures, given the occurrence of a maximum considered earthquake (MCE). While a few design codes (e.g. NZS 1170) consider serviceability limit states for frequent events, only the Chinese GB 50011 (GB 50011-2010, 2010) targets repairable damage for 475-year return period ground shakings.
While modern design approaches have ensured a high probability of satisfying life safety objectives in future earthquakes, the cost of repairs and the associated building downtime have been considered uneconomic. Furthermore, the accumulated damage in these modern buildings raised concerns about their post-earthquake residual capacity and repairability, contributing to widespread demolition and long-term closure of damaged buildings (Marquis et al., 2017). The environmental effects from pollution associated with building demolitions and (re)construction-related carbon impacts are becoming unacceptable (Brown, 2012; Gotoh et al., 2002; Pan et al., 2014; Saito et al., 2015). It has also been highlighted that a significant gap exists between codified design provisions and desired performance objectives by building owners and society at large (Brown et al., 2022; EERI, 2019).
Policymakers and the engineering community are beginning to advocate for improved seismic design provisions (EERI, 2019; NIST-FEMA, 2021; Senate Bill 1768, 2018) which can help to reduce post-disaster functionality loss and improve recovery time. Such provisions would target a high probability of re-occupancy without needing safety-critical repair of structural elements by ensuring that induced structural damage is limited and the capacity (in terms of strength and deformation capacity) of the building remains uncompromised for future events (including aftershocks). Furthermore, these provisions should ensure limited damage to non-structural systems to improve the likelihood of post-disaster functional recovery.
To address the need for improved seismic design provisions, a damage-control-oriented design approach is proposed as a key step toward addressing recovery-based objectives for buildings. The damage-control-oriented approach targets functional recovery by ensuring structural component demands do not exceed the damage-control limit state (DLS) under design-level events. Herein, DLS is defined as the post-earthquake state beyond which the strength and deformation capacity of a structural component is compromised, and its performance in a future event cannot be relied upon without safety-critical repair. This design approach is informed by the ongoing development of guidance for assessment and repair of earthquake-damage buildings (ATC, 2021). While demonstrated here for reinforced concrete, the proposed design approach can be applied to all structural systems, irrespective of construction materials.
In line with the study objectives, this paper proposes a methodology to define component deformation limits for designing structures to satisfy recovery-based performance objectives. Using an extensive database of past tests on reinforced concrete (RC) components, component deformation limits (corresponding to the DLS) are defined for RC beams, columns, and walls. Thereafter, nonlinear response history and recovery analyses (using the ATC-138 methodology) of four archetype frame buildings, designed per New Zealand standards to different beam deformation limits, are used to assess the seismic performance and capability of the buildings to satisfy recovery-based performance objectives.
Addressing recovery-based objectives by designing for damage control
Performance-based seismic design (PBSD) allows for the selection of appropriate ground-motion levels and corresponding performance objectives for the structural and non-structural components in a building. The performance objective could range from full functionality to collapse prevention. According to FEMA P-2090 (NIST-FEMA, 2021), re-occupancy and functional recovery objectives are collectively referred to as recovery-based objectives. Re-occupancy has been defined as the post-disaster performance state, whereby the building is maintained/restored to be safe enough to serve as shelter, even if critical utility systems are not in functioning states (NIST-FEMA, 2021). Functional recovery is a post-disaster performance state in which a building is maintained/restored to support its pre-earthquake intended functions (NIST-FEMA, 2021).
Current building codes do not specifically address recovery-based objectives. Recent studies (FEMA, 2018) have shown that up to 40% of the modern US code-conforming buildings would be unoccupiable and need safety-critical repair after a large earthquake (i.e. design-level seismic intensity or greater). About 20% would be uneconomical to repair. Hence, any advancement to PBSD needs to consider damage-control requirements.
Figure 1a is a conceptual representation of a recovery-based design framework. As shown in Figure 1a, the initial steps in the framework entail hazard analysis, definition of the recovery-based performance objective, and preliminary definition of structural components. Subsequently, nonlinear response history analyses of the structure are carried out using a suite of ground motions scaled to the selected hazard intensity level. Damage and recovery analyses are carried out to assess the range of expected downtimes for the designed building at the selected hazard intensity level. A number of studies (e.g. Almufti and Willford, 2013; Cook et al., 2022) have proposed recovery analysis frameworks. Further discussions on recovery modeling are presented later in this article. As shown in Figure 1a, the building is iteratively designed (i.e. through modifying structural systems and designing non-structural systems to accommodate the design deformation/floor acceleration demands) until the performance objective is satisfied.
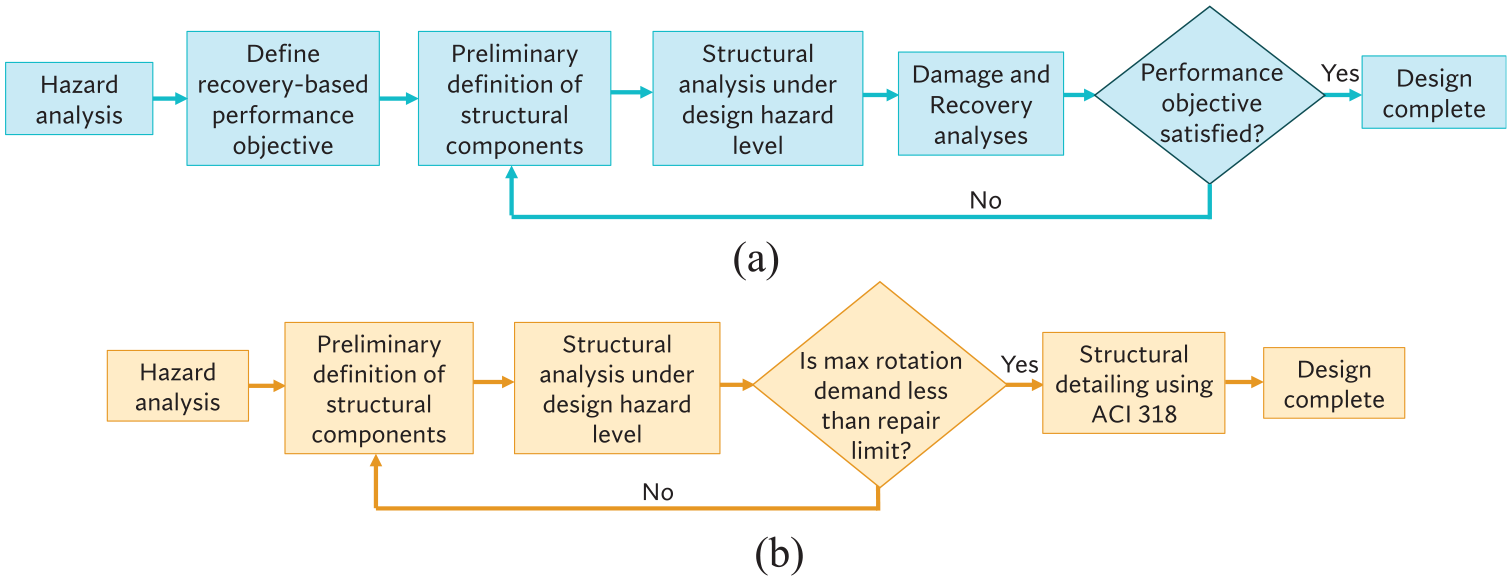
Flowchart showing the steps required for (a) a detailed recovery-based design framework and (b) the proposed damage-control-oriented design approach.
One of the challenges of a recovery-based design framework is that it can be computationally expensive and time-consuming, making the framework undesirable for practical design purposes. Engineers are more familiar with a more straightforward procedure where an elastic model or a nonlinear pushover analysis is used to estimate a story drift ratio demand, which is then compared with a story drift ratio limit. This study asks the question—is it possible to develop deformation limits for such a traditional design procedure (see Figure 1b) that can help satisfy recovery-based performance objectives without running a detailed recovery analysis?
Component deformation limits for damage-control requirements
Current design codes (e.g. ASCE 7 (ASCE/SEI, 2016) and NZS 1170 (Standards New Zealand, 2004)) typically specify story drift ratio limits of 2%–2.5% for buildings under design-level seismic actions. Furthermore, different design documents provide deformation limits on the component (rotation limit), section (curvature limit), or material (i.e. strain limit) level. For example, ACI 318-19 (ACI, 2019) provides component-level deformation limits for walls, and the LATBSDC (2020) provides limits at the component and section levels for different components. The New Zealand NZS 3101:2006 (Standards New Zealand, 2006) also provides section-level deformation limits in the form of normalized curvature ductility (referred to as K d ) for concrete components. According to NZS 3101, the ultimate limit state (ULS) curvature ductility demand of any structural concrete component must not exceed the K d limit. The K d limits in NZS 3101 have been calibrated to correspond to lower-bound limits for the ultimate deformation capacity based on a 20% drop in lateral resistance of concrete components (i.e. 0.8V max ) (see Dhakal and Fenwick, 2008). As illustrated by the example test data in Figure 2, for ductile components, the drift at a 20% drop in lateral resistance can be considerably larger than the drift at V max or initiation of lateral strength loss (LSL).
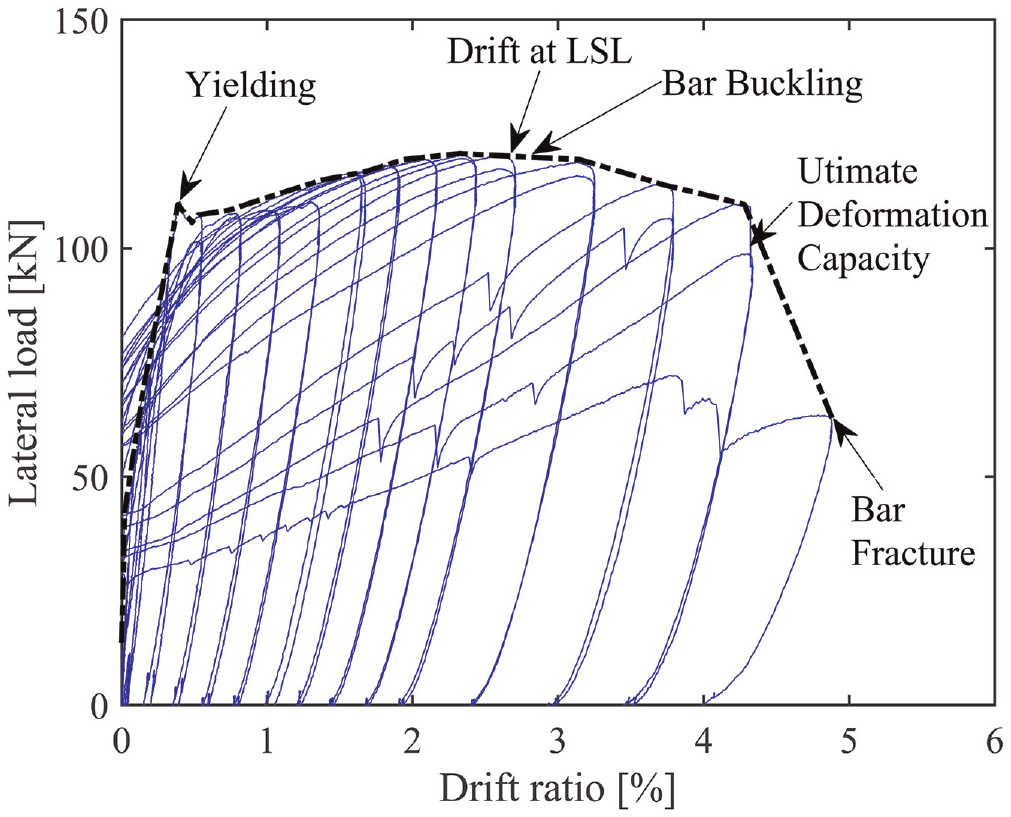
Example backbone curve showing the definition of drift at onset of LSL (data from Marder et al., 2018).
In a separate study aimed at developing guidance for post-earthquake assessment and repair of earthquake-damaged structures, Opabola et al. (2023) examined the datasets of ductile RC beam, column, and wall specimens subjected to various loading protocols. The main objectives of the Opabola et al. (2023) study were to understand (a) the deformation demand beyond which the residual capacity of an RC component is compromised and (b) the influence of prior loading history on future performance. The authors concluded that provided the deformation at the initiation of LSL of an RC component is not exceeded in any previous loading histories and low-cycle fatigue is not triggered; aside from a reduction in initial stiffness, the residual capacity (in terms of strength and deformation capacity) of the component is unlikely to be compromised. More information on approaches to low-cycle fatigue assessment of reinforcement is provided in the work by Elwood et al. (2021). Opabola et al. (2023) compared the deformation at the initiation of LSL for a database of ductile beam, column, and wall specimens and concluded that the deformation at the initiation of LSL typically corresponds to the onset of bar buckling in test specimens dominated by bar buckling (with a coefficient of variation less than 20%).
To avoid observation uncertainty associated with the reported drifts at the onset of bar buckling (or other damage phenomena) in the considered test specimens, Opabola et al. (2023) adopt the drift at LSL as the deformation corresponding to when safety-critical repair is needed. For consistency purposes, the current study follows the Opabola et al.’s (2023) approach. Hence, Opabola et al.’s (2023) dataset was adopted for this study. Furthermore, it is assumed that other prescriptive detailing limits of the ACI 318 code would be used to limit the potential of undesirable damage mechanisms (e.g. brittle shear failure and bond deterioration into joints, etc.).
For brevity, detailed information on the Opabola et al. (2023) dataset is not reproduced here. Interested readers are referred to the work by Opabola et al. (2023). Figure 3 presents the measured drift at LSL for the ductile specimens in the Opabola et al.’s (2023) database. It can be inferred from Figure 3a that the drift at LSL for well-confined beams is independent of the ratio of stirrup spacing to bar diameter (s/db). Lower-bound and median drifts at LSL of 2% and 3.6%, respectively, are estimated for the entire beam database. As shown in Figure 3b, the drift at LSL for columns is dependent on the axial load ratio. Relationships for the median estimates for drift at LSL as a function of axial load ratio are shown in Figure 3b. The larger rotation at LSL in columns with little or no axial load in comparison to beams may be associated with a larger transverse reinforcement ratio in columns.
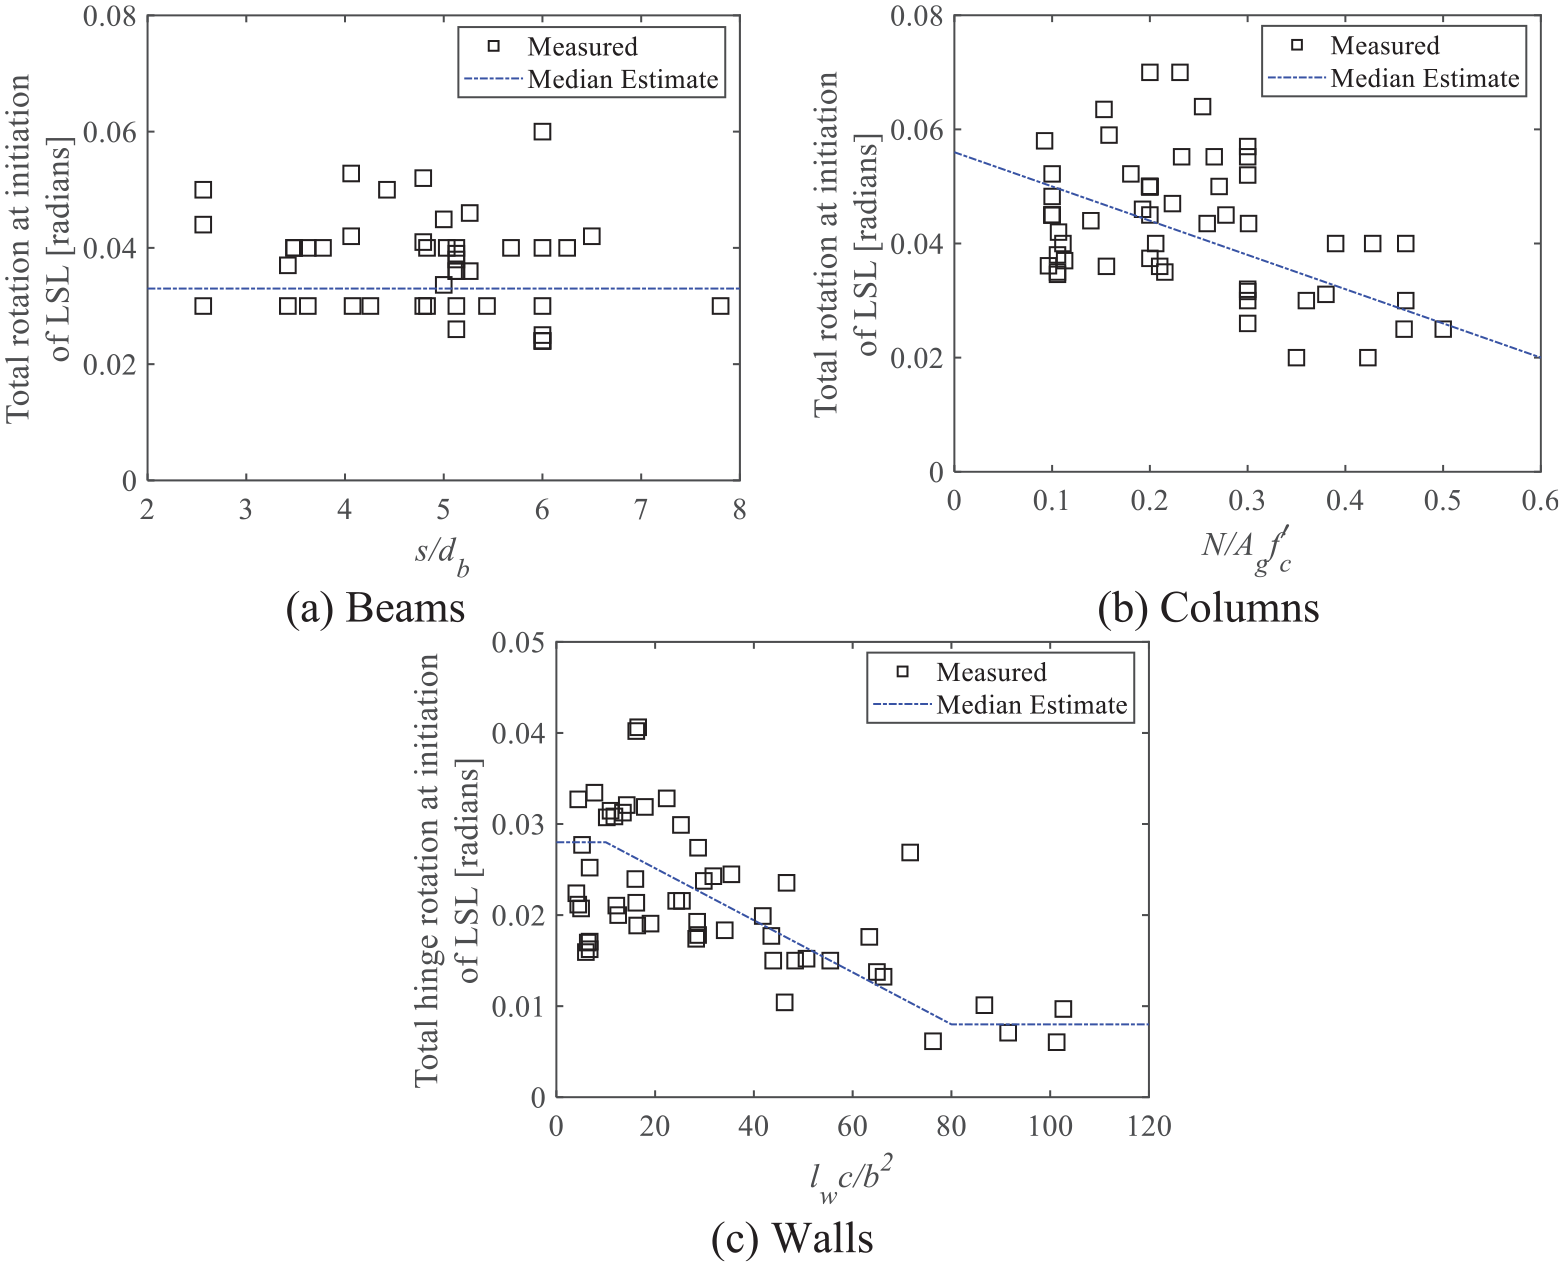
Measured deformation at LSL for (a) ductile beams, (b) ductile columns, and (c) ductile walls (see Abdullah, 2019; Opabola et al., 2023, for details on the data).
Figure 3c presents the relationship between total hinge rotation at bar buckling (corresponding to initiation of LSL) for ductile walls and lwc/b2 (where l w is the wall length, c is the compression zone depth, and b is the wall thickness).
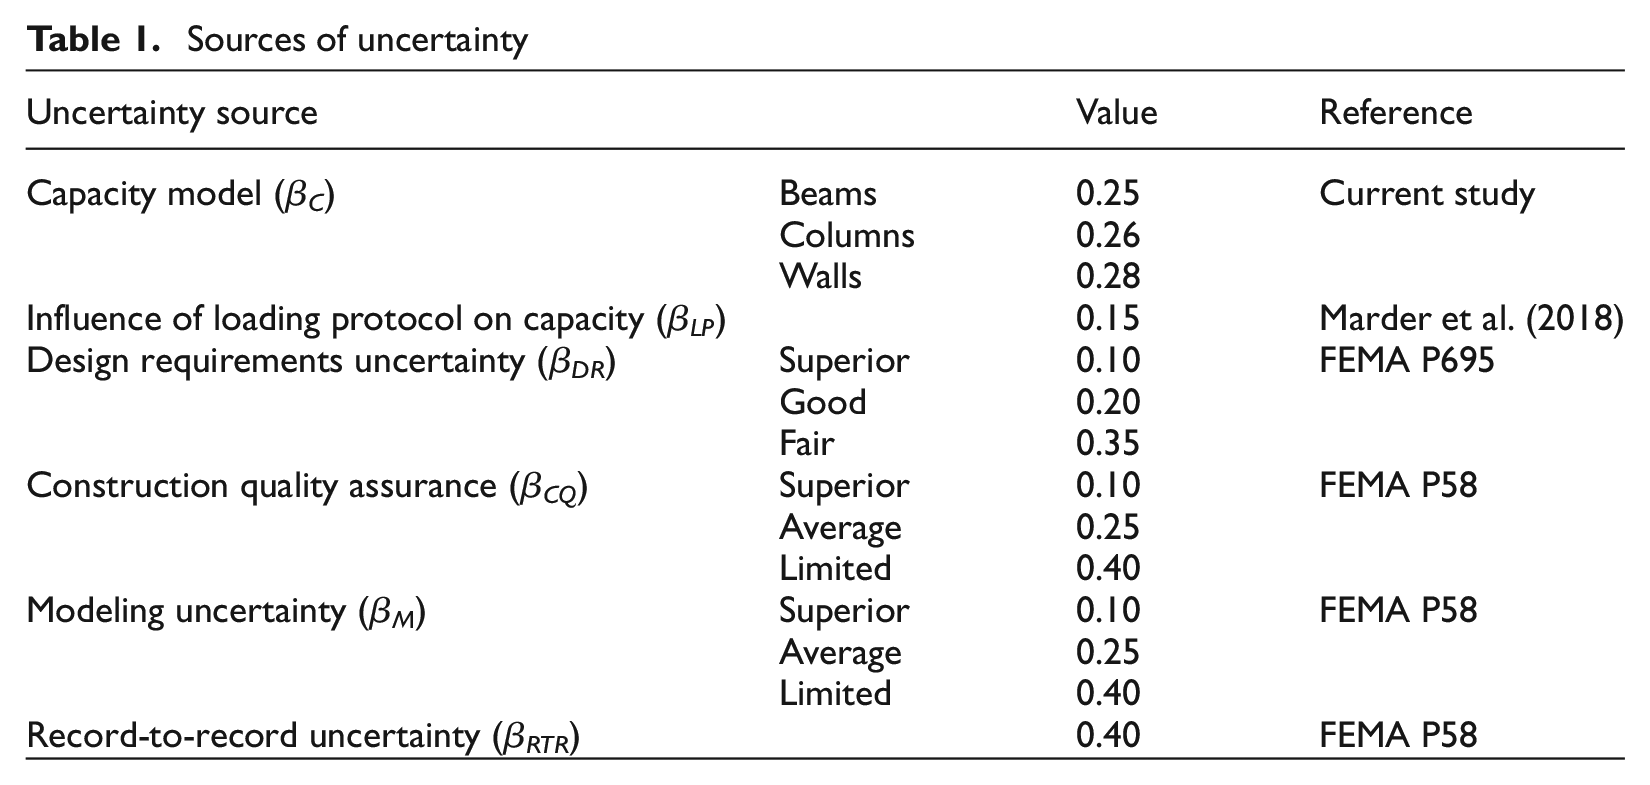
Equations (1) and (2) provide median estimates for the total chord and hinge rotation at LSL for ductile columns and walls, respectively. As shown in Table 1, lognormal standard deviations of 0.26 and 0.28 were estimated for the column and wall datasets, respectively:


Sources of uncertainty
The probability distribution of deformation at LSL and ultimate deformation capacity for the ductile beam dataset can be fitted with a lognormal cumulative distribution function (CDF), as shown in Figure 4 for the ductile beam dataset. The lognormal CDF fitted to the data corresponds to a median drift at LSL of 3.6% with a lognormal standard deviation of 0.25. Figure 4 also shows a lognormal CDF fitted to the data for ultimate deformation capacity (i.e. deformation at 20% drop in lateral resistance) corresponding to a median ultimate deformation capacity of 4.4% with a lognormal standard deviation of 0.21. Hence, for ductile beams, the median rotation at LSL equals 0.8 times the median of the ultimate deformation capacity.
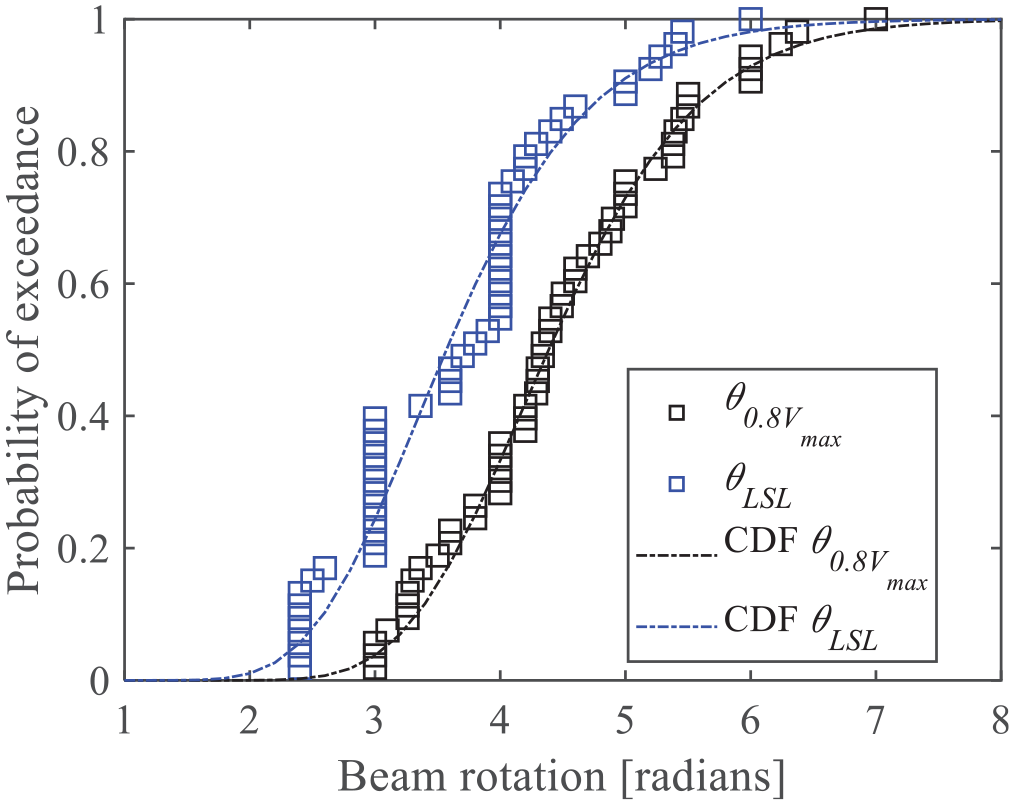
Lognormal CDF for deformation at LSL and ultimate deformation capacity (0.8V max ) for ductile beams.
From a probabilistic analysis point of view, to control damage, there has to be a low probability of the deformation demands from a given hazard level exceeding the deformation at LSL. It is also important to account for all sources of epistemic and aleatory uncertainties in such a probabilistic analysis. Examples of such uncertainties include (a) uncertainty in predicting the drift at LSL (β LSL ) (e.g. see Figure 4), (b) uncertainty in the influence of loading history on the drift capacity at LSL (β LP ), (c) design requirement uncertainty (β DR ) (as defined in FEMA P695 [FEMA, 2009], (d) construction quality assurance (β CQ ) (as defined in FEMA P58 [FEMA, 2012]), (e) modeling uncertainty (β M ) (as defined in FEMA P58 [FEMA, 2012]), and (f) record-to-record uncertainty (β RTR ) (as defined in FEMA P58 [FEMA, 2012]). Table 1 presents a list of recommended values for each of the aforementioned uncertainties. The uncertainty in the influence of loading history on the drift capacity at LSL can only be inferred from tests on nominally identical test specimens. Marder et al. (2018) conducted a series of static and dynamic tests on 16 nominally identical beam specimens with and without axial restraint. The uncertainty in the influence of loading history on the drift capacity at LSL was quantified by fitting a lognormal distribution to the measured drift capacities at LSL of the test specimens, resulting in a lognormal standard deviation of β LP = 0.15.
A reliability-based approach for performance evaluation needs to explicitly account for the aforementioned uncertainty sources. The total component-level uncertainty at DLS (β TOT ) can be estimated as the square root of the sum of squares of relevant uncertainties. From Table 1, it is inferred that β TOT ranges from 0.5 to 0.85, depending on the considered uncertainty values. Acceptable values of damage-control margin ratio (defined as the ratio of component deformation limit to component deformation at LSL) can be estimated based on the assumption that the distribution of the component demand is also lognormal. Furthermore, given the similarities in β C for all components (approximately 0.3), it is possible to select a uniform damage-control margin ratio across the considered RC components. Table 2 provides multipliers to the median drift at LSL based on acceptable probabilities of requiring safety-critical repair and total component-level uncertainty at DLS. The multipliers correspond to the defined probabilities of exceedance derived from a lognormal CDF with a median of 1.0 and lognormal standard deviation of β TOT .
Range of multipliers to median deformation at LSL to derive damage-control limits
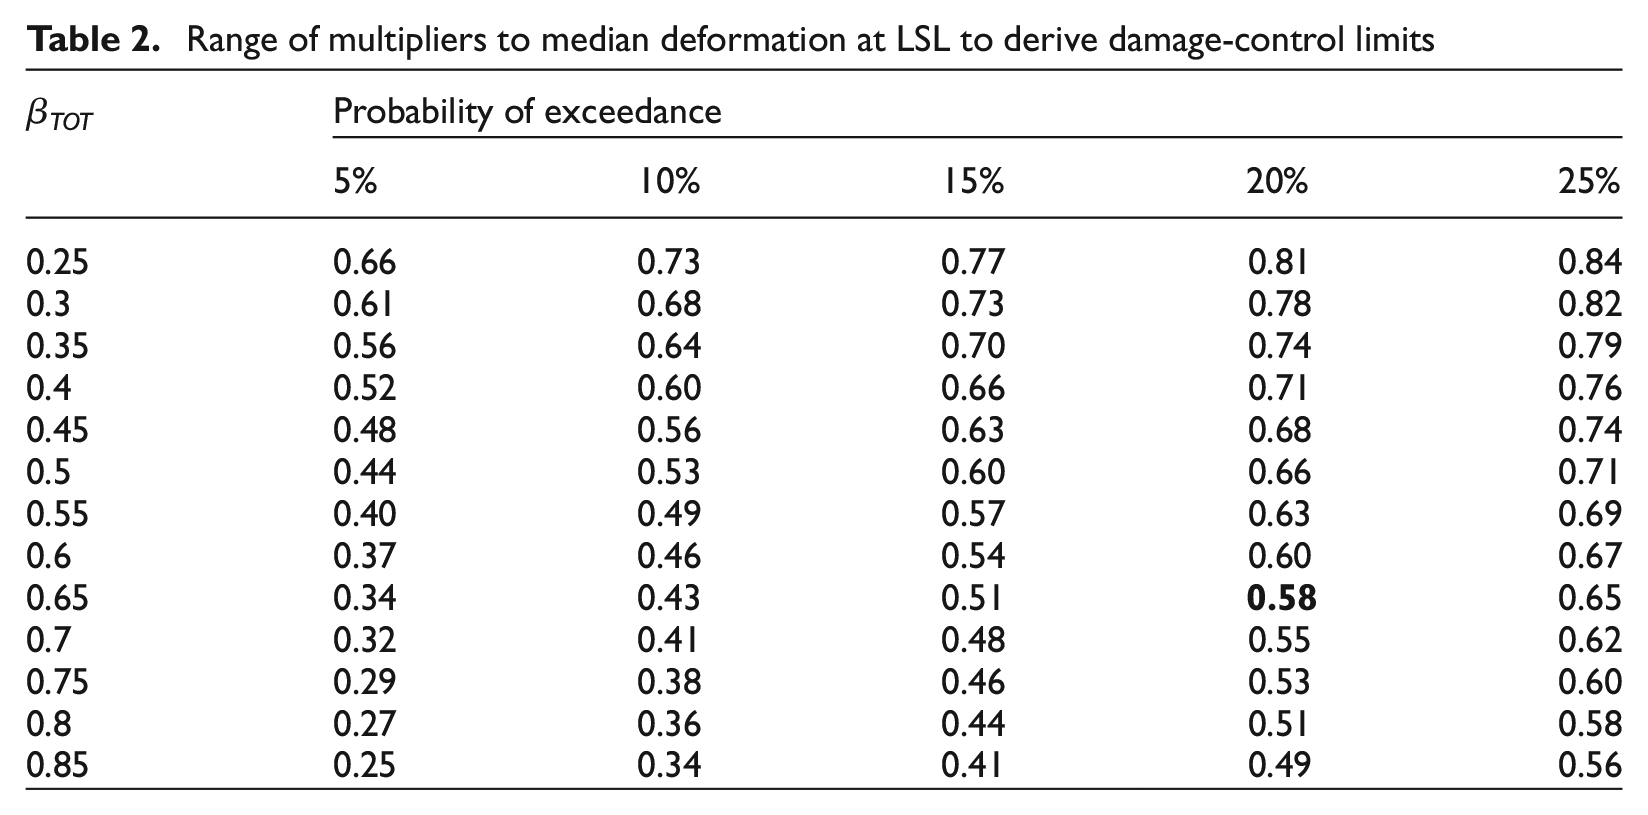
For example, combining capacity dispersion of β C of 0.3 with selected dispersions β LP of 0.15, β DR of 0.2, β CQ of 0.25, β M of 0.25, β RTR of 0.4, a β TOT of about 0.65 is computed. From Table 2, a selected probability of exceedance of 0.2 results in a damage-control margin ratio of 0.58. For beams with a median drift at LSL of 3.6%, a component damage-control deformation limit of 0.58 × 3.6 = 2% can be estimated. Alternatively, the table can be used to estimate the probability of exceedance for a selected damage-control deformation limit (e.g. assuming same uncertainties as above, a limit of 1.5% would infer a probability of exceedance of approximately 10%).
The proposed component damage-control deformation limit for columns, if a probability of exceedance of 20% is desired, can be estimated by multiplying Equation (1) by 0.58:

Similarly, for a probability of exceedance of 20%, the proposed component damage-control deformation limit for walls can be estimated from Equation (2) as:

Figure 5 presents a graphical representation of the proposed component damage-control deformation limits for beams (2%), columns (Equation (3)), and walls (Equation (4)). As shown in the figure, given the lower limit for beams and the typically greater hinge rotation demand in beams compared to columns, beam limits will govern the design process for RC frames except for the cases of very high axial loads.
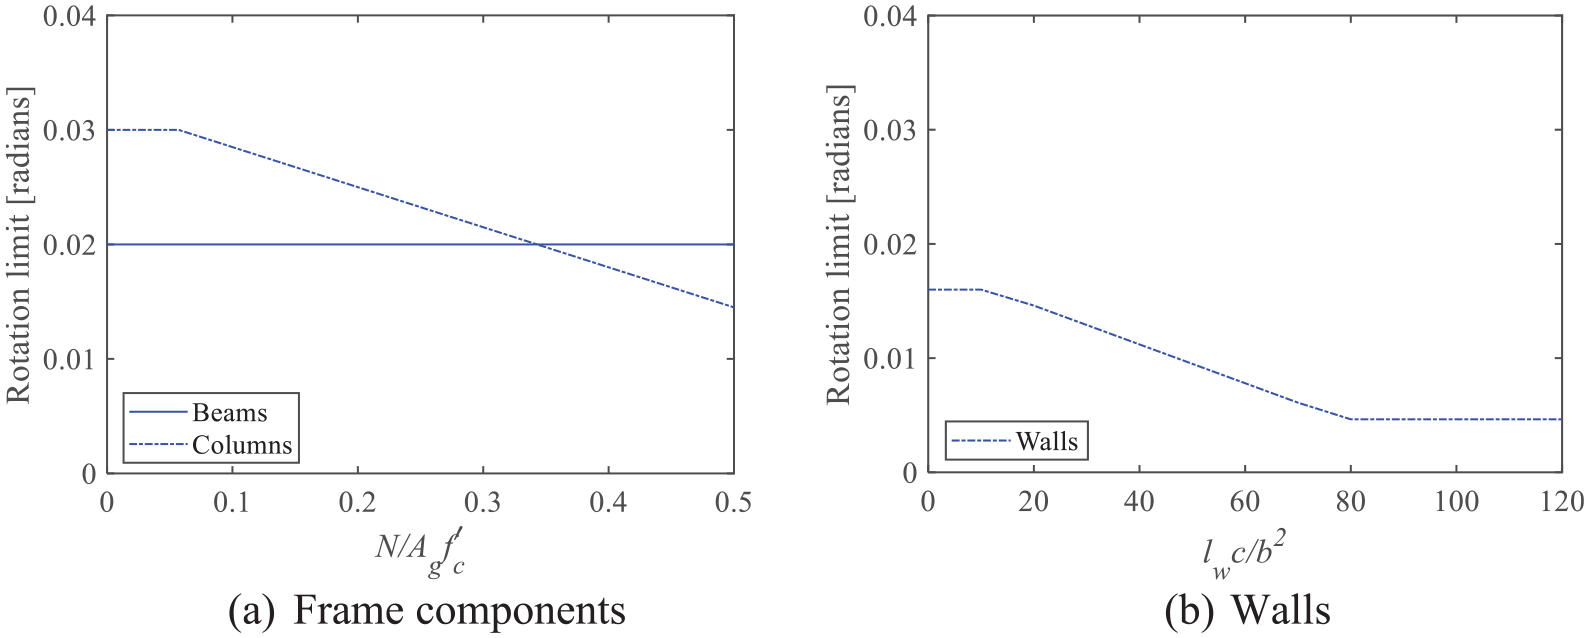
Component deformation limits based on a 20% probability of exceeding LSL: (a) chord rotation limits for beams and columns and (b) hinge rotation limits for walls.
Story drift ratio limits for RC structures can be derived from beam rotation limits (θ b ) using a simplified approach presented in Equation (5) (CCANZ, 2011), assuming all rotations are concentrated at the mid-depth of a beam plastic hinge (taken as half the beam depth).

where θ b is the beam rotation, θ c is the story drift ratio, h c and h b are the column and beam depth, respectively, and L is the bay width measured from column centerline to column centerline. It is noted that any other kinematic assumptions can be used to derive beam rotation demands from the story drift ratio.
For a wide range of practical values of h c , h b , and L, using Equation (5), beam rotation limits of 1.5% and 2% correspond to story drift ratio limits of 1% and 1.5%, respectively. Hence, story drift ratio limits of 1% and 1.5% are recommended for 10% and 20% probabilities of exceeding the beam damage-control limit, respectively.
Numerical analyses of modern-code and damage-controlled buildings
This section explores the seismic performance of modern-code and “damage-controlled” (i.e. designed using the proposed damage-control deformation limits) buildings to assess the likelihood of satisfying recovery-based performance objectives. This study focuses on RC frame buildings. Additional studies on RC wall buildings will be carried out in the future. First, four archetype frame buildings are designed to different beam rotation limits—1.5%, 2%, 2.5%, and 3%, corresponding to 10%, 20%, 30%, and 40% probabilities of exceeding the beam damage-control limit. As earlier mentioned, beam rotation limits will govern a frame building design, except when the columns are under high axial load. The four buildings are named based on the design beam rotation (BR) as BR_1.5, BR_2, BR_2.5, and BR_3, respectively. Following the archetype designs, nonlinear response history analyses (NLRHAs) are carried out to derive and compare fragilities for damage-control (DLS) and collapse (CLS) limit states for the four buildings. Story drift ratio and peak floor acceleration outputs from the NLRHA are used to conduct recovery analyses of the archetypes using the ATC-138 methodology (FEMA, 2021) (a description of the ATC-138 methodology is provided subsequently in this article). Finally, the fragilities and recovery times for the four buildings are compared.
Design of archetypes
The archetype buildings are five-story regular RC perimeter frame buildings located on a Site Class C in Wellington. The plan and elevation views of the building are presented in Figure 6. The floor dimensions are 36 and 48 m in orthogonal directions. The ground floor has a height of 4.2 m, while the other floors have a height of 3.8 m.
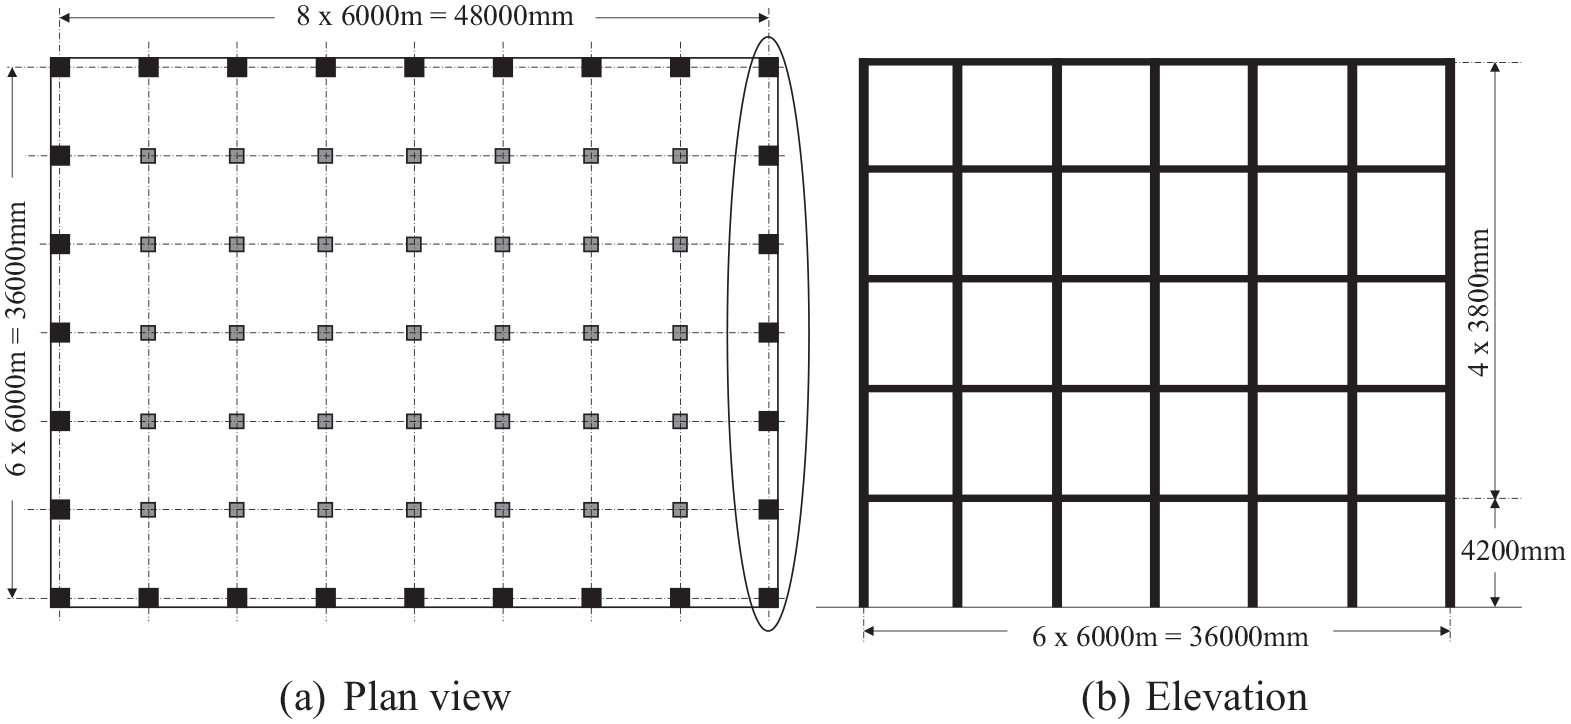
(a) Plan and (b) elevation views of the archetypes (the modeled seismic frame is circled in (a)).
The buildings were designed per NZS 1170.1, NZS 1170.5, and NZS 3101 (Standards New Zealand, 2002, 2004, 2006). In addition to the self-weight of the building, superimposed dead and live loads (computed in accordance with NZS 1170.1) were also considered in the building design. The superimposed dead and basic live loads for typical floors were 7.5 and 3 kPa, respectively. The superimposed dead and basic live loads for the roof were 7.5 and 0.25 kPa, respectively.
The buildings were designed using the equivalent static analysis method per NZS 1170.5. All buildings were designed to a ductility of four. The cracked section properties for the linear analyses were in accordance with NZS 3101. The archetypes were designed using a concrete compressive strength of 30 MPa and longitudinal reinforcement yield strengths of 300 and 500 MPa for the beams and columns, respectively.
The four target design beam rotations (i.e. 1.5%, 2%, 2.5%, and 3%) were achieved by varying the dimensions of the beams and columns in each archetype. The design story drift demands were scaled from the elastic drift demands following NZS 1170.5 provisions. Beam rotation demands were computed from the story drift ratio using Equation (5).
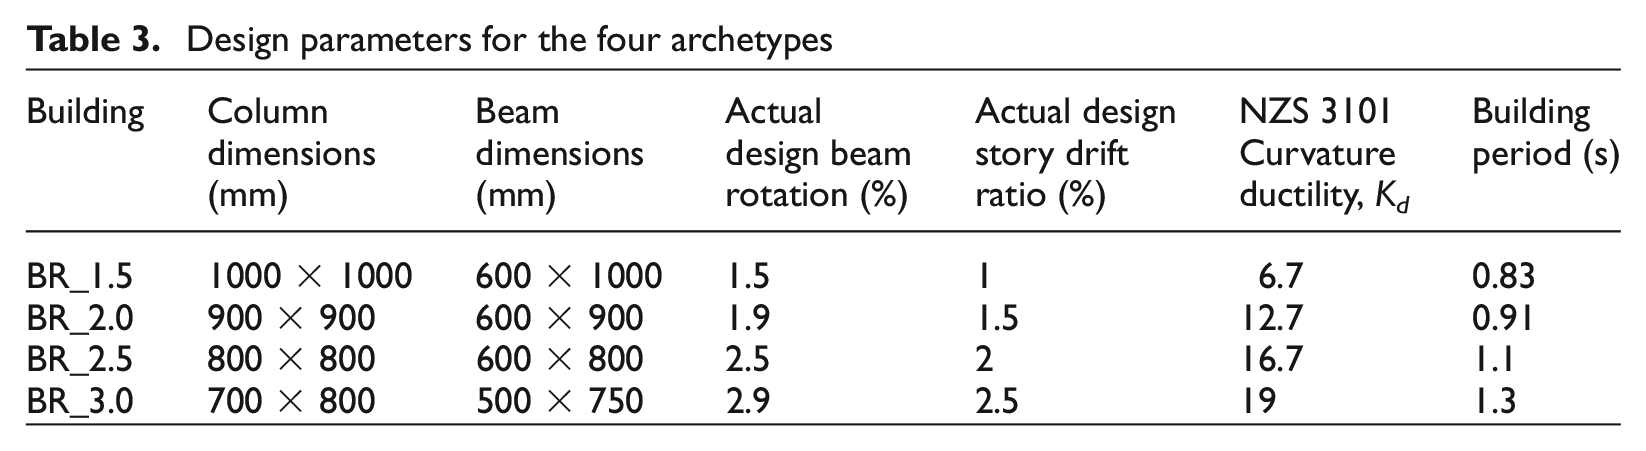
The design dimensions for the structural components of the seismic frames are presented in Table 3. As shown in the table, the archetype with a beam rotation of 3.0% satisfies the NZS 1170 design story drift ratio limit of 2.5% and curvature ductility limit of 19 required by NZS 3101. Hence, this building is considered the “minimum code requirement” archetype and will be used as a reference for the performance of “damage-controlled” buildings in this study. As shown in Table 3, all the design curvature ductility limits for the other buildings fall below the NZS 3101 limit of 19 (see Dhakal and Fenwick, 2008 for more discussions on how the curvature ductility limits were defined). The building periods are also presented in Table 3.
Design parameters for the four archetypes
All four buildings were designed per NZS 3101. Capacity design principles were considered in detailing the beams, columns, and joints. Each building was designed to ensure flexural yielding in the beams.
In the study described below, the reference building is taken as the building designed to a beam rotation of 3% (corresponding to a story drift ratio of 2.5%)—archetype BR_3—as this building marginally satisfied the minimum requirements of current standards in New Zealand. Buildings BR_2.0 and BR_1.5 are referred to herein as “damage-controlled” buildings as they both meet the damage-control beam rotation limit of 2%.
OpenSees modeling and ground motions
Two-dimensional nonlinear finite element models of the 36-m long seismic frame were developed in OpenSees (Mazzoni et al., 2006) using concentrated plasticity models. The OpenSees Modified IMK hinge (Lignos, 2008) was adopted in this study. To properly simulate the response of the beams, the moment-rotation behavior of the beams was calibrated to the force–displacement responses of beams tested at the University of Auckland Structures Laboratory (Marder et al., 2018) (see Figure 7). As shown in Figure 7, the modeling parameters are able to capture the influence of displacement history on the beam test specimens.
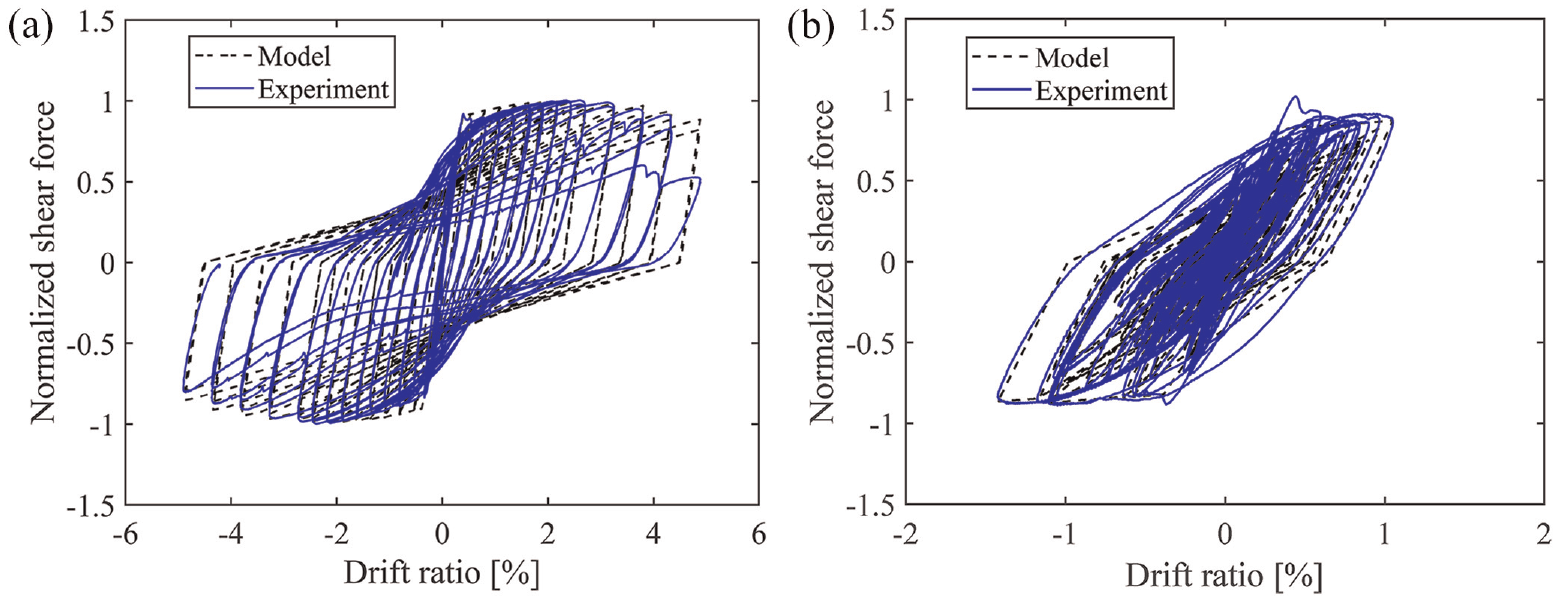
Calibrated hysteretic model of the beam elements using test data for nominally identical beam specimens subjected to (a) standard cyclic loading protocol and (b) earthquake loading protocol (data from Marder et al., 2018).
The moment-rotation behavior of the columns was modeled following the recommendations of Haselton et al. (2016). To account for joint flexibility, in accordance with ASCE/SEI 41 (ASCE, 2017), rigid offsets were assumed only in the columns. To account for nonlinear geometric effects in the OpenSees model, P-delta transformation was adopted for the seismic frame columns. Furthermore, a leaning column (with a pinned base) connected to the seismic frame via a rigid truss element was used to simulate the gravity load on the interior gravity columns of the structure. Rayleigh damping of 2% in the first and third modes was adopted for the model.
The corresponding elastic response spectrum for the site conditions of the building, defined using NZS 1170.5, was used to select ground motions at five intensity levels—return period of 50, 100, 500, 1000, and 2500 years. The ground-motion selection and scaling procedure at each intensity level were in accordance with NZS 1170.5. A total of 11 ground-motion records were selected at each intensity level.
Seismic fragility at DLS and CLS
By assuming a lognormal distribution for the demand and capacity, the probability of exceeding a specified limit state in the structural components can be estimated using Equation (6):
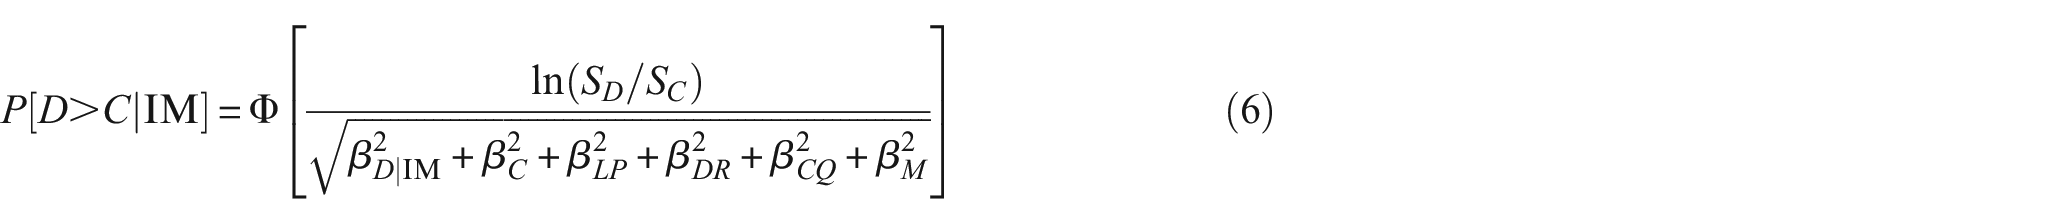
where D is the seismic demand, C is the capacity, S D is the median value of the demand, S C is the median value of the capacity at the chosen limit state, βD|IM is the record-to-record variability as a function of S a (T 1 ), β C is the dispersion of drift capacity at the considered limit state, β DR is the design requirement uncertainty, β CQ is the construction quality assurance, and β M is the modeling uncertainty.
The median component capacity at DLS is based on the definition provided in the earlier sections (see Figure 3). Collapse was defined to correspond to a story drift ratio of 6%. Figure 8 presents the resulting fragility curves for the considered buildings. Figure 8d shows that the “code-minimum” building (i.e. BR_3) has a median DLS fragility of 0.4 g, while the buildings designed to beam rotation limits of 2% and 1.5% have median DLS fragilities of 0.66 and 0.83 g, respectively—corresponding to a 1.65 and 2.1 times increase, respectively. As shown in Figure 8, the probability of the archetypes requiring safety-critical repair at design level (i.e. 500-year return period) reduces with the design beam rotation limit. Archetype BR_3 has a 26% probability of exceeding DLS, while values of 16% and 13% were estimated for archetypes BR_2 and BR_1.5, respectively—corresponding to 60% and 50% of BR_3, respectively.
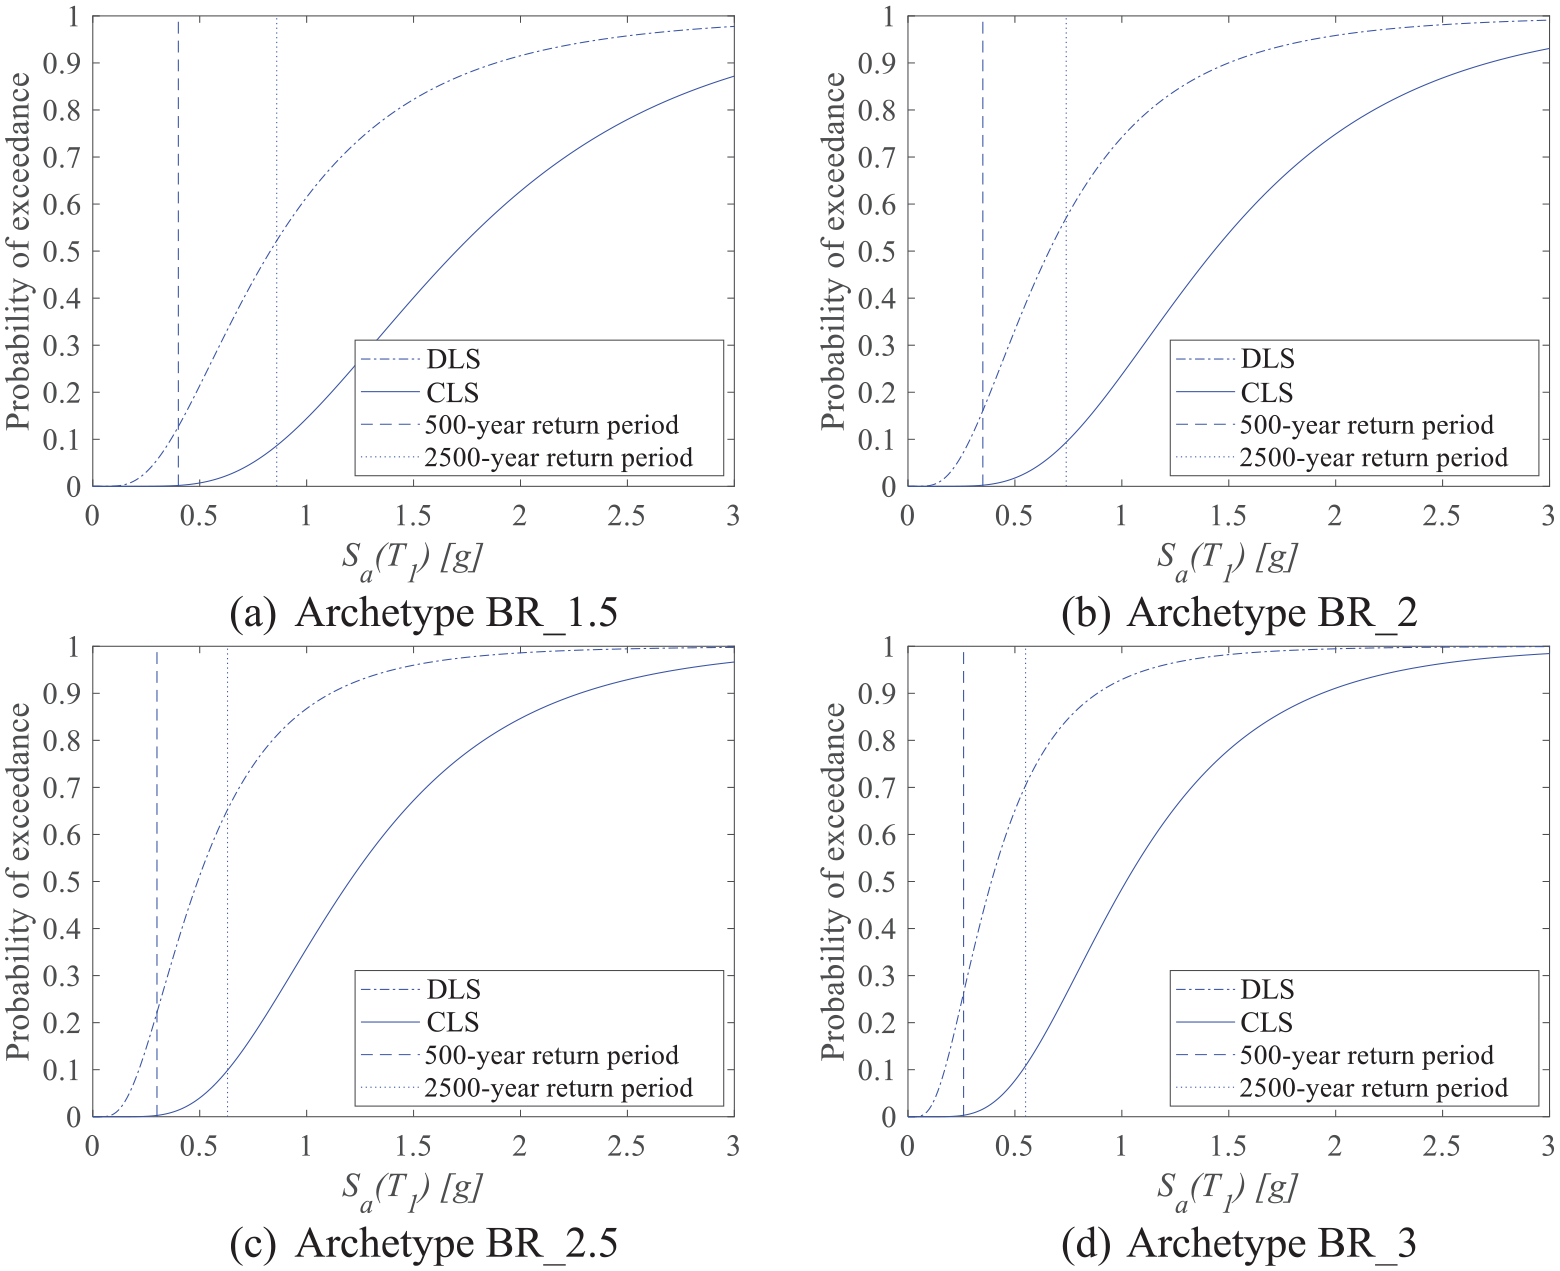
Seismic fragility curves for DLS and CLS for the four archetypes.
The median collapse fragilities for BR_2.5 and BR_3 are 1.2 and 1.02 g, respectively. However, BR_1.5 and BR_2 have collapse fragilities of 1.69 and 1.43 g, respectively. While the influence of beam rotation limit on the seismic fragility functions for DLS and the median collapse fragility estimates were expected, it was interesting to observe that the probability of exceeding the defined CLS at the MCE (2500-year return period) was approximately 10% in all the archetypes. Figure 8 suggests that the probability of exceeding DLS in Design Basis Earthquake (DBE) is more affected by the change in beam rotation limits than the collapse probability in MCE (i.e. increased stiffness influences damage-control more than collapse performance).
The similarities in collapse probabilities at MCE across the archetypes may be associated with the fact that the observed shift (i.e. increase) in median collapse fragility estimate (as building initial stiffness increases) is matched by a corresponding increase in S a (T 1 ) at MCE, without any significant reduction in the dispersion of the collapse fragility. It is important to note that a larger beam section does not necessarily lead to an increase in deformation capacity. Hence, MCE resulted in deformation demands that are larger than the deformation capacity at LSL of the beams (i.e. post-capping deterioration is triggered) in all the archetypes. Collapse performance is closely linked to post-capping degradation and the associated amplification of displacement demands (Ibarra and Krawinkler, 2004). Since this degradation occurs for all archetypes at MCE, a convergence of collapse fragilities is observed. While this observation may seem counterintuitive, similar conclusions can be inferred from other studies. For example, in a study exploring the influence of increased initial stiffness on the seismic performance of wall buildings, Cando et al. (2020) observed that an increase in initial stiffness significantly influences the probability of exceeding the life safety performance objective. In comparison, the impact of initial stiffness on collapse fragility was observed to be less significant.
Recovery analyses
The ATC-138 recovery analysis methodology (FEMA, 2021) was adopted in this study to assess the ability of the archetypes of meeting post-earthquake recovery objectives. The methodology uses structural analysis outputs (i.e. peak story drift ratio and floor accelerations) to quantify the post-earthquake recovery state of a building at the component and system levels in a probabilistic manner. The main outputs of the methodology are probabilistic distributions for the times required to achieve re-occupancy, functional recovery, and full recovery.
The ATC-138 methodology quantifies the probabilistic post-earthquake recovery state of a building by estimating the post-earthquake damage states of the structural and non-structural components in the building and evaluating system-level performance through a series of fault-tree analyses. The time required to restore a building to a particular recovery state uses a repair scheduling algorithm, which accounts for recovery-impeding factors associated with inspecting a damaged building, design and permitting, contractor mobilization, temporary clean-up and repairs, and other factors. It is noted that the framework assumes that financing, engineering design, permit procurement, and contractor mobilization take place in parallel. Also, the estimated times depend on the severity of the damage to the building. There is significant uncertainty in estimating these time frames; hence, the distribution of potential time frames is an important output of the methodology. Further discussions on the ATC-138 methodology can be found in FEMA (2021) and in the work by Cook et al. (2022).
Considered recovery-impeding factors include inspection, financing, permitting, engineering mobilization, contractor mobilization, and long lead time. No time mitigation factors (e.g. inspector or engineer on retainer) were considered.
Figures 9 and 10 present the outputs of the recovery analyses (i.e. estimated time for re-occupancy and functional recovery, respectively) for the four archetypes at five intensity levels. As shown in Figure 9, according to the ATC-138 analysis, all four buildings are able to achieve re-occupancy at service-level events. A median downtime of about 1 month is required to achieve re-occupancy in the code-minimum building at the design level (i.e. 500 years). However, the median results indicate that the damage-controlled buildings (i.e. BR_1.5 and BR_2) are able to achieve immediate re-occupancy at design-level demands. BR_1.5 achieves immediate re-occupancy for ground-motion intensities up to a 1000-year return period.
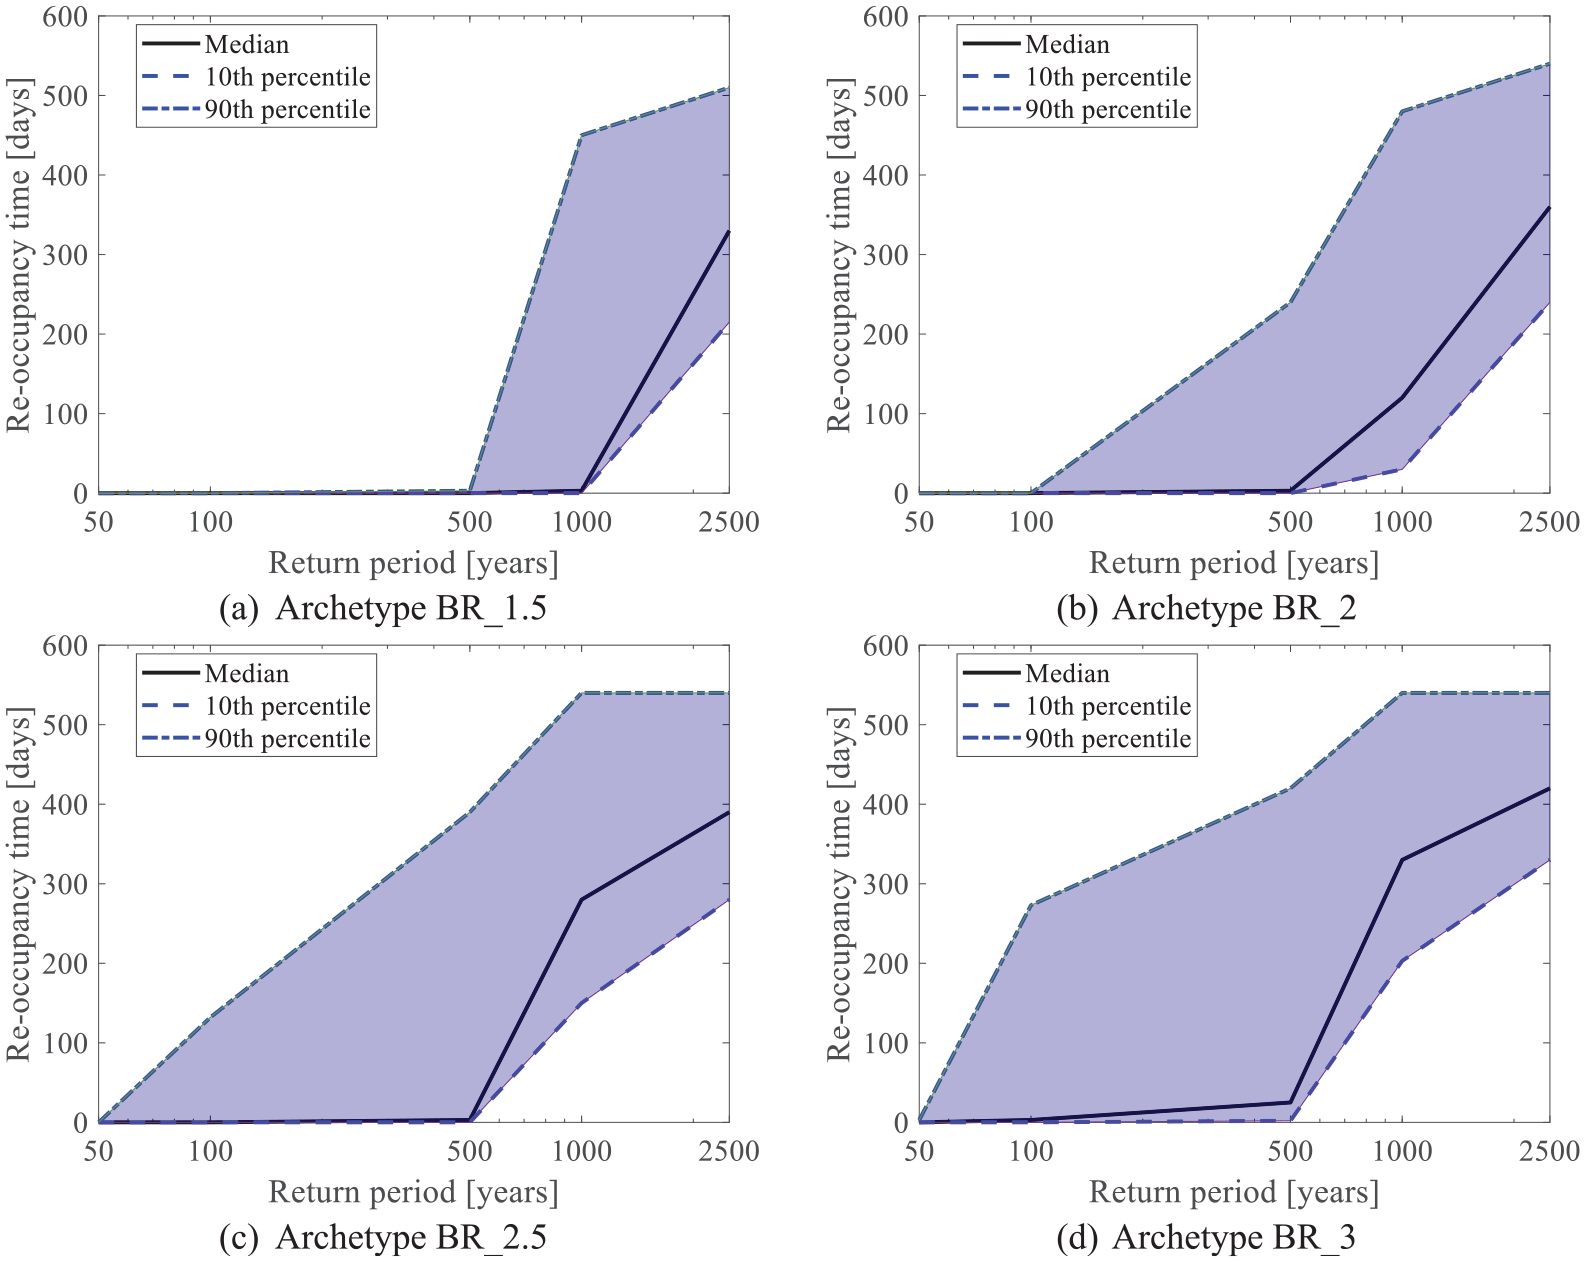
Estimated re-occupancy time for the four archetypes using the ATC-138 methodology.
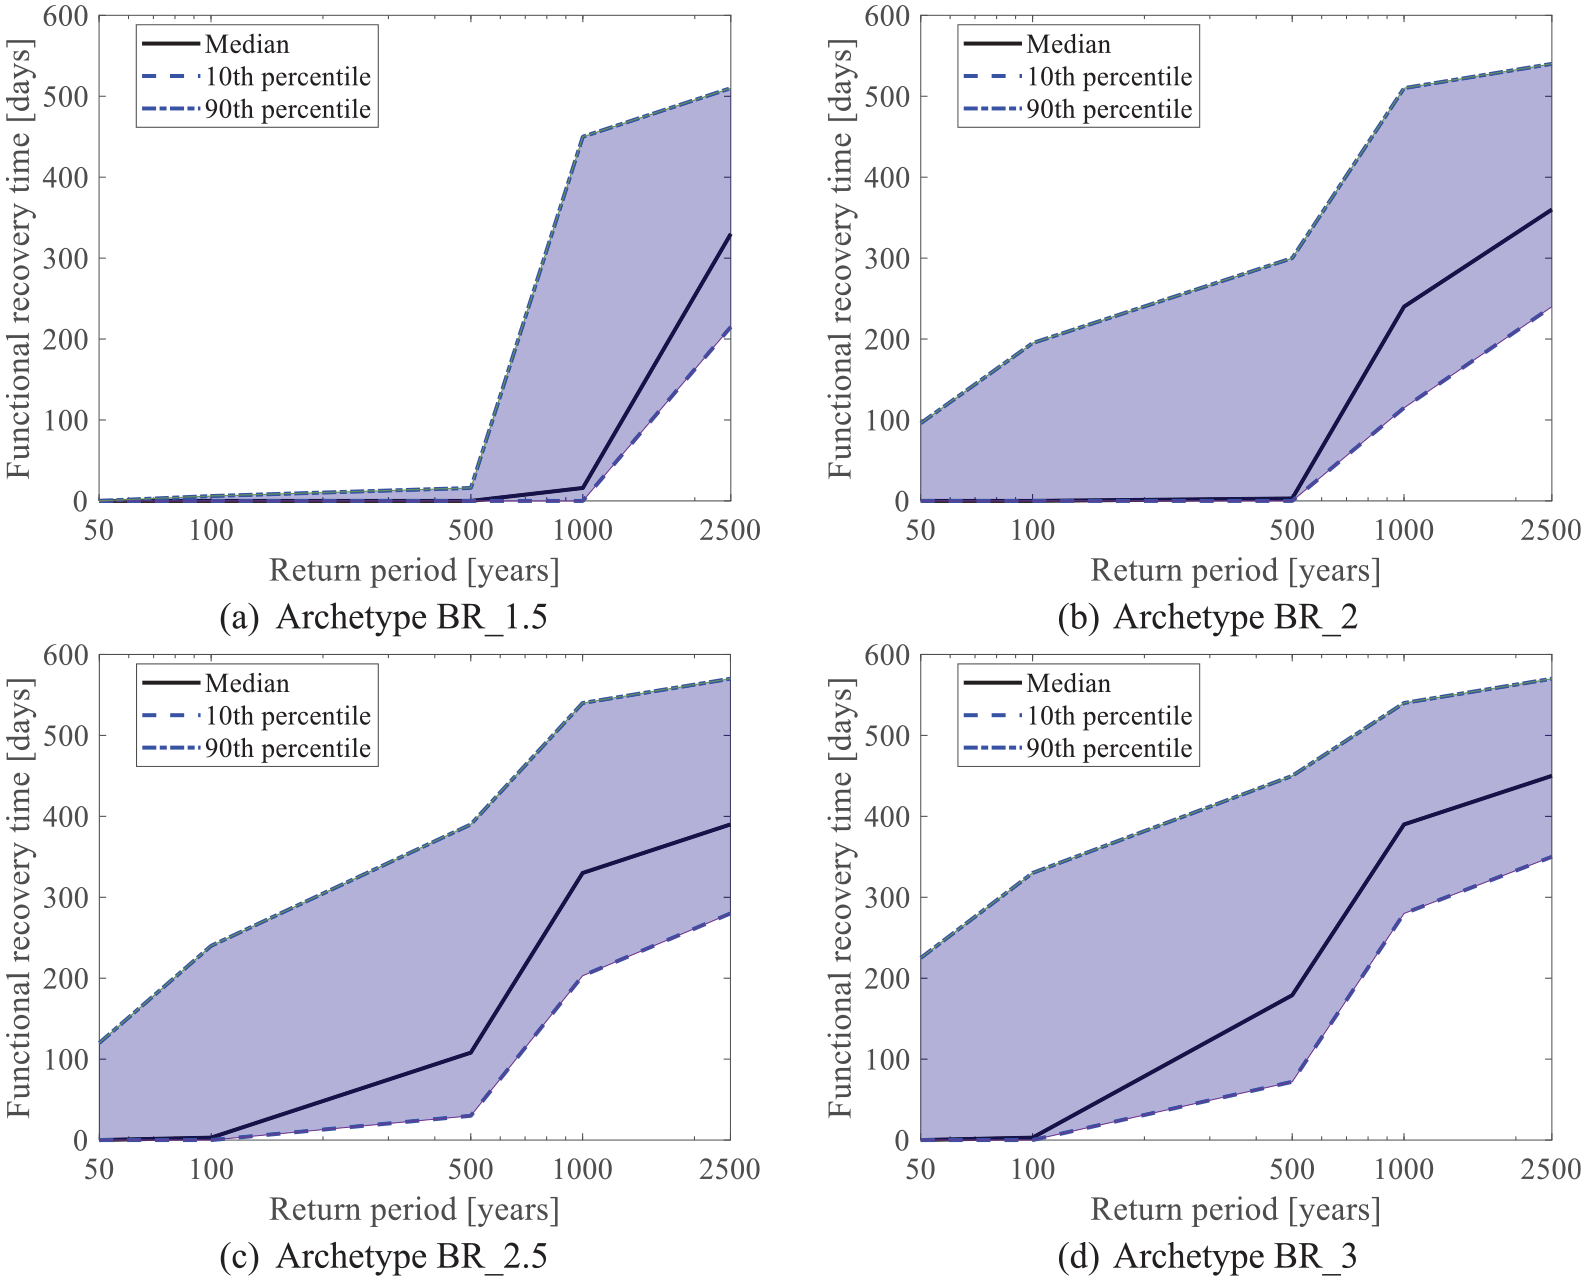
Estimated functional recovery time for the four archetypes using the ATC-138 methodology.
As shown in Figure 10, the downtime to achieve functional recovery for the four archetypes varies significantly at the design level (i.e. 500 years), with damage-controlled buildings designed to damage-control limits exhibiting a higher probability of achieving immediate functional recovery in comparison to code-minimum buildings for design-level events. A median downtime of about 6 months is required to achieve functional recovery in the code-minimum building at the design level. However, the median results indicate that the damage-controlled buildings (i.e. BR_1.5 and BR_2) are able to achieve immediate functional recovery at design-level demands. Considering the median results, archetype BR_1.5 achieves immediate functional recovery for ground-motion intensities up to a 1000-year return period, while archetype BR_2 is able to achieve a similar performance up to a 500-year return period.
Recovery modeling entails dealing with various sources of uncertainties which can influence the estimated downtime, as demonstrated by the wide distribution of possible recovery times shown in Figures 9 and 10. Considering these uncertainties and the wide distribution, the output of the ATC-138 methodology should be primarily viewed as a useful comparative tool between the archetypes rather than a predictive tool of likely recovery time frames. It is also noted that apart from the building-level uncertainties considered in ATC-138, community-level factors (e.g. cordoning, disruption to municipal utility networks, or any other form of forced displacement) may result in impeded recovery. The consideration of these community-level factors is, however, not within the scope of the study.
If the information on the seismic hazard at the design site is known, a risk-targeted seismic design method (e.g. Luco et al., 2007) can be used to combine the hazard curve and the DLS fragility function to ensure that the risk of earthquake-induced safety-critical damage during the design service life (e.g. 50 years) is acceptable.
Relationship between beam rotation limits, probability of exceeding DLS, and functional recovery time
Figure 11 compares the influence of the design beam rotation on the median time to achieve functional recovery under a 500-year return period ground motions. Figure 11 also includes the probability of exceeding the DLS under a 500-year return period demand and CLS under a 2500-year return period demand for the four archetypes. Note that all buildings have a probability of requiring safety-critical repairs of less than 50%, even for the code-minimum design (BR_3) where the component design limits were not considered in the design process. This suggests that modern-code-designed buildings are likely to be repairable following a design-level earthquake. However, the median functional recovery time frame for the code-minimum building of approximately 6 months may be considered too long. Designing to satisfy the component damage-control deformation limits suggested in this study leads to a median functional recovery time on the order of days, a 40-times reduction relative to the code-minimum building. As mentioned earlier, Figure 11 suggests that the probability of the considered archetypes exceeding the DLS at DBE is more affected by the change in design limits than the collapse probability at MCE (i.e. increased stiffness influences damage control more than collapse performance).
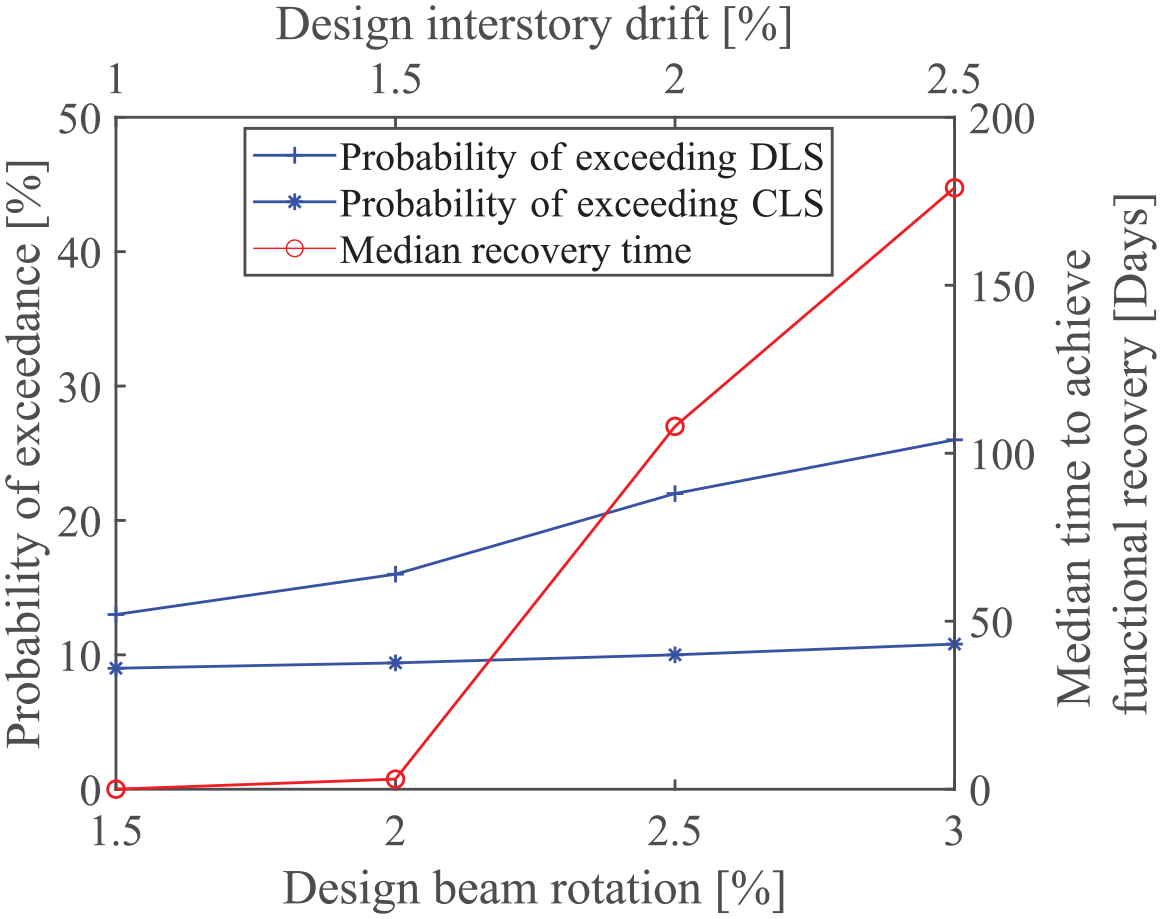
Relationship between the design deformation limits, median functional recovery time under a 500-year return period, and probability of exceeding the DLS under a 500-year return period and CLS under a 2500-year return period for the four RC frame building archetypes.
A limitation of the current study is that only four buildings have been studied. Additional studies should look at a wide range of structural systems to provide more conclusions on the feasibility of satisfying recovery-based design objectives by designing damage-controlled buildings. Furthermore, future studies should explore the impact of near-fault motions on deformation demands and the probability of achieving recovery objectives.
Conclusion
The seismic performance and associated long-term closure, and in some cases, demolition of capacity-designed RC buildings in recent earthquakes have highlighted the need to incorporate recovery-based performance objectives into future seismic design codes. This study presents a damage-control-oriented seismic design approach for buildings. The key principle of the damage-control-oriented design approach is to reduce the probability of earthquake damage to structural components by limiting the component deformation demands. This approach will provide higher confidence that the building can continue to be occupied following design-level events.
By examining an extensive database of past tests on RC components, it was determined that, provided low-cycle fatigue is not triggered, the onset of lateral-strength loss (LSL) is the limit beyond which safety-critical repair will be required. We propose a methodology to define component deformation limits for structures. These deformation limits are defined such that there is a low probability of exceeding the deformation at the onset of LSL. Subsequently, the proposed methodology was used to define component deformation design limits for RC beams, columns, and walls. For example, for ductile beams, deformation limits of 1%, 1.5%, and 2% correspond to 5%, 10%, and 20% probabilities of exceeding the deformation at the onset of LSL. For comparison, code-minimum story drift ratio limits of 2%–2.5% would result in about 2.5%–3% beam rotation demands, corresponding to 30%–40% probabilities of exceeding the deformation at the onset of LSL.
The adequacy of the proposed component deformation limits is explored through nonlinear response history and recovery analyses (using the ATC-138 methodology) of modern-code (designed per New Zealand standards) and damage-controlled buildings. Four archetype RC frame buildings are designed to different beam rotation limits—1.5%, 2%, 2.5%, and 3%, corresponding to 10%, 20%, 30%, and 40% probabilities of exceeding the deformation at the onset of LSL. Following the proposed approach, the buildings designed to beam rotation limits of 1.5% and 2% are denoted as “damage-controlled” buildings.
Nonlinear response history and fragility analyses of the four buildings showed that the probability of the archetypes requiring safety-critical repair at a design-level event (i.e. 500-year return period) reduces with the design beam rotation limit. The archetype designed to a 3% beam rotation limit has a 26% probability of exceeding the DLS, compared to 16% and 13% estimated for the archetypes designed to beam rotation limits of 2% and 1.5%, respectively.
Finally, recovery analyses using the ATC-138 methodology showed that all four buildings are able to achieve re-occupancy and functional recovery at service-level events (i.e. 50-year and 100-year return periods). However, the downtimes to achieve re-occupancy and functional recovery vary significantly at design-level events. A median downtime of 6 months is required to achieve functional recovery in the archetype designed to a 3% beam rotation limit at the design-level event. However, median results suggest that the two damage-controlled buildings (i.e. designed to beam rotation limits of 1.5% and 2%) are able to achieve immediate functional recovery at design-level demands. The output of nonlinear response history and recovery analyses on the damage-controlled buildings demonstrate that building codes can achieve recovery-based objectives using the proposed component deformation limits without the need for sophisticated recovery analyses. The results of this study suggest that a damage-controlled RC frame building can be defined as one designed for a beam rotation limit of 2% or less, corresponding to an story drift limit of 1.5% or less.
A limitation of the current study is that only four archetypes have been studied. Additional studies should look at a wide range of structural systems to provide more conclusions on the feasibility of satisfying recovery-based design objectives by designing damage-controlled buildings.
Footnotes
Authors’ note
The concepts presented in this article benefited from the collaboration and fruitful discussions with members of the Project Technical Committee of the FEMA-funded Applied Technical Council ATC-145 project.
Declaration of conflicting interests
The author(s) declared no potential conflicts of interest with respect to the research, authorship, and/or publication of this article.
Funding
The author(s) disclosed receipt of the following financial support for the research, authorship, and/or publication of this article: The first author thanks for the funding by the UK Research and Innovation (UKRI) with project reference EP/X023710/1 (MultiVERSE) which partly supported this research.