
Abstract
A new numerical-based fragility relation for cast iron (CI) pipelines with lead-caulked joints subjected to seismic body-wave propagation is proposed in this article. Two-dimensional 1600-m-length finite element models for pipelines buried in sand are developed in OpenSees. Parametric analysis is performed to investigate the influence of various parameters on the damage estimates of the buried pipelines. Numerical analyses are conducted to estimate the repair rates (RR) for CI pipelines subjected to wave propagation. The predictive model for RR is thus developed based on the numerical results and the Gaussian Process Regression approach. The model developed employs four predictor variables, namely, the peak particle velocity and wave propagation velocity along axial direction, the maximum soil shear force per unit length, and the outer diameter of pipelines, exhibiting desirable performance in terms of predictive efficiency and generalization. The performance of the developed relation is compared to several existing fragility relations. The new fragility relation can be used to estimate RR for CI pipelines with lead-caulked joints with outer diameters ranging from 169 to 1554 mm subjected to seismic body-wave propagation.
Keywords
Introduction
Buried cast iron (CI) pipelines are widely distributed in cities to transport natural gas and water (Mazumder et al., 2019; Tien et al., 2023). Due to the relatively low stiffness, the seismic damage of CI pipelines usually occurs at joints, with main failure modes of axial pull-out and crushing under wave propagation or permanent ground deformation (e.g. Nair et al., 2018; O’Rourke and Liu, 2012; Qin et al., 2022; Qin and Wang, 2022; Wu et al., 2022). The joint failures of buried segmented pipelines were observed in many historical earthquakes, such as the 1994 Northridge, the 1995 Kobe, and the 2011 Christchurch earthquakes (Eidinger and Avila, 1999; Jeon and O’Rourke, 2005; O’Rourke et al., 2014). For instance, buried water pipeline systems were severely damaged during the 1995 Kobe earthquake, in which primary pipeline failures occurred at the joints where pipes were pulled apart (e.g. Nair et al., 2018).
Seismic fragility relations are essential for assessing the seismic performance of pipeline networks, which can be used to estimate the expected amount of pipe damage under a given earthquake (e.g. Amaducci et al., 2022; Hou et al., 2022; Huang et al., 2023; Iannacone and Gardoni, 2023). These relations estimate the repair rate, RR (i.e. the number of pipe repairs per kilometer) as a function of ground-motion intensity measure, IM (e.g. peak ground acceleration PGA and peak ground velocity PGV), or ground movement parameter (e.g. peak ground strain, PGS). Specifically, most of the existing fragility relations were developed based on the observed pipe damage instances in past earthquakes (e.g. Bellagamba et al., 2019; Eidinger, 1998; Makhoul et al., 2020; O’Rourke and Deyoe, 2004; Sakai et al., 2017; Tsinidis et al., 2019; Xu et al., 2021). For instance, American Lifelines Alliance (ALA, 2001a) developed a set of PGV-based fragility relations based on the damage data of buried pipelines collected from 12 earthquakes. As described by O’Rourke and Vargas-Londono (2016), there are two main drawbacks for such empirical relations: (1) most of the empirical data correspond to the damage of small-diameter pipelines, and (2) only the effect of shaking-intensity parameters (e.g. PGV or PGS) is considered in these relations, while the influence of some other factors (e.g. burial depth) on the damage estimates remains ambiguous.
On the contrary, a few analytical-based fragility relations have been developed based on mechanistic or numerical models for CI pipelines with lead-caulked joints (e.g. O’Rourke and Vargas-Londono, 2016; Wijaya et al., 2019). For instance, based on simplified mechanical models, the interrelationship between segmented pipe damage and tensile ground strain was investigated by O’Rourke and Vargas-Londono (2016). More recently, based on the beam-on-spring modeling technique, Wijaya et al. (2019) evaluated the effect of earthquake and soil uncertainties on the seismic performance of 150-mm nominal diameter (DN) pipelines.
Table 1 summarizes several fragility relations developed for buried CI pipelines since 2000. To the authors’ knowledge, there is only one numerical-based study for the fragility relations of CI pipelines with lead-caulked joints (Wijaya et al., 2019). As listed in Table 1, this numerical-based model is not applicable to pipelines with DN larger than 150 mm. In addition, the influence of some other parameters (e.g. soil–pipe interaction, burial depth, and pipe diameter) exclusive of IMs on the damage of pipelines has only been investigated via the simplified mechanic approach (i.e. O’Rourke and Vargas-Londono, 2016). Consequently, it is of interest to develop new numerical-based fragility relations, which can not only incorporate the effect of various parameters that could have notable influence on the damage estimates, but also be applicable to moderate-to-large diameter CI pipelines with lead-caulked joints.
Seismic fragility relations for buried CI pipelines developed since 2000
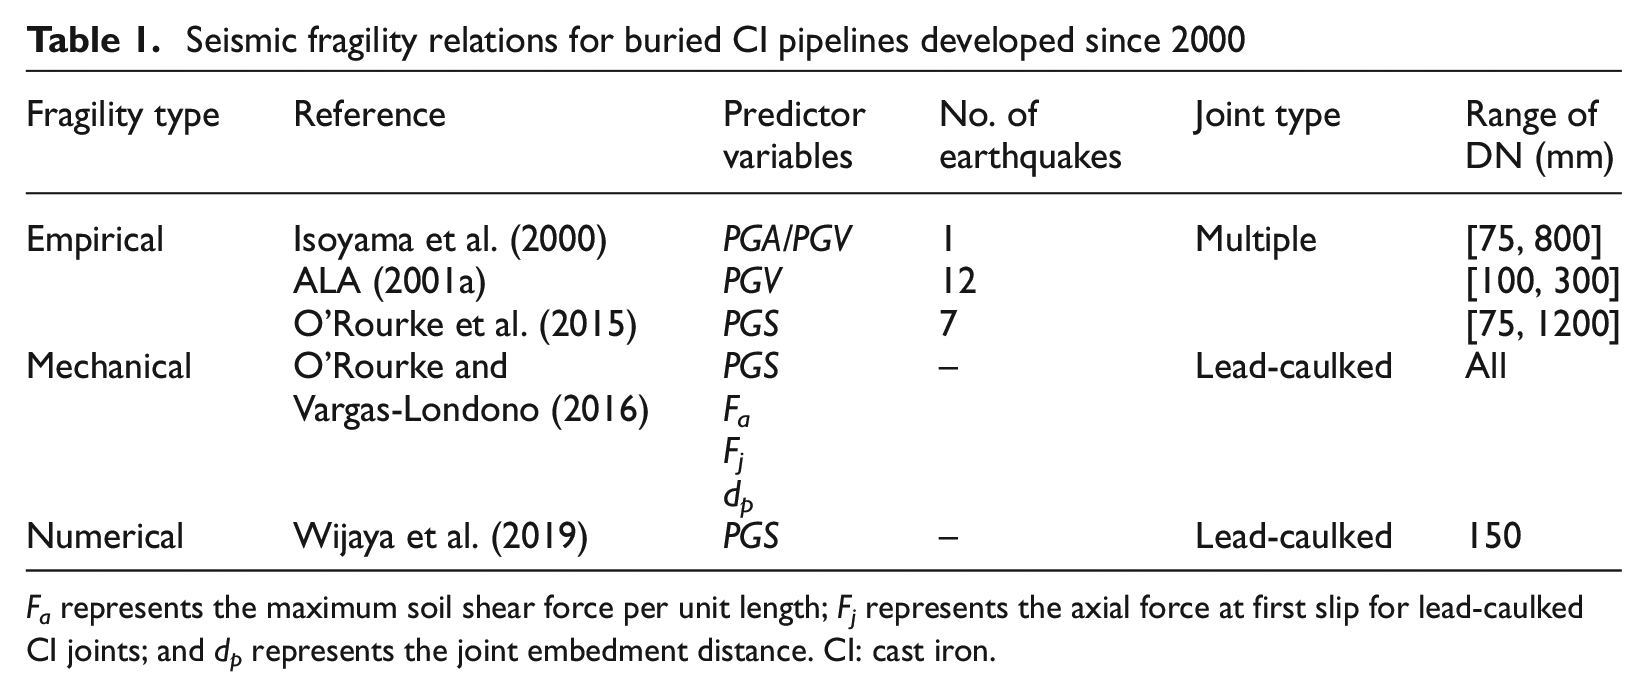
Fa represents the maximum soil shear force per unit length; Fj represents the axial force at first slip for lead-caulked CI joints; and dp represents the joint embedment distance. CI: cast iron.
As the development of artificial intelligence, machine learning (ML) algorithms have been increasingly utilized for solving engineering problems given their robust predictive ability and excellent generalization capability (e.g. Kong et al., 2019; Wang et al., 2020). The ML algorithms are generally capable of characterizing highly nonlinear relationships between predictors and dependent variables, thus exhibiting favorable potential for developing the numerical-based fragility relations for buried pipelines.
This study thus aims at developing a new fragility relation for CI pipelines with lead-caulked joints based on the numerical-based results and ML algorithms. Note that only the pull-out failure mode of segmented pipelines subjected to body-wave propagation is considered in this study. Finite element (FE) models incorporating the variability of joint properties are first introduced and validated against empirical damage data. Parametric analyses are then conducted to scrutinize the influence of various parameters on the RR estimates of buried pipelines. Based on preferable parameters selected, a new predictive model for estimating RR is developed via the Gaussian Process Regression (GPR) approach. The performance of the developed relation is subsequently compared to existing relations. Discussions and conclusions are finally provided.
Numerical modeling
Modeling of lead-caulked CI joints
Following the illustration in Wham et al. (2016), the longitudinal cross-section of a typical lead-caulked joint of CI pipelines is shown in Figure 1. In this study, the multilinear model developed by Wham et al. (2016) as shown in Figure 2a is adopted to describe the relationship between the normalized axial force, F/Fj and the joint opening, Δu for lead-caulked CI joints. A high axial compressive stiffness of such joints is expected after the contact of the bell and the spigot (i.e. negative joint openings). It also shows that under tension circumstances, a multilinear model is utilized to describe the normalized axial force versus positive joint openings. The axial force at first slip, Fj, can be calculated as (Wham et al., 2016) follows:

where Dos is the outer spigot diameter in unit of mm; dL is the lead-caulking depth typically assigned as 57 mm (Wham et al., 2016); and aC represents the CI-lead adhesion. The adhesion aC is generally assumed to be normally distributed with the mean and standard deviation of 1.63 and 0.49 MPa, respectively (Wham et al., 2016).
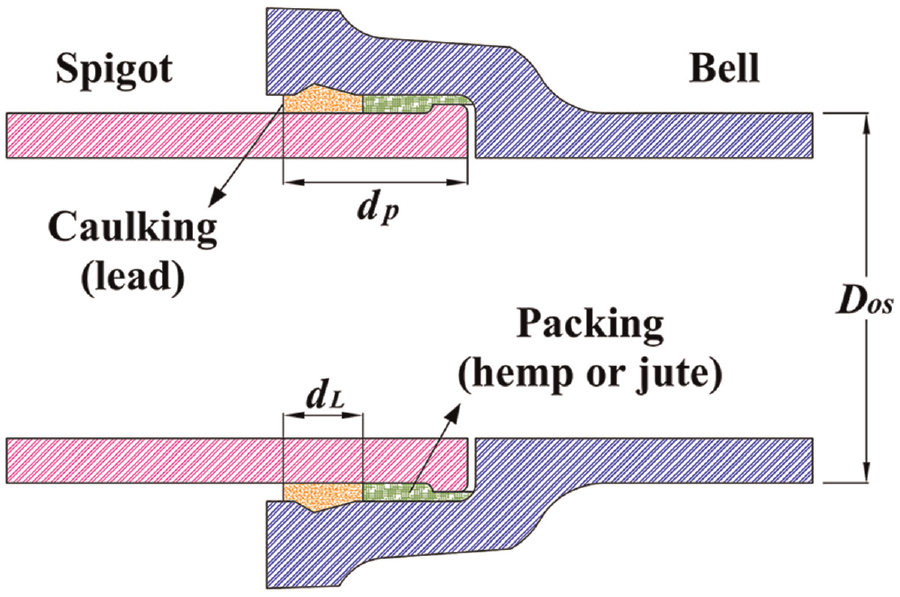
Cross section of a typical lead-caulked CI joint which is plotted following the reference of Wham et al. (2016).
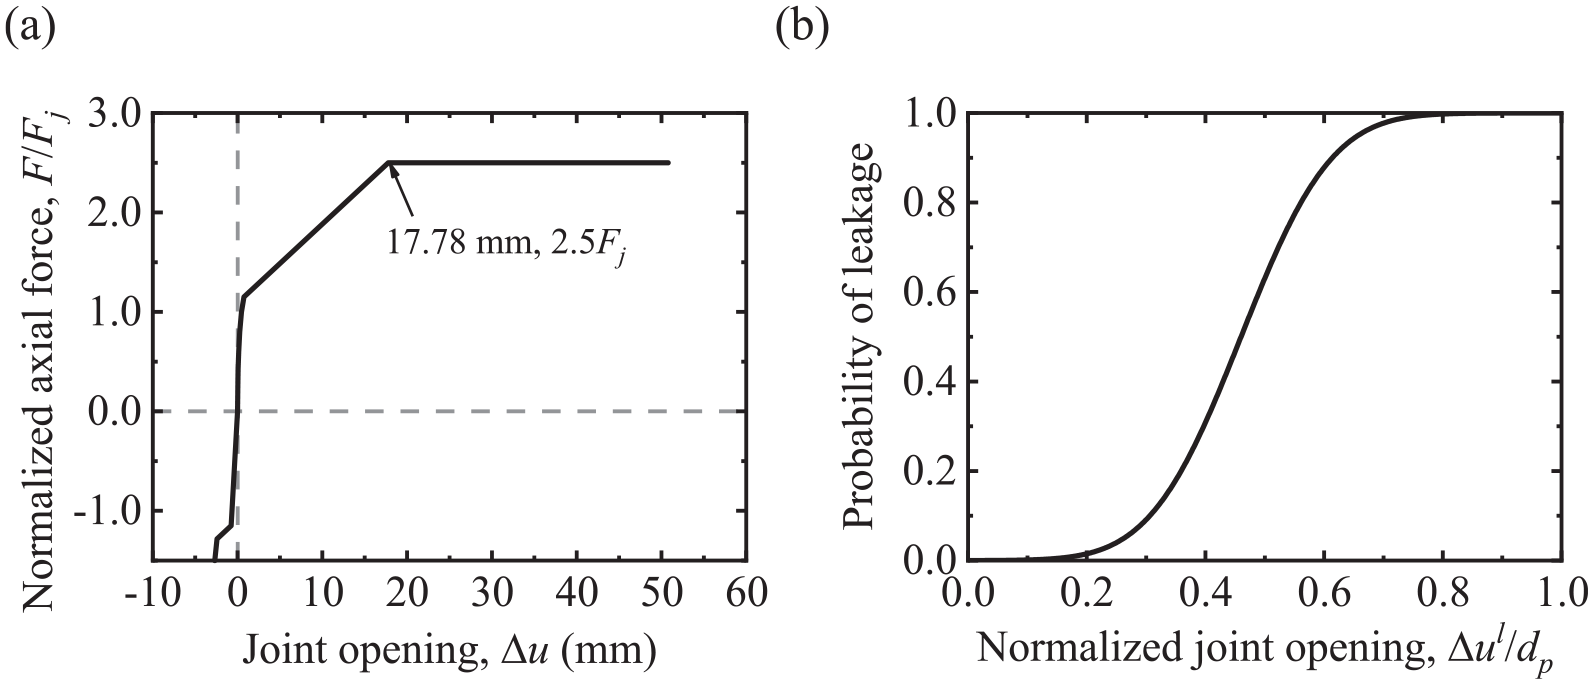
Characteristics of lead-caulked CI joints for (a) normalized axial forces versus joint openings. (b) Probability of leakage versus normalized joint opening Δu l /dp.
In addition, previous studies (e.g. El Hmadi and O’Rourke, 1989) have established a cumulative distribution for pipe leakage versus the normalized joint opening Δu l /dp, in which Δu l denotes the joint opening for leakage, and dp denotes the joint embedment distance as illustrated in Figure 1. Following the suggestion of O’Rourke and Liu (2012), the mean and standard deviation of the Δu l /dp ratios are assigned as 0.45 and 0.13, respectively. The probability of leakage versus the change of Δu l /dp is shown in Figure 2b.
It is noteworthy that the mechanical property of the lead-caulked CI joints greatly depends on the magnitude of two variables, namely, aC and Δu l /dp. In existing studies (e.g. O’Rourke and Vargas-Londono, 2016), it is commonly assumed that the two variables are perfectly correlated. Therefore, truncated normal distributions are considered for aC and Δu l /dp to avoid negative values for the sampling of the joints, in which a perfect correlation between aC and Δu l /dp is applied. The other parameters such as dL are considered as deterministic when modeling the joints in the subsequent analysis.
Finite element models
Figure 3 shows the schematic of the FE models for buried CI pipelines with lead-caulked joints. The FE models are developed in OpenSees (Mazzoni et al., 2006) to simulate the performance of buried pipelines suffering seismic-wave propagation. The elastic beam-column element is utilized to model pipe barrels with the corresponding elastic modulus, mass per unit length, and cross-sectional area assigned. The zero-length element is utilized to account for the stiffness of joints and soil–pipe interaction. Specifically, the stiffness of the joints is characterized by the nonlinear axial force–joint opening relationship as shown in Figure 2a.
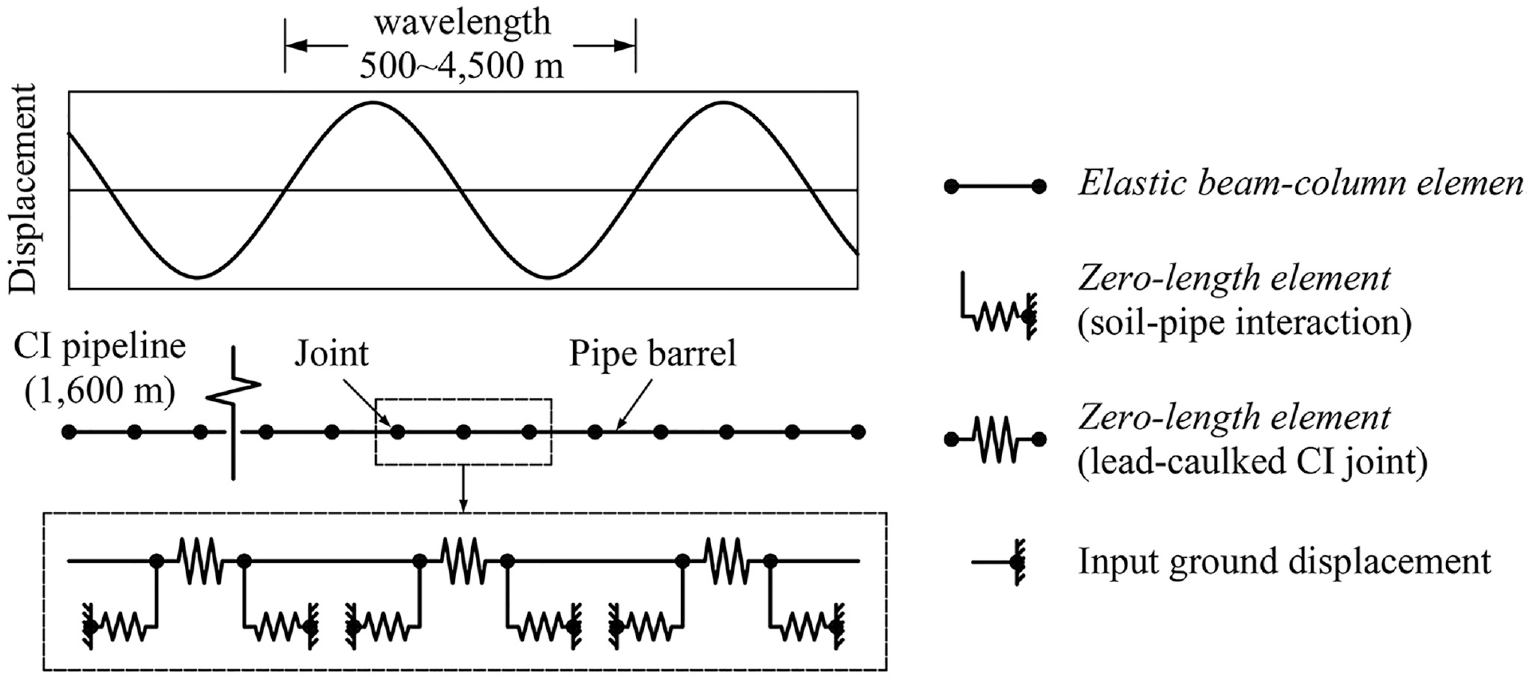
Schematic of the FE model for buried CI pipelines with lead-caulked joints.
A bilinear relationship shown in Figure 4 is adopted to characterize the soil–pipe interaction. Following ALA (2001b), the relative soil–pipe displacement, ua, is assigned as 3 mm for pipelines buried in dense sand. The maximum shear force per unit length, Fa, can be calculated as (ALA, 2001b) follows:

in which α is adhesion factor; γ, c, and ϕ represent the unit weight (kN/m3), cohesion (kPa), and friction angle of soils, respectively; d is the burial depth from ground surface to the top layer of pipelines (m); K0 is the at-rest earth pressure coefficient; and f is friction factor. Water is assumed to move together with the pipeline without significant sloshing effect when subjected to seismic-wave propagation (e.g. Zhong et al., 2017).
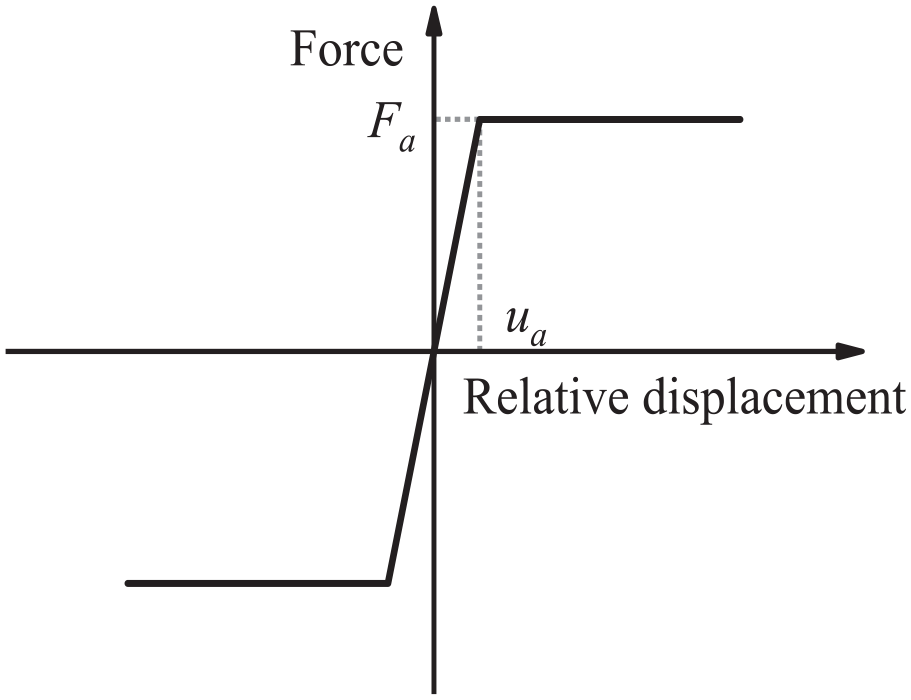
Relationship of axial force and relative displacement for soil–pipe interaction.
The total length of the buried pipeline to be modeled is 1600 m, in which the length of each pipe segment is assigned as 6 m in this study. Since buried pipelines are primarily affected by seismic-wave propagation in the axial direction only (e.g. O’Rourke and Liu, 2012), the axial movement of the pipeline is thus freed to apply the ground displacement. Seismic waves are simplified as sinusoidal waves, which propagate along the pipeline with a time lag. The time lag can be calculated as (e.g. Shi, 2015; Shi and O’Rourke, 2008; Wang and O’Rourke, 2008) follows:

where Xa is the distance between two nodes for the input of ground displacement (m), and Ca is the apparent wave propagation velocity (m/s). The ground displacement imposed on the nth node at time t can be calculated as (Shi, 2015) follows:

where Va is the peak particle velocity along the pipe’s axial direction (cm/s), T is the period of input waves (s), and Δtn represents the time lag of the wave propagation for the nth node.
The openings of these joints are recorded for each wave propagation analysis. If the calculated joint opening, Δu, is greater than or equal to Δu l (i.e. the joint opening corresponding to leakage), this joint is considered as damaged, whereas the joint is safe for Δu < Δu l . Consequently, the number of damaged joints, Numd, is calculated as follows:

where I (Δu ≥ Δu l ) equals 1 if it is true, and 0 otherwise; N represents the number of joints included in the middle 1000 m of the pipeline.
Validation of the FE models
The performance of the FE models introduced above is validated against the empirical data of pipe damage caused by seismic-wave propagation. The empirical pipe damage data were compiled by O’Rourke et al. (2015). The parameters characterizing the seismic-wave and pipeline properties adopted in the FE models are listed in Table 2, which are identical to those values adopted in the studies of O’Rourke et al. (2015) and O’Rourke and Vargas-Londono (2016).
Parameters assigned in the FE models for validation purpose
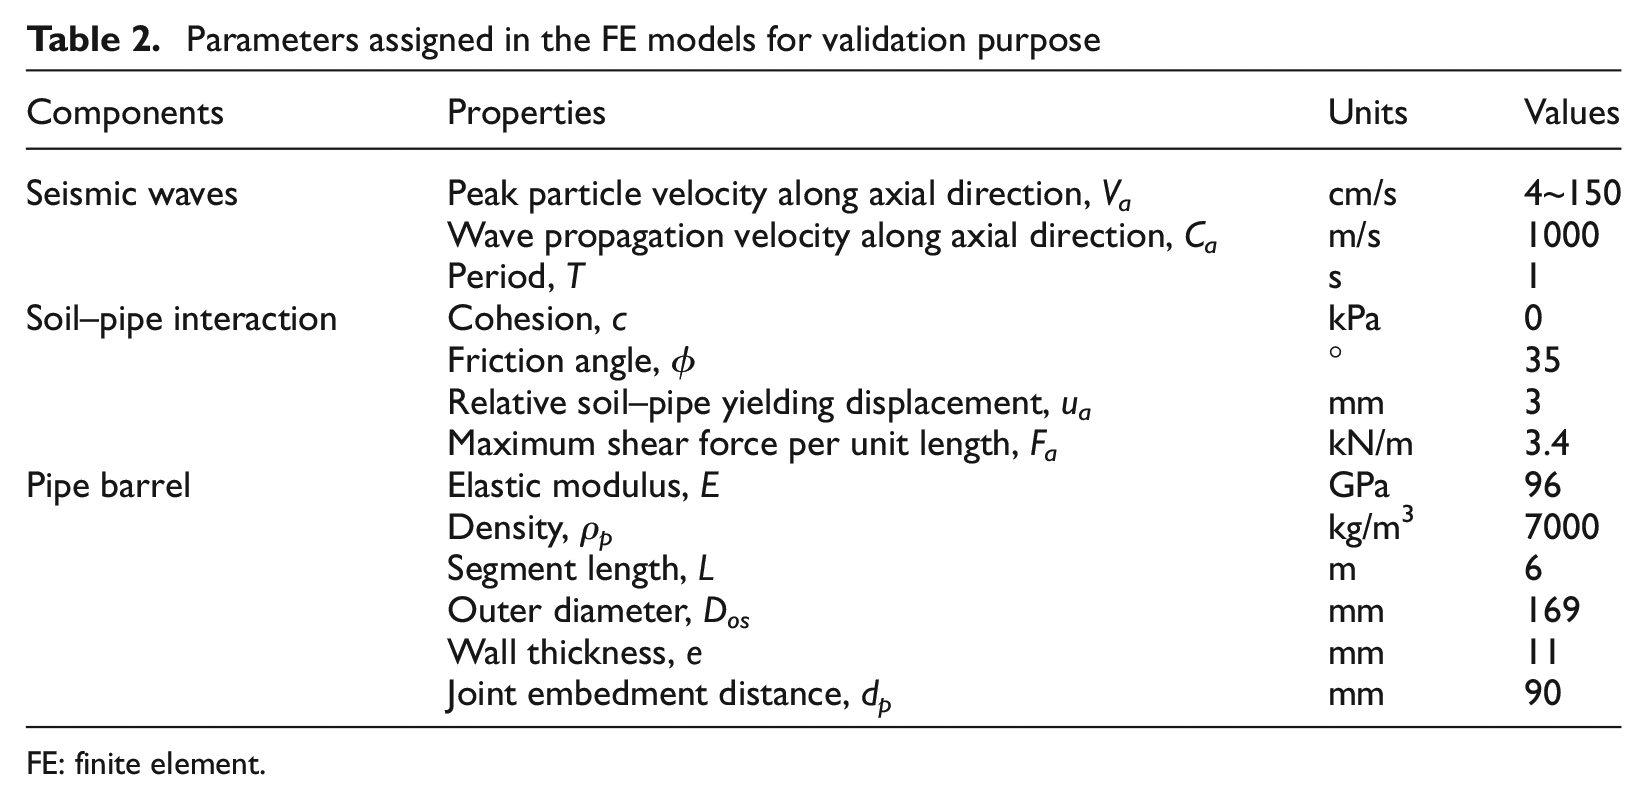
FE: finite element.
For each Va value assigned, 1000 FE models for the pipeline are generated based on the parameters assigned in Table 2. Each of the 1600-length pipeline models contains 267 joints, in which these joints exhibit different properties given the samplings of aC and Δu l /dp as introduced in the “Modeling of lead-caulked CI joints” section. The Numd value is thus calculated for each FE model based on Equation 5, and the repair rate (i.e. RR) is obtained by calculating the averaged Numd for the 1000 FE models.
The peak ground strain PGS is calculated as (Zhong et al., 2018) follows:

where the parameters of Va and Ca are defined as above. The Ca value is assigned as 1000 m/s herein following the suggestions of O’Rourke (2009) and O’Rourke et al. (2015). By varying the Va magnitudes, a set of PGS values are simulated to represent various shaking intensities. Figure 5 illustrates the calculated RR data versus PGS based on the FE models developed, as compared to the empirical RR data reported by O’Rourke et al. (2015). It clearly shows that the numerical-based results match reasonably well with the empirical data, thus validating the rationality of the FE models developed.
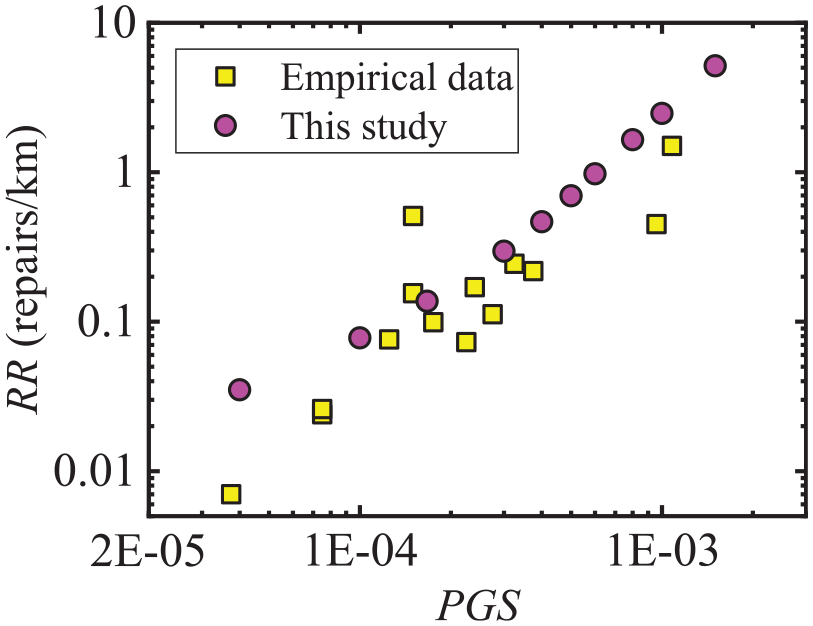
Comparison of the numerical and empirical RR versus PGS for buried pipelines.
Parametric analysis
Taking the CI pipelines with lead-caulked joints buried in sand as the demonstrated example, parametric analysis is conducted to examine the influence of various parameters on the magnitude of RR in this section. Given the fact that the soil strength parameters (c, ϕ) and d mainly affect the magnitude of the soil–pipe interaction, the influence of Fa, rather than these separate soil- and depth-related parameters, on the magnitude of RR is thus investigated herein. The ua value is assigned as 3 mm for the pipelines associated with sand backfills (ALA, 2001b). In addition, three parameters (Va, Ca, and T) representing the characteristics of sinusoidal waves and two parameters (Dos and E) representing the pipeline properties are also considered. Therefore, the parameters employed in the parametric analysis include Fa, Va, Ca, T, Dos, and E, with their definitions listed in Table 2.
Ranges of the parameters assigned
To conduct sensitivity analysis, the ranges of the parameters considered need to be first determined. The influence of pipe diameter is considered particularly important, since empirical diameter modification factors are commonly used and summarized by O’Rourke and Vargas-Londono (2018). In this study, the values of Dos are considered in the range of 169 and 1554 mm, corresponding to the DN values in the range of 150 and 1500 mm.
According to Equation 2, the Fa magnitude is determined by Dos, d, and the soil strength parameters. The parameter d is generally associated with Dos, namely, a larger Dos corresponds to a deeper d in engineering practice. For each Dos case, the typical range of d, as well as the values of e and dp considered, is determined according to the National Standard of China (GB/T 3420, 2008). All these parameters assigned are summarized in Table 3. In addition, based on the reference of Chang and Zhang (2007), the values of γ, c, and ϕ for sand generally range from 18.6 to 20.1 kN/m3, 0 to 5 kPa, and 28° to 42°, respectively. Based on the ranges of d, γ, c, and ϕ assigned, the minimum, median, and maximum values of Fa for each Dos case of pipelines buried in sand are calculated and listed in Table 3. In addition, the E values are considered ranging from 75.8 to 128 GPa based on an existing study (Wham et al., 2016).
Parameters assigned for CI pipelines buried in sand with different Dos
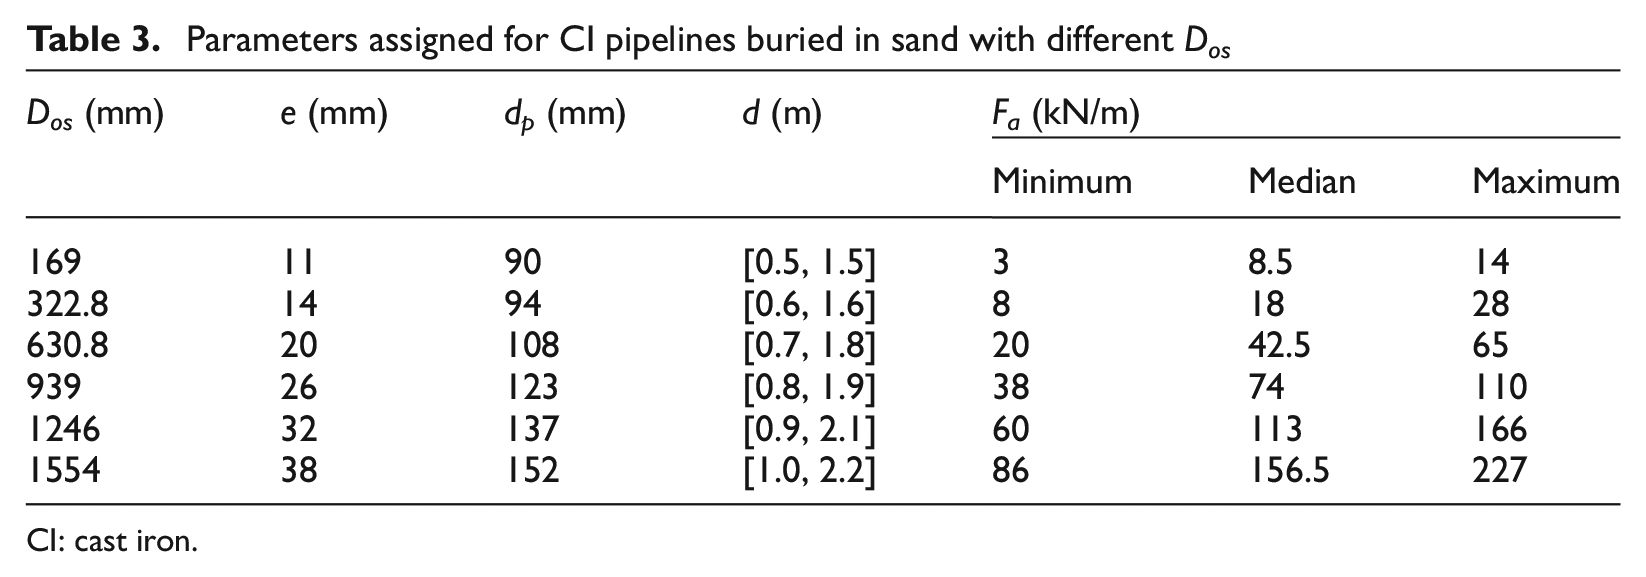
CI: cast iron.
The Va values considered are in the range of 10 to 200 cm/s, representing a wide range of seismic shaking intensities. To estimate ground strains, the Ca values are generally considered within the range of 1000 to 3000 m/s for body waves (e.g. Wang and O’Rourke, 2008). A range of 1000 to 3000 m/s is thus considered for Ca in this study. The T values range from 0.5 to 1.5 s, representing various frequency characteristics of input waves.
Sensitivity analysis
Sensitivity analysis is conducted to examine the relative influence of these parameters on the magnitude of RR. When one specific parameter is perturbed within the assigned range, the values of the other five parameters are considered as deterministic. The baseline values of Va, Ca, T, Dos, and E are assigned as 100 cm/s, 2000 m/s, 1 s, 939 mm, and 96 GPa, respectively. The baseline values of Fa are Dos-dependent; for each Dos case, the median value of Fa listed in Table 3 is assigned for the pipelines.
Figure 6 illustrates the tornado diagram of RR with respect to the six parameters for the buried pipelines. It shows that the magnitude of RR is significantly influenced by Va, Ca, Fa, and Dos, whereas the influences of E and T are generally negligible. It is not surprising that Va, the shaking-intensity parameter, has a predominate effect on RR. The magnitude of RR decreases dramatically with the increase of Ca; this is because increasing Ca yields a reduction of PGS and therefore a reduced number of damaged joints. Moreover, for given PGS, deeper burial depths or stronger soils correspond to larger Fa values, and such greater soil–pipe interaction results in a lower RR. In addition, RR decreases with increasing Dos. The notable influence of Dos on the magnitude of RR can be explained as follows: (1) the pipeline with larger Dos corresponds to a larger dp, thus resulting in a reduced probability of leakage, and (2) the magnitude of Fa increases with Dos, which is also conducive to reduce RR. These observations above corroborate the findings of O’Rourke and Vargas-Londono (2016). Moreover, the low influence of T indicates that the dynamic response of buried CI pipelines could be approximately captured by a pseudo-static analysis. The low influence of E indicates that the pipe stiffness plays a negligible role in the magnitude of RR, whereas the seismic capacity of CI pipelines is greatly influenced by the joint stiffness and strength properties.
Tornado diagram of RR for CI pipelines buried in sand.
Based on the sensitivity results obtained, the four parameters, namely, Va, Ca, Dos, and Fa, should be considered as preferable predictor variables for developing the ML-based fragility relation.
Fragility relation for buried CI pipelines with lead-caulked joints
Numerical analyses conducted
A number of numerical analyses are conducted herein to generate an adequate data of RR. Several discrete values are considered for the parameters of Va, Ca, Dos, and Fa. Specifically, six typical Dos values, namely, 169, 322.8, 630.8, 939, 1246, and 1554, are considered in the FE modeling process. For each Dos case, seven Va values (10, 30, 60, 90, 120, 160, and 200 cm/s) and five Ca values (1000, 1500, 2000, 2500, and 3000 m/s) are considered to represent a wide range of ground strains. For each Dos case, six evenly distributed Fa values within the specified range as listed in Table 3 are further considered. The magnitude of ua is assigned as 3 mm. In addition, the values of E, T, and L are considered as deterministic, with the assigned values of 75.8 GPa, 1 s, and 6 m, respectively.
Consequently, 1260 scenarios (6 Dos× 7 Va× 5 Ca× 6 Fa) are modeled to simulate the performance of buried CI pipelines subjected to seismic body-wave propagation. In each scenario, 1000 FE models are developed to represent the variability of joint properties along the longitudinal direction, and the RR value is obtained based on the procedure introduced in the “Numerical modeling” section. A few unreliable data are removed, which are caused by numerical non-convergence cases where excessive Va (e.g. 200 cm/s) is assigned. The total number of the RR data collected is 1248.
Predictive model
Gaussian process regression (GPR) is one of the commonly used ML algorithms, which is capable of solving highly nonlinear regression problems (Rasmussen and Williams, 2006). It is a non-parametric, probabilistic approach, exhibiting an advantage in small-sample modeling and uncertainty estimation of target variables. In this study, the GPR approach is utilized to develop the fragility relation for CI pipelines with lead-caulked joints. The aforementioned four parameters (i.e. Va, Ca, Dos, and Fa) are taken as predictor variables, while the natural logarithms of the calculated RR, that is, ln(RR), are taken as the target variable. Eighty percent of the whole data set is randomly divided for training, while the rest of the data set is used for testing. The five-fold cross-validation approach is employed to avoid over-fitting. Given the prior information and hyper-parameters adopted, as well as a set of training data, the testing target variables

where
The GPR-based model developed predicts the statistical distribution of ln(RR) as a function of Va, Ca, Dos, and Fa. Figure 7 plots the predicted median RR data versus the observed data for both the training and testing data sets for the developed model. It clearly shows that both the training and testing data sets are closely distributed along the 1:1 line, indicating good predictive performance of the developed model. Two commonly used statistical metrics, namely, coefficient of determination (R2) and root mean square error (RMSE), are employed to evaluate the overall predictive efficiency of the developed model. The R2 and RMSE scores for both the training and testing data sets (in the arithmetic rather than logarithmic scale) are summarized in Table 4. Both R2 scores are larger than 0.997, and the RMSE scores are 0.037 and 0.073 for the training and testing data sets, respectively. The obtained larger-than-0.997 R2 scores indicate that the proposed model exhibits excellent performance in terms of predictive efficiency and generalization.
Distribution of the predicted median RR with respect to the observed RR.
Statistical metric results for the developed GPR-based model
GPR: Gaussian Process Regression; RMSE: root mean square error.
Figure 8 shows the scalings of the predicted median RR versus Ca, Fa, and Dos, respectively. As expected, the predicted medians increase with increasing Va and gradually decrease as increasing the magnitude of Ca, Fa, and Dos. The results indicate that the developed model can properly account for the influences of Va, Ca, Dos, and Fa on the damage estimates of buried CI pipelines under various scenarios. Figure 9 further illustrates the scalings of the predicted standard deviations of ln(RR) versus Ca, Fa, and Dos, respectively. It shows that the logarithmic standard deviations are generally insensitive to the change of these parameters. All the predicted standard deviations are approximately 0.06.
Predicted median RR with respect to Ca, Fa, and Dos, respectively. The values of other predictor variables considered in these plots are (a) Dos = 939 mm, Fa = 74 kN/m. (b) Ca = 2000 m/s, Dos = 939 mm. (c) Ca = 2000 m/s, and Fa is assigned as the median value of each Dos case.
Predicted standard deviations of ln(RR) with respect to Ca, Fa, and Dos, respectively. The magnitude of Va is assigned as 100 cm/s, and the other predictor variables in these plots are (a) Dos = 939 mm, Fa = 74 kN/m. (b) Ca = 2000 m/s, Dos = 939 mm. (c) Ca = 2000 m/s, and Fa is assigned as the median value for each Dos case.
Residual analysis
Figure 10 illustrates the distribution of residuals (i.e. observed data minus predicted data in the arithmetic scale) with respect to the observed RR for the predictive model. The whole data are evenly divided into several bins. The local means as well as the 95% confidence intervals for the binned residuals are also displayed in each plot. It is observed that most of the local means are close to zero; there are few slightly biased local means for relatively large RR values, which is not surprising because the residuals are calculated in the arithmetic scale rather than the logarithmic scale. In general, the residuals of the developed model are unbiased over the whole observed RR range. This observation, again, reflects the accuracy of the developed model in predicting RR for buried CI pipelines with lead-caulked joints subjected to seismic body-wave propagation.
Distribution of residuals with respect to observed RR for the predictive model.
Comparison with existing fragility relations
The performance of the developed model is compared with existing fragility relations in this section. Two empirical fragility relations developed by ALA (2001a) and O’Rourke et al. (2015), and the analytical fragility relation developed by O’Rourke and Vargas-Londono (2016), termed as ALA01, RFU15, and RV16 relations, respectively, are considered herein. The predicted medians of RR for the new relation with respect to Va for pipelines with DNs of 150 and 300 mm are compared to those of the other relations and illustrated in Figure 11a and b, respectively. The input values of Ca and Fa are displayed in each plot. Figure 11 indicates that the predictive curves of the developed model are broadly consistent with the three existing relations. Specifically, it shows that the predictions of the RV16 model are generally smaller than those of this study in the moderate-to-large Va range, which might be caused by the different configurations in the analytical processes of both studies. Moreover, compared to the empirical-based relations, one distinguishing feature of the new model is the incorporation of Ca, Dos, and Fa as predictor variables, thus quantitatively reflecting the effect of these factors on the damage estimates of buried pipelines.
Comparison of the proposed fragility relation with the other fragility relations for pipelines with DNs of (a) 150 mm and (b) 300 mm, respectively. For the RV16 relation, Ca is assigned as 2 km/s, and Fa are assigned as 8 and 18 kN/m for pipelines with DNs of 150 and 300 mm, respectively.
In engineering applications, modification factors have been commonly used to characterize the diameter effect on the damage estimates of buried pipelines. O’Rourke and Vargas-Londono (2018) summarized the existing diameter modification factors reported by various researchers (e.g. ALA, 2001a; Honegger, 1995; Kubo et al., 1979; Okumura and Shinozuka, 1991; O’Rourke and Jeon, 1999). With specific values of Va, Ca, and Fa, the diameter modification curve versus pipeline diameter can be obtained based on the developed relation of this study. Figure 12 compares the derived diameter modification curve with the discrete modification factors suggested by various researchers. Note that the input values of Va and Ca for estimating the modification curve are 100 cm/s and 2000 m/s, respectively. It shows that the diameter modification curve obtained by the developed model matches the discrete data reasonably well. Such consistent trend further indicates desirable performance of the fragility relation developed.
Comparison of the diameter modification curve developed with existing modification factors in the literature.
Discussion
The fragility relation developed for buried CI pipelines with lead-caulked joints subjected to seismic body-wave propagation can be incorporated into the framework of probabilistic seismic pipe damage risk assessment (e.g. Wang et al., 2010). First, based on the probabilistic seismic hazard analysis (PSHA), the mean annual rate density of PGV, MRD PGV (y), at a given site can be estimated as (Baker, 2008; Du and Wang, 2014, 2016) follows:

where λ0 is the activity rate of a given earthquake source; fM (m) and fR (r) are probability density functions for magnitude m and distance r; and
Similarly, the mean annual rate density of RR,
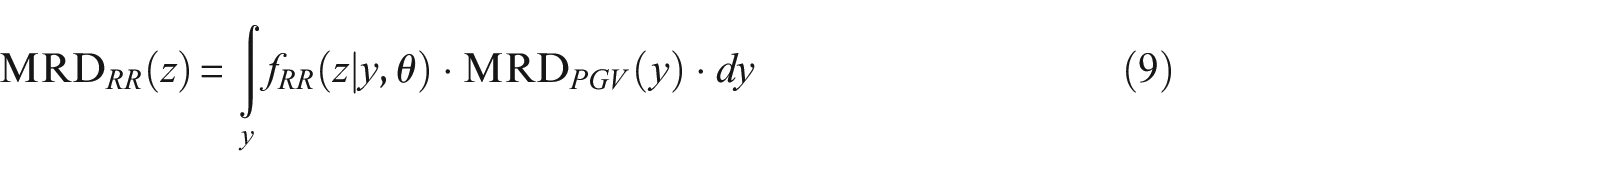
in which
Therefore, based on the PSHA result for PGV, the fragility relation developed, as well as specific pipeline information, the probabilistic seismic damage risk assessment of pipelines can be conducted. The risk-based results can aid in assessing the seismic risk of a pipeline system.
Conclusion
This article presented a new numerical-based fragility relation for buried cast iron pipelines with lead-caulked joints subjected to seismic body-wave propagation. Two-dimensional FE models for buried pipelines incorporating the variability of joint properties were developed in OpenSees. The rationality of the FE models was validated based on the empirical pipe damage data compiled by O’Rourke et al. (2015). Parametric analysis was conducted to investigate the influence of various parameters on the magnitude of RR. Sensitivity results indicated that the parameters of Fa, Va, Ca, and Dos have a notable effect on the magnitude of RR, while the influences of E and T are generally negligible.
More than 1000 scenario-based analyses were thus conducted based on various combinations of Fa, Va, Ca, and Dos. Predictive model for estimating RR was subsequently developed based on the GPR approach, in which the four parameters of Fa, Va, Ca, and Dos were taken as predictor variables. The calculated R2 values for both the training and testing data sets are greater than 0.997, demonstrating desirable performance in terms of predictive efficiency and generalization for the relation developed. The performance of the developed relation was compared to several existing fragility relations.
The fragility relation developed is applicable to CI pipelines with lead-caulked joints buried in sand with Dos values ranging from 169 to 1554 mm, subjected to earthquake scenarios with Va ranging from 10 to 200 cm/s and Ca values ranging from 1000 to 3000 m/s. With the four input variables provided, the mean and standard deviation of logarithmic RR can be easily obtained. Compared to existing empirical-based relations, the key feature of the new relation is that the influences of the parameters of Ca, Dos, and Fa on the damage estimates of buried pipelines are properly accounted for, thus arguably providing a wider range of engineering applications.
Footnotes
Declaration of conflicting interests
The author(s) declared no potential conflicts of interest with respect to the research, authorship, and/or publication of this article.
Funding
The author(s) disclosed receipt of the following financial support for the research, authorship, and/or publication of this article: The work reported in this paper was supported by the National Natural Science Foundation of China (Grant Nos. U2240211 and 52078393) and the Fundamental Research Funds for the Central Universities (No. 2042023kfyq03).