
Abstract
One option to retrofit reinforced concrete (RC) frames is the construction of infill walls. Infill increases lateral strength and stiffness but tends to reduce drift capacity relative to bare frames. Few studies have quantified the reductions in drift demand attributable to infills prior to failure. This report summarizes data from experiments designed to compare drift demands of frames with and without infill. Included data come from two experimental programs completed at Purdue University which focused on the in-plane dynamic response of reduced-scale, non-ductile RC frames to uniaxial simulated earthquake ground motions. 254 dynamic tests were conducted on bare frames, frames with masonry infill walls, and frames with timber infill walls. In 11 of 14 test series, active confinement was applied to columns using external post-tensioned reinforcement. The complete dataset is open-access online on Zenodo, DOI: 10.5281/zenodo.6954967.
Keywords
Introduction
Damage to low-rise concrete buildings has been recorded after strong ground motions. In most cases, damage levels could have been predicted based on assessments of possible structural weaknesses, including captive columns and soft stories. A simple procedure to identify possibly unsafe buildings is to rank structures based on ratios of column and infill wall cross-sectional areas to floor area. Results of the methods proposed by Shiga (1977) and Hassan and Sozen (1997) applied to buildings with infill after major earthquakes in Peru in 2007 (Sim et al., 2015), Taiwan in 2016 (NCREE and Purdue, 2016), and Ecuador in 2016 (Sim et al., 2016) suggest that structures with more vertical elements, especially structural or infill walls, are less likely to be severely damaged.
Both laboratory data (Lee and Woo, 2002) and field evidence support the idea that infill walls strengthen and stiffen structures, resulting in reductions in drift demand and damage. Masonry infill walls, varying by type of masonry unit and mortar, have been extensively studied. In one of its most vulnerable forms, unreinforced masonry infill is constructed using clay bricks with voids and non-structural cement mortar. The performance of this masonry wall construction was studied by Monical (2021). An alternative and less researched infill can be constructed from timber panels. Timber panels used as infill walls may be more available, affordable, and sustainable than masonry construction in regions of the world with abundant wood. Timber sheathing panels are commonly used to resist lateral loads in light-frame construction but had not been explored as an infill in reinforced concrete (RC) frames. The behavior of plywood panel infill walls was studied by Kerby (2022).
The primary disadvantage of infills is a reduction in drift capacity associated with their interaction with the surrounding structure (Baran and Sevil, 2010; Han and Lee, 2020; Kakaletsis and Karayannis, 2008; Maidiawati and Sanada, 2017). For an infill to be an effective seismic retrofit, the reduction in drift demands associated with constructing the infill must outweigh the loss of drift capacity. One way to achieve this balance is to apply external post-tensioned reinforcement (clamps) on columns to provide active transverse confinement and increase the drift capacity of an infilled frame. Yamakawa et al. (2000) and Skillen (2020) reported that drift capacities of columns retrofitted with post-tensioned transverse reinforcement were as large or larger than the drift capacity of elements with comparable conventional ties. Active confinement did not, and was not expected to, increase column flexural stiffness (Monical, 2021). While infill can exist as partitions or non-structural elements, the tests described here evaluated the performance of infill as a seismic retrofit as described in FEMA 547 (2006). The dataset quantifies the drift demands of frames of varying damage states, being bare or retrofitted with infill or active confinement.
This document presents a complete dataset from two experimental programs that studied the dynamic, in-plane response of approximately one-third scale RC frames with full-height infills and active external column confinement. Out-of-plane accelerations of the frames and infills were recorded, but only those resulting from the in-plane response. Out-of-plane actions recorded were generally negligible, such that the test setup can be idealized as a 2D planar frame constructed parallel to the direction of ground motion. Few previous experiments quantified the reduction in drift demands associated with infill construction. The dataset provides reference for the analytical modeling of the dynamic behavior of infill walls during earthquakes of varying intensities. The dataset also provides reference from which the damage states and residual stiffnesses of infilled frames could be estimated after sustaining drift demands not resulting in structural failure. As dynamic tests of timber infill walls had not previously been performed, new insight is provided into their performance as a seismic retrofit, parallel to the rapidly expanding timber construction industry (Woodworks, 2022). Finally, the dataset quantifies the dynamic response of frames with active external confinement of columns, a retrofit that has been field-deployed in Japan (Ishibashi et al., 2004). Retrofit performance can be compared for pristine or damaged RC frames, providing a relative sense of retrofit performance without extrapolation. This work first describes the test design and construction, then instrumentation and ground-motion selection. Next, a method providing context for the test dynamics is explained. Finally, the dataset contents are explained. The dataset is open access at DOI: 10.5281/zenodo.6954967.
Test specimens and setup
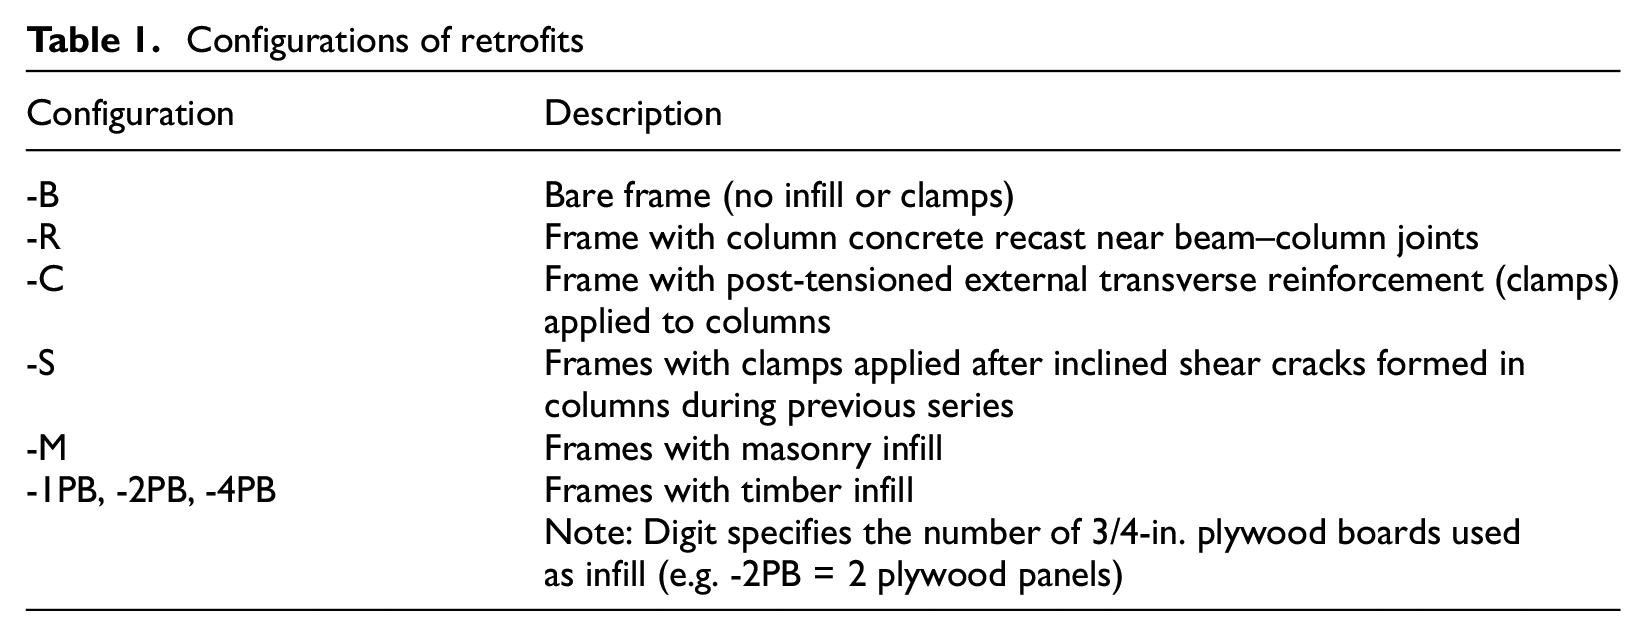
The experimental programs were broken into 14 total test series, consisting of a single RC frame being subjected to multiple base motions. A single simulation of a base motion during a given test series was named a “run.” There were 254 runs in total. Two single-bay, single-story RC test frames were constructed. Frame 1 was used in five test series and Frame 2 in nine test series. Each test series used only one frame. Frame columns were repaired between test series and new retrofits applied. Retrofit configurations are described in Table 1. Series names, frame initial conditions, records simulated, and retrofits in the 14 series are listed in Table 2.
Configurations of retrofits
Sequential test series descriptions and peak response values
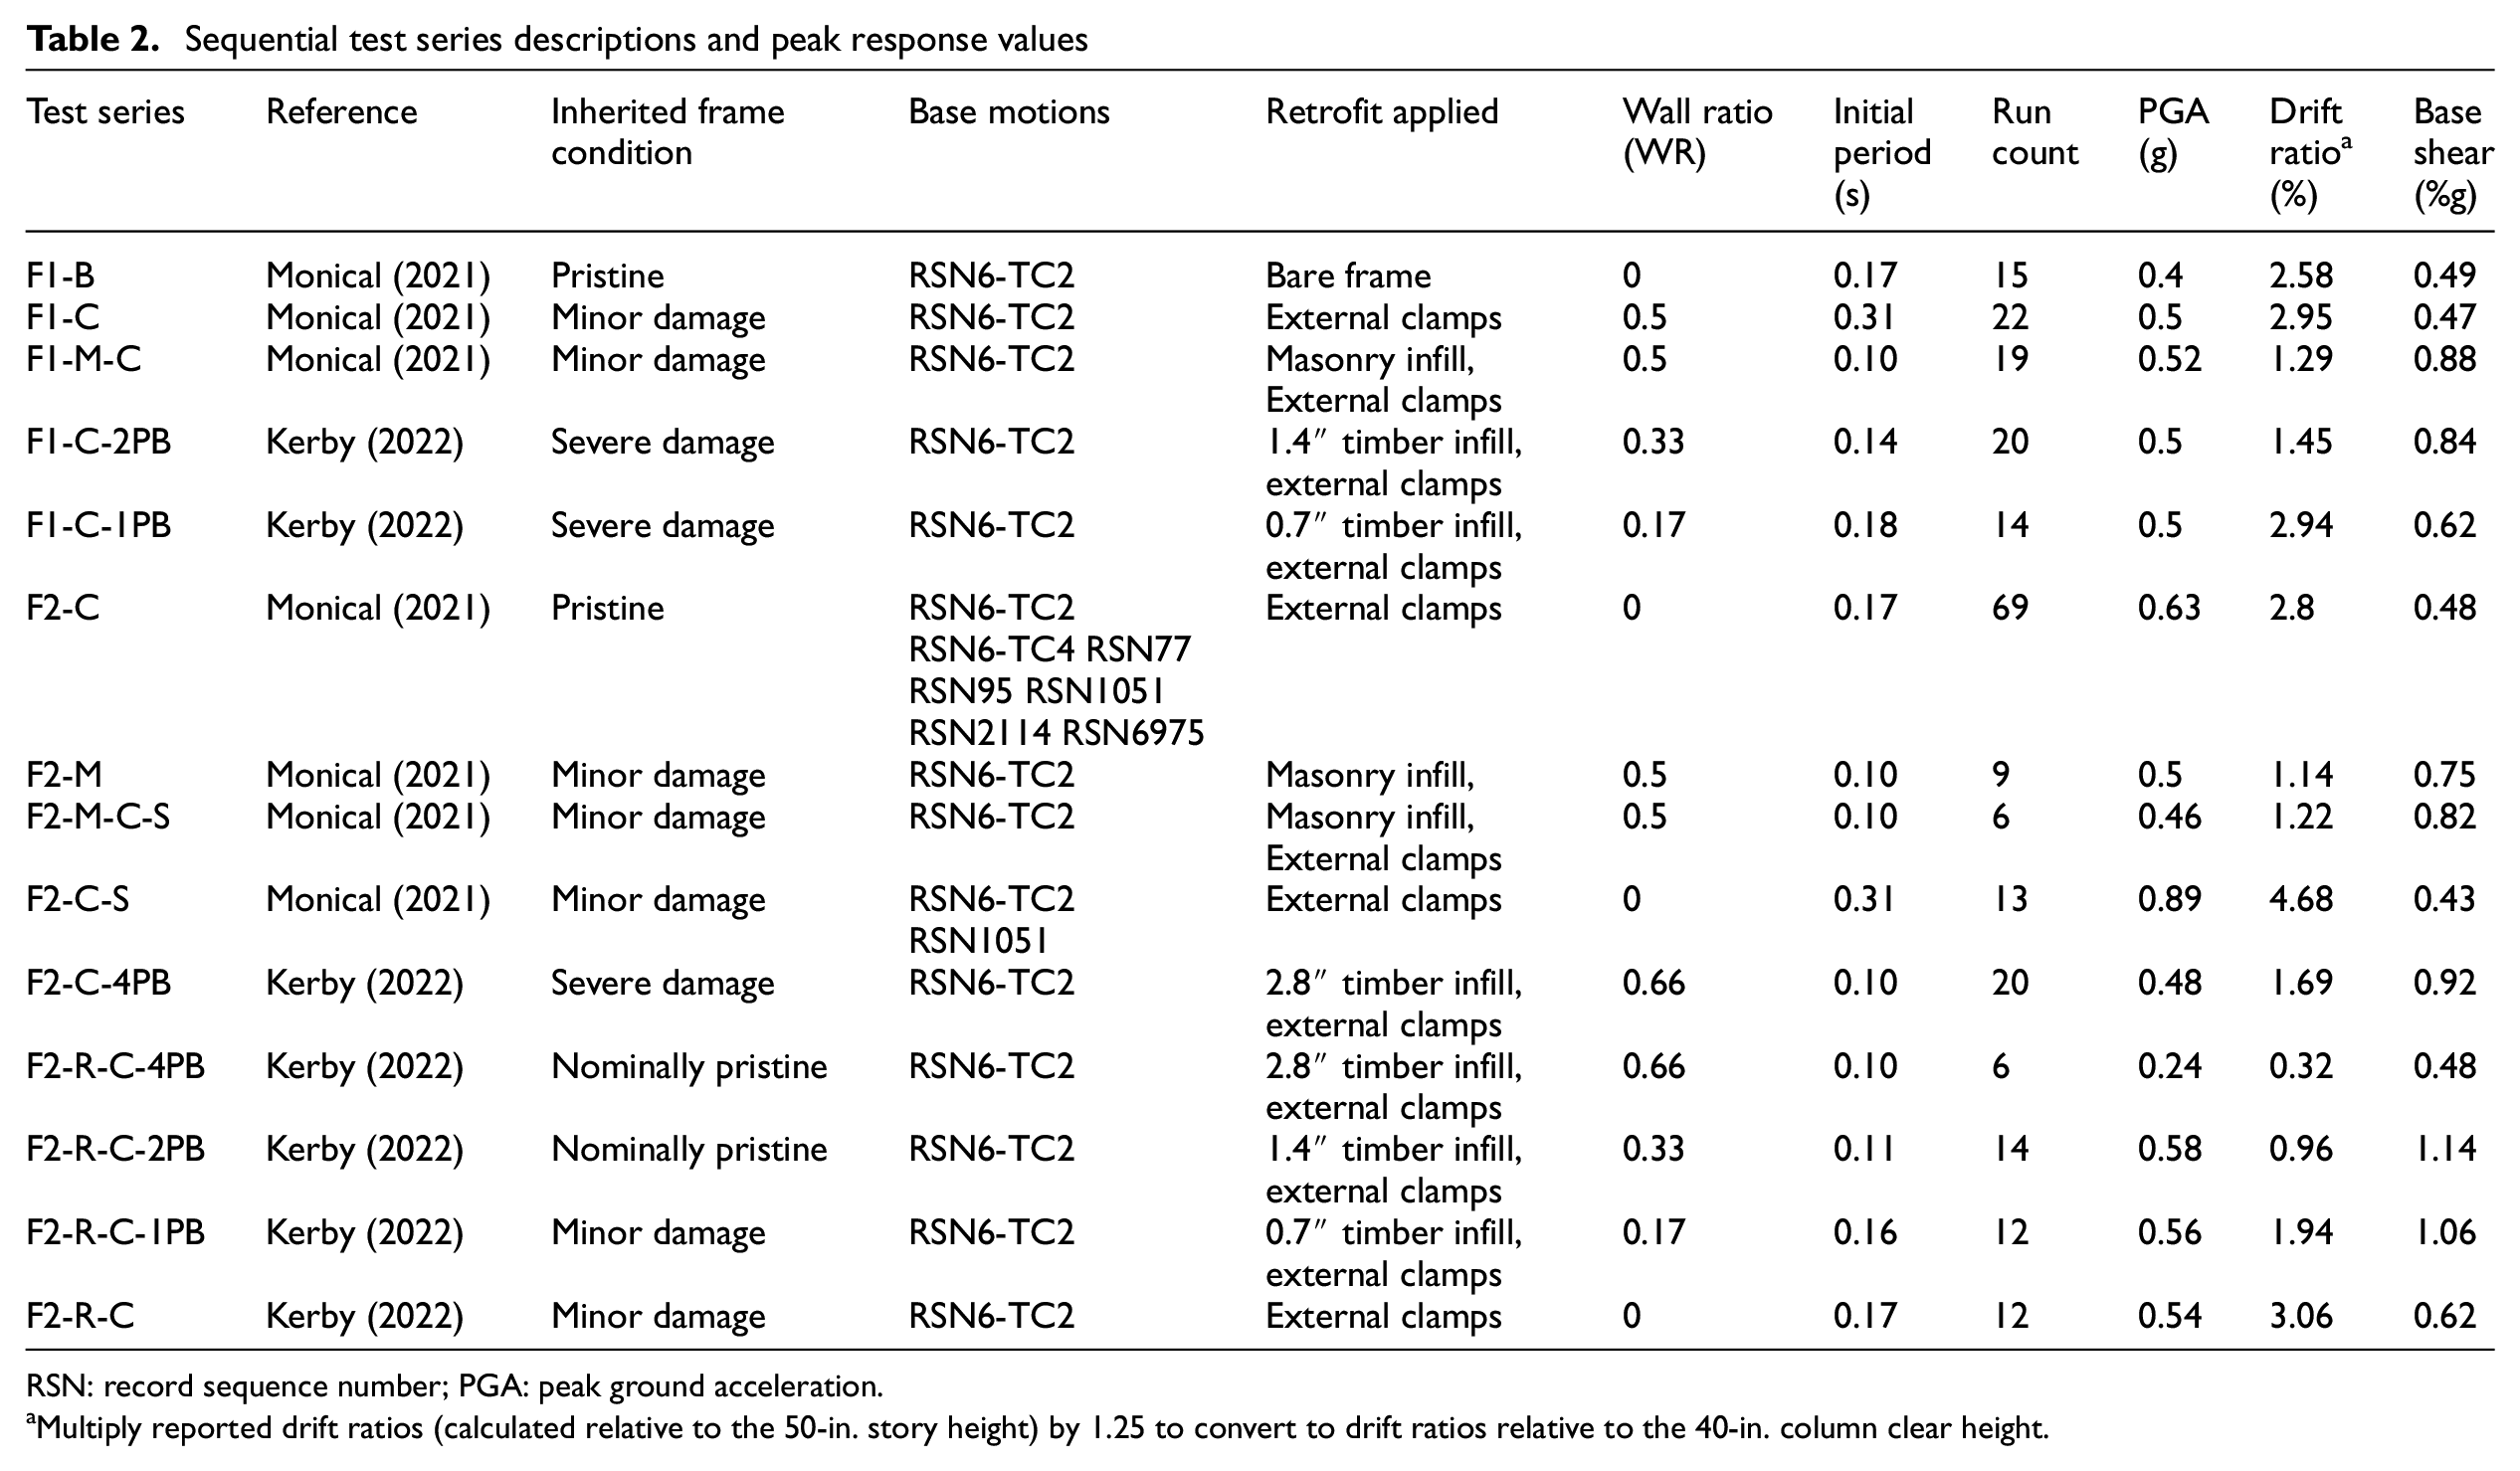
RSN: record sequence number; PGA: peak ground acceleration.
Multiply reported drift ratios (calculated relative to the 50-in. story height) by 1.25 to convert to drift ratios relative to the 40-in. column clear height.
Frame design
Frames were designed to (1) represent non-ductile RC frames and (2) not exceed the capacities of the earthquake simulator at Purdue University. Frames were not scaled from a prototype building, rather column dimensions were reduced to approximately one-third scale of what was deemed typical in a low-rise building not designed to resist earthquakes. Frames 1 and 2 had nominally identical dimensions and reinforcement. 120 × 72 × 20-in. beams sandwiched two 8-in. square columns of 40-in. clear height (Figure 1). Frames were cast from a single concrete batch. The mean measured compressive strength of sets of three 6 × 12-in. standard concrete cylinders was
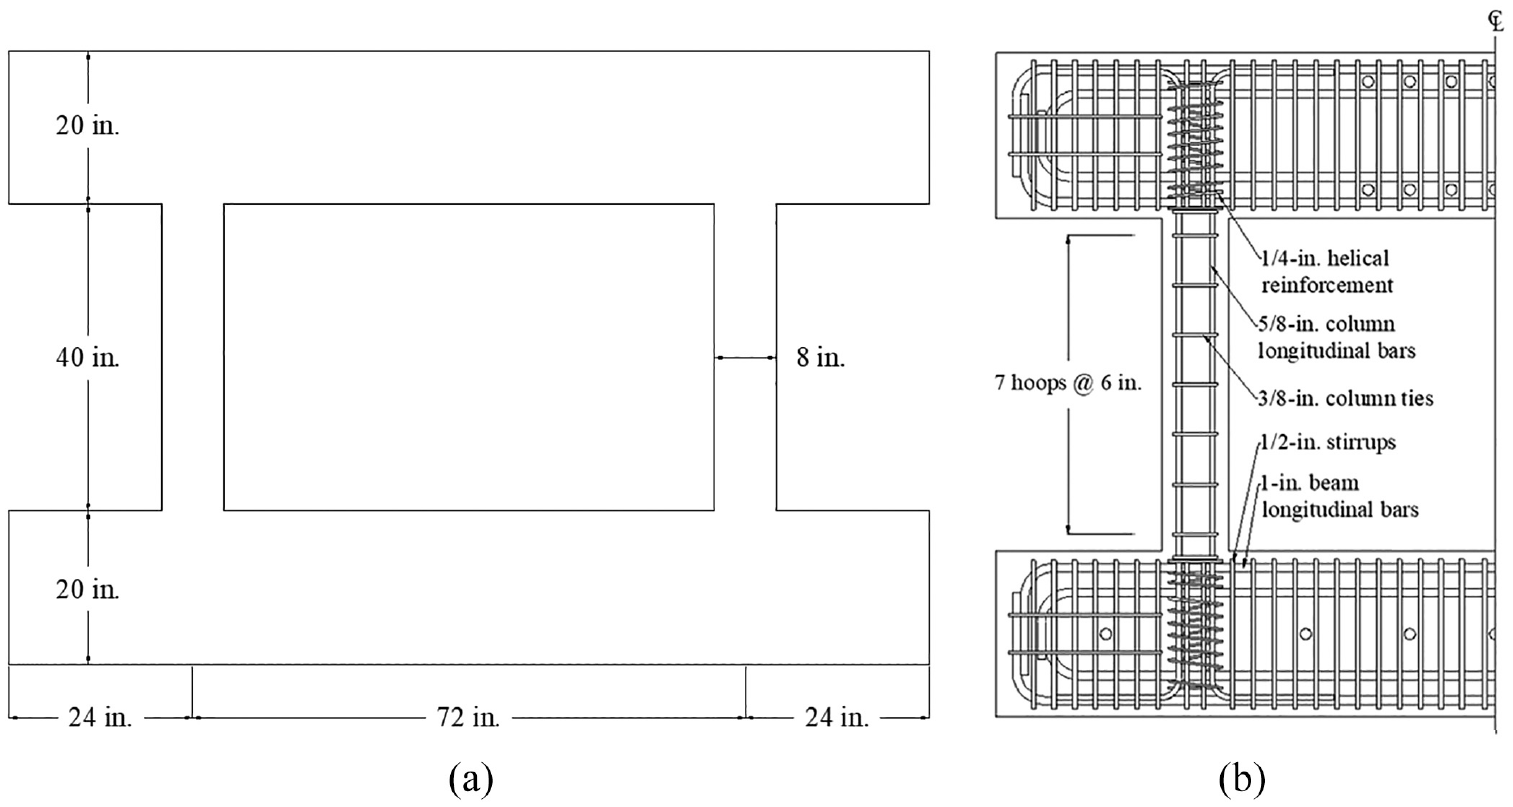
Test frame dimensions and reinforcement. (a) Frame dimensions. (b) Reinforcement detail.
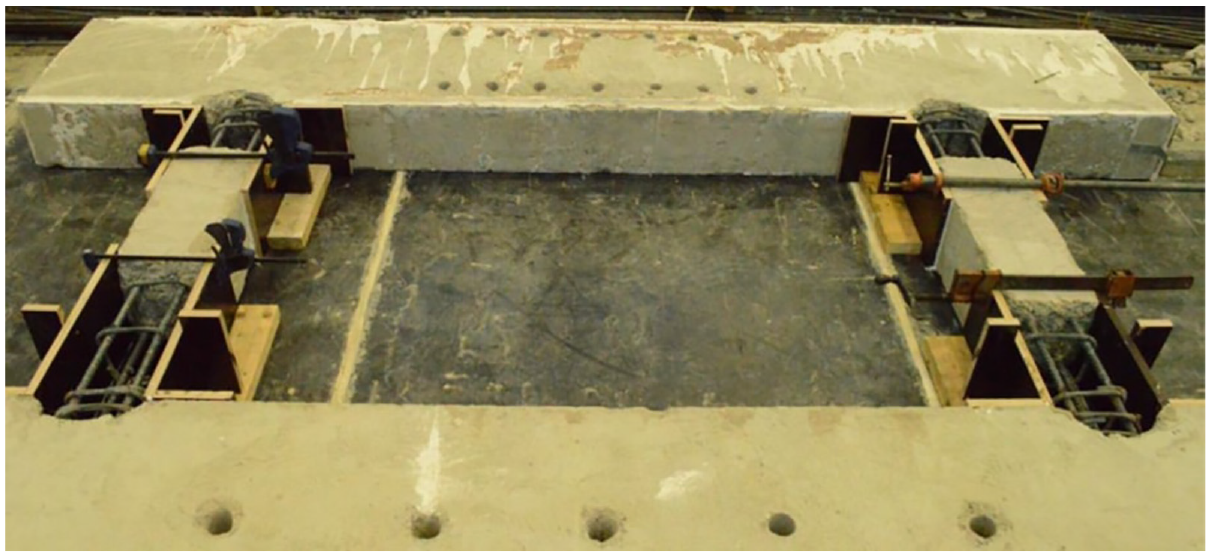
Frames were tested parallel to the uniaxial north–south ground-motion simulation (Figure 2). Frame top beams were connected to a concrete block suspended freely from an overhead crane by a swivel-link, forming a pendulum swinging from 35 ft above the block’s center of mass. The swivel-link was bolted to MC18 × 58 channels slip-critically clamped to the frame top beam near midspan with a total clamping force of approximately 300 kips. The suspended concrete block increased the effective mass of the test setup to approximately
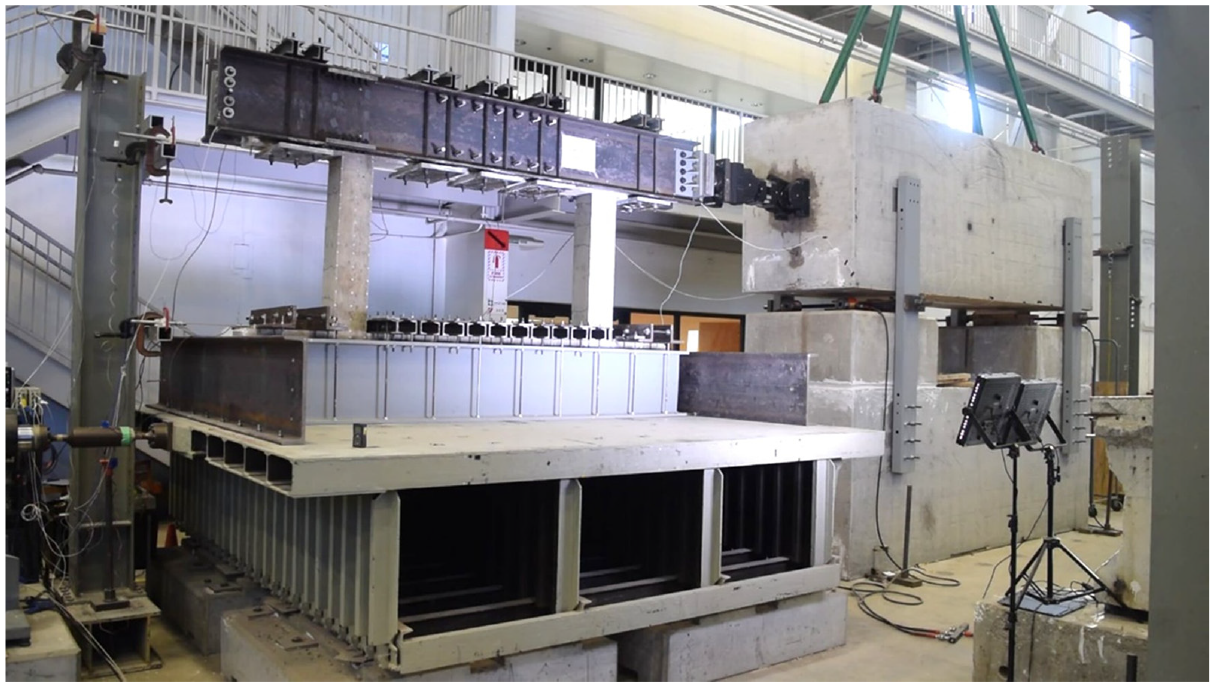
Test setup photo.
Frame condition and repairs
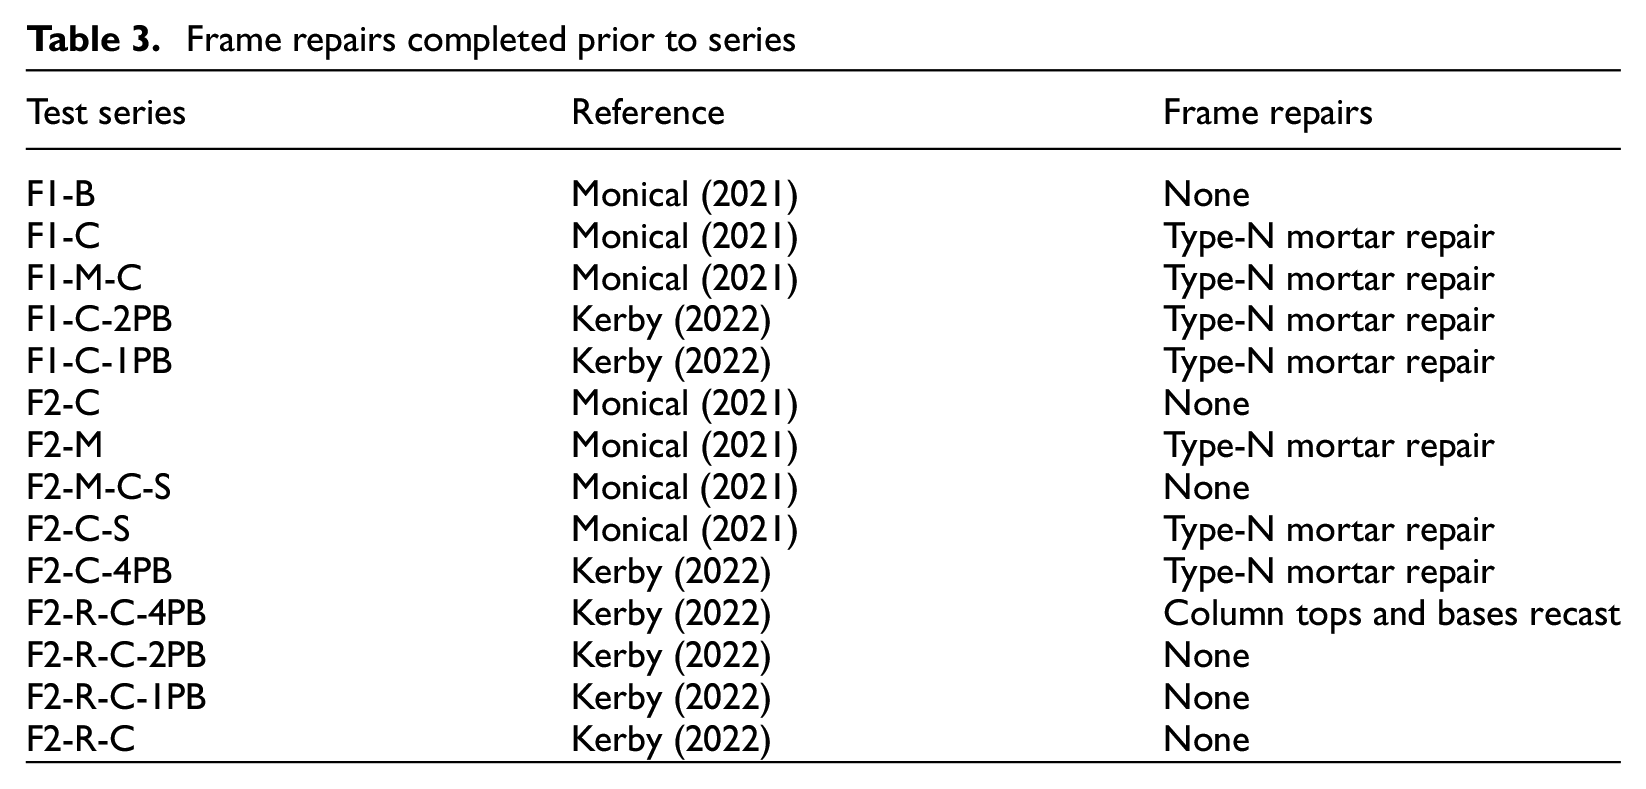
Frames were reused in subsequent test series. The initial condition of the test frame was inherited directly from the previous series, usually with cosmetic repairs. Inherited frame condition was documented prior to each series in Table 2, which lists the 14 series in chronological order. Prior to the start of seven series, loose column concrete near beam–column joints was replaced with type-N non-structural mortar (Table 3). Mortar repairs provided even bearing surfaces for external post-tensioned confinement and infill edges. In compression tests of mortar cubes, the type-N mortar used to repair frame columns had a
Frame repairs completed prior to series
Frame 2 column repair and recast.
In Table 2, frame conditions range from “pristine” to “severe damage.”“Pristine” refers to each test frame before it had sustained a ground motion, with columns and beams entirely uncracked. “Nominally pristine” describes Frame 2 after the base and top of the columns were recast, creating four cold joints in each column. “Minor damage” describes frame columns that had sustained flexural cracking during previous series but disintegration of the concrete core of the columns was not observed prior to the series start. Inclined cracks that were confined by clamps were classified as “minor damage.”“Severe damage” refers to frames that had unconfined inclined cracks and/or concrete core disintegration was observed prior to the series.
Cecen (1979) showed that for concrete frames subjected to repeated ground motions, a frame that has experienced an initial earthquake without structural failure is unlikely to experience increased drift demands during a second earthquake of similar intensity, “provided that all of the previous [base motions] had intensities less than or equal to that of the [base motion] under consideration” (Shah, 2021). Users of this dataset should be wary when comparing drift demands to check if the runs in question were predated by runs of higher intensity simulations, which would cause a divergence in measured drift demand.
For much of this dataset, drift demand and drift capacity can be treated as independent quantities. While drift capacity has been observed to be sensitive to displacement history in poorly detailed elements or those undergoing large shear demands (Pujol et al., 2006) such as in series F1-B, for well-detailed elements not exceeding drift ratios (DRs) of about 2%, the effect of previous cycles on drift capacity is small (Pujol, 2002). As drift demands were most often well below 2%, one can assume that the RC frame condition had little effect on measured drift demands when comparing (1) series with “pristine,”“nominally pristine,” or “minor damage” inherited conditions according to Table 2, (2) runs maintaining stable hysteric loops, and (3) runs of frames not having previously sustained simulations of higher intensity within their respective series.
Retrofits
The three retrofits are described in this section: masonry infill, timber infill, and active confinement of columns via external post-tensioned clamps. Masonry and timber infill were constructed with no design tolerance for relative motion between frame and infill. References refer to the dissertation or thesis in which the given retrofit was primarily studied.
Masonry infill
Masonry infill walls were built using clay bricks with voids and pre-blended cementitious mortar mix. Clay bricks were 7 and 5/8-in. long, 3 and 5/8-in. wide, and 2 and 1/4-in. tall (Figure 4b) (Monical, 2021). Each brick contained three cylindrical voids and was 25% hollow by volume. Walls were single wythe and bricks were laid such that their long dimension was parallel to the longitudinal axis of frames with voids oriented upward. Type-N cementitious mortar was hand-mixed to form 3/8-in. thick bed and head joints. Wall gross thickness was approximately 50% of the 8-in. column thickness. Masonry prisms constructed in the same manner as infill walls had a mean measured compressive strength
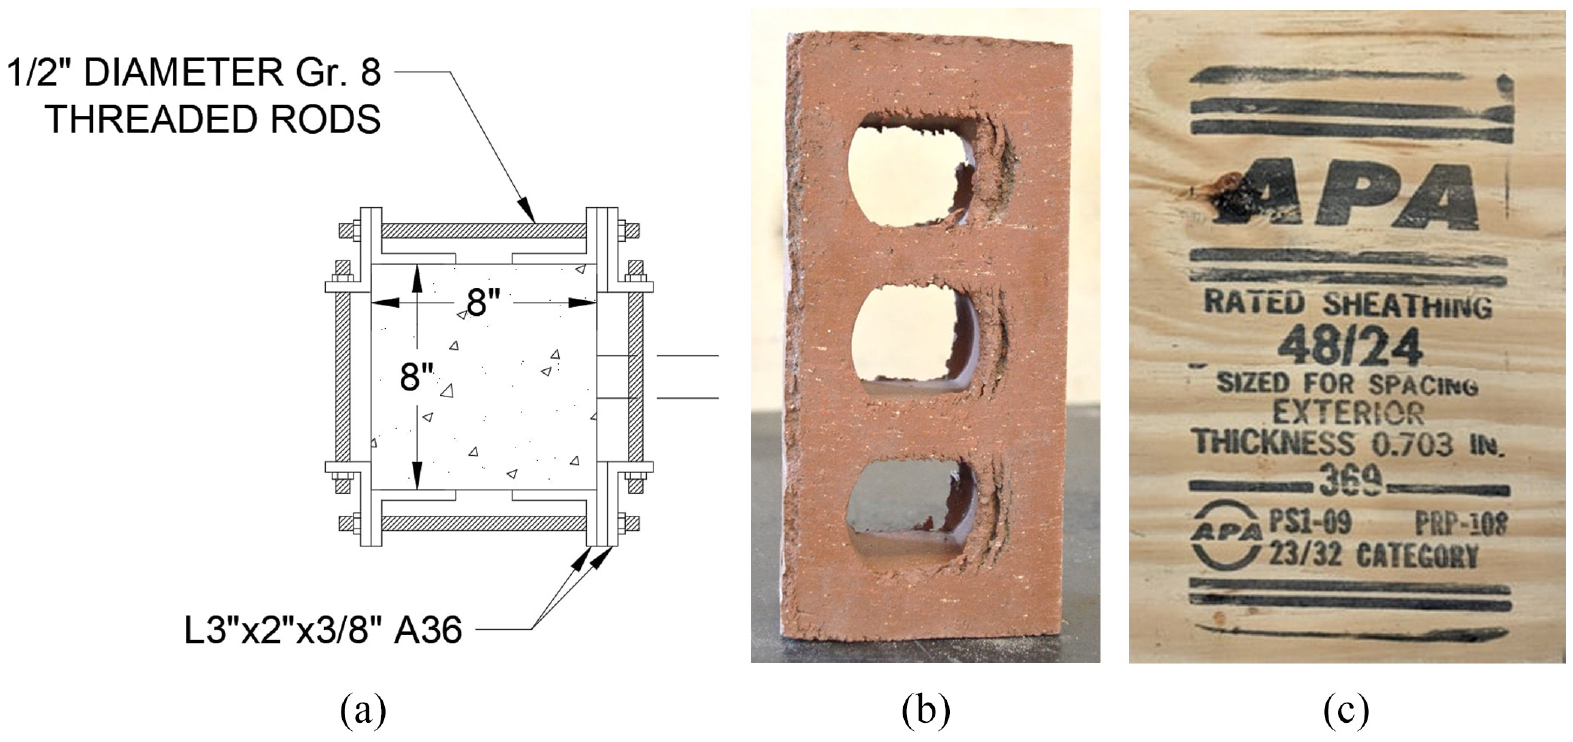
Frame retrofit materials. (a) External clamps. (b) Clay brick. (c) APA rated sheathing.
Timber infill
Timber infills were constructed from 3/4-in. 6-ply Douglas-Fir/Southern Pine APA Rated Sheathing plywood panels (Figure 4c) (Kerby, 2022). The panels were chosen based on material availability in the American Midwest and did not meet the requirements for the Structural-I panel rating more frequent in high seismic-hazard regions of the United States. Timber infills were constructed at thicknesses of 9%, 18%, and 36% relative to the 8-in. column thickness. A 6-in. square-grid “screw-lamination” of two 3/4-in. plywood panels formed timber infills of thickness
Active confinement
Active confinement was applied to columns of test frames using post-tensioned external clamps similar to devices designed by Skillen (2020). Clamps consisted of 3 × 2 × 3/8-in. A36 steel angles and 1/2-in. diameter high-strength (Grade 8) threaded rods (Figure 4a). Steel angles were fitted about column corners and threaded rods were stressed to approximately 40-ksi bar stress. Two clamps were spaced at
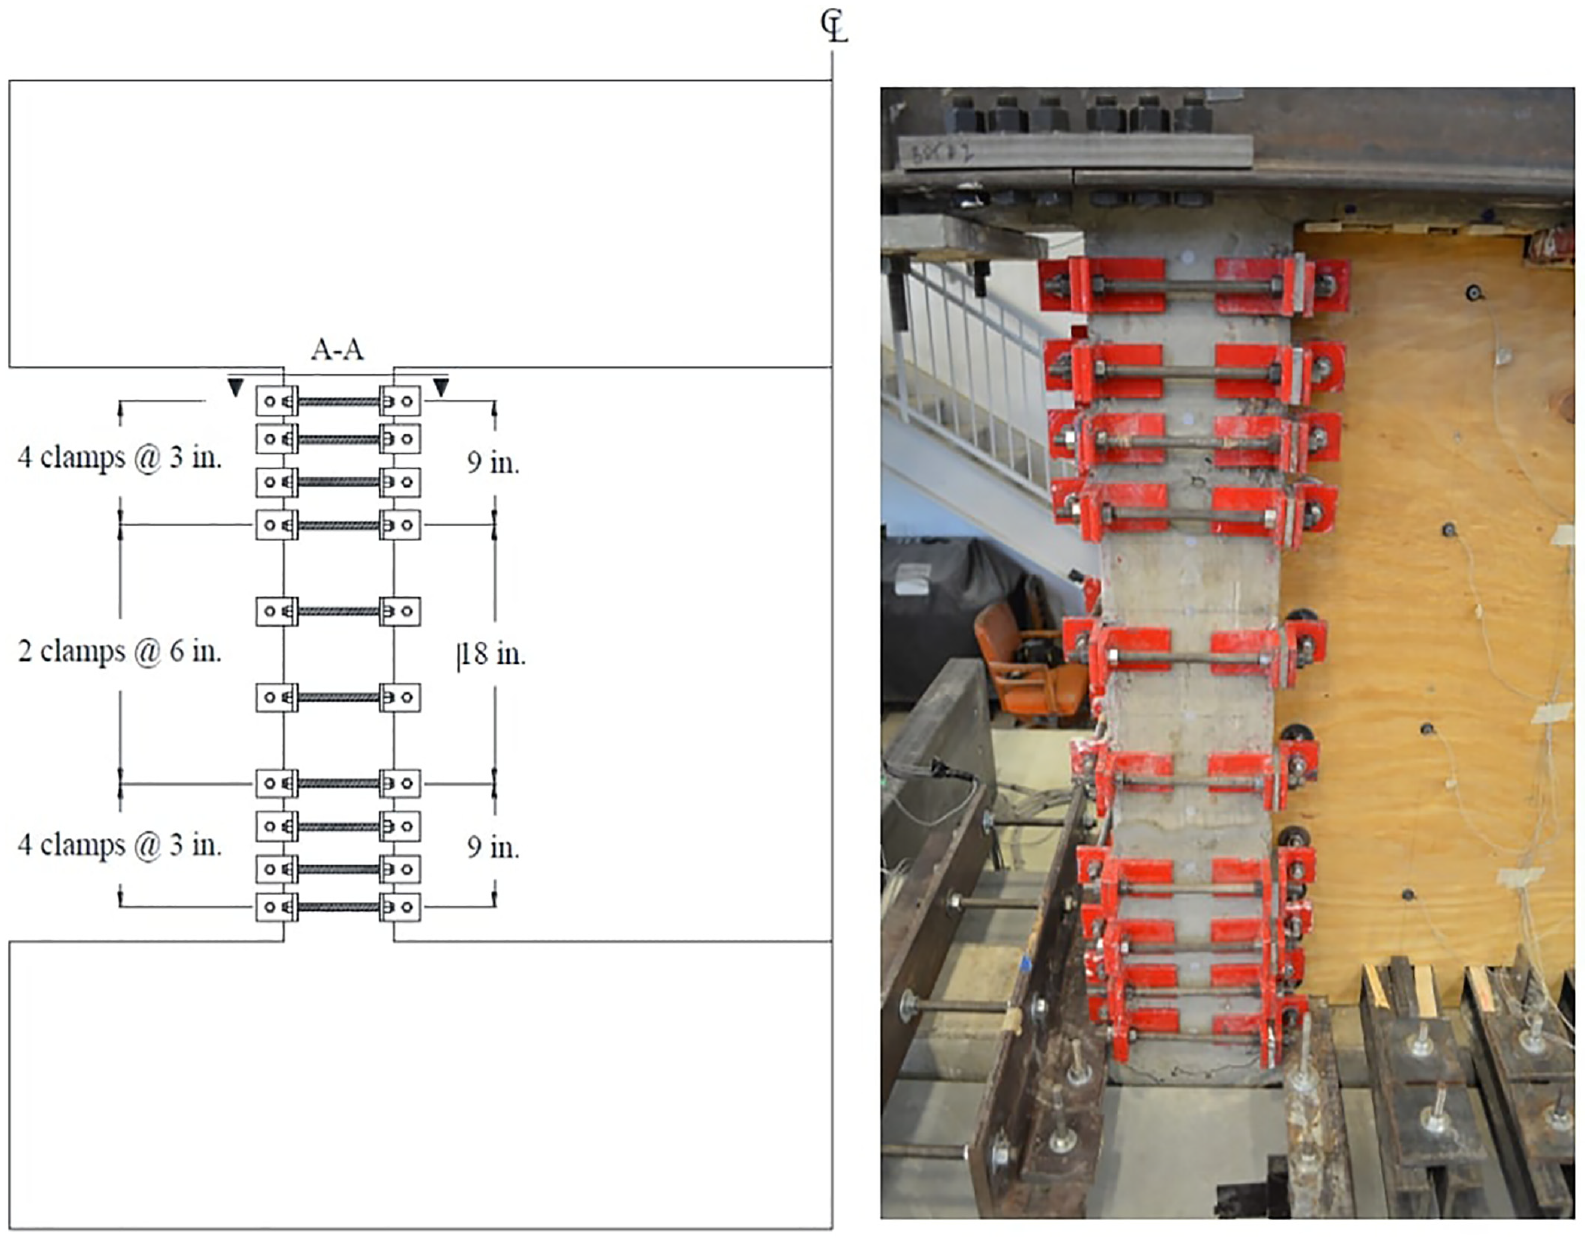
Active confinement schematic and photo.
Effect of retrofit on drift demands
The effect of retrofits on in-plane seismic performance can be illustrated by normalizing the peak DR of a run by the peak ground velocity (PGV), in units of % drift per in./s of base velocity. The mean value of DR/PGV for the four most intense runs of each series is plotted in Figure 6. This value approximately describes the slope of the linear relationship between drift demand and PGV described by Sozen (2003). Series testing pristine frames without infill were F1-B and F2-C, during which approximately 0.3% drift per in./s of PGV was measured. Masonry infills reduced drift demands to approximately one-third that of the pristine bare frames (∼0.1% per in./s). Timber infills were shown to reduce drift demands to at least one-half that of pristine bare frames and reduced drift demands a similar amount as masonry infills when multiple timber panels were screw-laminated to increase infill thickness. External confinement of columns alone did not reduce drift demands compared to bare frames.
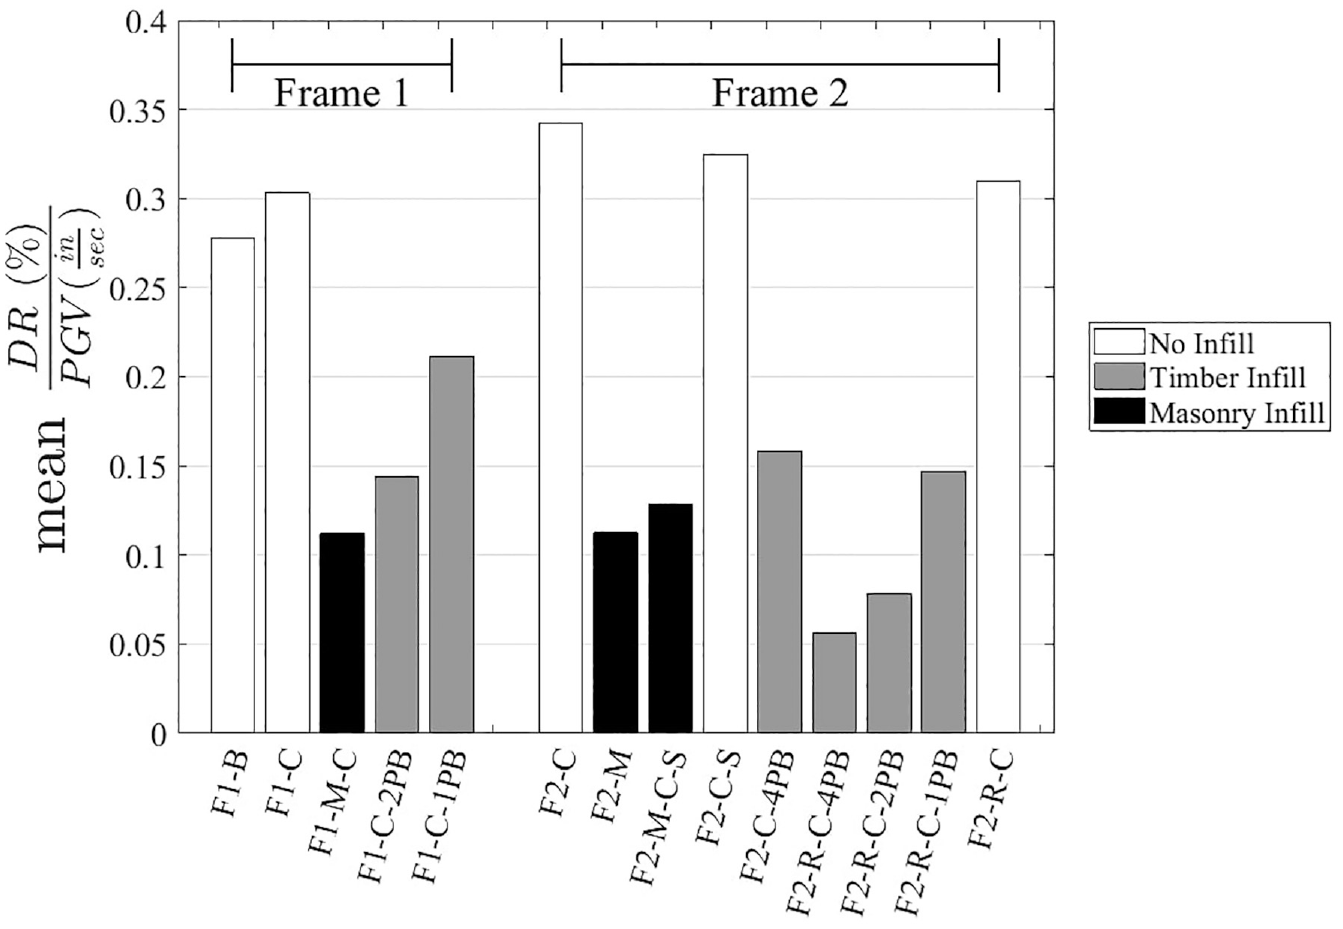
Mean value of DR (%) divided by PGV (in./s) for the four most intense runs simulating RSN6-TC2 in each series.
The difference in drift demands measured during Series F2-C (pristine frame, 0.35% per in./s), F2-C-S (minor damage, 0.32% per in./s), and F2-R-C (minor damage, 0.31% per in./s) confirms that for well-detailed frames not sustaining drift demands beyond 2%, initial frame condition had little effect on drift demands. Comparison of mean DR/PGV values of series with similar retrofits but different inherited frame conditions quantifies when frame condition did effect drift demand. For example, mean DR/PGV values for F1-C-2PB (severe damage, 0.14% per in./s) and F2-R-C-2PB (nominally pristine, 0.08% per in./s) show that once frames sustained cycles at large drifts (beyond 2%), frame condition had deteriorated to the point of having a measurable effect on drift demands.
Instrumentation
Displacements of the frame and simulator platform, lateral load, and tri-axis accelerations of frame beams were measured according to the instrumentation layout of Figure 7a. Over the duration of the 14 series and 254 runs, the instrumentation design changed multiple times including channel names and instrument calibrations. For this reason, only information applicable to all 14 series is illustrated in Figure 7a. A series-specific instrumentation glossary is provided for each of the 14 series within the dataset (Figure 7b). Data were collected during ground-motion simulations at 1000 Hz. Linear Variable Differential Transformers (LVDTs) measured the in-plane displacement of the simulator ServoRam, top of frame foundation beam, soffit of frame top beam, and top of frame top beam. LVDTs were clamped to a column that remained stationary during earthquake simulations. Drift was calculated as the average displacement of the top beam LVDTs minus the displacement of the foundation beam LVDT. DR was calculated by dividing the story drift by 50 in., the height from the top of the foundation beam to the centerline of the top beam. The maximum error of measurement was smaller than 0.02 in. for all LVDTs. Micro–electro–mechanical system ADXL335 (range of ± 3 g) and piezoelectric PCB (± 5 g) accelerometers recorded triaxial accelerations at each end of test frame foundation and top beams, and on the suspended mass and simulator platform.
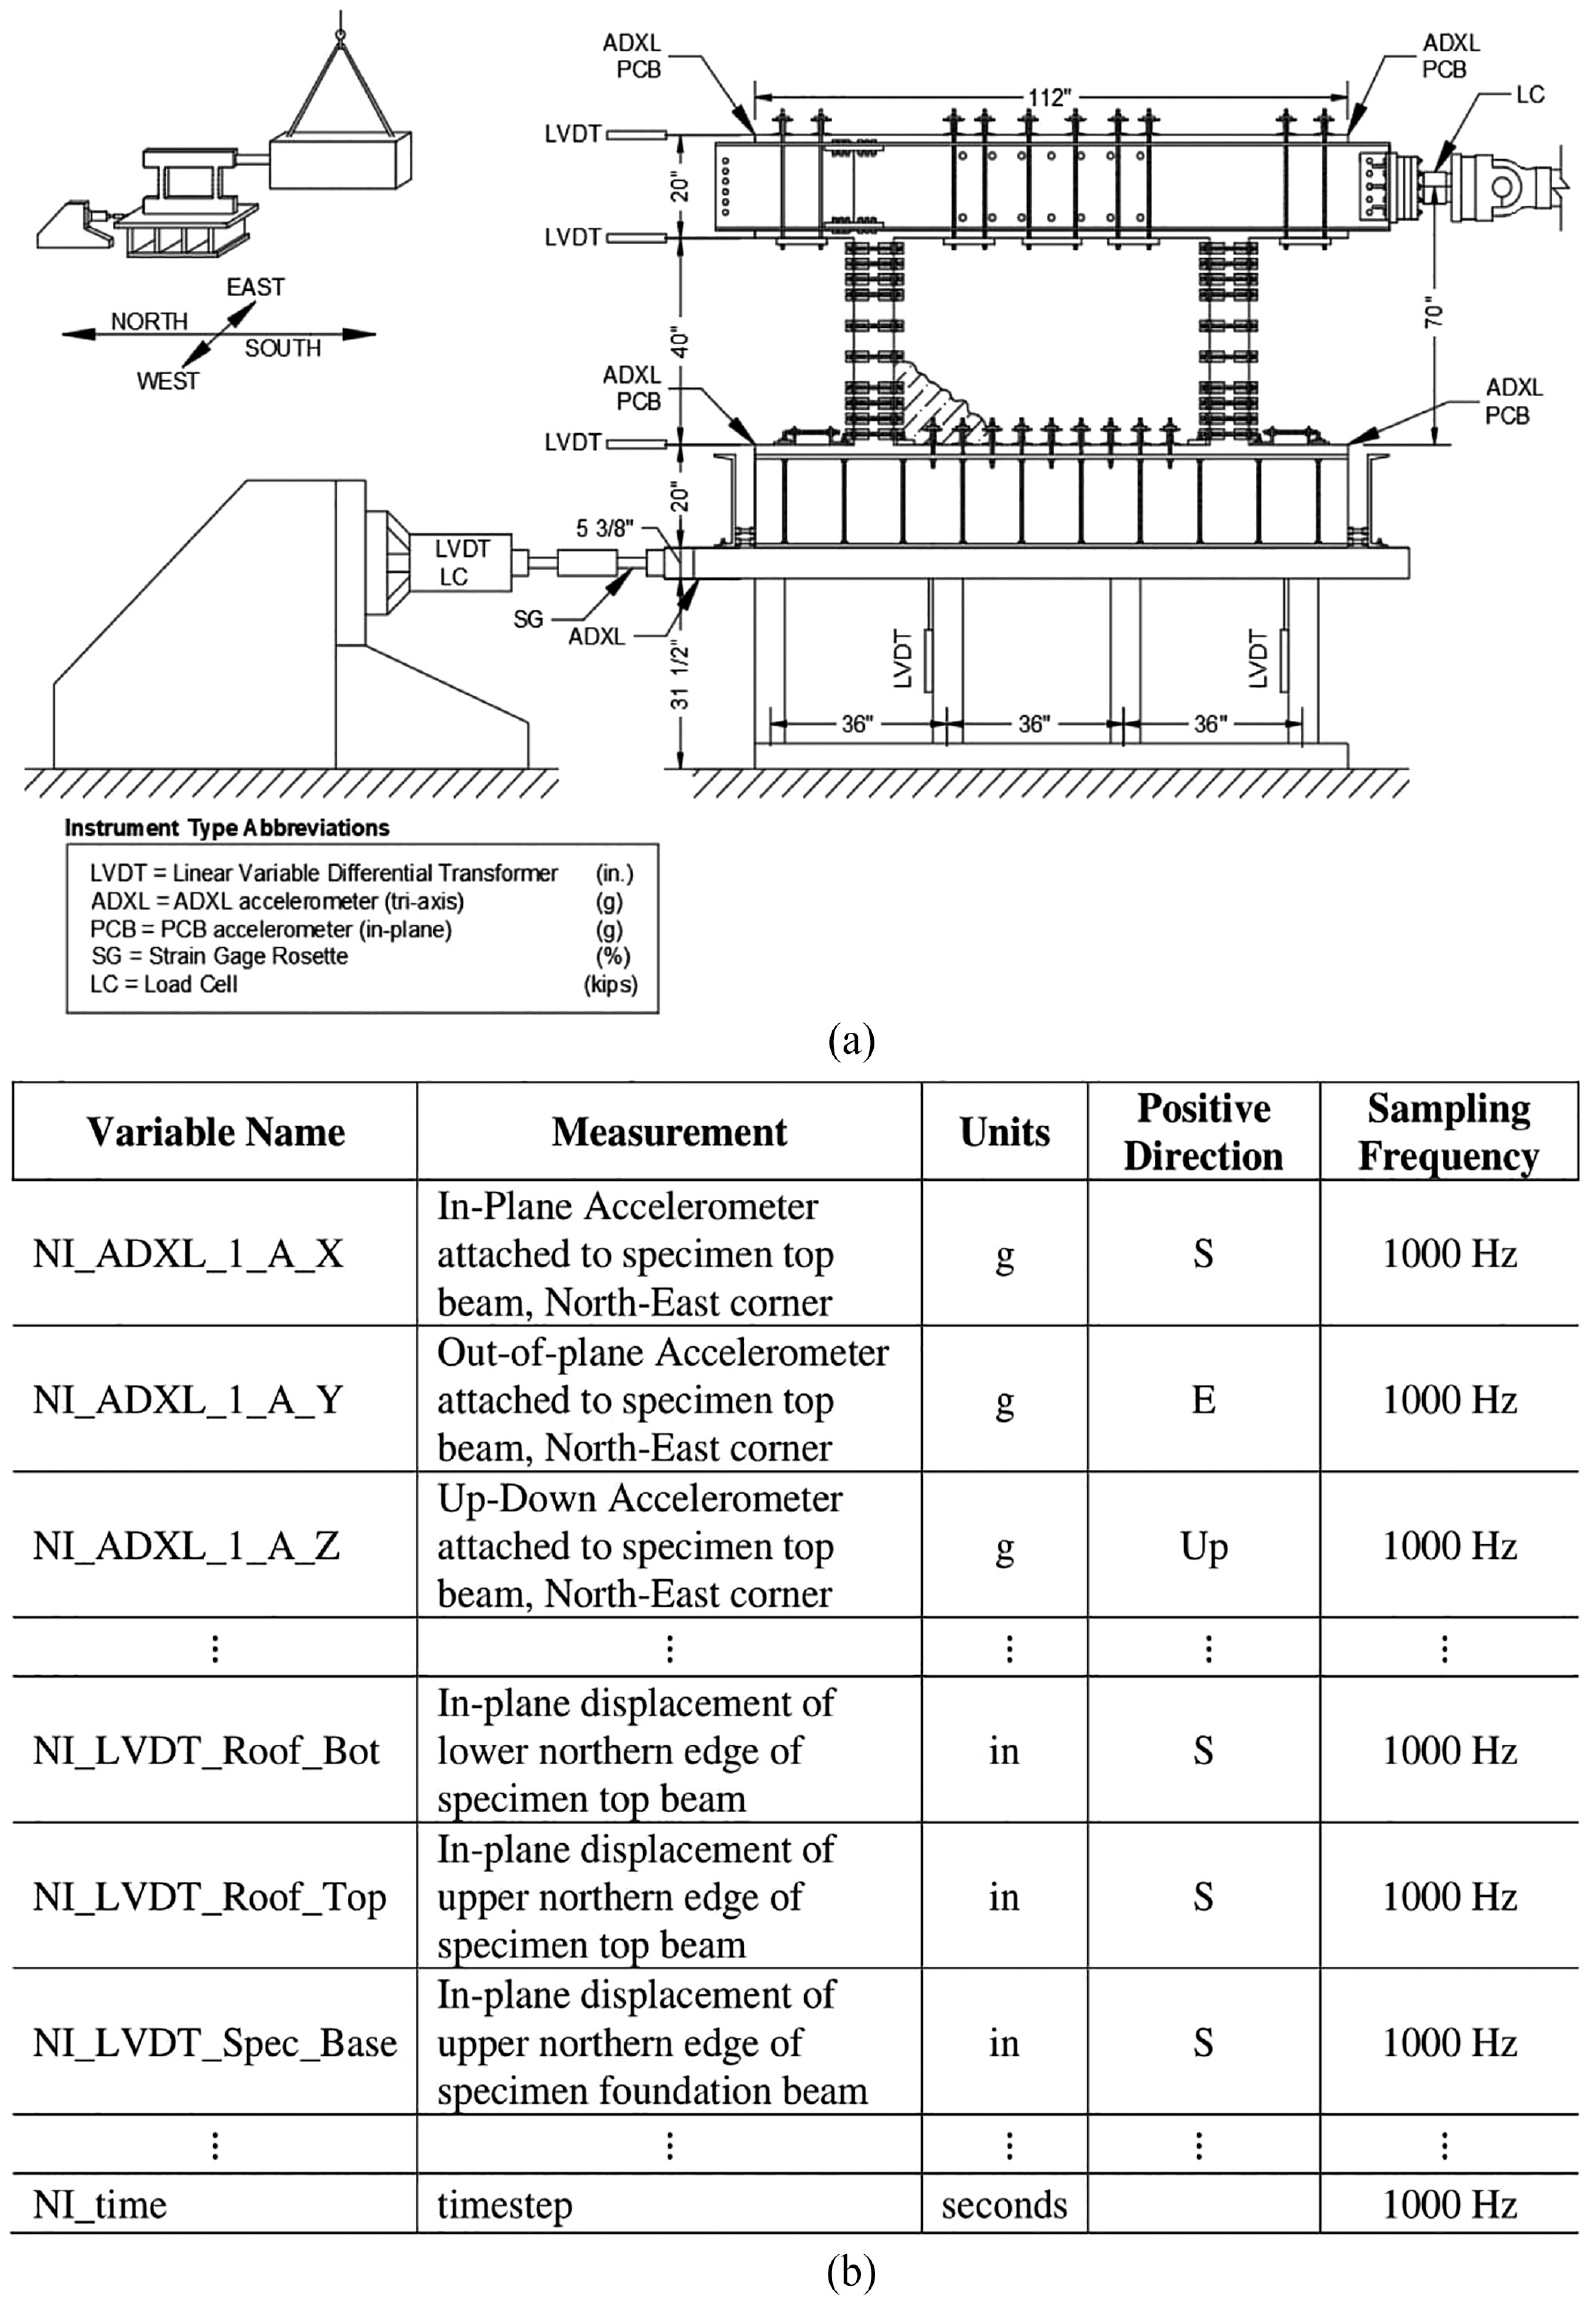
Instrumentation layout: (a) Instrument locations and types and (b) example series-specific glossary (F1-B).
Data processing includes zeroing readings, trimming records, and filtering of acceleration records. Records were trimmed to within 5 s of the start and end of a ground-motion simulation and were zeroed to the mean value of the first 1 s (1000 readings) of a given instrument after trimming. Cumulative displacements across series were not recorded in the raw data files, and all instruments were zeroed to the first readings from a given run. Acceleration data were filtered using a fourth-order Butterworth bandpass filter with a high-pass frequency of 0.25 Hz and low-pass frequency of 15 Hz. The manufacturer-specified minimum frequency of the ADXL335s was 0.5 Hz, but it was observed that the fit between target and measured displacement spectra from base acceleration histories was better with a 0.25 Hz minimum frequency. After filtering of acceleration data, acceleration histories were integrated with respect to time using the trapezoidal rule to produce velocity histories and integrated again to produce displacement histories. After each integration, histories were corrected with a second-order polynomial function such that values at the beginning and end of the trimmed record were approximately zero.
Simulated ground motions
Dynamic tests of infilled frames were performed using the earthquake simulator at the Bowen Lab for Large-Scale Civil Engineering Research at Purdue University. Specifications of the earthquake simulator are described by Sozen et al. (1969) and Gulkan and Sozen (1971). Dynamic testing consisted of a simulated base motion performed parallel to the longitudinal axis of the test frames. A total of seven base motion records were used, each compressed in time and scaled in amplitude according to Table 4. Unscaled records were obtained from the PEER NGA West-2 ground-motion database (Ancheta et al., 2014). 187 of the 254 runs simulated “RSN6-TC2.” RSN6-TC2 simulated the north–south record of the 1940 El Centro Earthquake obtained from PEER (Ancheta et al., 2014) compressed in time by a factor of 2 and amplified by 1.9 (Figure 8). Simulated ground-motion intensities were linearly scaled from RSN6-TC2 to 10%, 20%, 40%, 60%, 80%, or to the simulator capacities at 100% intensity. Test series began with two motions at each intensity from 10% upward, halting the increase in intensity when either (a) a 100% motion was performed twice or (b) the approximate 75-kip load limit of the simulator was approached. At least two motions at the three lowest intensities of RSN6-TC2 (Figure 9) were simulated in all series, and 13 of 14 series simulated the first 10 motions up to and including 80% intensity runs. If no failure occurred, mirrored “decreasing intensity” patterns were performed after the highest intensity simulation to provide data on the drift demands of softened structures.
Records used to simulate scaled earthquake motions
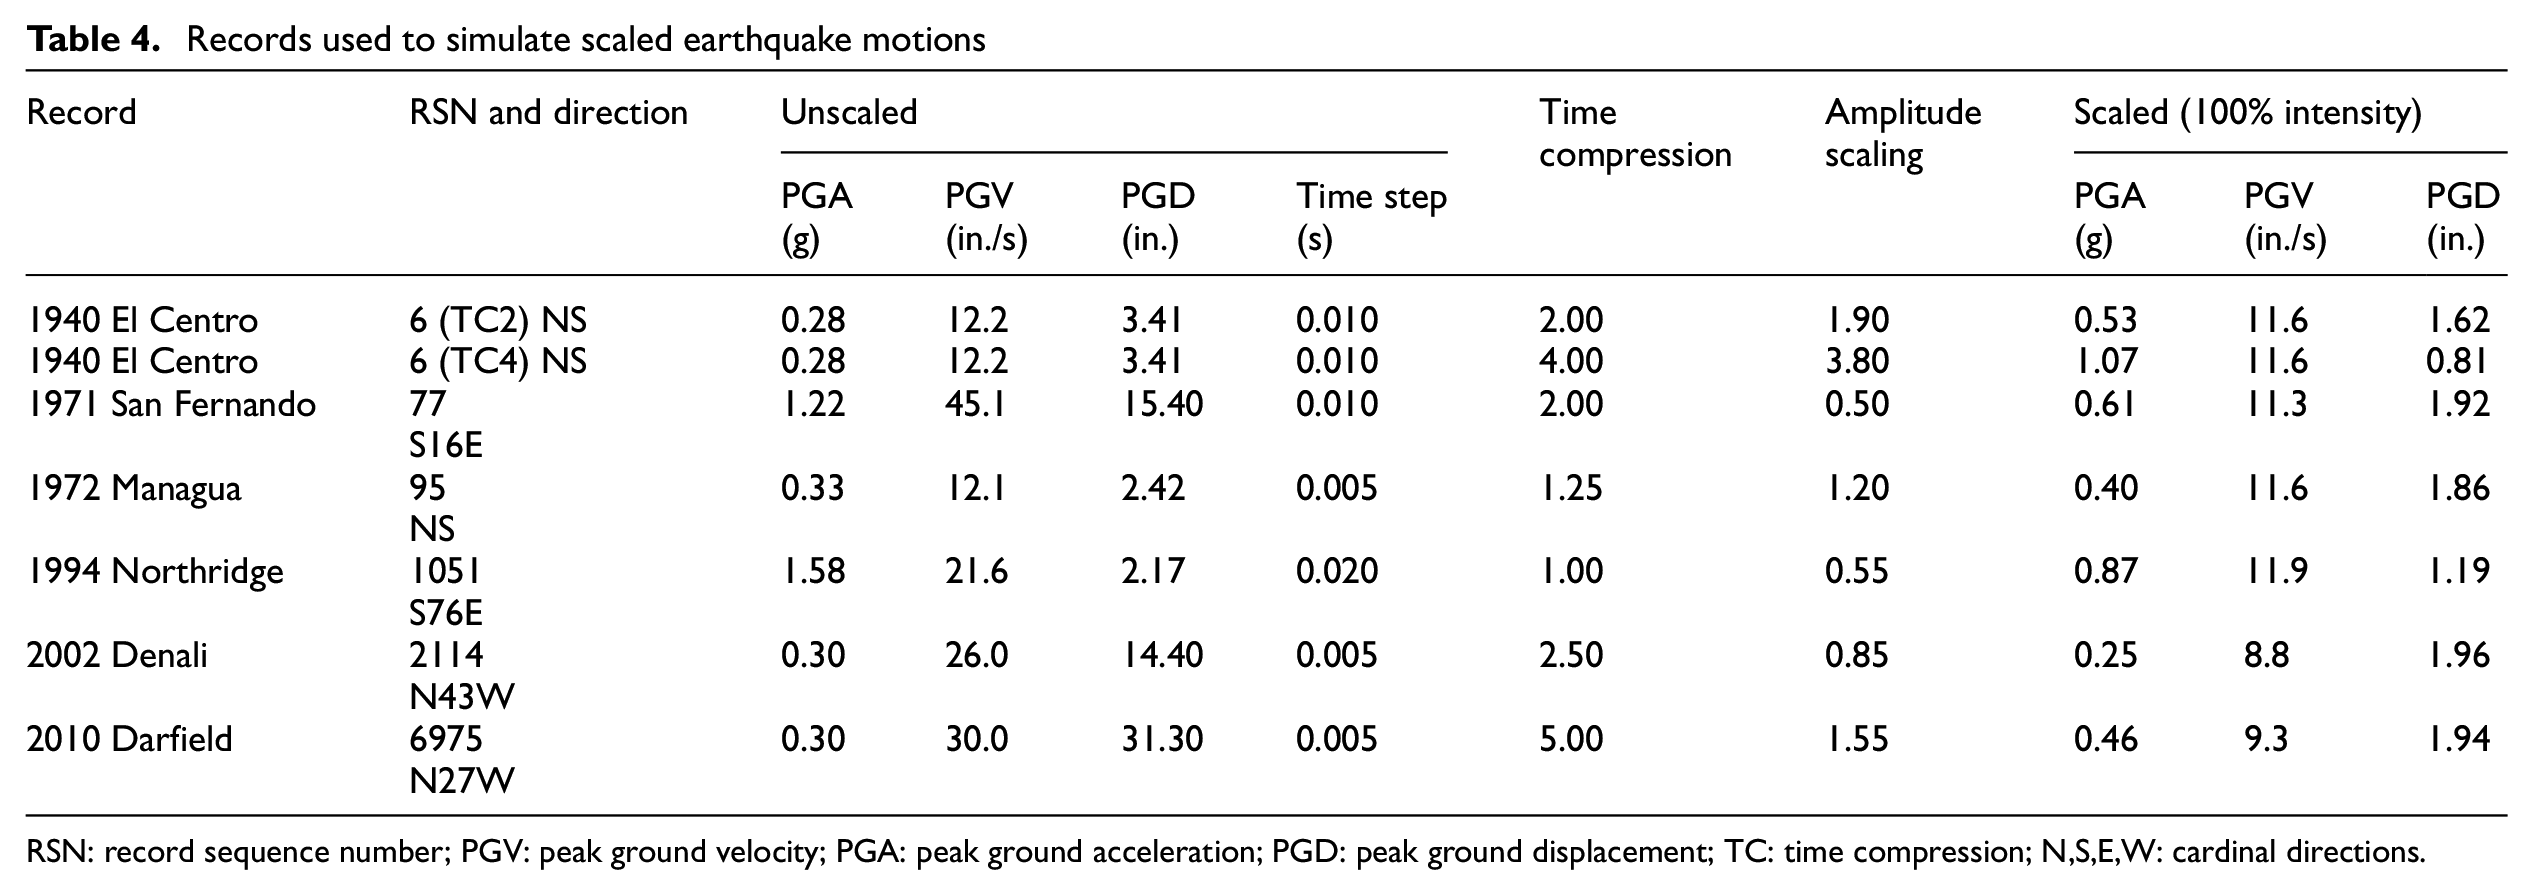
RSN: record sequence number; PGV: peak ground velocity; PGA: peak ground acceleration; PGD: peak ground displacement; TC: time compression; N,S,E,W: cardinal directions.
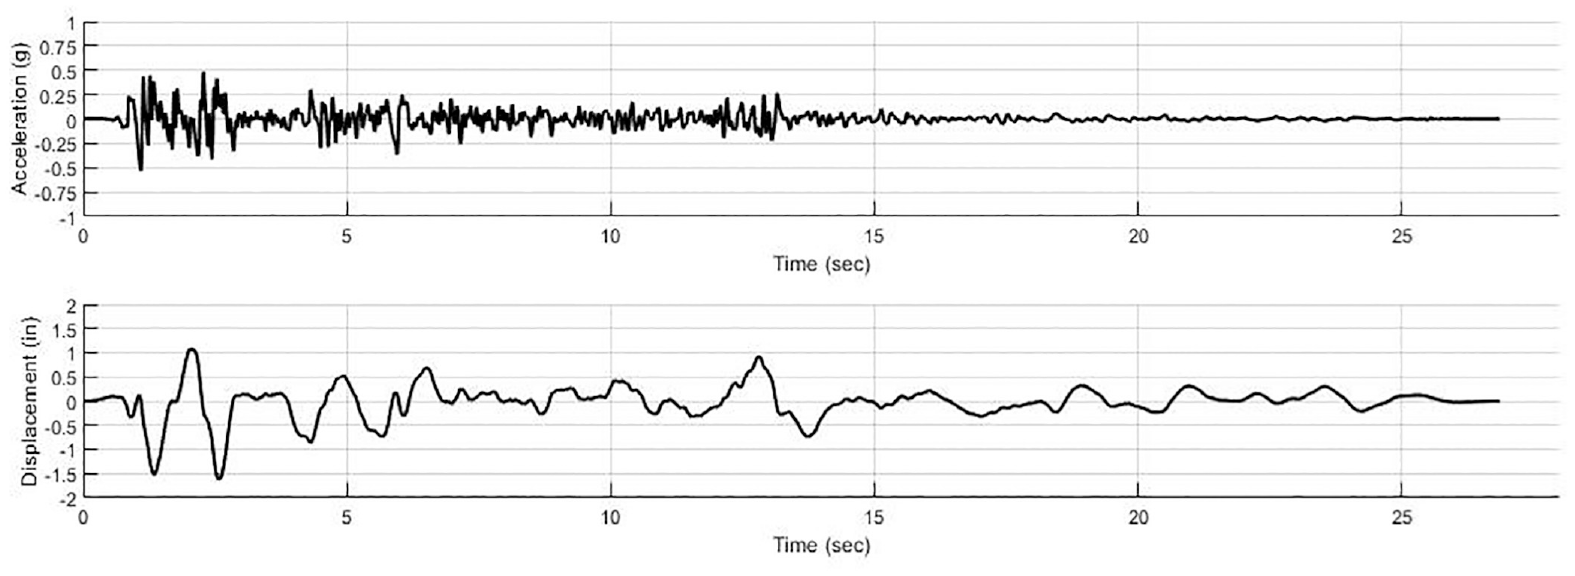
Displacement and acceleration history of scaled and time-compressed, 100% intensity El Centro ground motion (RSN6-TC2).
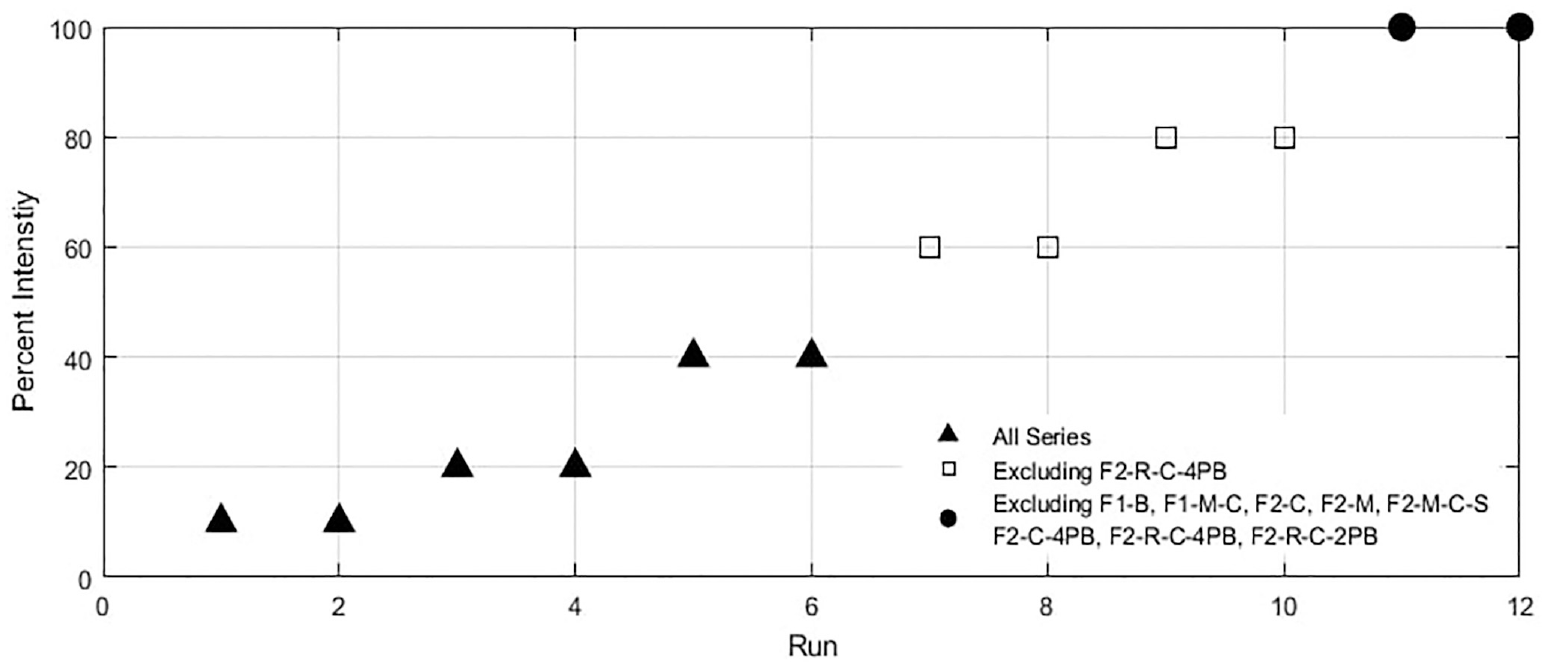
RSN6-TC2 run intensity pattern.
Selected ground-motion names, unscaled and scaled intensities, and time and amplitude scaling factors are listed in Table 4. RSN6-TC2 was the only motion simulated in 12 of 14 test series. Alternate ground motions were used in Series F2-C and F2-C-S to study the effects of varying ground-motion spectra on drift demand. Figure 10 plots the smoothed displacement spectra of all ground motions at 2% damping ratios and a target PGV of 2 in./s within the range of relevant periods, most typically between 0.10 and 0.50 s.
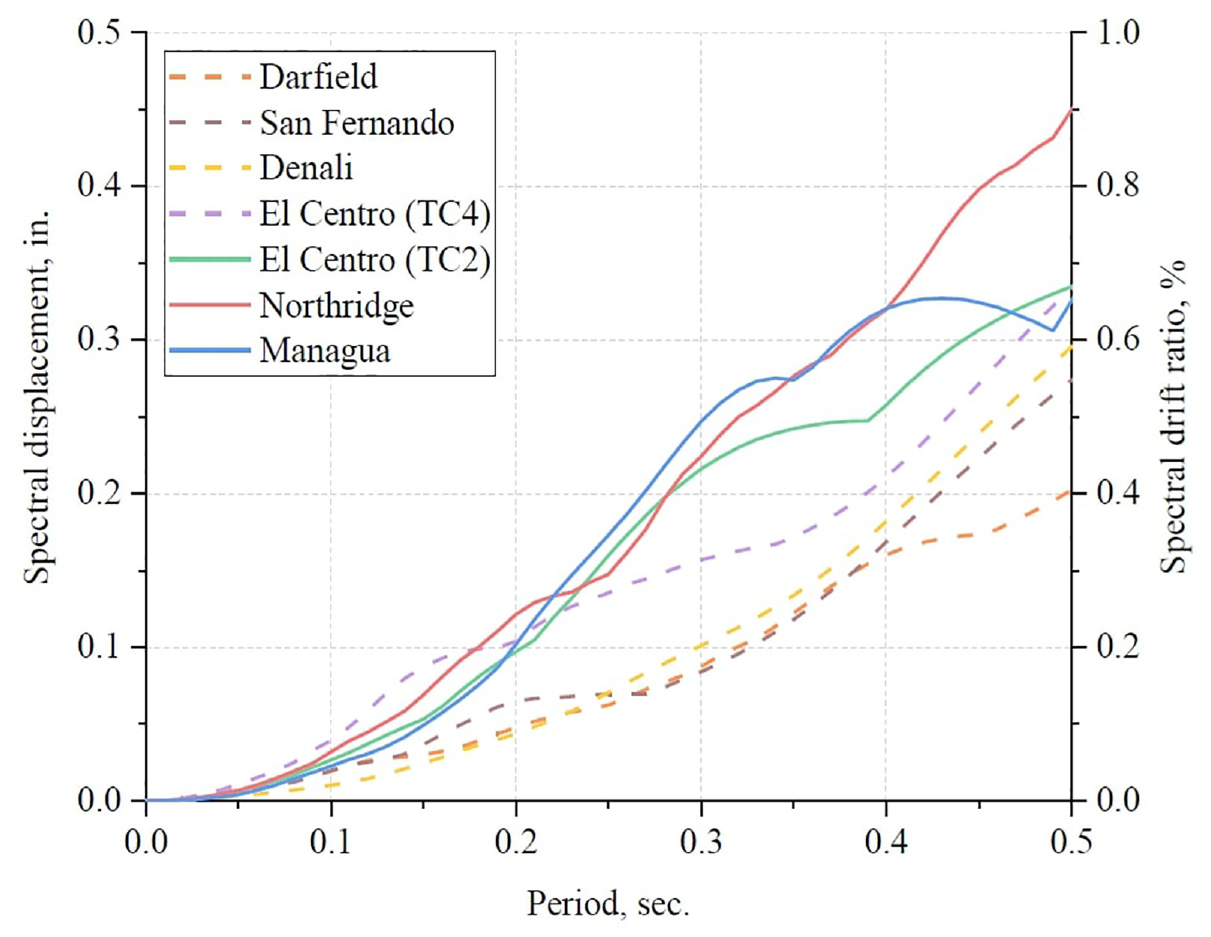
Smoothed displacement spectra (2% damped) of simulations modeled after the scaled ground motions of Table 4 at a target PGV of 2 in./s.
Ground-motion selection
The ground motions of Table 4 were selected based on three criteria. First, simulations within the scaled range of
Run identification
Each run was assigned a unique simulation identification (ID) based on the retrofit configuration and the simulated base motion. IDs were defined using three components: (1) test series, (2) intensity of simulation, and (3) sequence number. IDs of runs modeled after RSN6-TC2 defined the intensity of simulation as a linearly scaled intensity of the input motion (e.g. F1-M-60-1 signifies series F1-M, the first run at a 60% intensity of RSN6-TC2). For runs simulating ground motions other than RSN6-TC2, intensity was instead defined using the ground-motion record sequence number (RSN) and a peak ground velocity (PGV) describing the target peak base velocity of the simulation (between 2 and 12 in./s).
Context of test setup dynamics
The following method estimates the initial period of a test frame with or without infill, prior to sustaining any ground motion. This method uses relatively simple calculations to contextualize the dynamics of the tests in this dataset with respect to other experiments and real buildings.
The effective mass and time compression factors of ground motions were chosen to produce simulations within regions of response spectra deemed relevant to low-rise RC frame buildings. In this setup, relevant regions of response spectra occurred between initial reduced-scale periods of 0.1–0.5 s (Figure 10) or full-scale periods of approximately 0.3–1.5 s. Axial stresses on columns were low, resulting from the external mass being suspended. As low-column axial stress has little effect on the flexural stiffness of a frame, this played a negligible role in the study of drift demands.
Pristine bare test frames had an estimated in-plane initial period of 0.17 s. Initial period was estimated using the undamped equation of motion of a single degree-of-freedom (SDOF) oscillator (Biggs, 1964b):
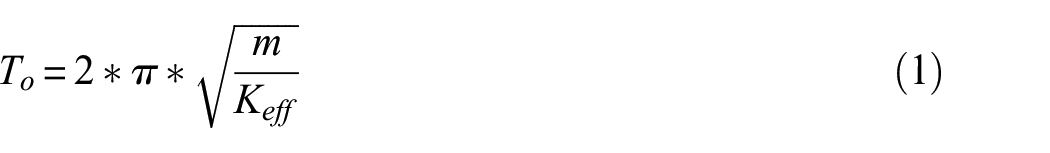
where
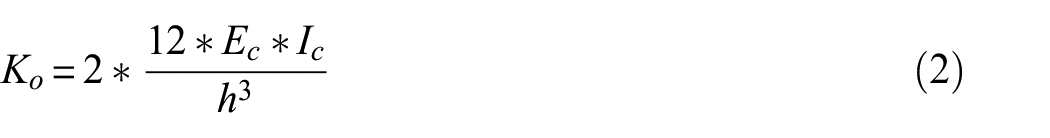
where
Equation 3 was derived by altering Equation 2 to consider the stiffness of frames with infill:
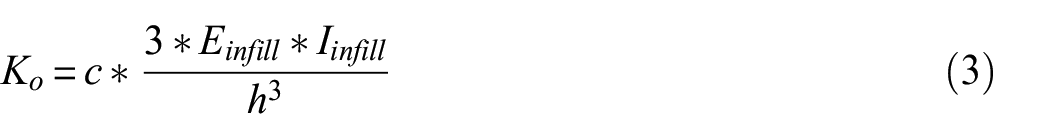
where
The effective lateral stiffness of the simulator platform was estimated as (Biggs, 1964a):
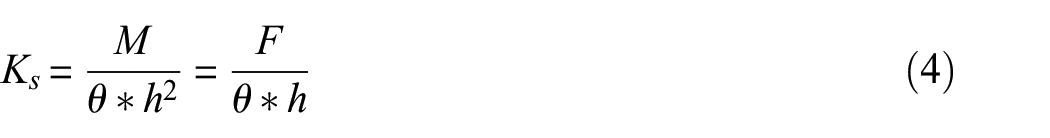
where
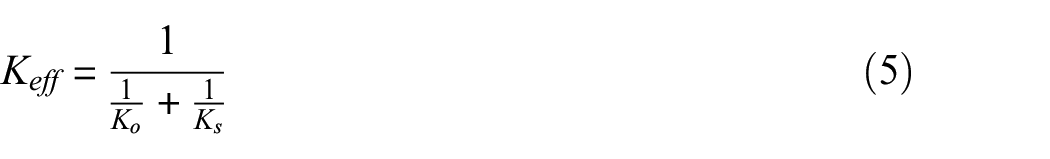
The method of Equations 1–5 is applicable to single- and multi-DOF frames. The measured period of the pristine bare frame during the first test of series F1-B was 0.20 s, only slightly larger than the 0.17 s estimated using Equation 1. Monical (2021) found that in applying Equation 1 to estimate the period of both single- and multi-DOF frames with and without masonry infill, the measured period was up to 30% larger than estimated for only reduced-scale, SDOF experiments. This discrepancy was attributed to the nontrivial effect of foundation flexibility on reduced-scale experiments.
In addition to initial period, a wall ratio (WR) for each frame was estimated using Equation 6, based on the priority index of Hassan and Sozen (1997). Test frames were not designed to accommodate slabs, so a projected floor area
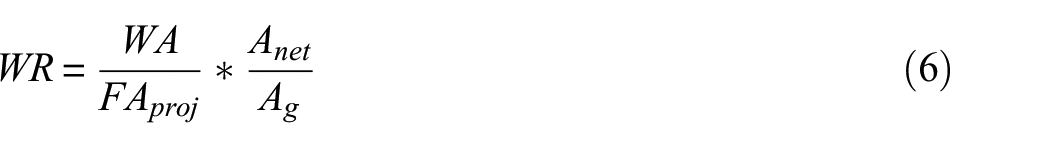
WA is the cross-sectional area of infill walls.
Database organization
Summarized in this section are the typical folders within each series of the open-access dataset, which is arranged according to the structure in Figure 11. General information on the construction of Frames 1 and 2, including reinforcement details and concrete cylinder test results, is in the “Test Frames Details” folder. A summary file of the peak readouts from all test runs is provided in the “Summary Spreadsheets” folder. For each of the 254 runs, these files provide the peak reading of variables, such as PGA, PGV, PGD, and lateral force, along with measured effective stiffness, effective period, and Fourier periods. All values are reported in imperial units.
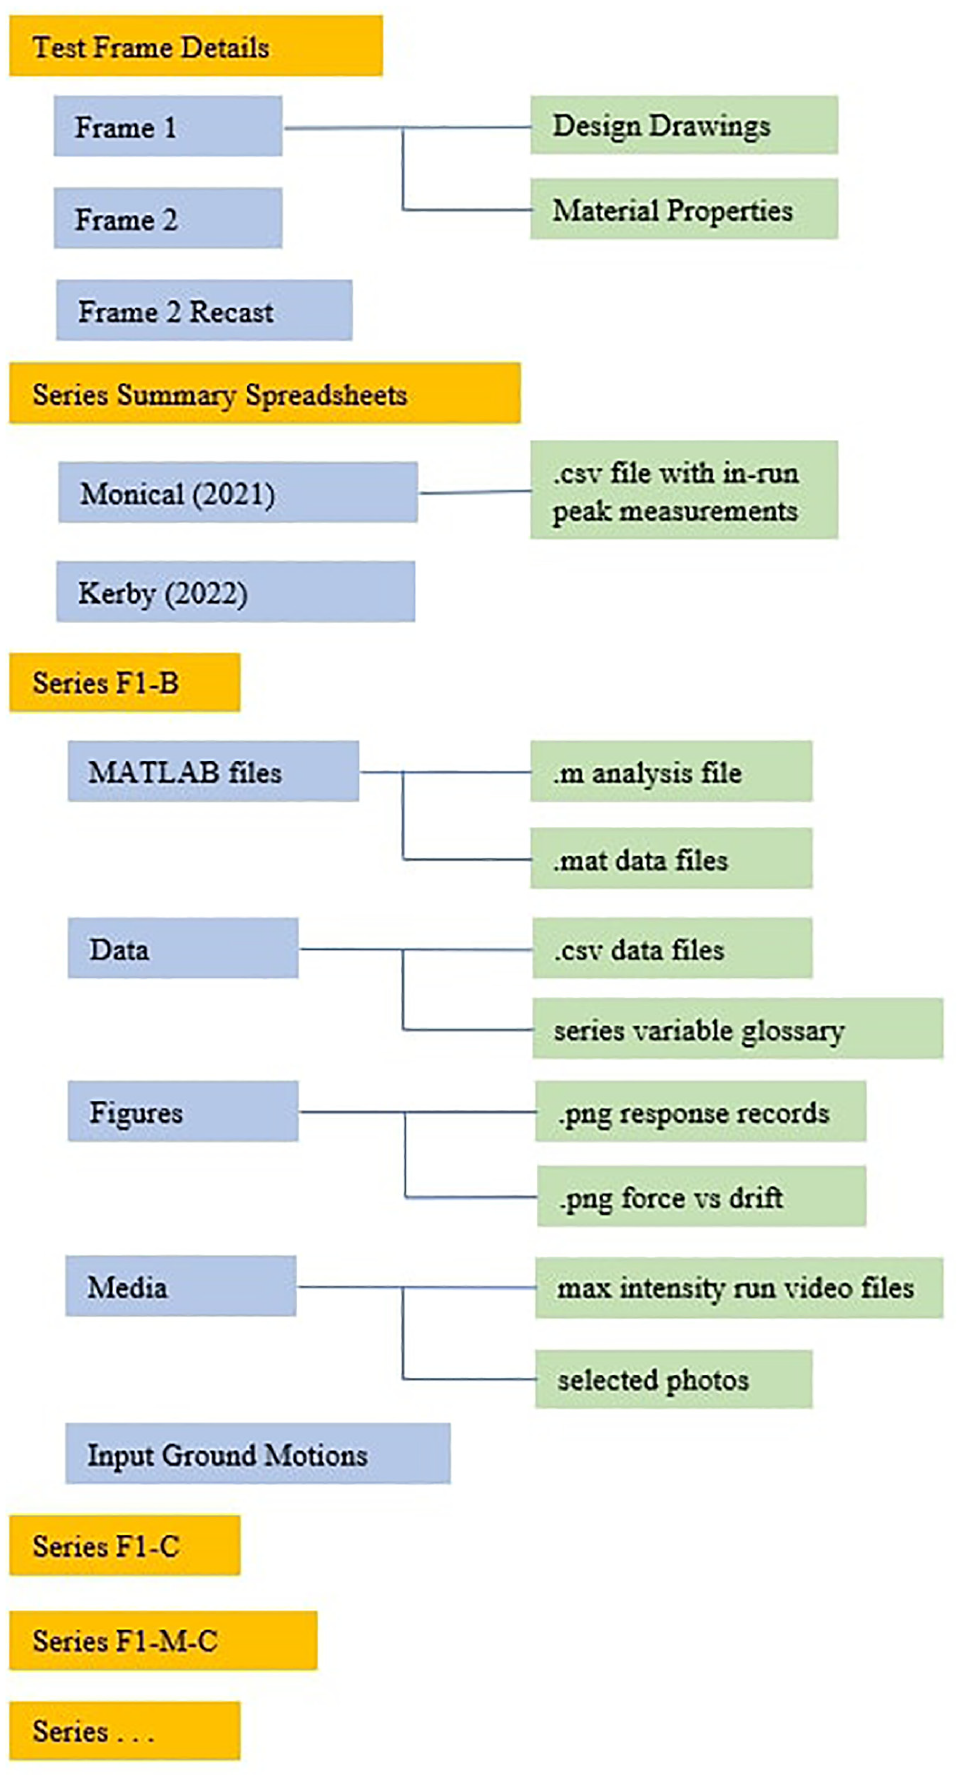
Dataset organization structure.
Finally, results from each series are provided in unique folders containing (1) MATLAB analysis files, (2) raw data by run ID, (3) figures by run ID, (4) media by run ID, and (5) input ground-motion files. Included in all folders are README files detailing the folder contents, units, sampling frequencies, and label definitions. The contents of each numbered folder will be further explained below.
MATLAB analysis
These folders provide the MATLAB analysis codes to process raw data and produce all relevant plots for a given run. Raw sensor data from each run are presented in .mat files. Unique analysis codes are required for each series because of changes in instrumentation. Given an input of a run ID, all analysis codes produce at least the following plots:
Input ground displacement (in.) versus time (s) (shown as compete and trimmed record);
Base acceleration (g) versus time (s) from one accelerometer on the simulator platform and four on the frame foundation beam;
Base velocity (in./s) versus time (s), integrated and corrected from base acceleration data;
Base displacement (in.) versus time (s), integrated and corrected from base velocity data;
Linear displacement spectra for the scaled input ground motion at 2% damping, calculated from base acceleration data, and the input target spectra;
Normalized Fourier spectra of roof and base response;
Force (kips) versus drift (in.) hysteretic plots;
DR (%) versus time (s).
In Fourier spectra produced from a run simulating RSN6-TC2, peaks at approximately 0.34 s periods are attributable to the ground motion and not purely characteristic of the specimens.
Data
A non-proprietary alternative to the .mat data files is provided in .csv format. Both the .mat and .csv files provide identical, raw data from each run. A series-specific variable glossary interpreting the sensor readings is in the raw data README file. The glossary describes the sensor name, type of data collected, location on the test setup, orientation relative to the frame’s north–south “in-plane” alignment, units of measurement, and sampling frequency. While some instrumentation details are universal throughout all 14 series (Figure 7a), the glossary of a given series (Figure 7b) may not apply to other series.
Figures
Plots of force versus drift and response histories are provided for each run (Figure 12). The x-axes of Figure 12 describe “in-run” drift, or the drift demands during a given run relative to the starting alignment of the test frame. Study of the accumulation of permanent drifts over series was termed “cumulative” drift and is summarized by Monical (2021). Force readings are taken from the load cell between the frame top beam and external mass. Acceleration and displacement histories for each run are presented for five in-plane readings plotted versus time (Figure 13). First, the base acceleration (g) is plotted from the northeast foundation beam ADXL accelerometer. Second, base velocity (in./s) from the trimmed and corrected integration of the northeast foundation beam ADXL acceleration history. Third, the base displacement (in.) from the foundation beam LVDT displacement. Fourth, story drift (in.) is plotted, derived as the average specimen top beam LVDT displacement minus the foundation beam LVDT displacement. Finally, lateral load (kips) as read from the top beam load cell.
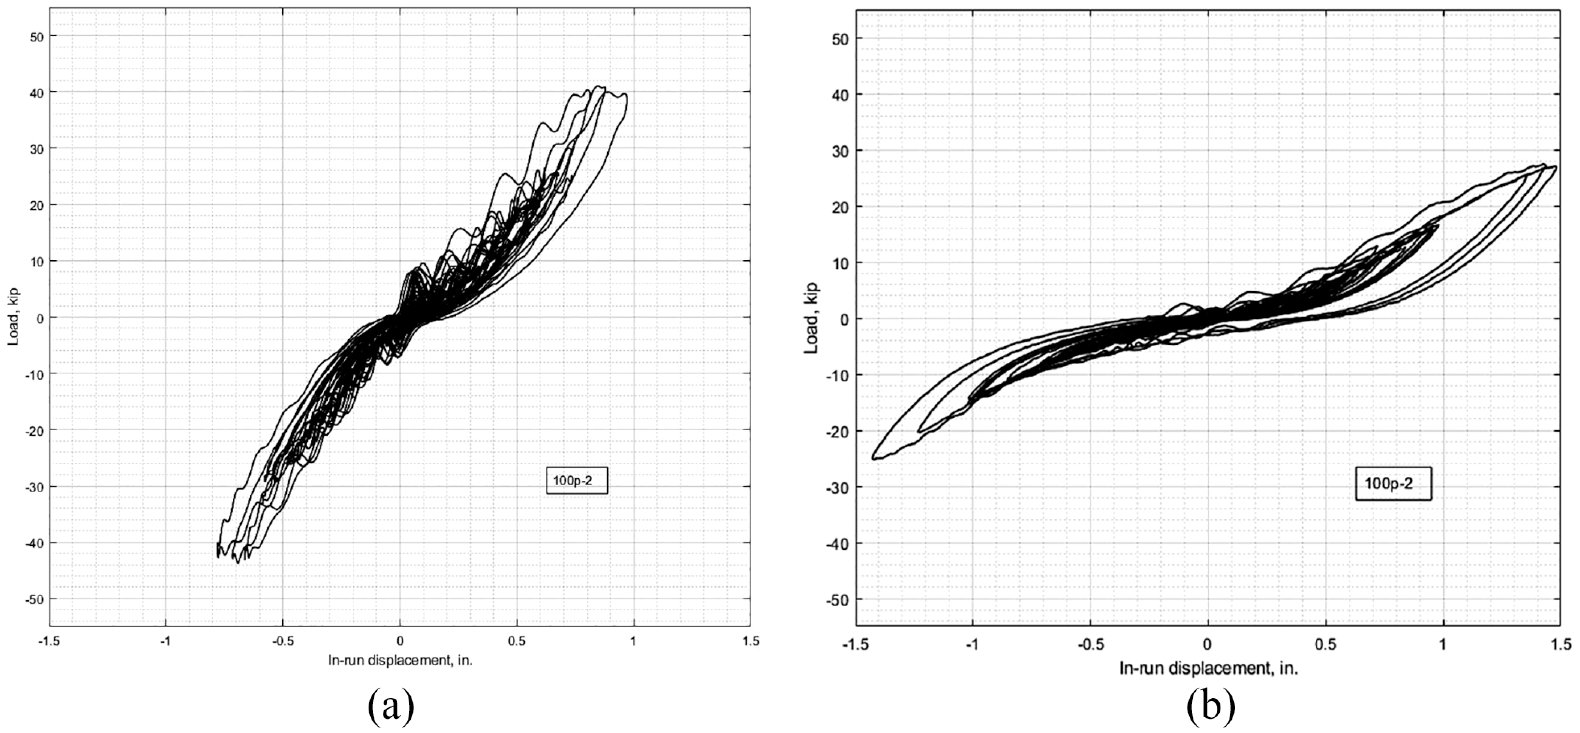
Force versus drift plots of peak intensity runs of (a) F2-R-C-1PB and (b) F2-R-C.
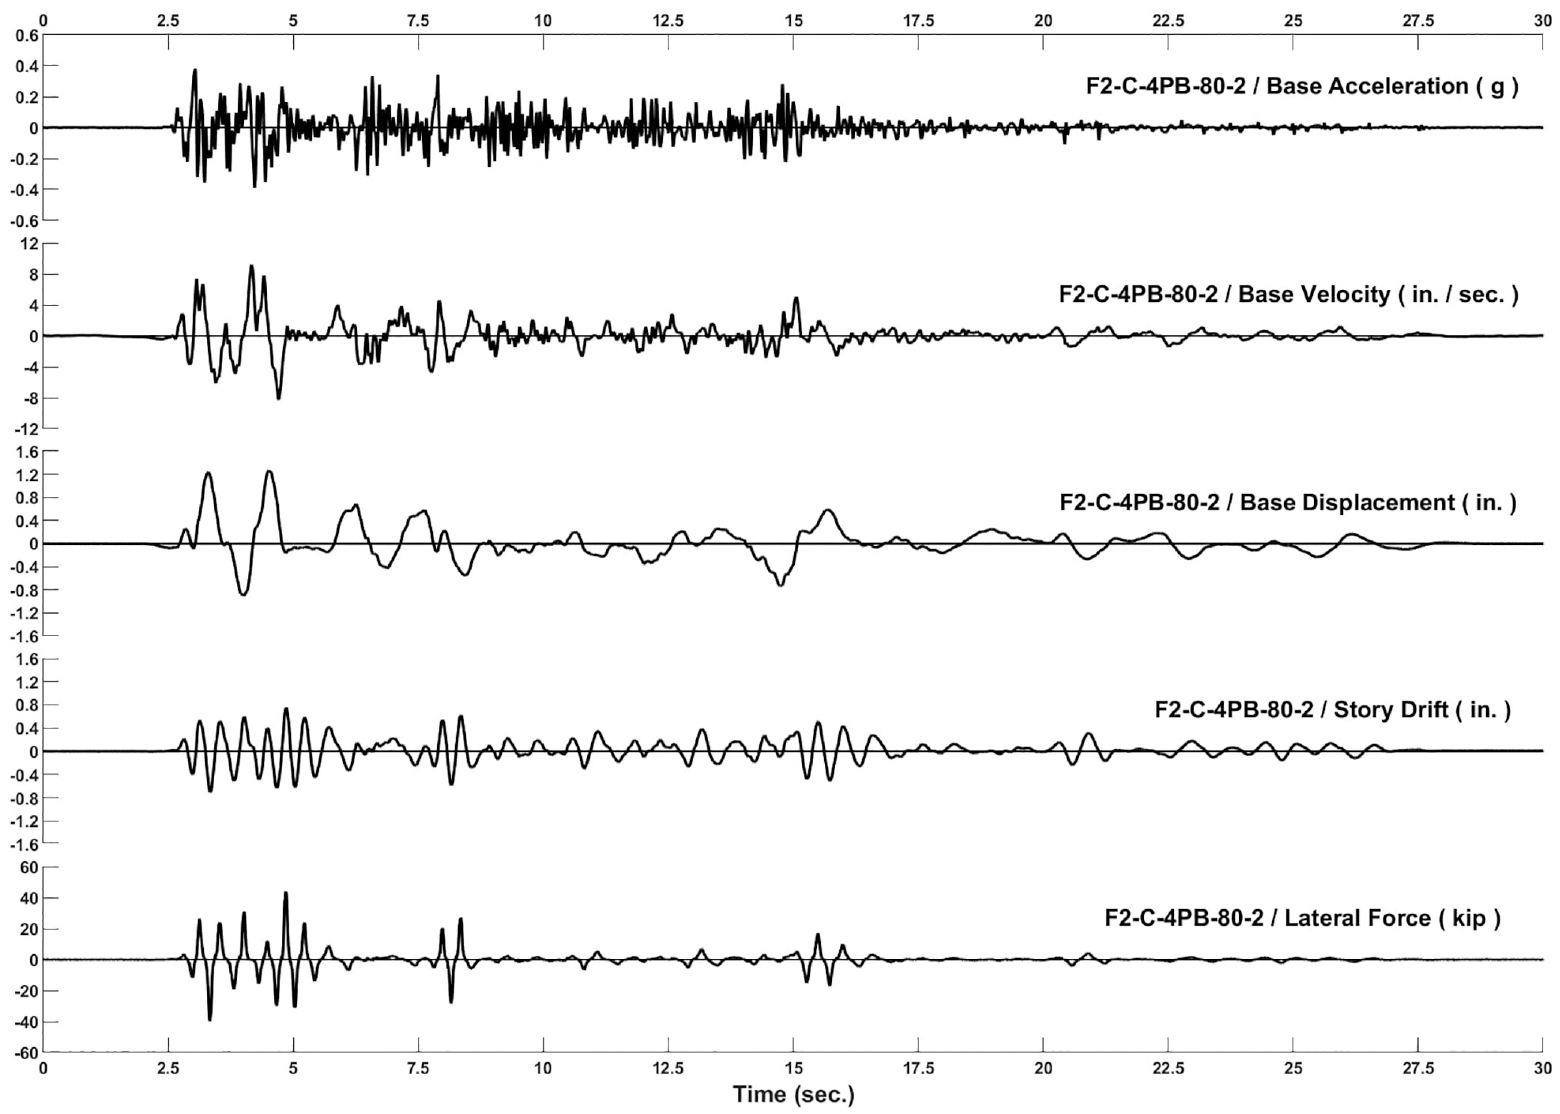
Response history of run F2-C-4PB-80-2.
Media
Videos of the maximum intensity simulation in each series are provided. Photos showing the condition of frame columns prior to series starts are included for visual reference of the damage states described in Table 2 and the repairs completed in Table 3. Photos of test specimens were taken prior to the series start or after the termination of the run for which the image is named when documenting mid-series damage accumulation.
Input ground motions
Displacement records of all input ground motions used are stored as .blk files. These ground-motion displacement records were the command input for the single simulator ServoRam. Files can be opened with Notepad++ and include minimum and maximum displacements, the time step, and ground-motion command displacement.
Summary and data use
These experimental programs produced a dataset of 254 dynamic tests completed at Purdue University. Tests were designed to study drift demands of retrofitted non-ductile RC frames. Retrofits included masonry infill walls, timber infill walls, and external post-tensioned confinement of columns. Test frames were subjected to in-plane simulations of unidirectional ground motions while connected to an external suspended mass. Timber infill and masonry infill resulted in measured drift demands ranging from one-half to one-third as large as demands measured for frames without infill (Figure 6). Sensors collected triaxial accelerations and in-plane displacements of the single-bay, single-story frames and forces on the frame top beam and in the simulator ServoRam. The open-access dataset provides the following information:
Frame construction details, drawings, and material properties;
Summary spreadsheets recording peak readings in all runs;
For each of the 254 runs,
○ MATLAB analysis files to process data and produce relevant plots
○ Data files in .mat and .csv formats
○ Force versus drift plots
○ Base and structural response histories
○ Media files including videos of peak intensity simulations
○ Input ground-motion records.
Conclusions drawn from the dataset are applicable within the following domain:
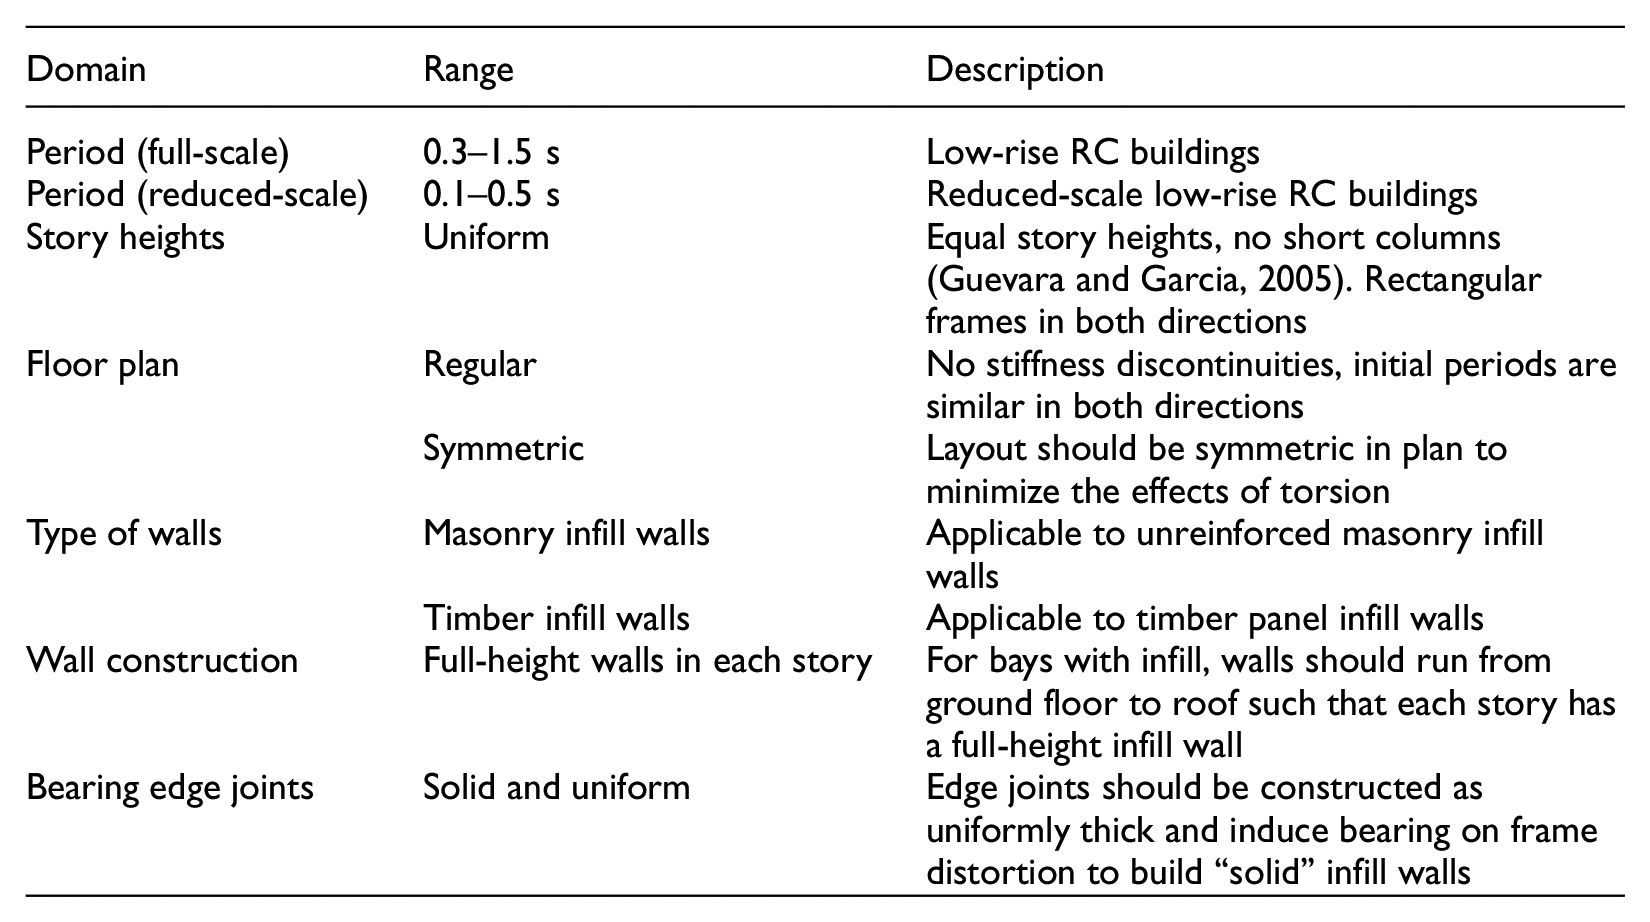
The combined dataset provides reference for the dynamic behavior of non-ductile RC frames with infill. Test series were contextualized in terms of fundamental period and WR such that the applicability of using infill walls as a seismic retrofit can be assessed in the field. Tests describe the drift demands of frames with and without infill during varied intensity ground motions, which can be used for validation of numerical models of seismic response before the infill drift capacity is reached. Extensive data on the effectiveness of external post-tensioned confinement during dynamic testing were collected. Tests included timber infills, which was a previously untested infill material. The dataset offers a quantitative analysis of a timber panel infills in RC frames. As mass timber construction gains popularity in the United States and worldwide, timber infill wall data represent a lower bound for the performance of cross-laminated timber (CLT) infill walls. The open-access dataset compiled from the experimental programs completed by Monical and Kerby is available at DOI: 10.5281/zenodo.6954967.
Footnotes
Declaration of conflicting interests
The author(s) declared no potential conflicts of interest with respect to the research, authorship, and/or publication of this article.
Funding
The author(s) received no financial support for the research, authorship, and/or publication of this article.