
Abstract
Seismic response analyses of structures have conventionally used the peak ground acceleration or spectral acceleration as an intensity measure to estimate the engineering demand parameters. An extensive shaking table test program was carried out on a quarter-sized advanced gas-cooled reactor (AGR) core model to investigate the global dynamic behavior of the system with degraded graphite components while subjected to seismic excitation. Evaluation of the most widely considered intensity measures, with respect to their capability for predicting the seismic response of an AGR core–like structure, is performed. Twenty intensity measures of 16 distinct seismic input motions are formulated and correlated, with experimental measurements describing the dynamic response of the reactor core model. Linear correlations are constructed for each intensity measure to statistically determine the best metric for predicting the seismic response of the AGR core model, and statistical analysis indicates that the acceleration spectrum intensity (ASI) is best suited to characterize and describe the structural demand of an AGR core-like structure when subjected to seismic loading. A response prediction tool is developed, based on empirically derived linear correlations, to estimate column distortions and determine the critical input motion for further experimental and numerical studies. Statistical analysis indicates that predicted column distortions, compared against direct experimental displacements, are significant, repeatable, and accurate.
Keywords
Introduction
In 1978 and 1979, a series of low-magnitude earthquakes occurred near the Virgil C. Summer Nuclear Power Station in South Carolina, USA, which exceeded the operating basis earthquake (OBE) design response spectrum at frequencies greater than 10 Hz. Similarly, an earthquake near the Perry Plant in Ohio also exceeded the OBE and safety shutdown earthquake (SSE) design response spectrum in 1986 (Reed and Kassawara, 1990). After these seismic events, the Electrical Power Research Institute (EPRI) initialized a research framework developing a rational criterion for determining when the OBE design limit has been exceeded at a nuclear power plant (NPP). This was essential to determine when further action is required in accordance with US Nuclear Regulatory Commission (USNRC) Reg. 10 CFR 100, Appendix S (USNRC, 1973). In EPRI (1988), multiple parameters, typically used in the literature to characterize earthquake ground motions, were reviewed to assess the validity of each intensity measure (IM), for example, peak ground acceleration (PGA) and Arias intensity. A new IM was proposed, the cumulative absolute velocity (CAV), to quantify the damage threshold of earthquakes for NPPs. EPRI (1988) recommends a two-level criterion for determining when an earthquake motion at the site has exceeded the OBE at an NPP. This constitutes a qualitative check of the response spectrum of the input ground motion followed by quantifying the CAV. The computational algorithm for CAV was further refined and standardized as CAVSTD in EPRI (1991) to exclude the contribution of non-damaging portions of long-duration, small-amplitudes acceleration records that extend for a long time after the strong ground motion.
Nguyen et al. (2020) performed a series of time history analysis for both non-isolated and base-isolated numerical models of an NPP structure and monitored the floor acceleration, floor displacement, and shear deformation of the lead–rubber bearings. Many IMs were evaluated to identify which best estimated the seismic damage of the NPP structure being studied. A series of non-linear time history analyses were performed to determine the efficient IMs representative of seismic performance and fragility evaluation of the reactor containment building (RCB) in the advanced power reactor 1400 (APR1400). Nguyen et al. (2021) identified the acceleration spectrum intensity (ASI) measure as one of the best metrics for RCB structures.
In March 2011, the Great East Japan Earthquake resulted in the automatic shutdown of 11 reactor units operating at the time of the earthquake in Fukushima Daiichi. The seismic damage indicating parameters of the acceleration time-history measurements at the plant sites were calculated and analyzed by Grant et al. (2017). It is suggested that the current CAVSTD threshold may be conservative by more than a factor of 10, indicating the potential for raising the threshold without introducing any significant additional risk to the US nuclear fleet. Reducing the conservatism in the shutdown criterion can prevent costly and unnecessary plant shutdowns due to non-damaging ground motions.
Campbell and Bozorgnia (2011) proposed a new IM, characterizing the CAV as CAVDP, which is an altered version of CAVSTD. A prediction algorithm was developed between CAVDP, and the geometric mean horizontal component of CAV, referred to as CAVGM. Furthermore, a relationship between the CAVDP, Japan Meteorological Agency and modified Mercalli (MMI) instrumental seismic intensities were empirically derived to correlate CAVDP with the qualitative descriptions of damage in the corresponding macro-seismic intensity scales (Campbell and Bozorgnia, 2012).
Advanced gas-cooled reactors (AGRs) are the United Kingdom’s second-generation reactor design and generate approximately 20% of the electricity supplied in the United Kingdom. Construction of the first AGR nuclear power station began in 1965, with seven further AGR stations being commissioned between 1976 and 1989 (Nonboel, 1996). The seismic assessment, performance, validation, and serviceability of these NPPs are critical factors for their operational lifespan. The AGR core reactors are now reaching the end of their operational lives (Bonivento et al., 2008). An AGR core consists of thousands of interlocking hollow cylindrical graphite bricks. The 16-sided reactor core is formed from vertical fuel, control, and cooling gas channels, which are typically composed of a stack of 11 graphite bricks and allow for the insertion of the fuel assemblies, the control rods, and the circulation of the carbon dioxide coolant. The graphite bricks not only provide structural integrity to the core but also act as the reaction moderator (Bradford and Steer, 2008). The bricks are interconnected with graphite keys to provide the core with significant stability, while maintaining the vertical alignment of the columns of stacked bricks. The reactor core contains 332 fuel channels and is surrounded by a graphite reflector and a steel shield. The graphite structure is held in position by a steel restraint tank that surrounds the graphite. This is supported by a system of steel plates (Nonboel, 1996).
Due to the nuclear reaction process, neutron and gamma radiation is generated, which bombard the graphite affecting its mechanical characteristics and properties, such as reducing the mass, stiffness, and tensile and compressive strengths (Young et al., 2019). The decay of such mechanical properties of the graphite bricks may result in crack propagation (Steer, 2005). This is one of the key issues that determine the operational life of a nuclear station (Bonivento et al., 2008). To ensure that reactors are still safe for operation, the reactor core is routinely monitored during planned outages. The cracking of graphite bricks due to fast neutron irradiation, temperature, and radiolytic oxidation observed during inspections of AGRs at later ages in their lifespan could potentially lead to increased distortion in the fuel and control rod channels during seismic events. The vertical alignment of these channels is important for the safe operation, maintenance, and shutdown of the core by maintaining the ability to insert control rods (Cowell and Steer, 2017). To support the seismic assessments of the graphite cores, an extensive experimental program was carried out in the Earthquake and Large Structures (EQUALS) Laboratory at the University of Bristol. A multi-layered array (MLA), experimentally simulating/representing a quarter-sized AGR core-like structure, was designed, developed, and tested under seismic excitations to provide validation evidence for the computational methods used in the seismic assessments. A number of build configurations with different types and distributions of cracked brick were tested to simulate/represent potential degraded core states.
In this study, the correlations between the seismic input motions and dynamic responses of instrumented stacked brick columns, representing a 50% cracked configuration (a close to end-of-life scenario) of a quarter-sized AGR reactor core–like model, are constructed using direct experimental measurements. Twenty earthquake IM metrics are evaluated, qualitatively and quantitatively, comparing each one to identify which measure best characterizes and represents the structural demand of the AGR core model structure. A software tool is developed to predict the column displacement deformations of stacked brick columns typically housed in an AGR core structure when subjected to seismic loading. After an earthquake, the tool could be used to make a rapid determination of the degree of severity of the seismic event in terms of assessing the response of the AGR reactor core and determining the damage potential.
This article aims to answer the following research questions: (1) Which seismic/earthquake IM, currently used in the literature and in practice, best characterizes the structural damage/demand of an AGR core–like structure? and (2) Is it possible to predict the global column displacement distortions/profiles using empirically derived linear prediction maps?
MLA of AGR core and the shake table tests
Description of the test specimen
To study the seismic performance of a degraded AGR, a quarter-sized model of an AGR core, namely the MLA, was developed in the EQUALS Laboratory at the University of Bristol. The design, construction details, keying system, and rocking features of the MLA can be found in Dihoru et al.’s study (2017). Miniaturized sensor technology was employed to capture and monitor the intricate nonlinear dynamical response of the MLA when subjected to dynamic loading. The acquired experimental measurements have been used to verify and validate software tools that are capable of predicting AGR core behavior.
The MLA has dimensions of 2.497 m × 2.497 m × 1.731 m (b × w × h) and a mass of 8.5 tons. It comprised eight layers representing the inner 10 octagonal rings of an AGR core. The base layer is fixed to a restraint frame. The outer octagonal ring, compromised of restraint bricks, is fastened to the restraint frame, which is build-up as a practically rigid aluminum Warren truss (Figure 1). The restraint frame has a natural frequency above 35 Hz, so it behaves rigidly at the seismic test frequencies (0.01–25 Hz) and transmits the motion of the underlying shaking table to the internal components both horizontally (across the base) and vertically (up the walls). The bricks in the nine central rings and the top seven layers of the MLA are interconnected through a radial keying system. In an AGR core, this allows free radial movement of the bricks during thermal expansion and contraction of the surrounding steel structures and provides reaction forces to lateral movement once the clearances between the keys and the keyways have been taken up. The MLA is designed to reproduce the dynamic behavior of the lower eight layers of an AGR core–like structure. For the MLA, the model fuel bricks are referred to as lattice bricks, while the keyed and unkeyed interstitial bricks are referred to as interstitial and filler bricks, respectively. A plan view of the MLA is displayed in Figure 2a. A vertical section and detail are also shown to demonstrate the keying system and integration of the interstitial and lattice columns in Figure 2b. The MLA model comprises 301 interstitial and 284 lattice columns. A lattice column comprises seven vertically stacked lattice bricks on top of each other. Six of these are full-sized bricks, while the top layer brick is two-thirds in brick height. Interstitial brick columns are stacked alternately with individual filler and interstitial bricks to form the full interstitial column height. Seven interstitial bricks, six full-size filler bricks, and a hybrid brick, a slightly shorter filler brick due to the geometric constraints of the base plate, make up a single interstitial column.
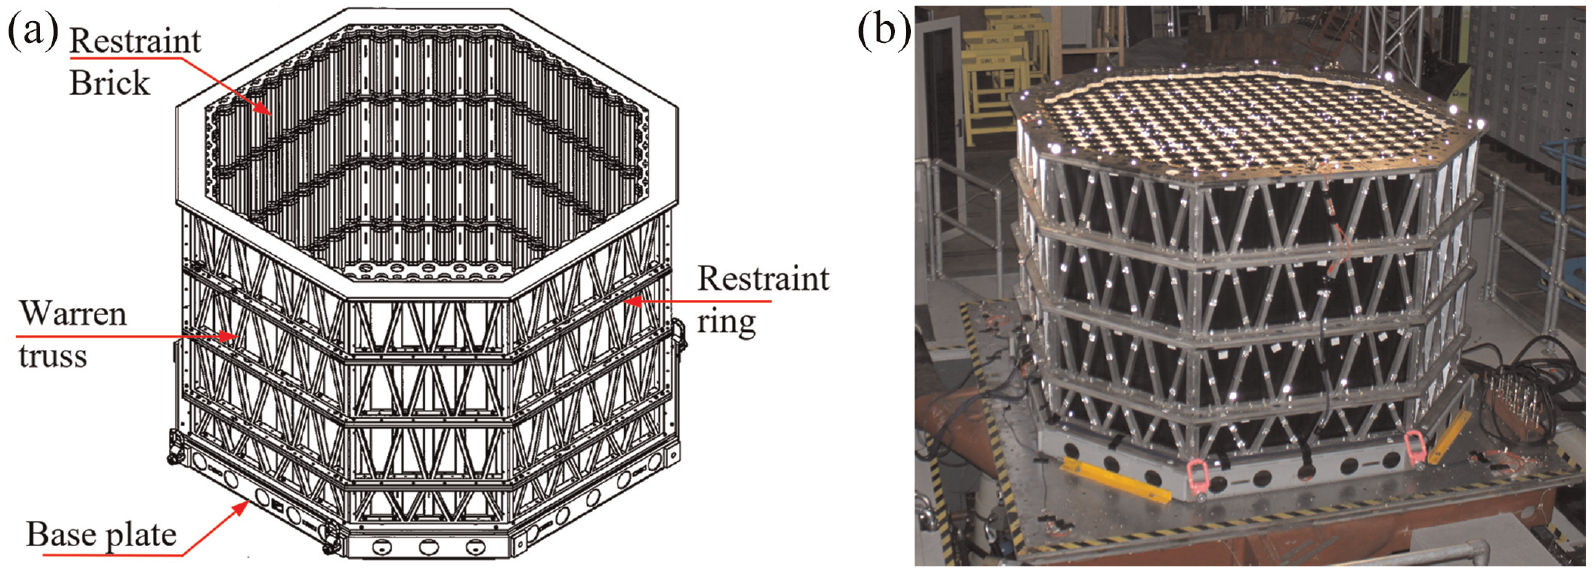
Quarter-sized reactor core model: (a) restraint frame and (b) MLA model on the shaking table.
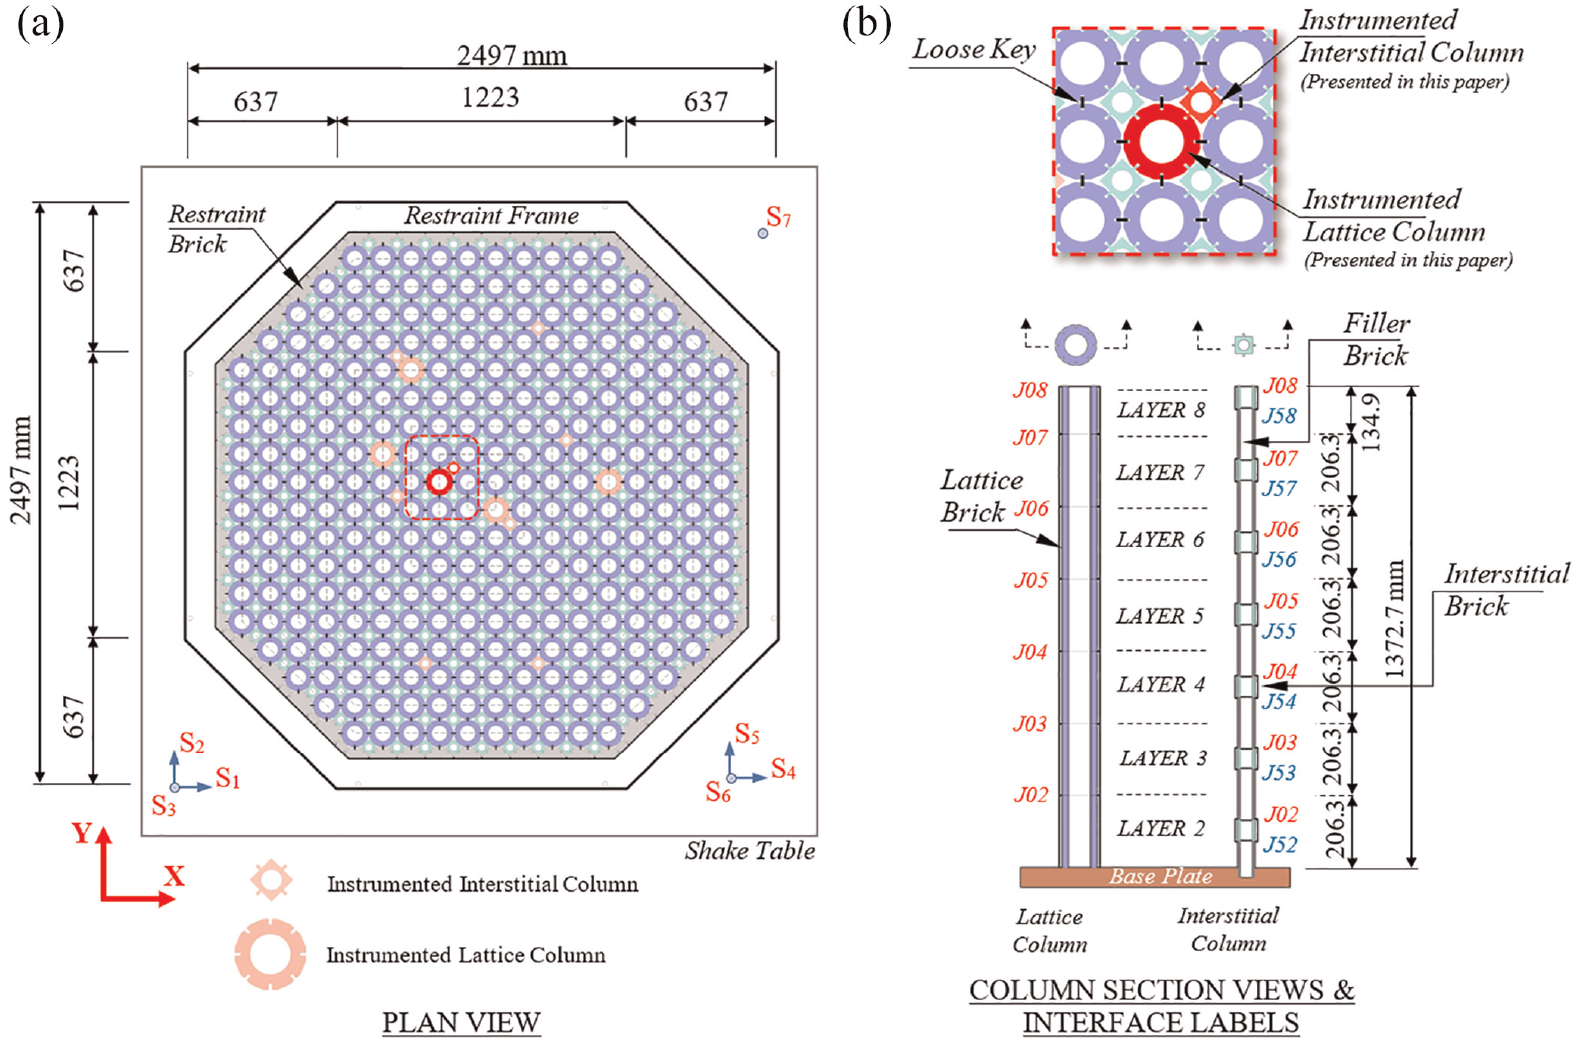
MLA dimensions: (a) plan view and (b) layout of interstitial and lattice columns.
Graphite bricks age and degrade because of neutron irradiation, temperature, and radiolytic oxidation. This ultimately causes bricks to crack later in the life of AGR cores which are starting to approach the end of their design lifespan. To include the effects of cracking in the seismic response of the quarter-sized MLA model, various types of cracked brick models were developed. These simulate different severities in cracking that a brick may exhibit over time, to cover a broad range of cracking scenarios. The designed and developed cracked brick types used in the MLA are (1) doubly crack bricks (DCBs), (2) symmetric/asymmetric triply cracked bricks (TCBs), and (3) symmetric/asymmetric quadruply cracked bricks (QCBs). These are shown in Figure 3.
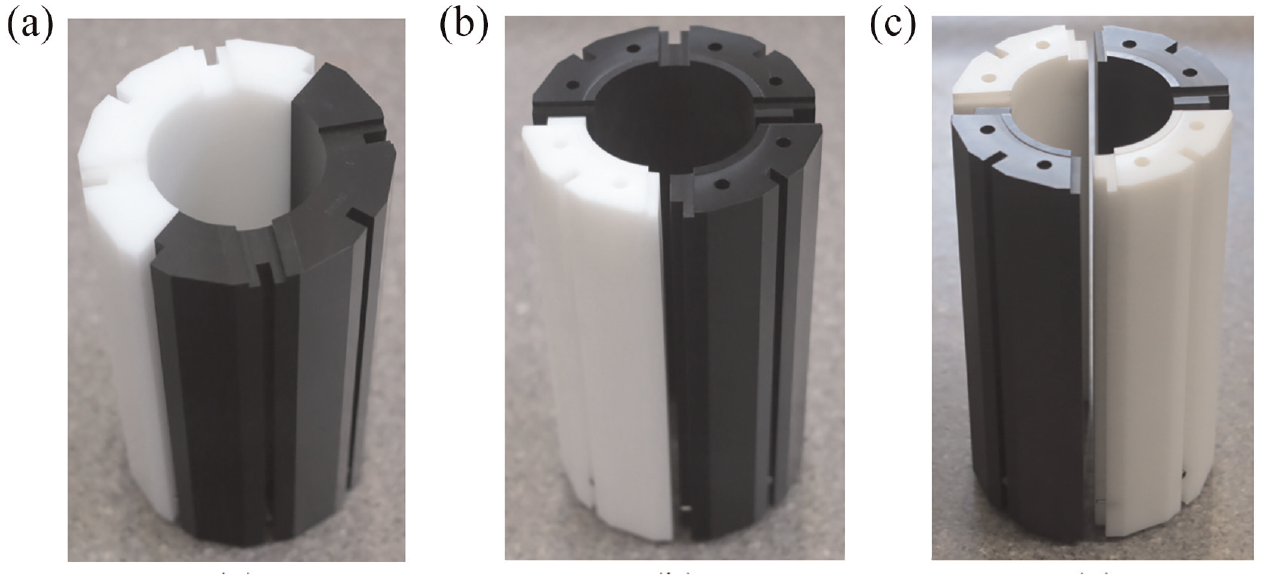
Degraded crack brick types used in the experimental multi-layered array: (a) doubly cracked, (b) triply cracked, and (c) quadruply cracked.
The quarter-sized MLA model allows the testing of a variety of degradation scenarios including various types of cracked bricks observed during the routine inspection of the core. In this study, a 50% cracked array configuration was used as an extreme end-of-life scenario. A total of 570 cracked bricks were used for this MLA build configuration. The cracked bricks comprised of 341 DCBs, 157 TCBs, and 72 QCBs which were distributed over layers 4–7. This corresponds to a breakdown of 50% intact bricks, 30% DCBs, and 20% multiply cracked bricks installed over the active layers of the array.
Input motions
A number of seismic input motions were applied to the MLA during the experimental campaign of the 50% cracked array build configuration. The site-specific earthquake motions primarily considered in the computation of input motions have a 10–4 probability of occurrence per annum. They are referred to as Hinkley Point B (HPB), Heysham 2/Torness (HYB/TOR), and Hartlepool (HRA). These are a few of the several AGR core power stations located in the United Kingdom. The secondary response acceleration time histories have been extracted at the base level of the reactor cores from the finite element models, which include a representation of the pre-stressed concrete pressure vessel (PCPV) and the soil structure interface. The time history of the resulting secondary response at the core boundary was quarter-scaled by reducing the time intervals by half to comply with the quarter scale model geometry. The HPB input motion, with 0.4 g peak acceleration, was scaled to forcing amplitudes of 0.5–0.7 g to investigate the core response for higher seismic excitation levels. An input motion which is compatible with the required response spectrum (RRS) in BS EN 1998-1 (European Committee for Standardization (CEN), 2004) is also included.
Principia Mechanica Ltd (PML) spectra were developed for use as broad-band spectra in the design of UK critical facilities by PML in 1981. They are developed from the knowledge of the anticipated PGA at the site and the ground conditions. For this study, this motion has been anchored to the 10–4 per annum probability of exceedance PGA values. PML input motions are computed to investigate a range of core boundary excitations based on the updated Hinkley Point B and Hunterston B (HNB) power plants’ PCPV. A range of different properties for the springs and dampers representing the rock–structure interaction (RSI), bearings pads, and fill are considered. The lower-bound (LB), best-estimated (BE), and upper-bound (UB) properties were assigned for all three parameters and used to calculate the secondary response at the base of the reactor core. The INT-1 motion was computed from the UB properties for RSI and bearing parameters and the LB properties for the fill. In addition to this, some factored input motions were computed for the UB model by increasing the stiffness with a coefficient and decreasing the damping properties. In total, 16 input motions were used to excite the MLA to provide the responses considered for analysis and seismic characterization in this study. These input motions are representative of the motions used for AGR seismic assessments, and they contain key features which are detrimental to the array, promoting key disengagement. The motions are summarized in Table 1, providing the associated PGA, velocity, and displacements of the input excitation.
Input motion data set
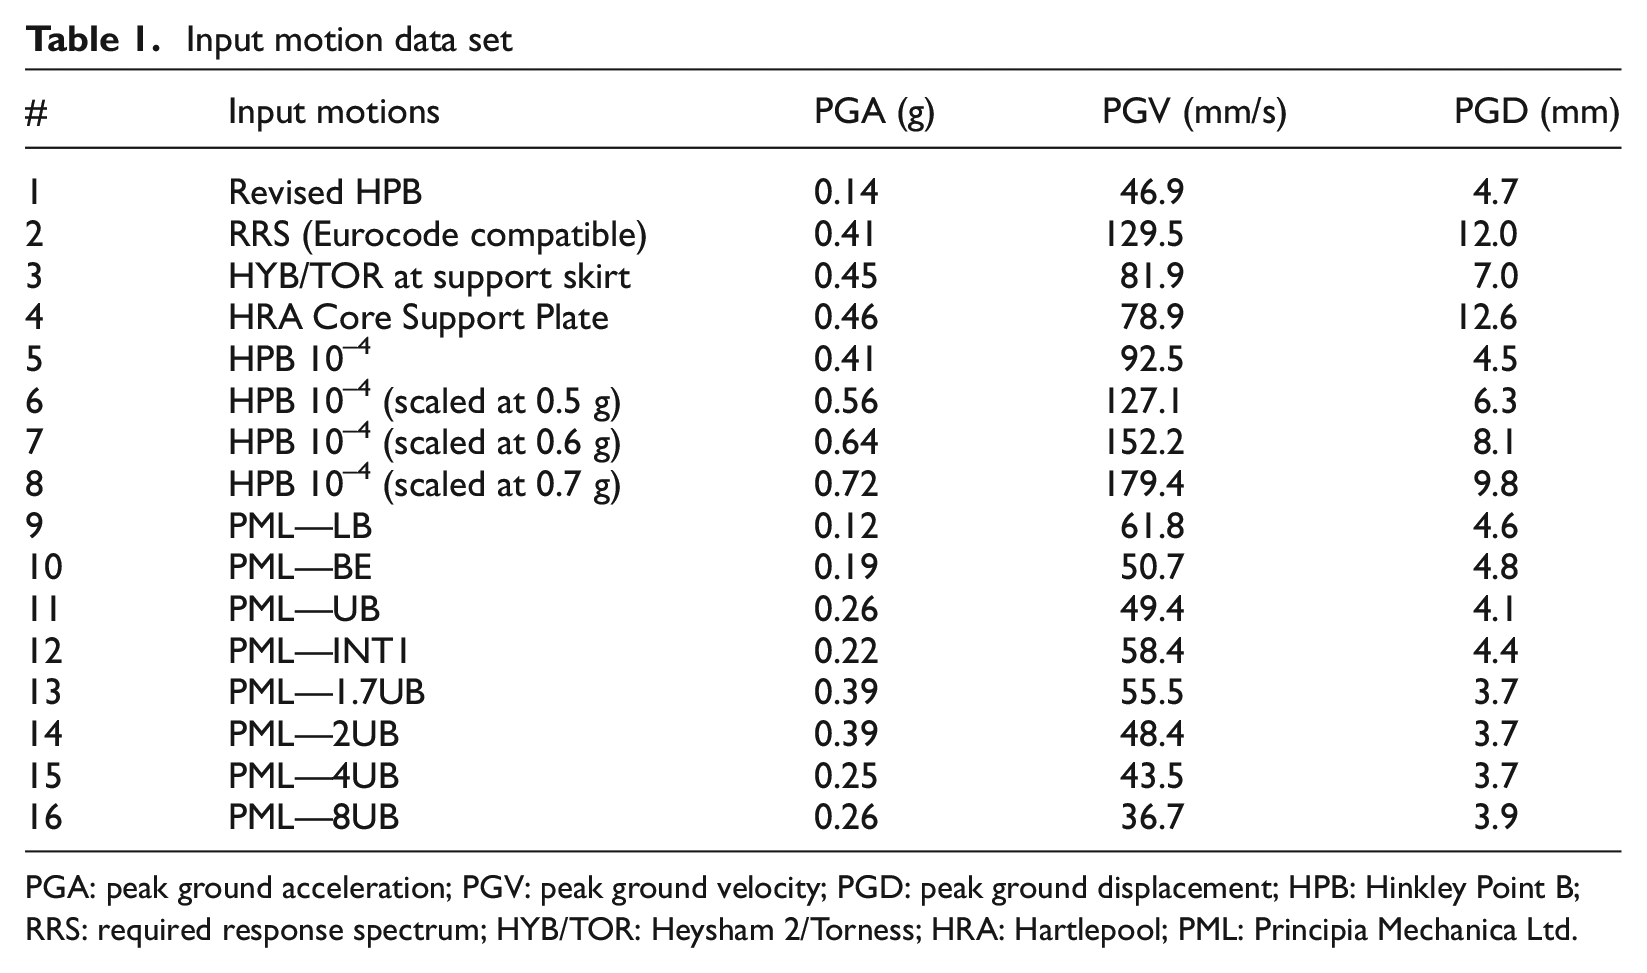
PGA: peak ground acceleration; PGV: peak ground velocity; PGD: peak ground displacement; HPB: Hinkley Point B; RRS: required response spectrum; HYB/TOR: Heysham 2/Torness; HRA: Hartlepool; PML: Principia Mechanica Ltd.
The acceleration response spectra (5% damping), Sa, of the input motions over the frequency bandwidth of 0.1–100 Hz are shown in Figure 4. Frequencies greater than 10 Hz are considered to be high frequency in EPRI (2007, 2017). Furthermore, OBE exceedance is only checked for spectral values below 10 Hz in Regulatory Guide 1.166 (USNRC, 1997), recognizing that energy content above 10 Hz is non-damaging. In this study, 10 Hz is therefore considered as the threshold between low- and high-frequency content on the spectral acceleration (SA) plot, so the selected input motions have been grouped as containing low- and high-frequency content and high-frequency content only. This wide range of input motions, their associated frequency content, and observed peak accelerations enabled the exploration of the fundamental dynamic behavior of the AGR core model. Moreover, they provided good insight into the response mechanics of the physical system.
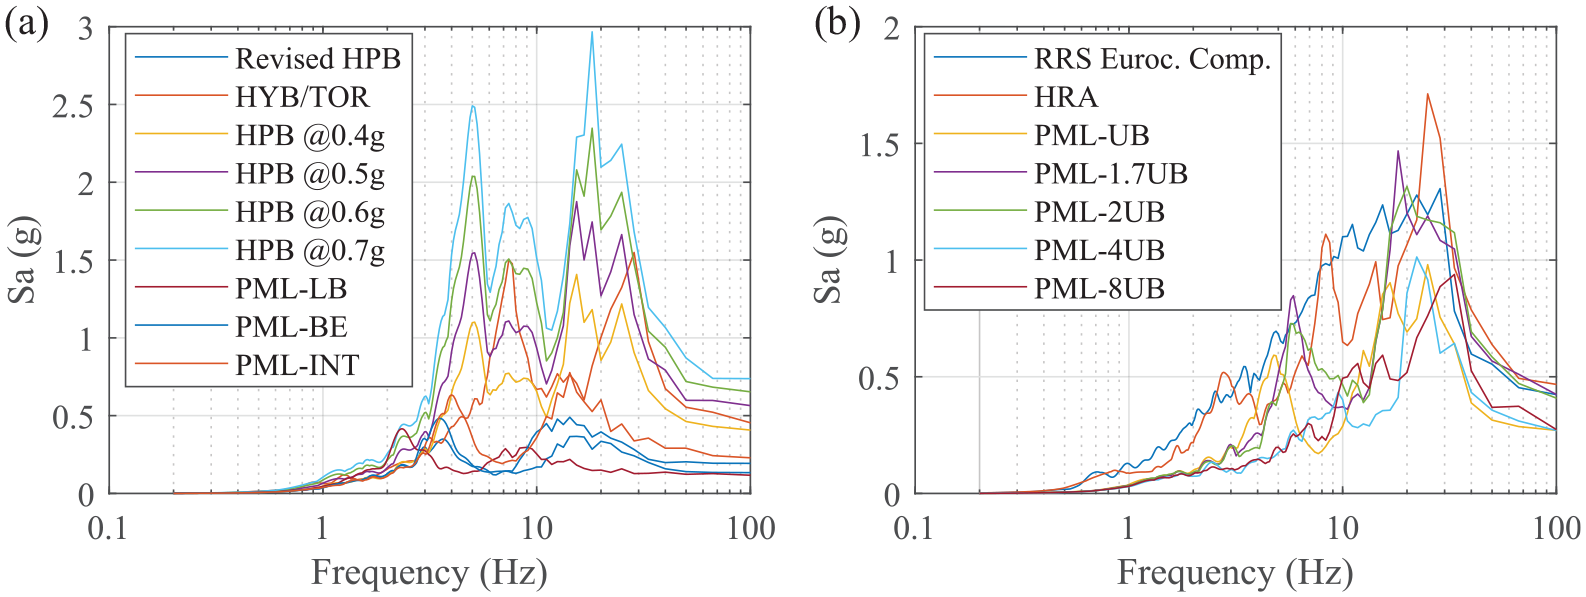
Response spectra of the input motions: (a) low- and high-frequency content and (b) high-frequency content only.
Measurement systems
Eight interstitial and six lattice columns were instrumented to record the 6-degrees-of-freedom (DoF) motion of the vertically stacked brick columns acquiring measurements at the brick-to-brick interfaces under seismic loading. For this purpose, several interface measurement techniques and systems were developed (Dihoru et al., 2021; Oddbjornsson et al., 2021). An interstitial column comprises 7 filler bricks and 7 interstitial bricks, constituting 13 brick-to-brick interfaces. These interfaces are denoted J0x and J5x for the top of the interstitial and the top of the filler bricks, respectively, where x is the layer number (see Figure 2b). To enable measurement of the interstitial brick interface motion in 6 DoF, a set of two bi-axial Hall effect sensors were mounted in three corners on both the top and bottom faces of each filler brick. Opposing magnets were installed in the corresponding three corners of the interstitial bricks. Such a configuration, consisting of six bi-axial Hall effect sensors and three magnets, produces sensor voltages that can be converted into 6 DoF of the filler-to-interstitial brick interface (Figure 5). Refer Oddbjornsson et al.’s study (2021) for full details on the calibration procedure and evaluation of 6 DoF motions at an interstitial brick interface.
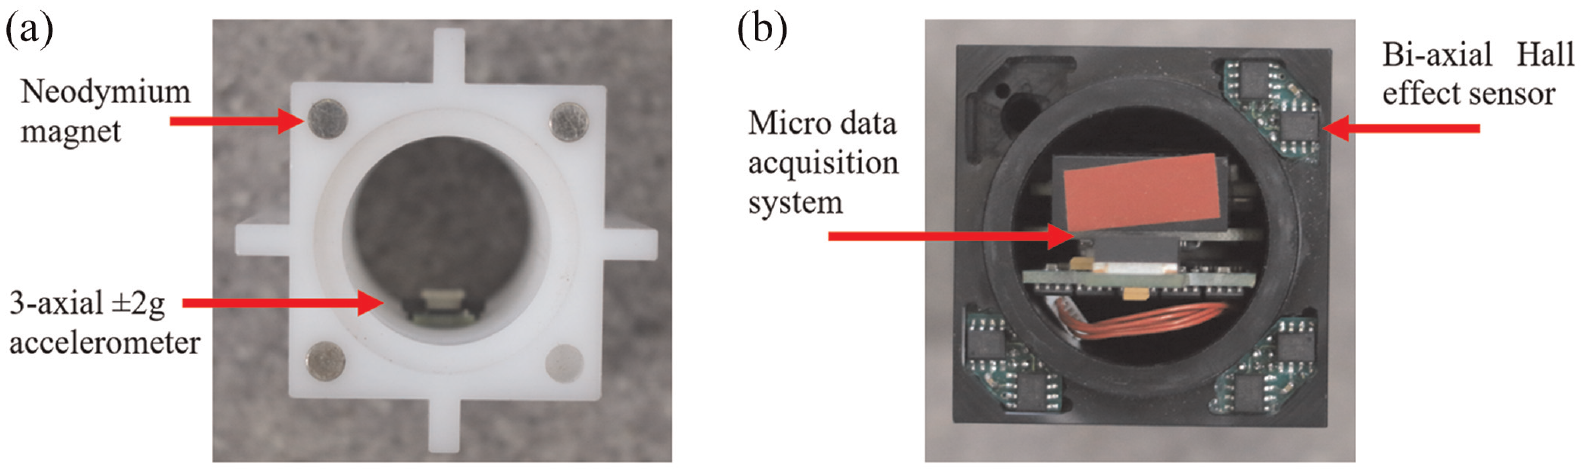
Instrumented interstitial and filler bricks: (a) instrumented interstitial brick with magnets and (b) instrumented filler brick with micro-data acquisition system.
A lattice column consists of seven active lattice bricks corresponding to seven brick-to-brick interfaces, J02-J08, in Figure 2b. Four linear conductive potentiometric transducers were employed on the bottom face of the instrumented lattice bricks to measure the relative interface motions. This configuration enables the evaluation of the local roll and pitch rotational motion at each brick interface using the single-axis displacement recorded by the linear conductive potentiometers (LCP) (Figure 6). Mean vertical displacement measurement is computed using all four LCP sensors.
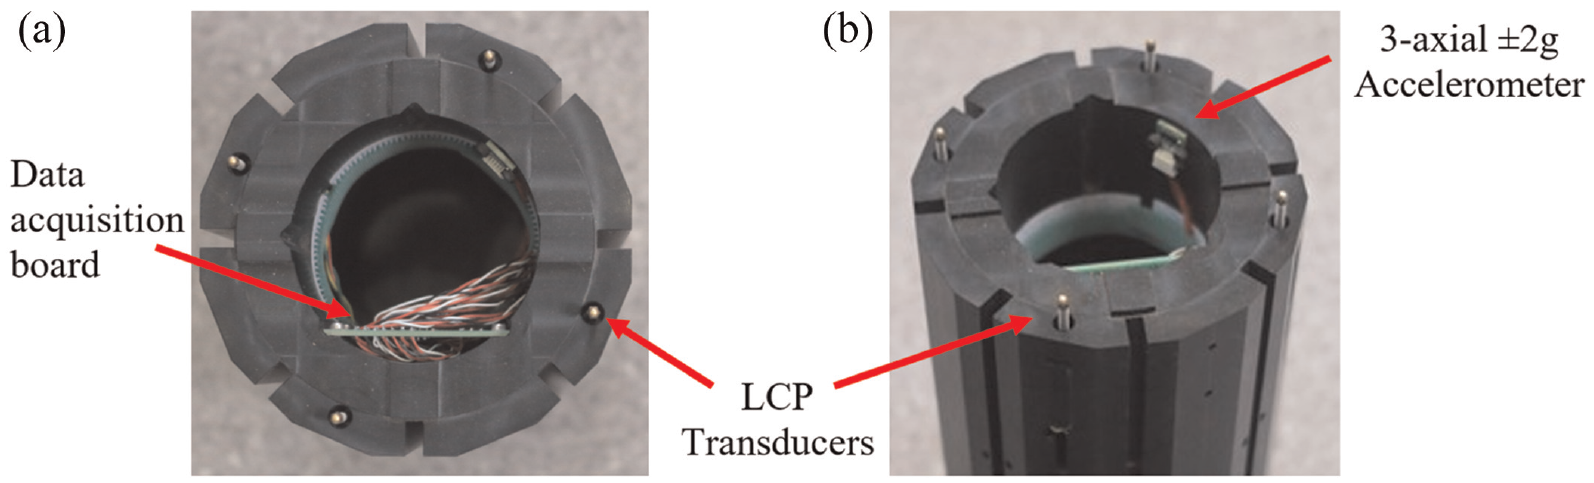
Lattice brick instrumentation configuration: (a) LCP positions at the bottom face of the brick and (b) side view of the instrumented brick.
The local brick interface displacement measurements are converted into a global frame of reference, corresponding to the shaking table coordinate system illustrated in Figure 2, using an Euler mechanics procedure. This converts the rotational contributions, at each brick interface, to translational axes/DoFs (x, y, z) and sums these up in the column. This enables the column shape distortion profiles to be evaluated. Refer White et al.’s study (2022) for details on the column shape distortion profile procedure.
Each filler and interstitial brick in the instrumented interstitial columns was also equipped with a three-axis accelerometer, while each lattice brick in the instrumented lattice columns contained two off three-axis accelerometers at the top and bottom of the bricks (see Figures 5 and 6). The acceleration recordings of the bricks were used to explore the dynamic properties of the array.
Shake table tests
The shaking table tests of the MLA model with 50% cracked bricks in layers 4–7 were conducted on the 6 DoF shaking table in the EQUALS at the University of Bristol. The seismic input motions given in Table 1 were applied as a single-axis motion in 0°, 45°, and 90° directions, corresponding to x, combined x–y and y input motions (see Figure 2 for the global shaking table coordinate reference system), to acquire experimental results for comparison against finite-element model outputs such as brick-to-brick displacements and column profiles. The shaking table acceleration input motion was tracked using seven uni-axial Setra 141a accelerometers (S) that were mounted on the top surface of the shaking table. The direction and location of the accelerometers are given in Figure 2. The main objectives of the experimental studies were to reduce the uncertainty in the numerical modeling tools developed, while also investigating the interactions between keys and keyways.
In this article, only the x-axis input motion results and analyses are presented, but similar results were obtained for the input motions in the other directions.
The experimental results of one instrumented interstitial and one lattice column are presented in this article. Forensic analysis and investigation of each column are performed and presented. Both columns, which are marked in red in Figure 2, are located in the central region of the MLA, where the peak column/brick displacements were measured. Observations in other instrumented columns, moving from the middle of the array toward the boundaries, exhibited decreasing displacement amplitude responses. The typical instrumented lattice column displacement profile and the interface time histories along the column height are illustrated in Figure 7 for HPB 10–4 input motion in the x-direction with a forcing peak acceleration amplitude of 0.41 g.
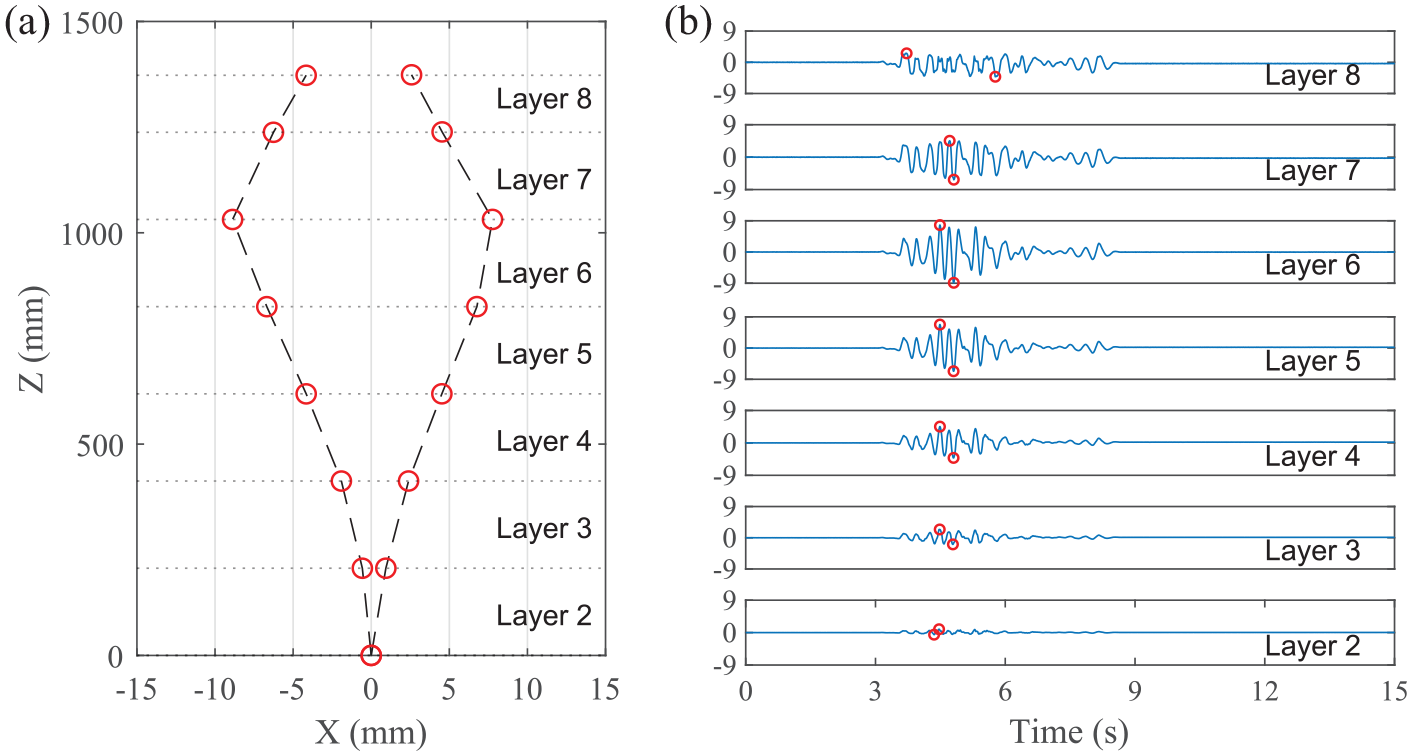
Lattice column displacement/distortion profile for HPB 10–4 x-direction input motion with a peak acceleration amplitude of 0.41 g: (a) max amplitude envelope curves of the column displacements representing the column distortion profiles and (b) displacement time histories of the column interface displacements.
The maximum column shape displacement envelopes, for both the instrumented lattice and interstitial columns, are displayed in Figure 8 for all 16 seismic excitations in the x-direction. The maximum relative displacement amplitudes of the lattice and interstitial columns were observed between layers six and seven for all input motions. Note that cracked bricks are located in the MLA between layers 4–7, promoting large displacement responses of the vertically stacked brick columns.
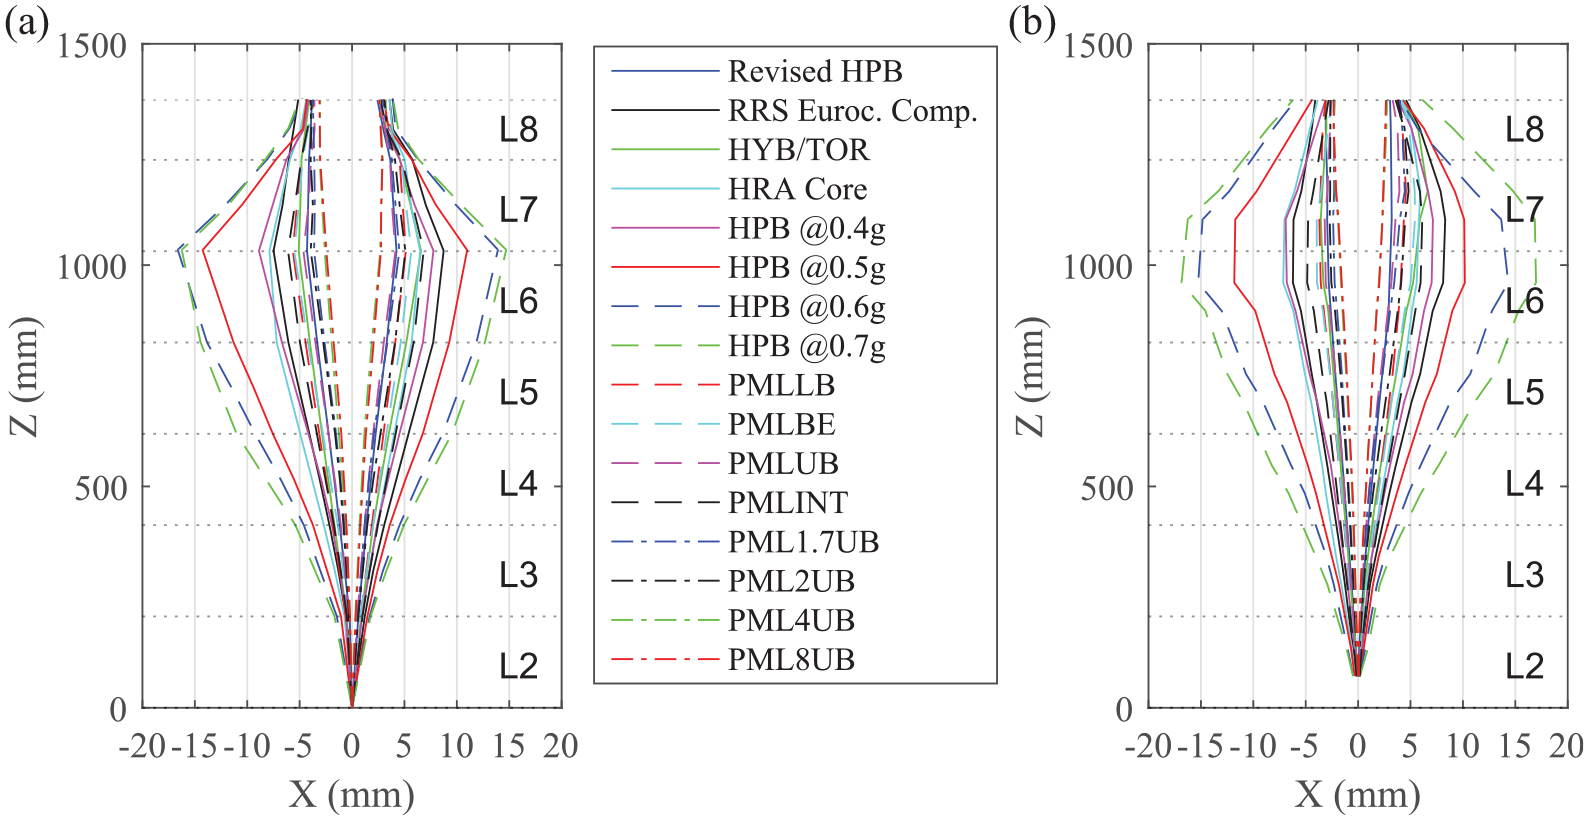
Column shape displacement profiles on x-direction: (a) lattice column displacements and (b) interstitial column displacements.
The stacked brick column displacement response occurs in the same direction as the input seismic excitation. This corresponds to an input seismic excitation in the x-direction resulting in significant dynamic responses of the columns in the x-direction. The column responses in the y-direction were very much smaller. Residual displacement analysis was performed for each test, comparing the displacements of the columns at the end of the recorded time histories relative to their initial conditions. The maximum residual displacements in both interstitial and lattice columns were approximately 0.05 mm, corresponding to 0.5% of the maximum relative displacements. This indicates that the brick columns are effectively self-centering and return to their initial position after being subjected to seismic loading.
IMs
As part of the seismic assessment of an NPP, rapid determination of the degree of severity of an earthquake is crucial. Ground motion data are required to evaluate whether the plant must shut down as a result. The reactor core is one of the most important components of an NPP. Therefore, it is vital to identify the optimal earthquake IM that best characterizes the seismic loading and the reactor core’s response. This is necessary for efficient and reliable decision-making following a seismic event.
Seismic analysis procedures and seismic design codes have commonly used the PGA and/or SA as the seismic IM for use in the prediction of structural response. These IMs are also commonly used in the seismic fragility assessment of critical infrastructures such as bridges, dams, tunnels, and so on. However, in recent decades, questions have been raised regarding the reliability of the use of these measures and the information they provide when considered alone (Cao and Ronagh, 2014a, 2014b; Chen and Wei, 2013; Ghayoomi and Dashti, 2015; Yaghmaei-Sabegh, 2012; Zhang et al., 2015). As an example of this phenomenon, the peak relative interface displacements of lattice and interstitial columns that were recorded in the shake table tests of the MLA are given in Figure 9 for PM-LB, PM-BE, and PM-8UB seismic excitations. The peak displacement for the lattice column was measured as 5.64 mm at the interface between layers 6 and 7 (i.e., interface J06 in Figure 2b) for PM-LB input motion, which has a 0.12 g PGA value. The corresponding peak displacements at the same interface were recorded as 5.52 and 2.45 mm for PM-BE and PM-8U, which have 0.19 and 0.26 g PGA values, respectively. Similarly, peak displacements in the interstitial column were recorded as 6.35, 6.25, and 2.89 mm for PM-LB, PM-BE, and PM-8UB input motions at interstitial interface J07 (see Figure 2b), respectively. This is a significant indication that the MLA response depends not only on the amplitude of the input motion but also on the frequency content.
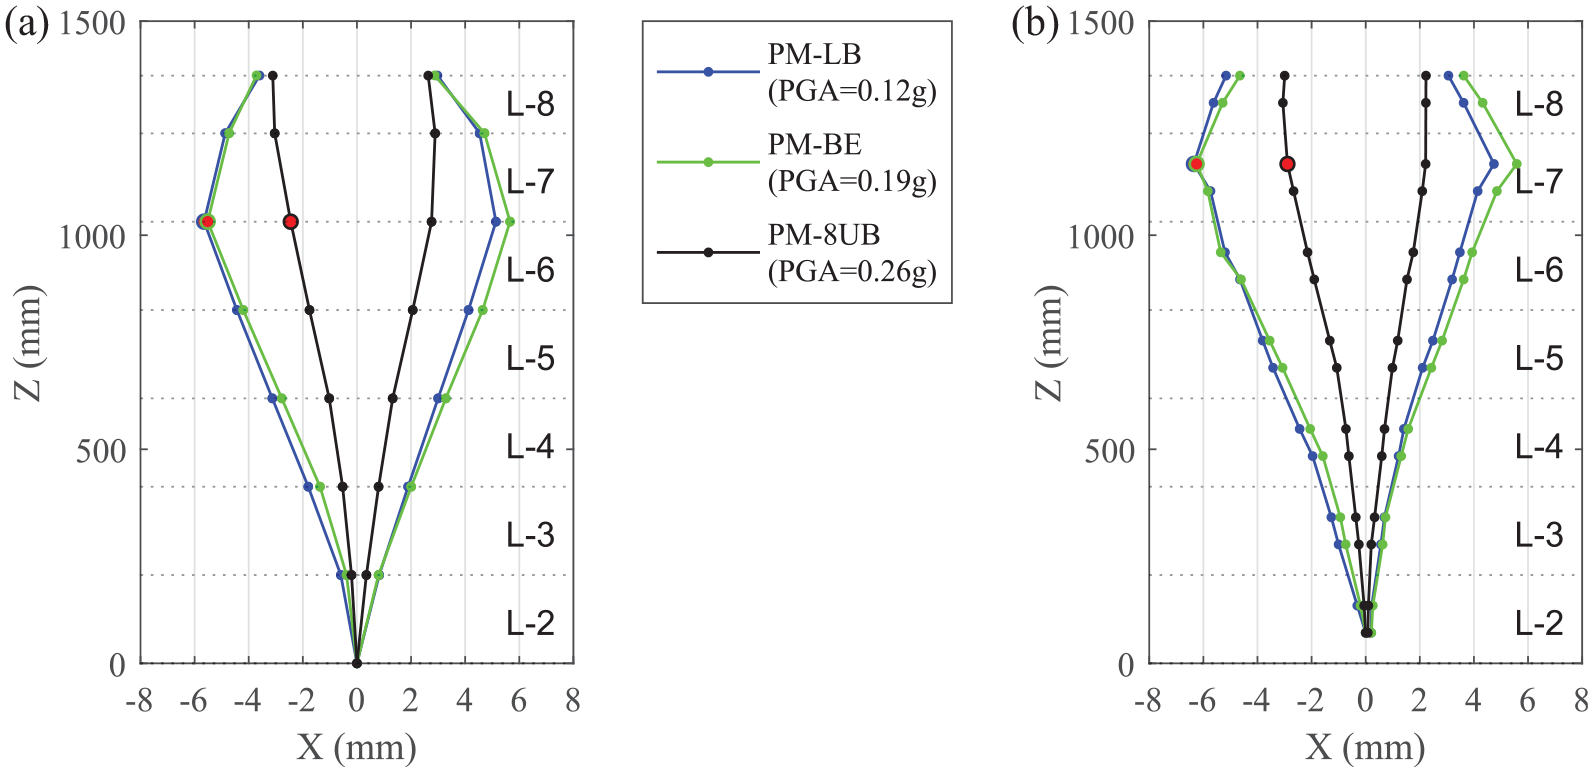
Column displacement/distortion profile for PM-LB (0.12 g), PM-BE (0.19 g), and PM-8UB (0.26 g) input motions on x-direction: (a) lattice column and (b) interstitial column.
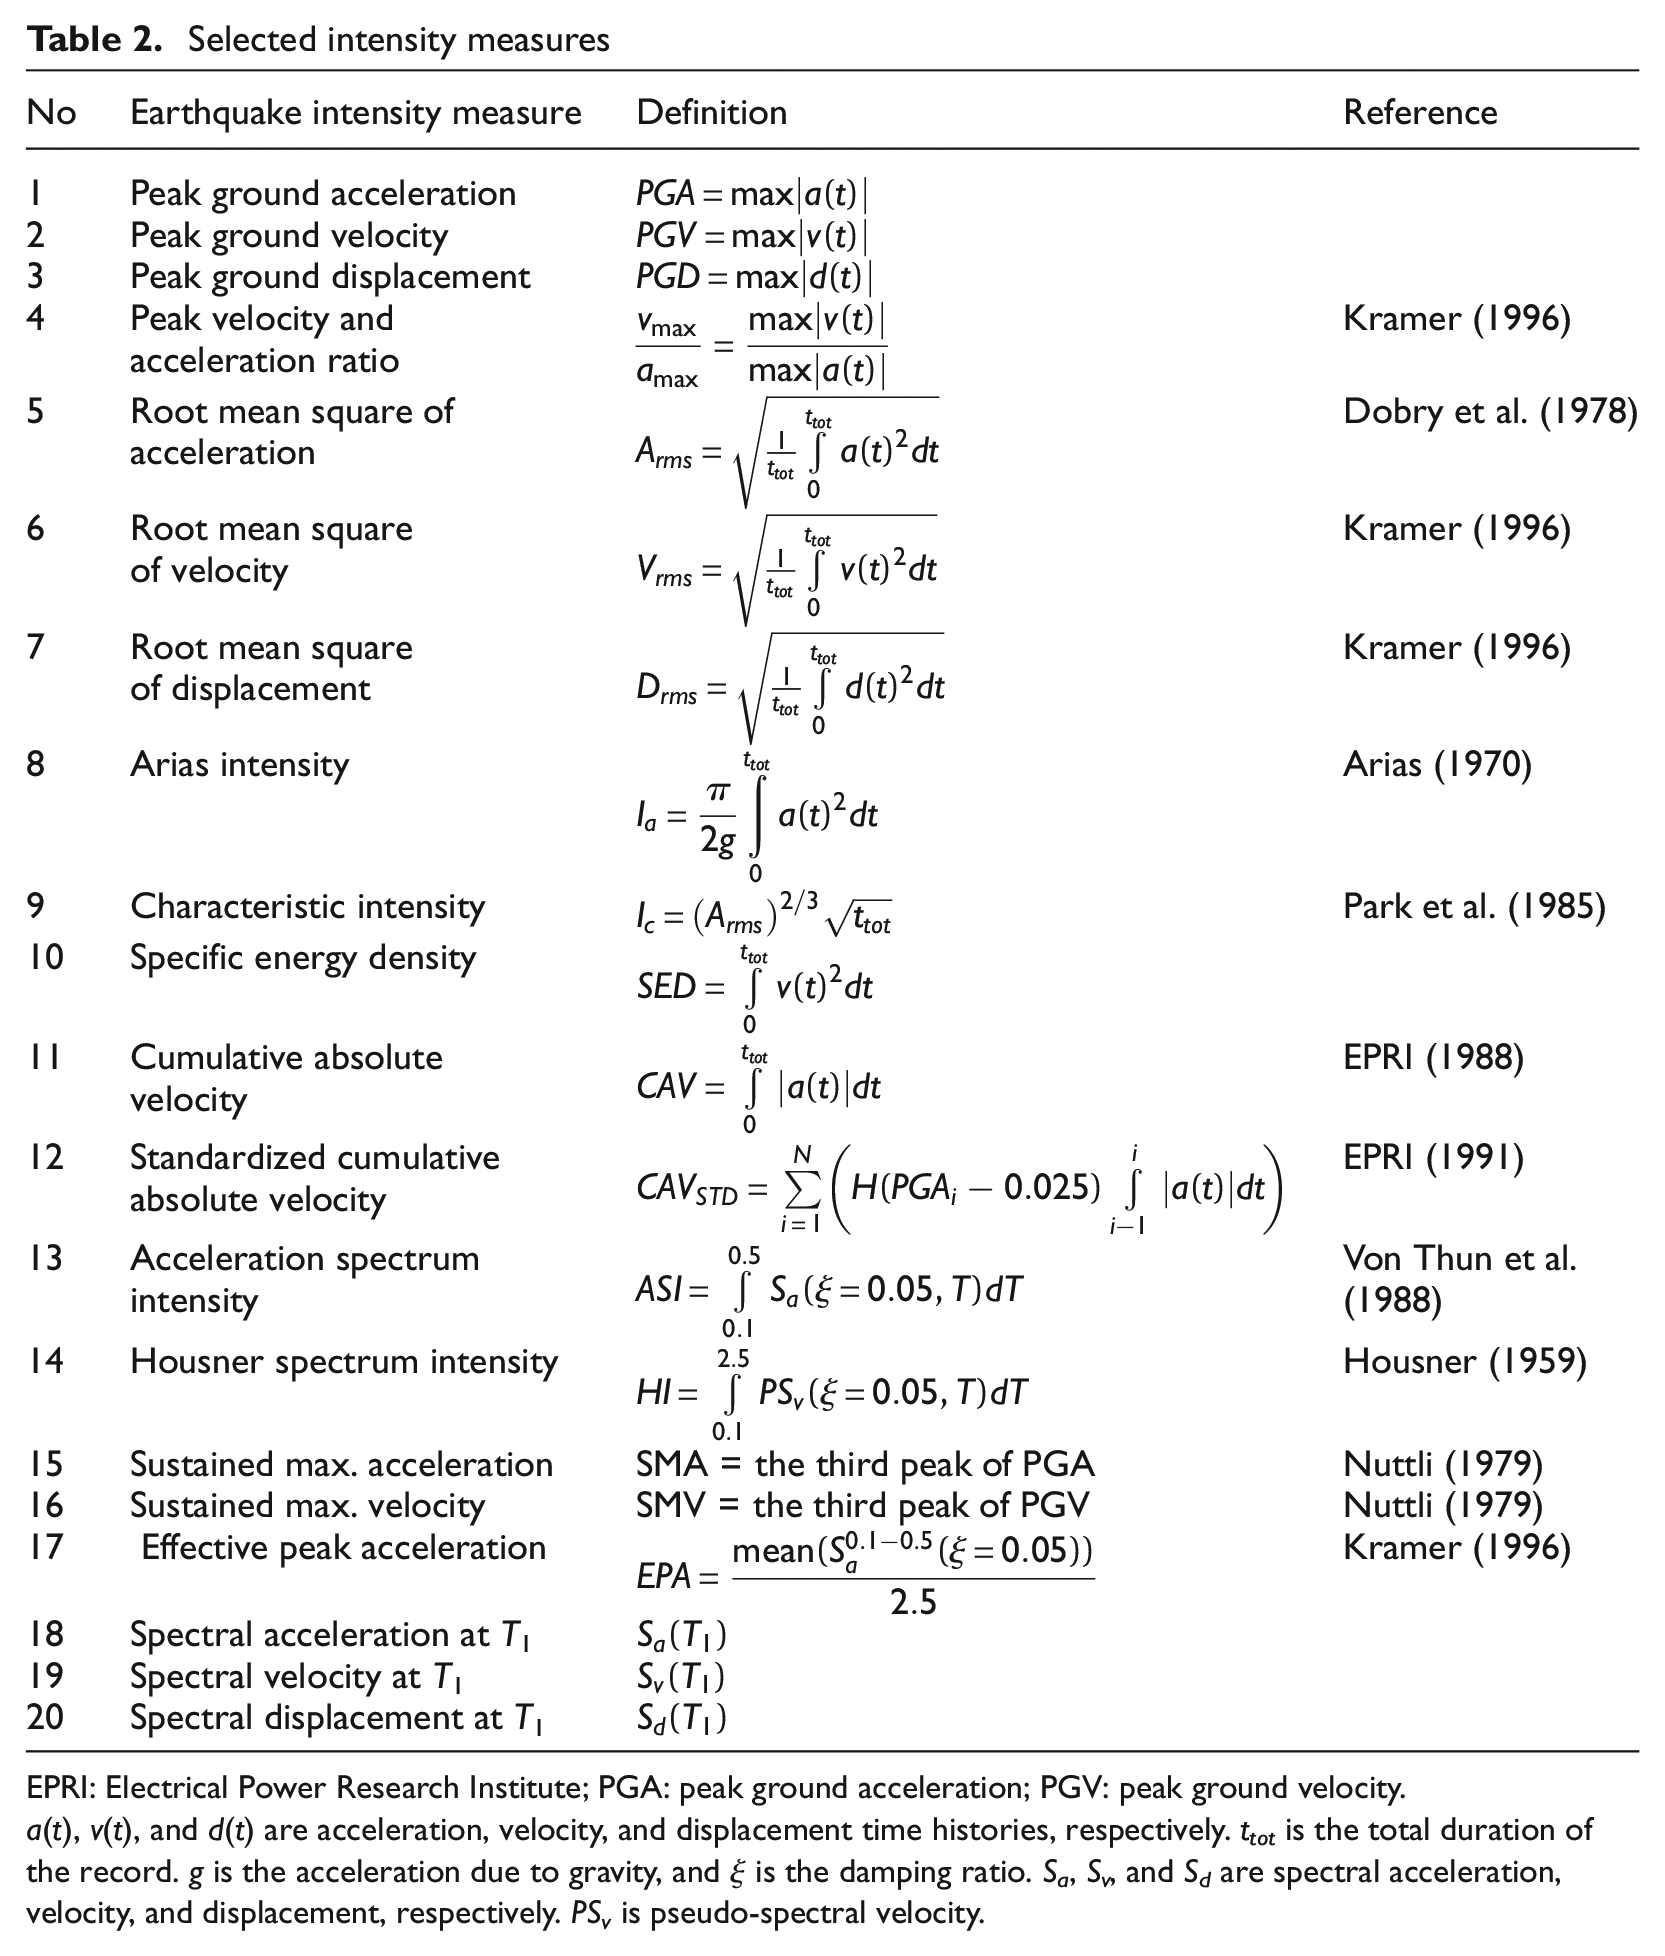
Seismic IMs represent the characteristics of the earthquake-induced ground motion and can be used as a tool in predicting the response of a structure and any associated damage. In this study, 20 scalar IMs are considered and evaluated using direct experimental measurements of the input and output responses of the AGR core model. The IM descriptions, summarized in Table 2, are evaluated to determine the IM which is best capable of accurately predicting the seismic response of the AGR core model.
Selected intensity measures
EPRI: Electrical Power Research Institute; PGA: peak ground acceleration; PGV: peak ground velocity.
a(t), v(t), and d(t) are acceleration, velocity, and displacement time histories, respectively. ttot is the total duration of the record. g is the acceleration due to gravity, and ξ is the damping ratio. Sa, Sv, and Sd are spectral acceleration, velocity, and displacement, respectively. PSv is pseudo-spectral velocity.
As these IMs are scalar quantities, linear correlations are constructed, using the experimental measurements, quantifying the correlation for each linear prediction model. These are presented in Figure 10 for the interface between Layers 6 and 7 (J06) in the instrumented lattice brick column. Each individual seismic input motion represents a single data point; hence the 16 input motions create 16 data points which are used to construct the linear correlations. The displacement values used are the peak displacement values of the column distortion profile, as illustrated in Figure 9. The correlation coefficient (r) value is quantified for each linear prediction map constructed and is presented in Figure 10, representing the accuracy of the IM prediction.
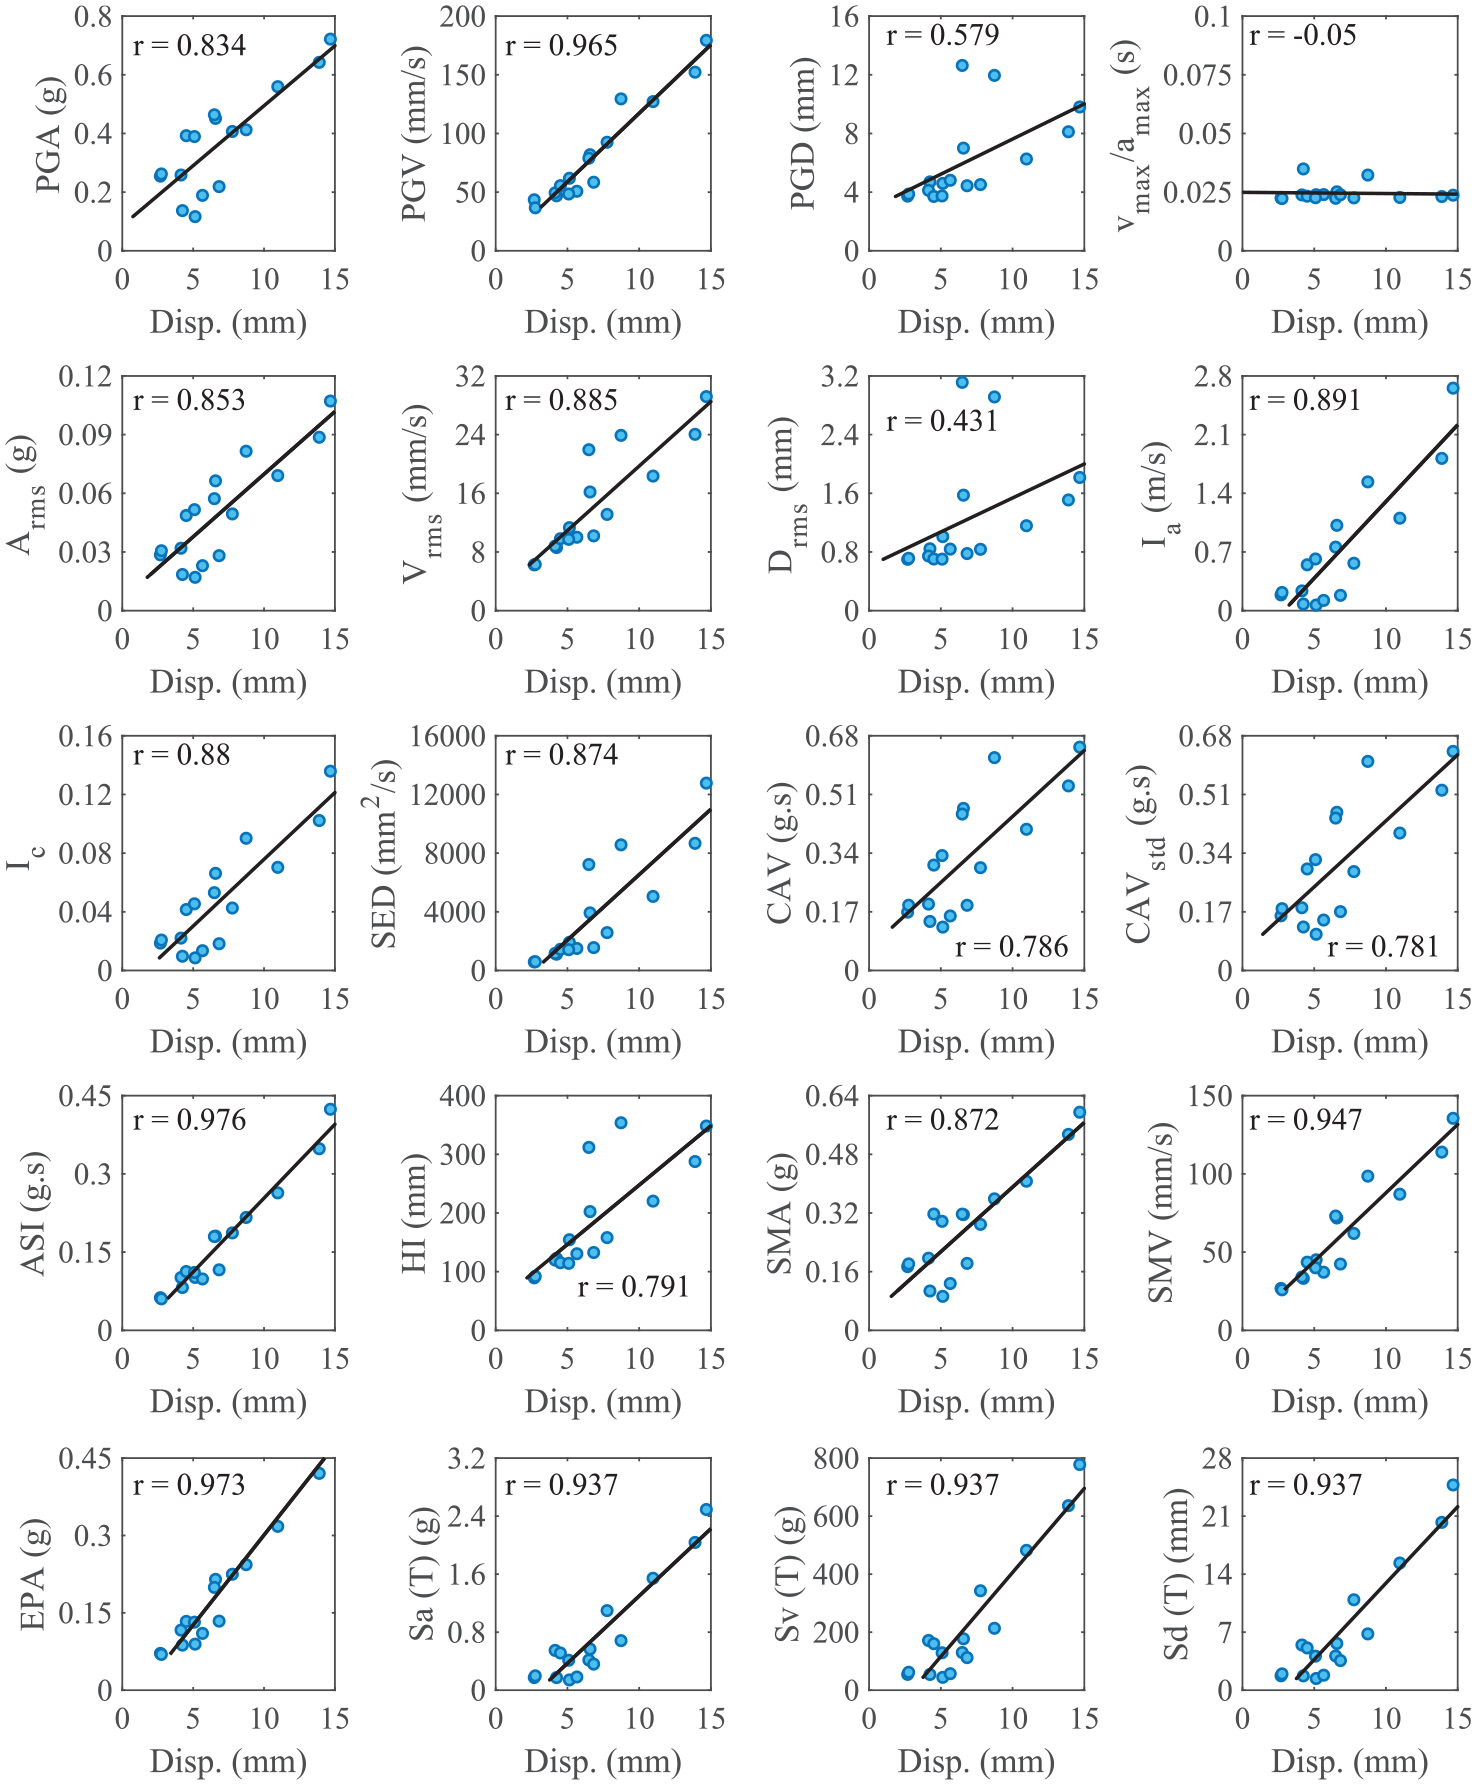
Correlations with IMs and the maximum displacements of the lattice column for 16 input motion on x-direction.
Some of these IMs only consider specific frequency band ranges, such as the ASI and effective peak acceleration (EPA), which are calculated from 2 to 10 Hz, and the Housner spectrum intensity, which is calculated from 0.4 to 10 Hz. The first natural frequency of the quarter-scaled AGR core model (T1) was identified as approximately 5 Hz using the acceleration records from the sensors, which were embedded in the instrumented bricks (see Figures 5 and 6). Since this fell within the IM bandwidths above, these frequency ranges were considered to be acceptable. However, if applying these IMs to the full-scale AGR reactor, it might be necessary to update these limits, based on the natural frequency of the full-sized structure.
To identify the relationship between the seismic response of the MLA and earthquake IMs, Pearson’s correlation coefficient is used. The correlation coefficient given by Ang and Tang (2007) is defined in Equation 1:
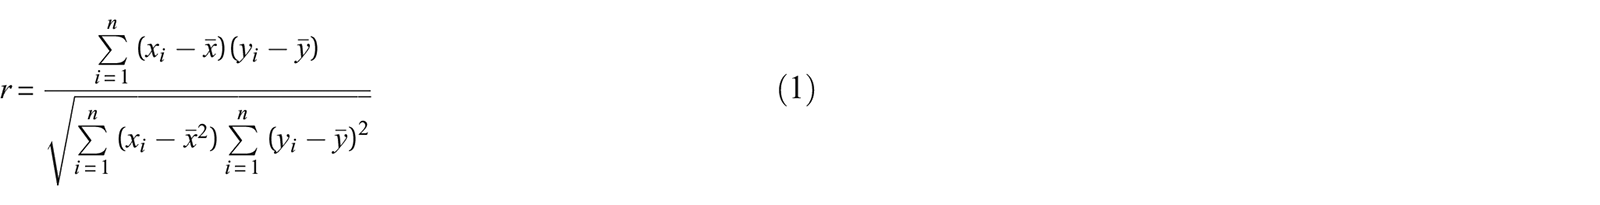
where
The relationship between the engineering demand parameters (EDPs) and the IMs can be written using a logarithmic transformation as expressed in Equation 2, where a1 and a2 are constant coefficients, and ei is the residual, representing the error between the computed and estimated values of EDPi:

“Practicality” represents the direct relationship between an IM and EDPs. It is quantified by the regression parameter, a2 (i.e., the slope of the regression line), as described in Equation 2. A lower value for a2 implies a less-practical IM. Conversely, an IM with a larger value for a2 is more practical. Figure 11 shows that the peak ground velocity (PGV), Vrms, HI, sustained maximum velocity (SMV), and ASI IMs stand out with high practicality values.
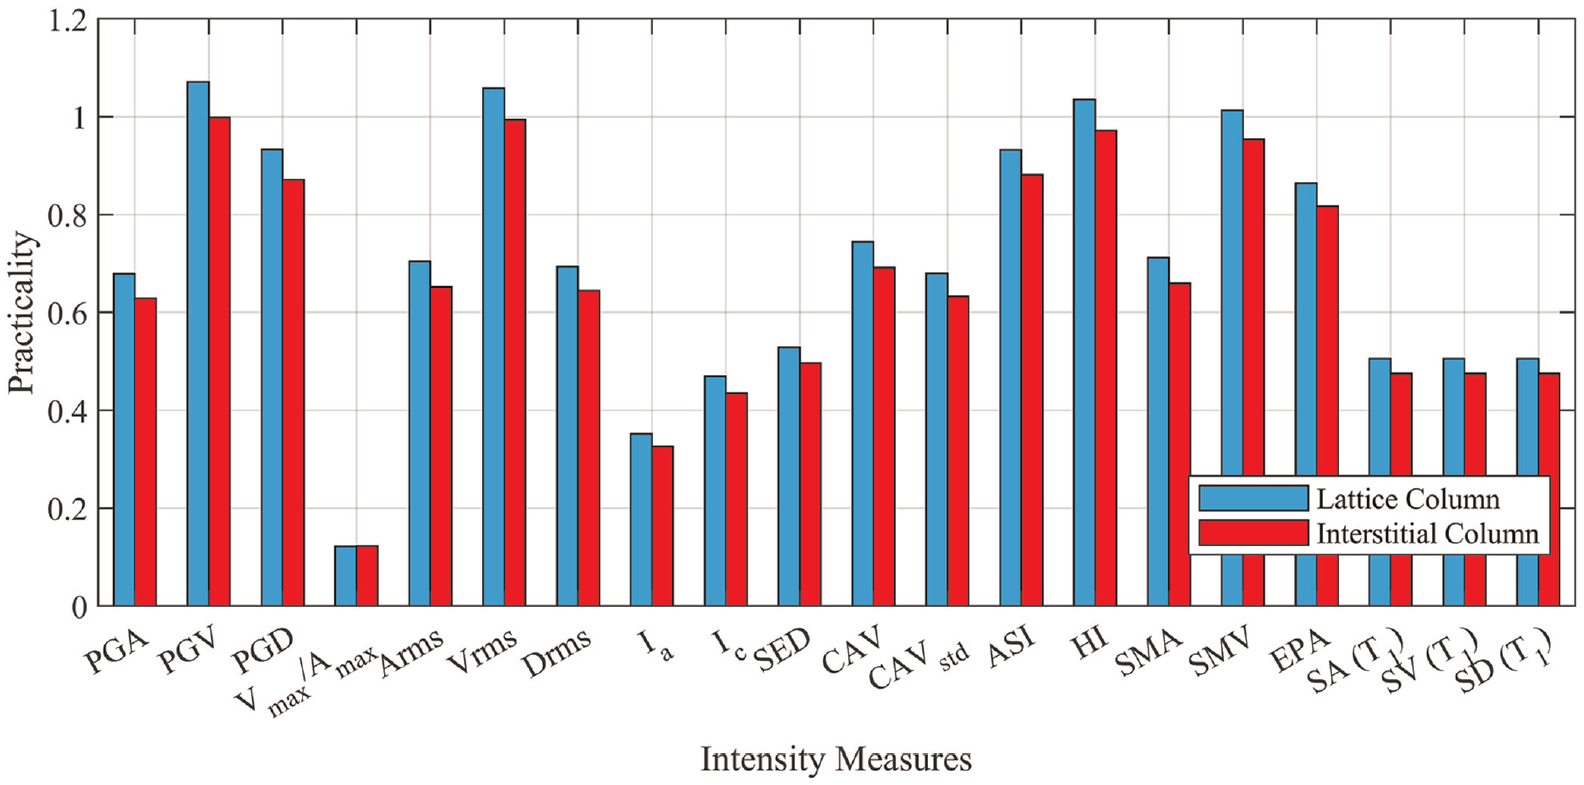
Practicality of the IMs for the instrumented interstitial and lattice column.
The IM efficiency indicator (β) is evaluated by the dispersion of the regression fit for EDP. IM efficiency can be evaluated (Baker and Cornell, 2004) by computing the logarithmic standard deviation of the residual between the measured

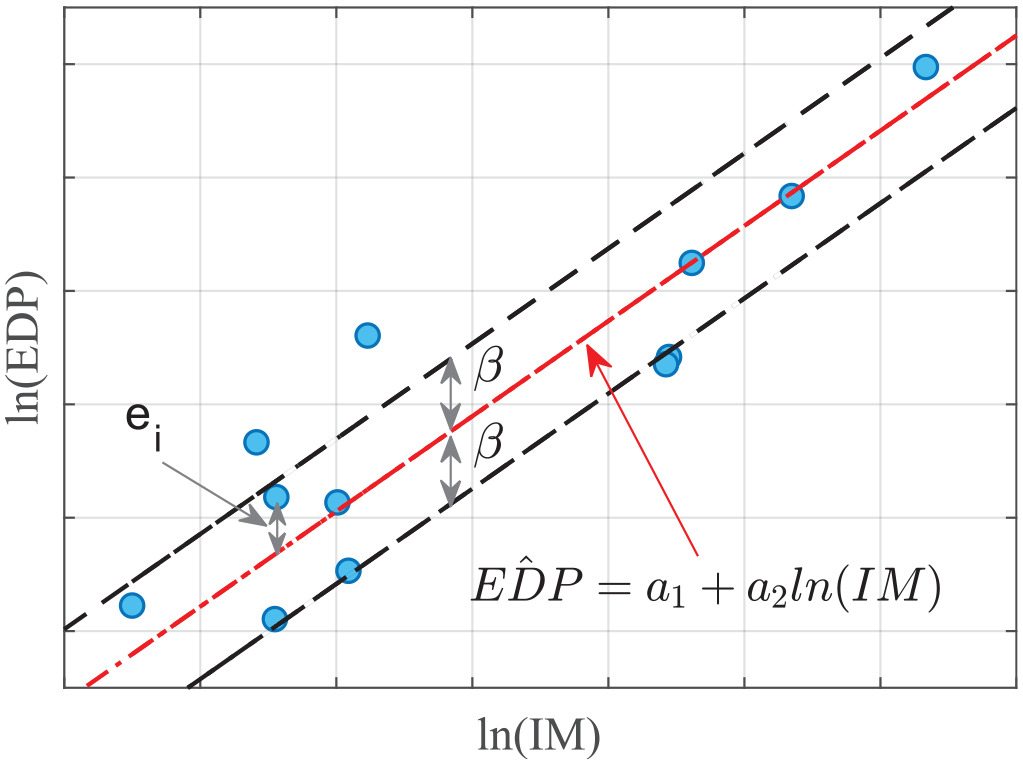
IM efficiency evaluation; data regression and standard deviation.
The evaluated correlation coefficients (r) and log standard deviations (β), for each characteristic IM, are presented in Figures 13 and 14 for both interstitial column interface J07 (in red) and lattice column interface J06 (in blue), respectively. These computations are made at the column interfaces where the maximum horizontal displacements are observed. In Figure 13, the peak velocity and acceleration ratio (vmax/amax), peak ground displacement (PGD), and the root mean square of the displacement (Drms) are observed to have the lowest correlation coefficient values. These correspond to much higher log standard deviation values in Figure 14. However, the ASI, EPA, and PGV IMs stand out with low log standard deviation values, β, and high correlation coefficients, r. The reason for the good performance of the ASI and EPA measures is related to the fact that both IMs are based on the frequency content of the SA in the range of 2–10 Hz, and the dominant response frequency of MLA is also in this bandwidth. The ASI was identified statistically as the best IM with the highest correlation coefficients, 0.976 and 0.9762 and lowest standard deviations, 0.128 and 0.158, for lattice and interstitial columns, respectively. This is evident in the corresponding linear correlation constructed from the experimental measurements in Figure 10 (fourth row far left). In general, the correlation coefficients and log standard deviations show similar values for both the interstitial and lattice columns, for each IM, respectively.
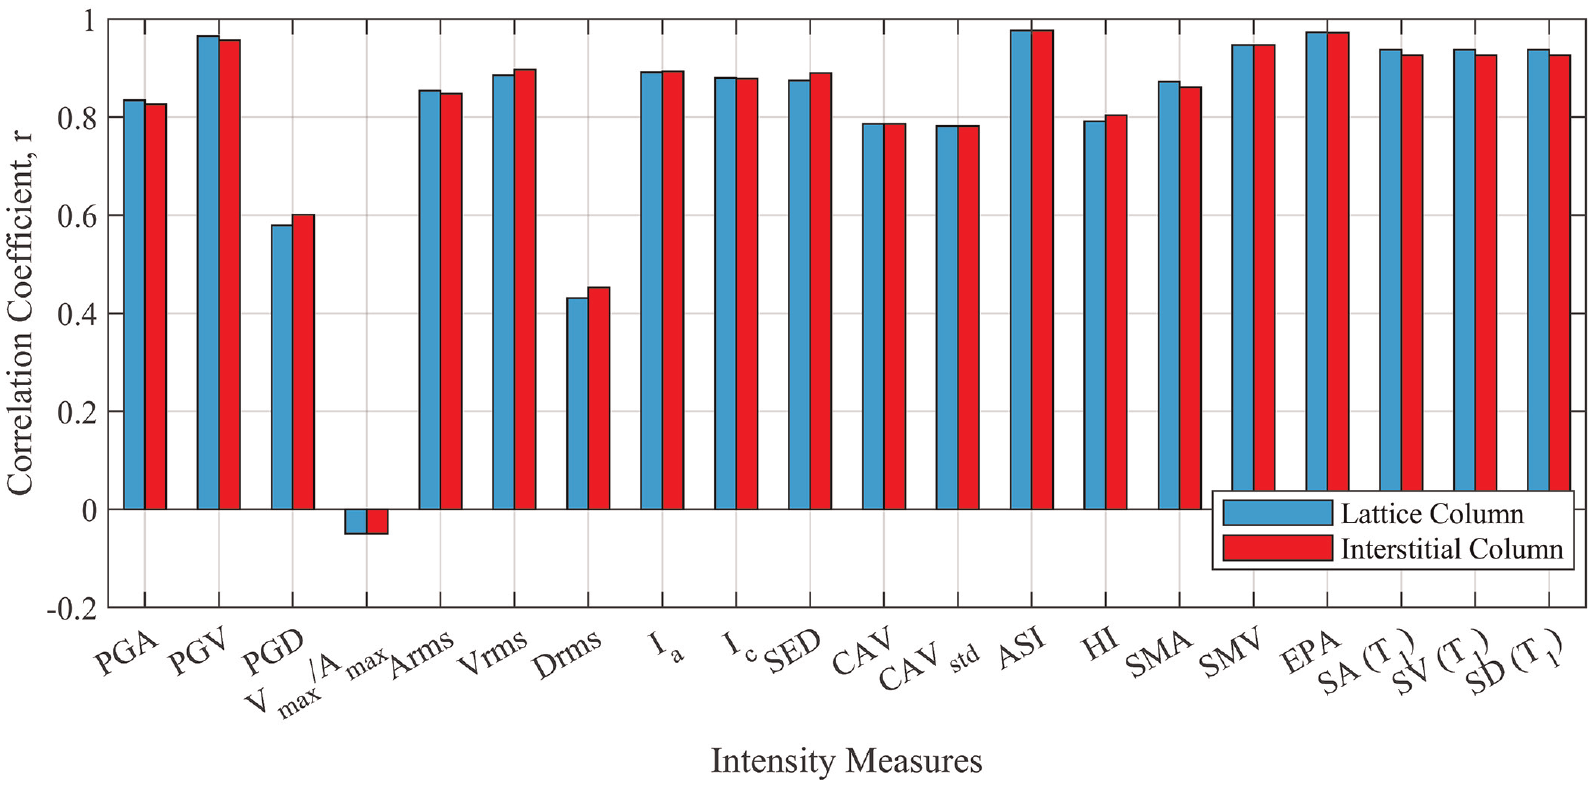
Correlation coefficients of the IMs for the instrumented interstitial and lattice column.
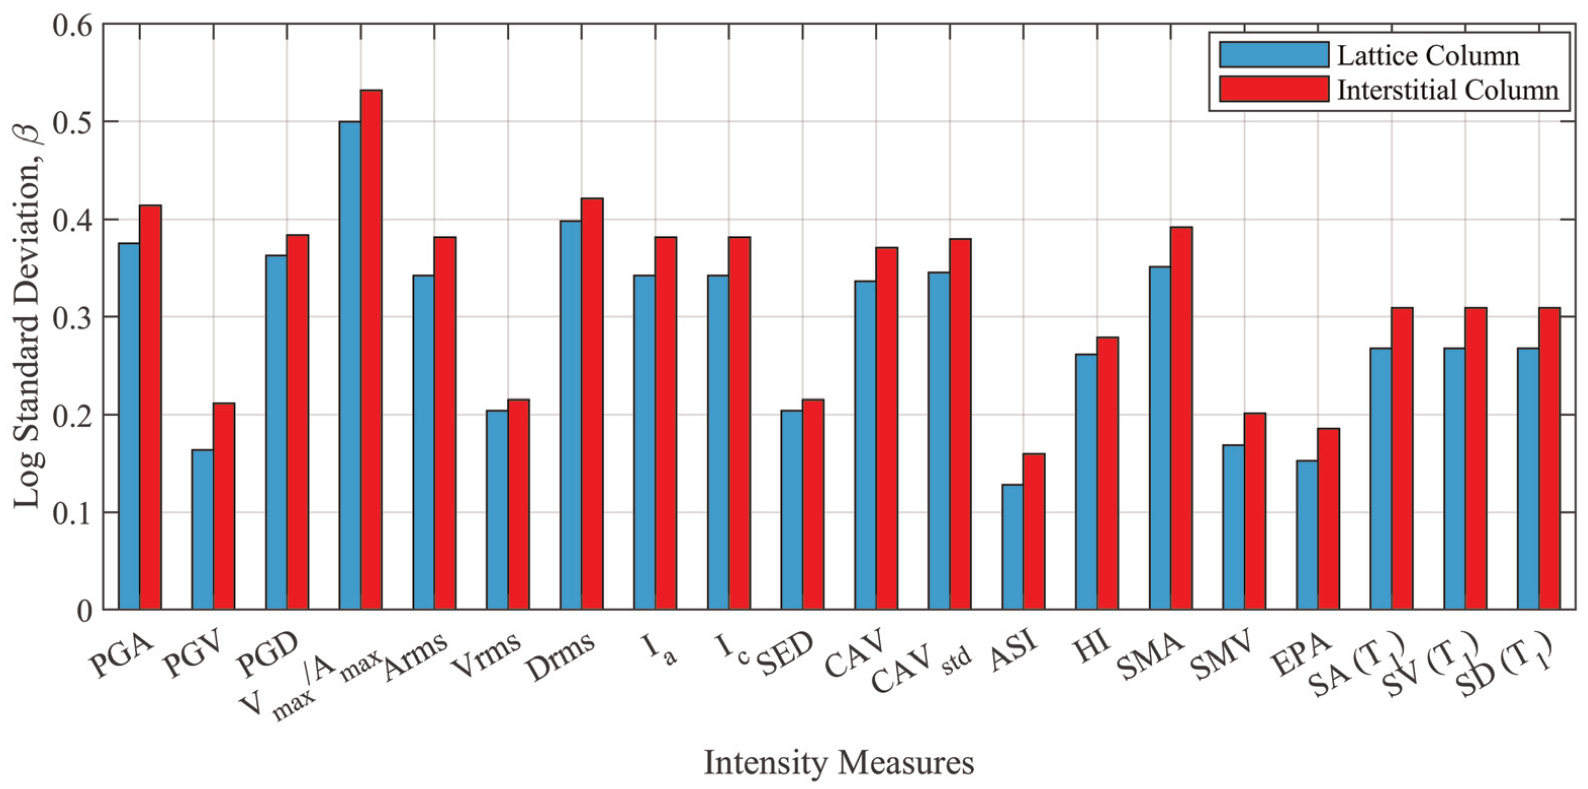
Log standard deviations of the IMs for the instrumented interstitial and lattice column.
The correlation coefficients (r) and the log standard deviations (β) were computed for all interfaces of the instrumented interstitial and lattice columns, shown in Figure 2, and similar results were obtained.
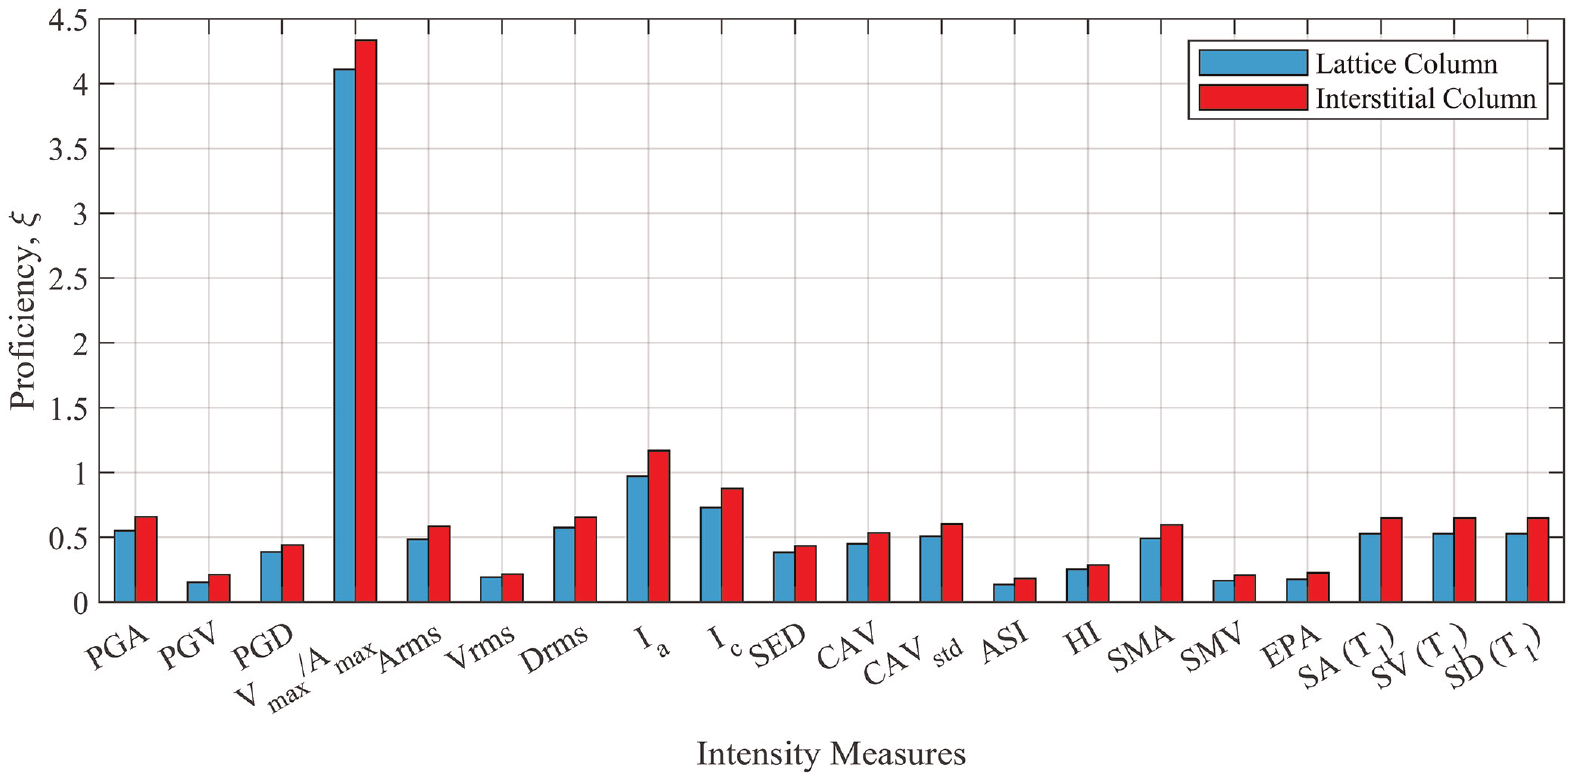
Padgett et al. (2008) proposed an indicator, namely proficiency, which is a composite measure of efficiency and practicality. Proficiency considers and balances these two parameters when identifying an optimal IM. The proficiency (ξ) is defined by the ratio of dispersion (log standard deviation, β) to the practicality (a2), as shown in Equation 4. A lower value of proficiency (ξ) indicates a more proficient IM, which has a stronger correlation between the IM and the demand while leading to less dispersion around the median values:

Based on the proficiency values shown in Figure 15, the ASI was identified as the optimal IM with the lowest proficiency factors (ξ), of 0.137 and 0.1812 for the lattice and interstitial columns, respectively.
Proficiency of the IMs for the instrumented interstitial and lattice column.
ASI is identified as the optimal IM correlating the seismic input to the column displacement response for a 50% cracked configuration (a close to end-of-life scenario) of a quarter-sized AGR reactor core model. However, another IM might be optimal for a comparatively rigid or flexible configuration of the AGR core. Thus, it is essential to use existing numerical or experimental data sets representing the actual behavior of the AGR core to train the developed algorithm and to identify the optimal IM and corresponding regression coefficients.
Development of column shape prediction algorithm
Based on the ASI measure, a seismic demand prediction tool has been developed to predict the steady-state column shape displacement profiles of stacked brick columns typically housed within AGR cores. This algorithm utilizes the linear correlation procedure empirically derived for the ASI measure illustrated in Figure 10; see Table 2 for its definition. This IM was identified statistically as being the optimal metric correlating the seismic input to the output column displacement response. The linear regression coefficients were obtained for the brick column displacement responses at each measured interface for the ASI IM. These coefficients can then be used to estimate the displacement demands of the interfaces for any input motion. To demonstrate the validity and accuracy of the prediction algorithm, 1 of the 16 experimental results, see Table 1, was excluded from the identification of the linear regression coefficients. The column displacement profiles were then estimated for the excluded input motion and compared with its actual recorded displacement data, as shown in Figures 16 and 17. This procedure was repeated for all 16 input motions. Figures 16 and 17 present results for the predicted column shape responses when subjected to RRS Eurocode compatible, HPB 10–4, HPB 10–4 (scaled at 0.7 g), and PML-2UB input motions for the interstitial and lattice columns, respectively. The predicted responses are overlain in red to compare against the measured responses shown in blue.
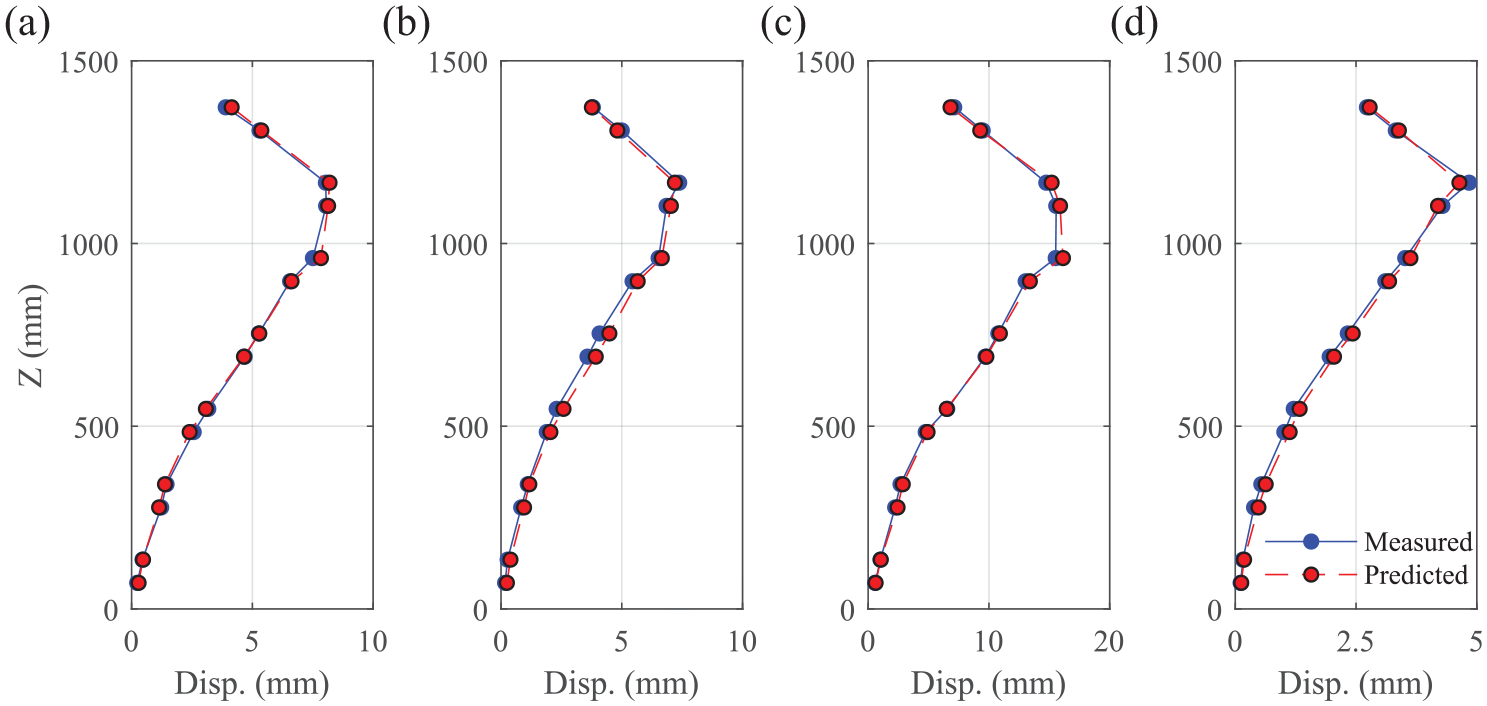
Comparisons of predicted and measured interstitial column displacements: (a) RRS Eurocode compatible motion, (b) HPB 10–4 motion, (c) HPB 10–4 (scaled at 0.7 g) motion, and (d) PML-2UB motion.
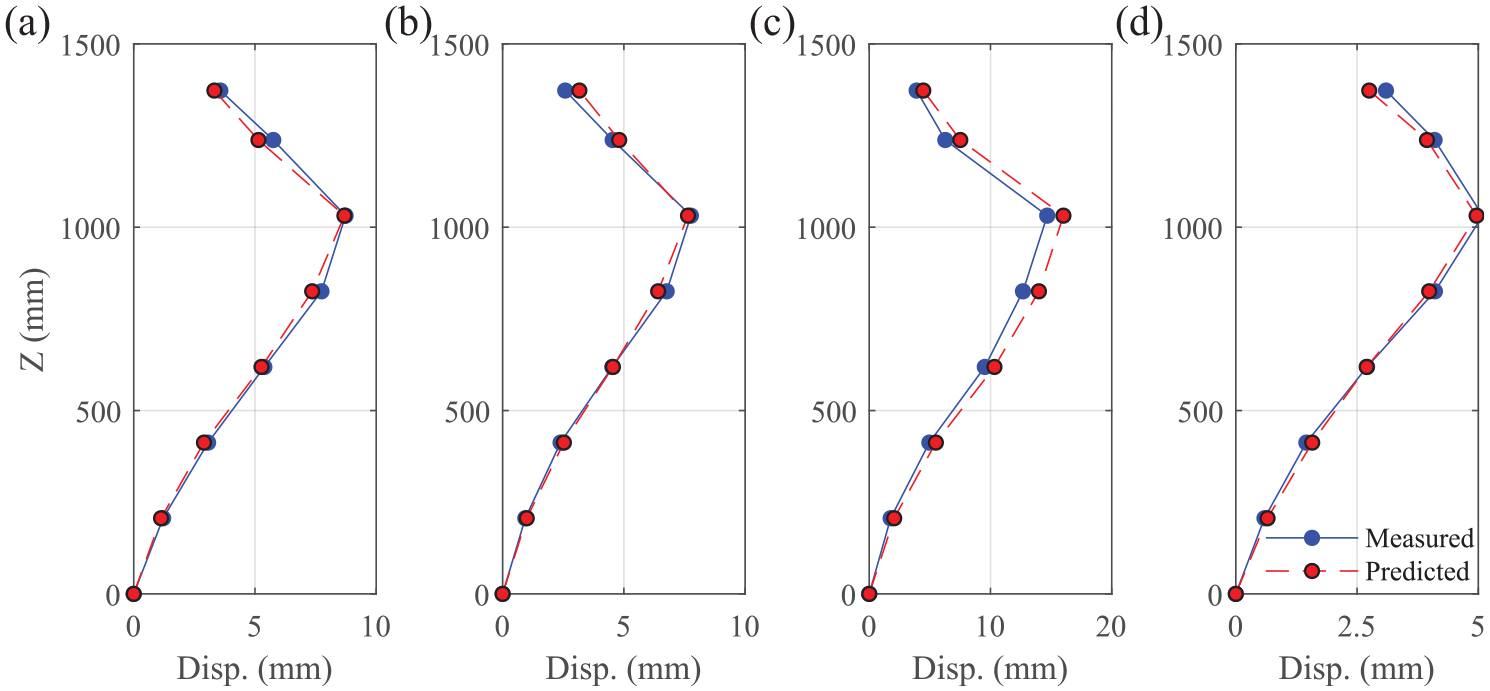
Comparisons of predicted and measured lattice column displacements: (a) RRS Eurocode compatible motion, (b) HPB 10–4 motion, (c) HPB 10–4 (scaled at 0.7 g) motion, and (d) PML-2UB motion.
Using the proposed prediction algorithm, the predicted brick column displacement profile responses compare very well with the experimental data both qualitatively and quantitatively. The same trends in column shape profiles are witnessed for both interstitial and lattice brick columns for each seismic input motion.
A 95% confidence interval is calculated to define a confidence interval for the prediction algorithm. The prediction algorithm is applied to each of the 16 input motions to generate the predicted column displacement data for the lattice column. The mean (µ) and standard deviation (σ) of the residual between the experimental and predicted column data for each interface are calculated to generate a confidence interval. The 95% confidence intervals for each layer are presented in Table 3. The obtained maximum standard deviation is 0.797 mm, and the prediction uncertainty (µ ± 2σ) is calculated as 1.593 mm, which corresponds to 11% of the maximum horizontal displacement of that interface.
Statistical characteristics of a 95% confidence interval for the interfaces of lattice column (mm)
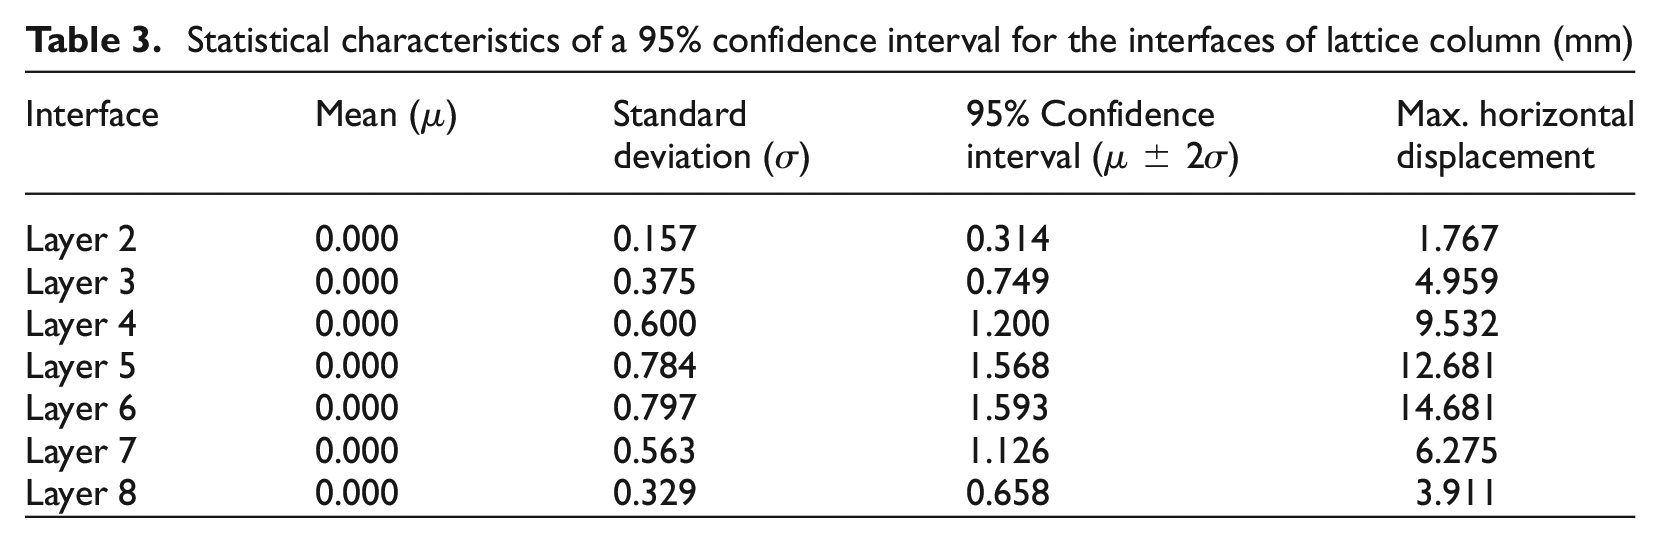
From these results, it can be surmised that despite the differences between the predicted and measured interface displacements presented in Figures 16 and 17 and Table 3, a very good performance was achieved when using the optimal IM to predict the column interface displacements. Due to the AGR core model system being restrained with a Warren truss, the physical displacement responses of the columns are ultimately constrained. The MLA was tested up to the 0.7 g PGA level, which is 1.75 times higher than the site-specific earthquake motion with a 10–4 probability of occurrence (HBP 10–4). It can be seen from Figure 8a, that the lattice column displacement responses for HPB motions scaled to 0.6 and 0.7 g PGA levels are quite similar. So, the physical displacement limit of the lattice column might be hit for the maximum seismic excitation (HPB 10–4 scaled at 0.7 g). However, it is not hit for the interstitial column (see Figure 8b). The performance of the proposed prediction tool is likely to deteriorate if it is used beyond the maximum seismic excitation of the data set.
Safety shutdown criteria
A set of criteria was adapted from the recommendations of EPRI (1988, 1991) in USNRC (1997) to evaluate whether an NPP must be shut down for inspection after seismic action. The determination of the OBE exceedance is based on the recorded data by the accelerometers/seismometers in any one of the three components of the free-field ground motion. To determine the OBE exceedance, a CAV check and a response spectrum check were defined in USNRC (1997).
The standardized version of the CAV, denoted as CAVSTD is defined to make the CAV value representative of strong ground shaking rather than coda waves (small amplitudes that can continue for a long time after the strong shaking) in EPRI TR-100082 (EPRI, 1991). The method restricted the integration for computing CAV to 1-s time windows that have amplitudes of at least 0.025 g. This definition of CAVSTD is given in Equation 5 (EPRI, 2006):

where N is the number of 1-s time intervals, PGA i is the PGA (g) in the time interval i, and H(x) is the Heaviside function defined as follows:

The CAVSTD threshold is defined as 0.16 g s for any of the three directional components recorded at a seismometer in USNRC (1997).
In the response spectrum check, the OBE response spectrum is exceeded if any one of the three components (two horizontal and one vertical) of the 5% damped response spectra is larger than:
The corresponding design response spectral acceleration (OBE spectrum if used in the design, otherwise, 1/3 of the safe shutdown earthquake (SSE) ground motion spectrum) or 0.2 g, whichever is greater, for frequencies between 2 and 10 Hz, or
The corresponding design response spectral velocity (OBE spectrum if used in the design, otherwise 1/3 of the SSE spectrum) or a spectral velocity of 15.24 cm/s, whichever is greater, for frequencies between 1 and 2 Hz.
If the response spectrum check and the CAVSTD threshold exceed for any one of the three directional components recorded at a seismometer, then the OBE exceedance is triggered, and plant shutdown is required.
The CAVSTD and response spectrum checks according to USNRC (1997) are presented in Table 4 for the 16 input motions given in Table 1. The calculated values which exceed the defined thresholds in the regulations are highlighted in gray. Since there is a relatively weak correlation between the CAVSTD and spectral measures with the seismic response of MLA core model (see Figures 10, 11, and 13–15), a new criterion is suggested to be employed in the evaluation of OBE exceedance for a cracked graphite reactor core which approaches the end of its operational life. The ASI, which is shown above to be a good IM to use in the prediction of graphite column displacements, is proposed for use in the rapid evaluation of OBE exceedance after a seismic action. The maximum horizontal displacement value was measured as 4 mm for both lattice and interstitial columns in the middle of the array for the intact array experiments of the MLA core model. This value corresponds to the physical displacement limit of the mid-array without any crack opening or key disengagements. Using experimental results and the developed prediction algorithm, an ASI threshold value was determined as 0.09 g s, which corresponds to a 4 mm maximum horizontal interface displacement for the 50% cracked MLA configuration. This means that any earthquake motion lower than this threshold will not cause any significant crack openings or key disengagements in the MLA core model.
Exceedance of shutdown thresholds for USNRC Regulatory and the suggested IM.
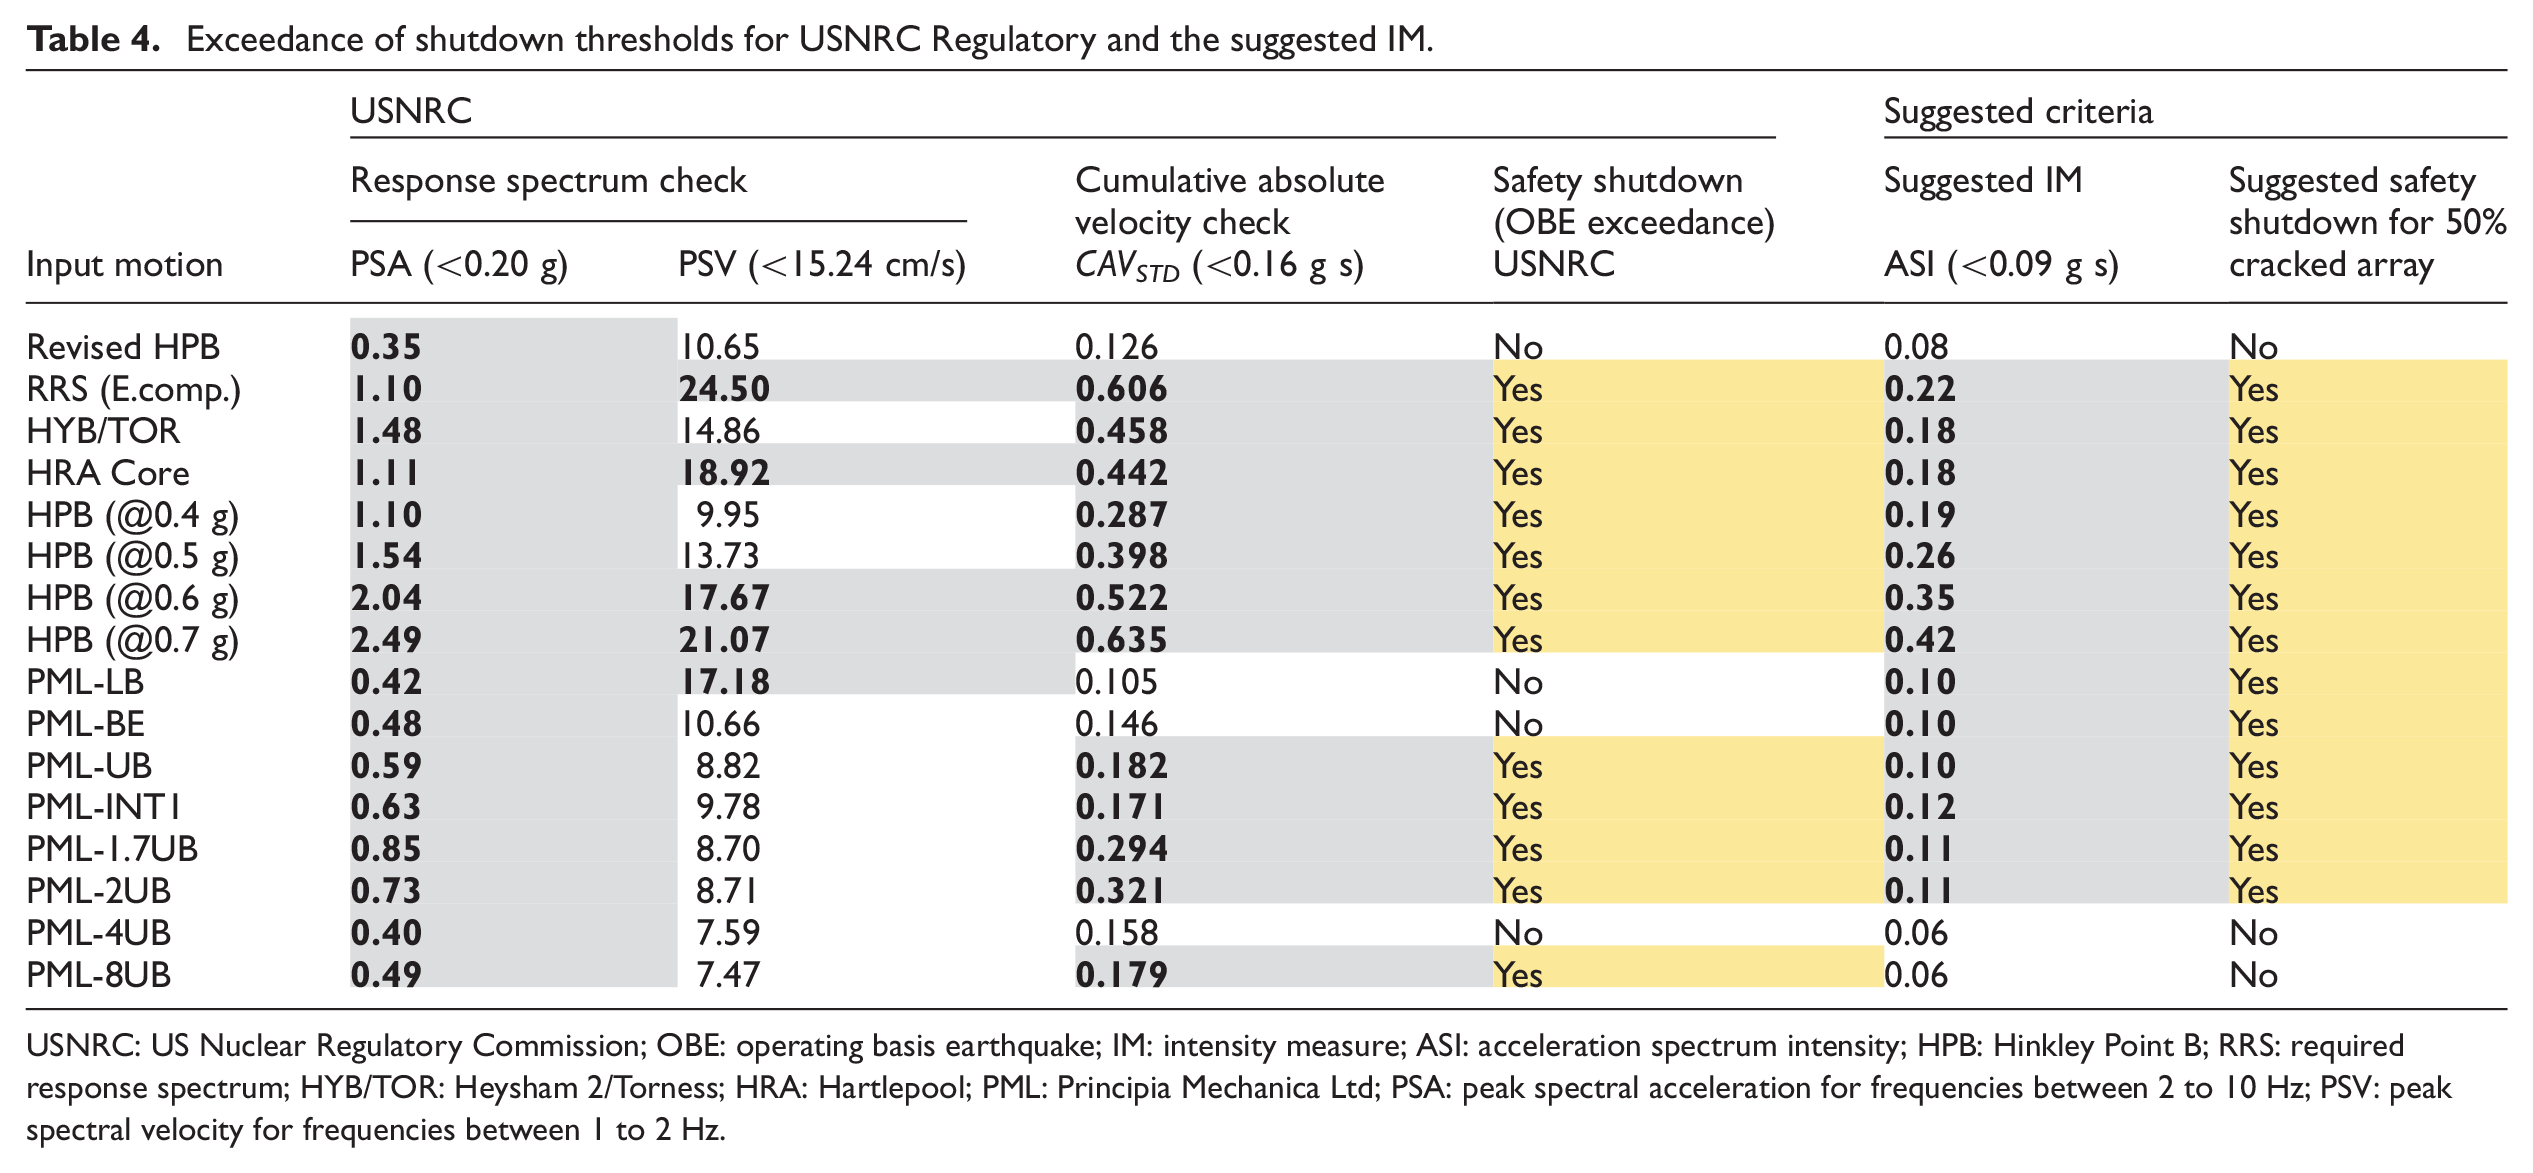
USNRC: US Nuclear Regulatory Commission; OBE: operating basis earthquake; IM: intensity measure; ASI: acceleration spectrum intensity; HPB: Hinkley Point B; RRS: required response spectrum; HYB/TOR: Heysham 2/Torness; HRA: Hartlepool; PML: Principia Mechanica Ltd; PSA: peak spectral acceleration for frequencies between 2 to 10 Hz; PSV: peak spectral velocity for frequencies between 1 to 2 Hz.
According to the criteria given in USNRC (1997), the PML-8UB input motion triggers the OBE exceedance and requires a plant shutdown, but the PML-LB and PML-BE motions did not exceed the OBE (see Table 4). However, a different result was obtained if the suggested criteria (ASI) were used. The maximum column displacement profiles for all three input motions are given in Figure 9. It can be seen that the PML 8UB, motion which triggers the OBE exceedance according to the USNRC, resulted in a maximum horizontal displacement of 3.1 mm. Conversely, the PML-LB and PML-BE shakes resulted in maximum interface displacements of 5.65 and 5.52 mm but did not exceed the OBE in accordance with USNRC (1997). This shows that a lack of precision in the prediction methods to evaluate the damage potential of an earthquake may lead to wrong decisions about the serviceability of an NPP. When the reactor transitions from “at power” to “at shutdown” conditions, the temperature of the core changes. This causes a change in the thermal strain, which in turn changes the stress experienced by the bricks, increasing the likelihood of cracking at shutdown (Bond et al., 2018). Using the proposed new criteria, a more precise prediction of damage potential after an earthquake can be made. In this way, unnecessary plant shutdowns could be avoided, and the economic losses resulting from an interruption of service could be prevented. The authors note that the proposed new criteria are identified for seismic response prediction of the AGR core and may not be valid for the other critical components of the NPP. Due to an NPP containing various types of critical components which have entirely different structural characteristics and dynamic responses, further similar studies should be performed for the other critical components to identify the best IMs to assess their seismic responses.
Summary of developed algorithm
The developed algorithm to identify the optimal IM and predict column displacements is depicted as a flowchart in Figure 18. The basic steps can be summarized in three phases. The automated process of the developed algorithm was undertaken using MATLAB (2019).
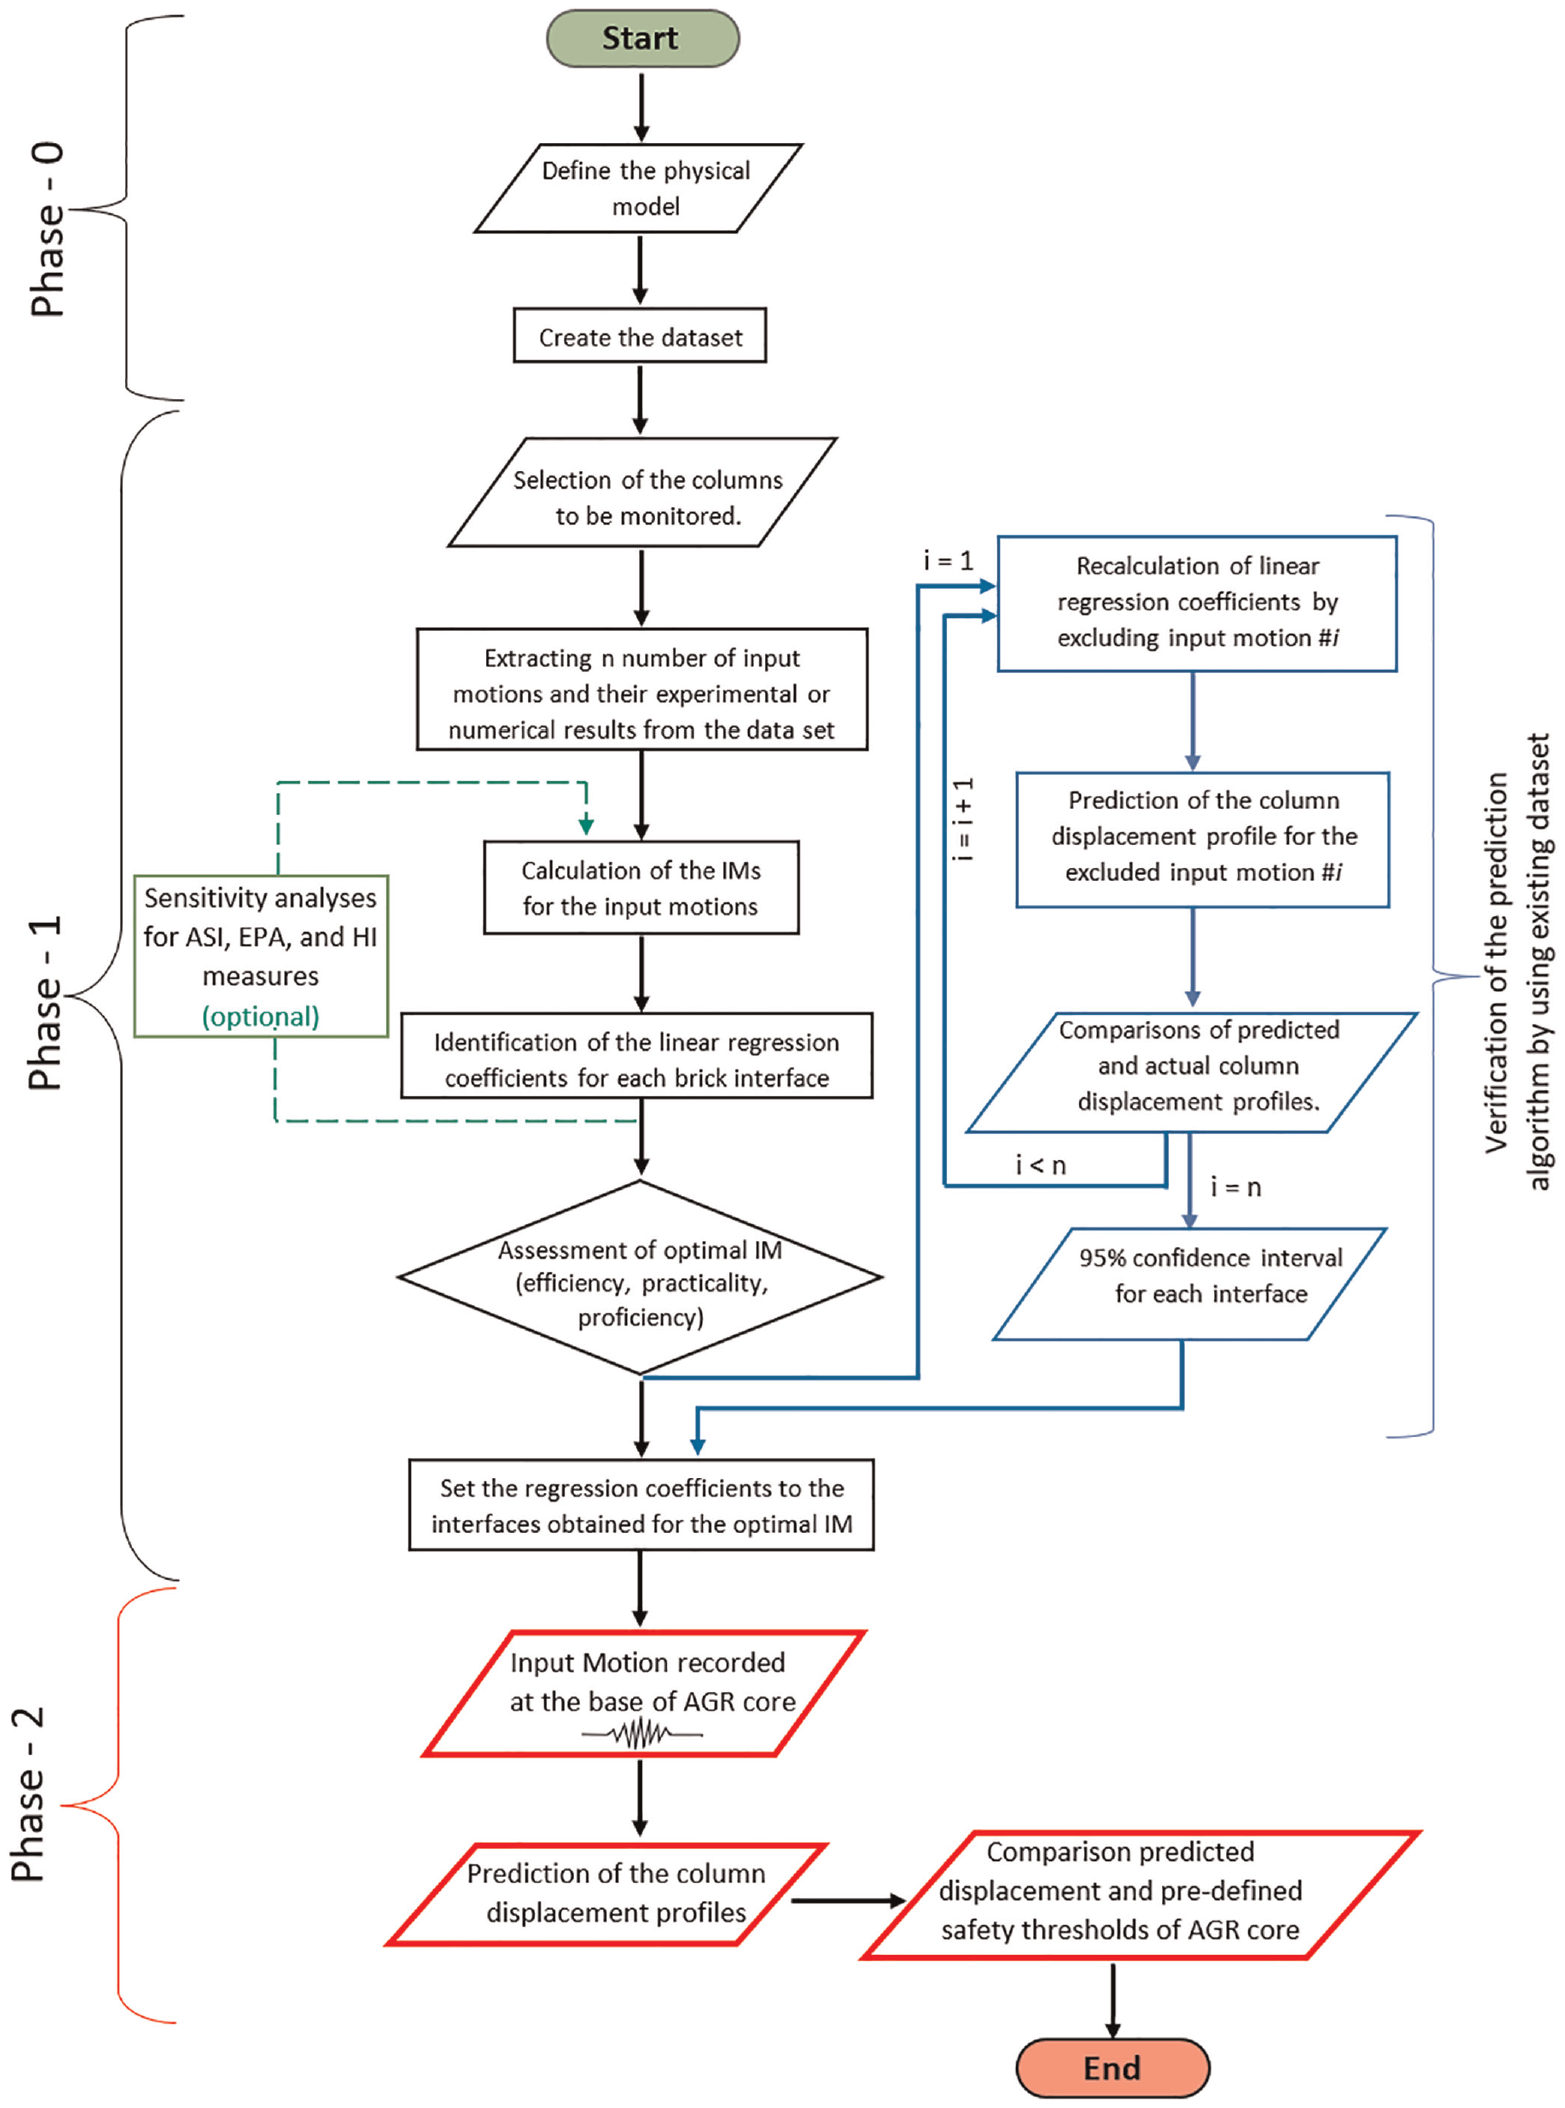
Flowchart of the developed algorithm.
“Phase 0” is the algorithm’s initial step for defining the physical model and gathering data. The physical features of the AGR core are defined as input in terms of geometric properties of brick types, the number of layers, the natural frequency of the array, and the overall dimensions of the AGR core model. AGR core data sets are typically generated from three sources: (a) numerical models, (b) experimental models, and (c) inspections of the graphite core components in-situ. A unified data format was designed and developed to ensure all data types can be processed with a range of input data associated with the AGR cores. Since the developed algorithm can read a unified data format, it can extract numerical or experimental data, which represents the actual behavior of the AGR core, directly from data sets.
“Phase 1” is the second step of the algorithm, which assesses the possible IMs that could be used in the estimation of the earthquake response of the AGR core and determines the optimal ones. Linear regression coefficients of the IMs are identified for each brick interface, and the IM performances are assessed in terms of efficiency (log standard deviation), practicality, and proficiency.
ASI, EPA, and HI measures are calculated for specific period ranges. However, these IMs can be modified by redefining these period ranges to better account for the period range of the interest of the considered structure (Di Sarno and Pugliese, 2021; Pourmasoud et al., 2022). Therefore, an optional sensitivity analysis feature, shown in green on the flowchart (Figure 18), is introduced for users to modify the period range of these IMs.
To define a confidence interval for the prediction uncertainty whereby a 95% confidence interval can be determined, one of the input motions and its corresponding results is excluded from the data set, and the linear regression coefficients are obtained with the (n − 1) other motions. Then the column displacement profiles for the excluded input motion are predicted by using the calculated regression coefficients, and the predicted displacements are compared with the actual results. This procedure is repeated, one by one, for all the input motions. The mean (µ) and standard deviation (σ) of the residuals between the experimental and predicted column data for each interface are calculated to generate a confidence interval.
“Phase 2” is where the column displacement profiles are predicted for any given input motion using the regression coefficients determined for the selected optimum IM in “Phase 1.” In addition, if there are any pre-defined safety thresholds for the AGR core, the predicted displacements are compared with corresponding threshold values, and an alert is triggered if a threshold is exceeded.
To obtain high accuracy in the predicted displacements, the algorithm needs to be trained using an existing numerical or experimental data set representing the actual behavior of the AGR core to identify the optimal IM and corresponding regression coefficients for prediction. The licensee who operates the power plant is responsible for demonstrating to the Office for Nuclear Regulation (ONR) that the graphite core continues to operate safely as it ages. This requires the licensee to undertake extensive testing and analysis to support the safety case for continued operation. Each reactor is periodically shut down and inspected, as it is necessary to carry out inspections and remove samples of the graphite to determine the level of weight loss and cracking (ONR, 2021). Therefore, each AGR core has an experimental or numerical data set that represents its actual dynamic behavior.
Determination of the seismic behavior of an AGR core by experimental methods is expensive and time-consuming. Similarly, finite-element model analysis of an AGR core takes a long-time due presence of a large number of nonlinear springs, which represent the contact behavior of the thousands of bricks and keys. Experimental or numerical results also require significant post-processing, which may take weeks/months. Considering all these costly and time-consuming experimental/numerical processes, this prediction algorithm could be used to expand the output of experimental or numerical studies thus saving time, effort, and cost.
Furthermore, after an earthquake, the developed prediction algorithm could be used to make a rapid determination of the damage potential of the seismic action on a graphite nuclear reactor core, in addition to the IMs defined in USNRC (1997).
It was observed from the experiments that large column displacements caused more key disengagements and crack openings. A higher number of disengaged keys could lead to loss of core integrity during an extreme earthquake and might have safety implications during the seismic event, as a severe permanent distortion of the vertical channel profiles, caused by key disengagement, could block the insertion of the control rods and prevent the safe shutdown of the reactor. Therefore, column displacements were chosen as an EDP in this study. However, an extensive research study is ongoing on the measurement of internal brick forces at the University of Bristol. The developed algorithm could also be used to predict brick stresses and shear forces, which are also critical EDP for the AGR cores. In this case, a force measurement data set would be required to train the algorithm.
Conclusion
This article presents the seismic assessment and serviceability of instrumented stacked brick columns housed within a quarter-sized AGR core model. The correlation between the seismic input motion and displacement response of instrumented stacked brick columns are evaluated directly from experimental measurements using 20 earthquake IM metrics. Statistical analysis indicates that the ASI is best suited to characterize and describe the structural damage/demand of an AGR core-like structure when subjected to seismic loading. The EPA, root mean square of velocity (Vrms), SMV, and PGV IMs are also considered to be good/acceptable metrics for this specific engineering application.
A prediction algorithm/software tool, identifying the optimal IM and utilizing it for the response prediction, is presented to anticipate the column displacement profiles of stacked brick columns housed within an AGR core–like structure when subjected to seismic loading. Qualitative and quantitative assessment of the measured and predicted displacements at each brick column interface indicates very good agreement between the two data sets. The column profile trends are captured very well, demonstrating the excellent performance and accuracy of the prediction algorithm. Time, effort, and cost savings could be achieved by using the prediction algorithm to expand the output of further numerical and experimental studies.
This study could be used to improve regulation and industry methods for rapidly evaluating the damage potential of a seismic action for a graphite nuclear reactor core. Although this study focuses on damage indicating parameters for the AGR core structure of an NPP, a similar methodology and criterion could also be used to rapidly assess whether lifeline infrastructures have been damaged after an earthquake to aid in emergency response and loss assessment activities.
Footnotes
Acknowledgements
The experimental studies were carried out in the Earthquake Laboratory (EQUALS) at University of Bristol. All support is gratefully acknowledged. The views expressed in this paper are those of the authors and do not necessarily represent those of the EDF.
Declaration of conflicting interests
The author(s) declared no potential conflicts of interest with respect to the research, authorship, and/or publication of this article.
Funding
The author(s) disclosed receipt of the following financial support for the research, authorship, and/or publication of this article: The authors are grateful to EDF for both financial and technical support.