
Abstract
Canada’s 2020 national seismic hazard model (CSHM 2020) provides hazard estimates for interface Cascadia Subduction Zone (CSZ) earthquakes in southwestern Canada using four ground motion models (GMMs) with equal weights. Two out of the four GMMs were derived using data primarily from subduction earthquakes in Japan so their use in CSHM 2020 includes a “Japan-to-Cascadia” factor to account for local site conditions. Despite this regional factor, the GMMs do not explicitly consider the amplification effects from the Georgia sedimentary basin below Metro Vancouver. This study benchmarks ground motion shaking from a suite of 30 physics-based simulations of
Keywords
Introduction
Ground motion shaking intensity can increase significantly due to the amplification effects of deep sedimentary basins. These amplification effects are most notable at longer periods, which can have detrimental impacts on medium-to-long period buildings and infrastructure. For instance, observations from the 1985 Mexico City earthquake showed there was a strong correlation between the heavily damaged areas and the basin depth at those sites (Kobayashi et al., 1986). Historically, basin amplification effects have not been explicitly accounted for in national seismic hazard models, and thereby not accounted for in building codes. However, in recent years, the amplification effects of deep sedimentary basins on long-period earthquake ground motions have been studied using recorded (Graves et al., 1998; Rekoske et al., 2021) and simulated motions (Choi et al., 2005; Day et al., 2008; Kakoty et al., 2021; Marafi et al., 2019; Molnar et al., 2014a, 2014b; Olsen, 2000) across various geographical regions. The United States Geological Survey (USGS) has included basin effects (for periods exceeding 1 s) in the 2018 version of the US National Seismic Hazard Model (Petersen et al., 2020) and basin effects are now included in the building code, that is, ASCE 7-22 (American Society of Civil Engineers (ASCE), 2022). While progress has been made in the United States, Canada’s national seismic hazard model and the National Building Code of Canada (NBCC) do not explicitly account for these effects.
Graves et al. (1998) evaluated the effect of the basin-edge structure in ground motion amplification in the Santa Monica area using observations from the
The advent of robust physics-based simulations of earthquake ground motions have facilitated studies of the expected level of basin amplification as a function of basin properties (Choi et al., 2005; Day et al., 2008; Molnar et al., 2014a, 2014b; Olsen, 2000), as well as studies of the resulting impact of basin amplification on the seismic performance of buildings (Bijelić et al., 2019; Kakoty et al., 2021; Kourehpaz et al., 2021; Marafi et al., 2017, 2019; Monfared et al., 2021). Olsen (2000) quantified basin amplification in the Los Angeles basin as a ratio of peak velocity obtained from three-dimensional (3D) simulations (considering basin effects) and predictions using a regional one-dimensional (1D) model (neglecting basin effects) for nine shallow crustal scenario earthquakes. This study estimated average amplification factors up to a factor of four, with considerable variation across individual scenarios (by a factor of up to 2.5). Olsen (2000) also found that average basin amplification correlated well with basin depth and that the amplification generally increased with increasing basin depth expressed in terms of Z2.5, that is, the depth to soils with a shear wave velocity of 2.5 km/s.
Choi et al. (2005) investigated the relationship between basin amplifications and basin depth, as well as the location of the seismic source relative to the basin extents. Amplification factors for 5% damped response spectral acceleration (SA) were derived from strong-motion recordings (from basin and non-basin sites in southern California and the San Francisco Bay Area). The basin depth parameter considered was Z1.5, that is, the depth to soils with a shear wave velocity of 1.5 km/s. The basin edge was defined by a Z1.5 boundary of 500 m. BAFs were calculated as the ratio of SA with simulations that included the 3D basin geometry, and simulations that utilized a 1D layered-rock model. The reference 1D model used in the simulations had a surface shear velocity of about 3000 m/s (i.e. seismological rock). This is significantly higher than typical engineering rock, which has a value around 600–700 m/s.
Day et al. (2008) developed a model for basin effects on long-period response spectra for the Los Angeles basin by isolating the effects of basin depth and period. The authors used 3D numerical simulations of long-period (2–10 s) ground motions for a suite of 60 scenario earthquakes ranging from
In the US Pacific Northwest, Marafi et al. (2019) computed BAFs in the Seattle basin using 30 physics-based simulations of
In the Georgia sedimentary basin, studies by Molnar et al. (2014a, 2014b) estimated average peak ground velocity (PGV) BAFs of 4.1 and 3.1 for shallow blind-thrust North America plate and deep Juan de Fuca plate scenario earthquakes, respectively. Kakoty et al. (2021) quantified BAFs for a series of sites in the Georgia sedimentary basin by comparing SA estimates from the simulated
Canada’s sixth generation seismic hazard model
As an essential part of the national seismic risk reduction strategy, Natural Resources Canada (NRCan) has been periodically updating Canada’s national seismic hazard model since its first edition was introduced in 1953 (Kolaj et al., 2020a). The first generation of the seismic hazard model was deterministic in nature, that is, it was created with qualitative assessments of previous earthquakes and the potential spatial extent of the damage. In 1970, the first fully probabilistic assessment of seismic hazard was incorporated into the national seismic hazard model with a single intensity measure of peak ground acceleration (PGA) and a probability of exceedance of 40% in 50 years (return period of ∼100 years). In the 1985 version of the seismic hazard model, the probability of exceedance was lowered to 10% in 50 years (return period of ∼475 years) and one additional intensity measure, PGV, was added. The following three editions (released in 2005, 2015, and 2020) of the seismic hazard model introduced additional intensity measures, including SAs at different periods. The probability of exceedance of the seismic hazard was further reduced to a 2% probability of exceedance in 50 years (return period of ∼2475 years). The capabilities of the seismic hazard model have increased multi-fold with the introduction of epistemic uncertainty, increased number of maps, hazard estimates at multiple probabilities of exceedance, and so on. Seismic hazard estimates from the national seismic hazard model are adopted by the NBCC for use in building design.
The 2005 version of the seismic hazard model included, for the first time, the Cascadia Subduction Zone (CSZ; Kolaj et al., 2020a), a 1000 km long megathrust fault spanning from Northern Vancouver Island, BC to Cape Mendocino, CA, with an estimated average recurrence of ∼500 years (Atwater et al., 1995). However, it was not until the 2015 version that the hazard estimates from the CSZ were incorporated within a probabilistic framework. The 2020 national seismic hazard model (Kolaj et al., 2020b), also referred to as the sixth generation seismic hazard model, provides hazard estimates from interface CSZ earthquakes in southwestern Canada using four GMMs with equal weights: Abrahamson et al. (2016), Zhao et al. (2006), Ghofrani and Atkinson (2014), and Atkinson and Macias (2009). This is in contrast to the previous edition of the seismic hazard model where the Atkinson and Macias (2009) GMM was given a weight of 50%, and the other models were assigned unequal weights on the basis of their perceived relevance to the CSZ. Because the studies by Zhao et al. (2006) and Ghofrani and Atkinson (2014) were derived using data primarily from subduction earthquakes in Japan, their use in Canada’s national seismic hazard model includes a “Japan-to-Cascadia” factor (Atkinson and Adams, 2013) to account for the average site and path differences between Japan and Cascadia. These factors were obtained by taking the average of two sets of factors available in the literature by (1) Atkinson and Boore (2003), who calculated the factors by considering region-based residuals to global GMMs for subduction events, and (2) Atkinson and Casey (2003), who examined these factors in detail by comparing recorded motions for an event in Japan to those for a comparable event in western North America. Despite this regional factor, the GMMs do not explicitly consider basin amplification effects from the Georgia sedimentary basin below Metro Vancouver. Table 1 lists the four GMMs considered in Canada’s sixth generation seismic hazard model to characterize ground motion shaking from CSZ earthquakes, including features of each of the GMMs.
List of ground motion models (GMMs) used in CSHM 2020 to characterize the hazard from subduction interface earthquakes
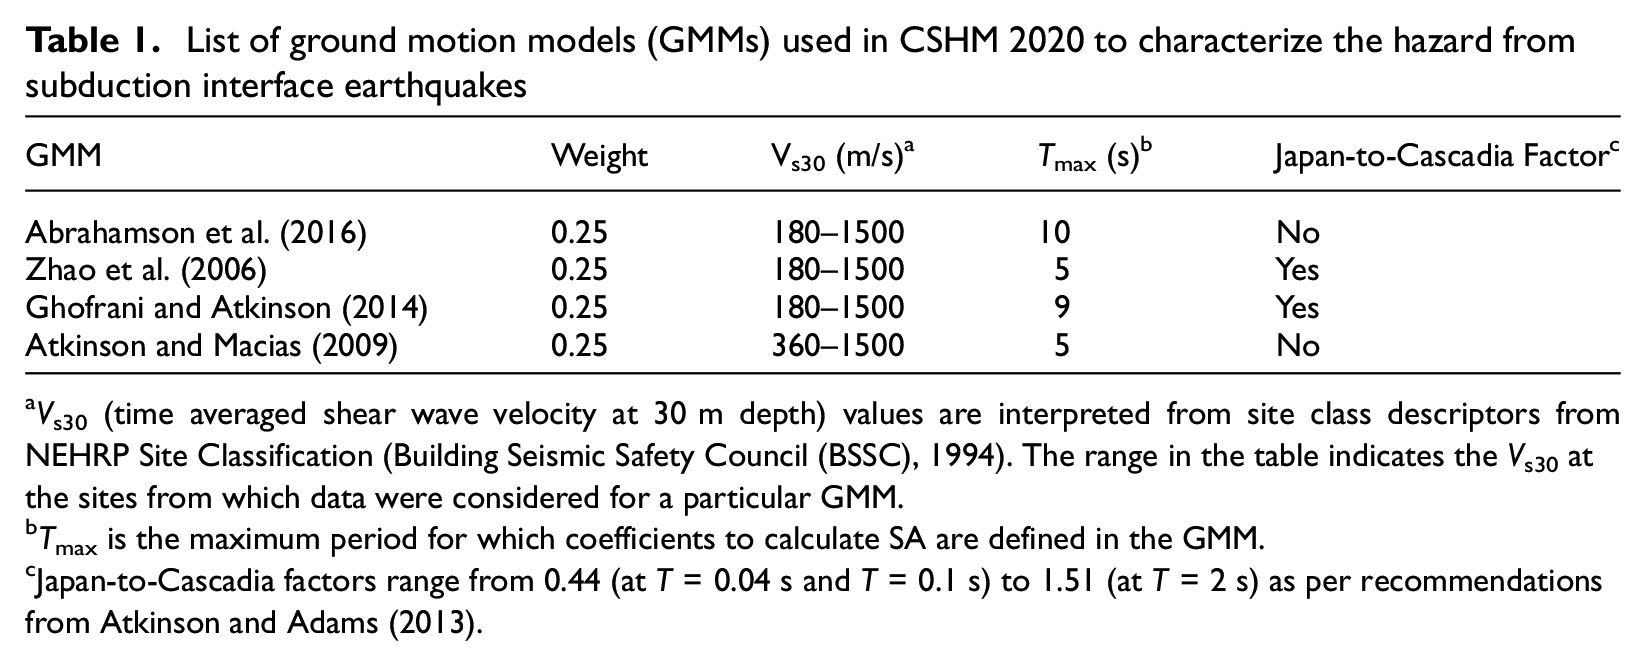
Vs30 (time averaged shear wave velocity at 30 m depth) values are interpreted from site class descriptors from NEHRP Site Classification (Building Seismic Safety Council (BSSC), 1994). The range in the table indicates the Vs30 at the sites from which data were considered for a particular GMM.
Tmax is the maximum period for which coefficients to calculate SA are defined in the GMM.
Japan-to-Cascadia factors range from 0.44 (at T = 0.04 s and T = 0.1 s) to 1.51 (at T = 2 s) as per recommendations from Atkinson and Adams (2013).
As seen in Table 1, only two of the GMMs estimate SAs at periods greater than 5 s, and only one estimates shaking at a period of 10 s. Estimates of SA at long periods are of special significance because the CSZ dominates the seismic hazard at long periods and the Metro Vancouver region in southwest British Columbia has a high concentration of tall buildings and other long period infrastructure (Kakoty et al., 2021; Monfared et al., 2021). SA estimates between Tmax and 10 s are obtained by extrapolation of the ratio of SA at Tmax to be consistent with the study by Abrahamson et al. (2016), which is defined up to 10 s (i.e. SA estimates beyond Tmax follow the same slope as that of the study by Abrahamson et al. 2016).
Simulated M9 CSZ earthquake ground motions
The paucity of quantitative observations of CSZ interface earthquakes led a collaborative group of researchers from the USGS and the University of Washington (UW) to develop a set of 30 simulated
Georgia sedimentary basin
The Georgia sedimentary basin in southwest British Columbia is one of a series of basins extending from California to southern Alaska along the Pacific margin of North America (England and Bustin, 1998) and is relatively shallow and wide (130 by 70 km wide by 5 km in depth) compared to basins further south in Seattle, WA (75 by 30 km wide by 8 km in depth; Frankel et al., 2007) and Los Angeles, CA (50 by 30 km wide by 5 km in depth; Magistrale et al., 1996). Properties of the Late Cretaceous and Tertiary sedimentary rocks within the Georgia basin and its basement are known from seismic surveys (White and Clowes, 1984), particularly seismic tomography results of the 1998 Seismic Hazards Investigations in Puget Sound experiment (Brocher et al., 2001; Dash et al., 2007; Ramachandran et al., 2004a). The presence of the Georgia basin is expected to cause amplification of ground motions in Metro Vancouver, based on amplification observed in areas with sediment-filled basins (Campillo et al., 1989; Frankel et al., 2009; Olsen, 2000). The amplifications are likely to occur in the medium-to-long period range and can have adverse consequences on the seismic performance of structures, particularly with periods in the 1–5 s range (Kakoty et al., 2021). In previous studies, average Georgia BAFs were estimated to be 4.1 and 3.1 for shallow blind-thrust North America plate and deep Juan de Fuca plate scenario earthquakes, respectively (Molnar et al., 2014a, 2014b). These amplification factors determined by Molnar et al. (2014a, 2014b) are the ratios of the synthetic PGV ground motions for the same earthquake scenario using a velocity model that includes the Georgia basin to that of a non-basin velocity model (depth to primary wave velocity (Vp) of 5.5 km/s).
The USGS-UW M9 project uses a CVM of the Pacific Northwest (Stephenson et al., 2017), originally developed by Stephenson (2007), spanning from northern California to southern British Columbia with dimensions of 337.5 km north-south by 200 km east-west by 60 km up–down and a spatial uniform-grid resolution of 500 m. The physical model is represented by six geologic units (continental basin sediments, crust and mantle, as well as oceanic sediments, crust, and mantle) characterized by unique primary wave velocity (Vp), shear wave velocity (Vs), and density. The oceanic crust is set to a thickness of 5 km. The 3D sedimentary basin structure in the Georgia basin region is primarily constrained by the tomographic Vp model (1 km grid; Ramachandran et al., 2004b, 2006). The Vp/Vs ratio for Quaternary basin sediments varies from 2.5 at the surface to 2.2 at 1 km depth. Tertiary sediments are set to a Vp/Vs ratio of 2, and their base is taken as the 4.5 km/s isovelocity contour (Ramachandran et al., 2006). Densities are derived from the Vp model using the Nafe–Drake relation (Ludwig et al., 1970). Surface topography is not included. The minimum Vs is set to 600 m/s for computational feasibility. The surface of the 3D basin model, therefore, represents over-consolidated Pleistocene and older glaciated sediments or stiff soil sites, that is, post-glacial sediments are not included in the model, the thickest of which occur in the Fraser River delta (up to 300 m) in southwestern Greater Vancouver. For 3D simulations of
Figure 1 illustrates the model by Stephenson et al. (2017) in terms of depth to a Vs of 2.5 km/s (Z2.5,) and shows the sites selected for this study as listed in Table 2. Molnar et al. (2014a, 2014b) updated the Stephenson (2007) model for the Georgia sedimentary basin in southern British Columbia. However, their updates were not incorporated into the model used by Stephenson et al. (2017) to generate the 30
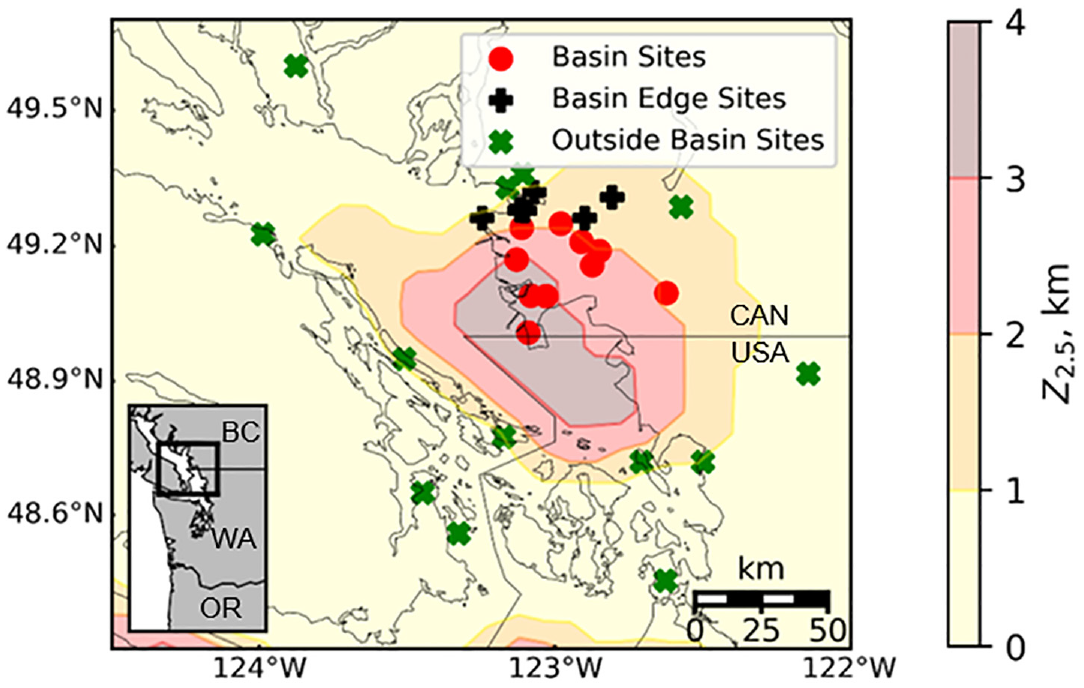
Spatial variation of Z2.5 from the Pacific Northwest community velocity model overlaid with selected sites of this study (listed in Table 2).
Summary of site characteristics at locations within the Georgia sedimentary basin, basin edge, and outside basin.
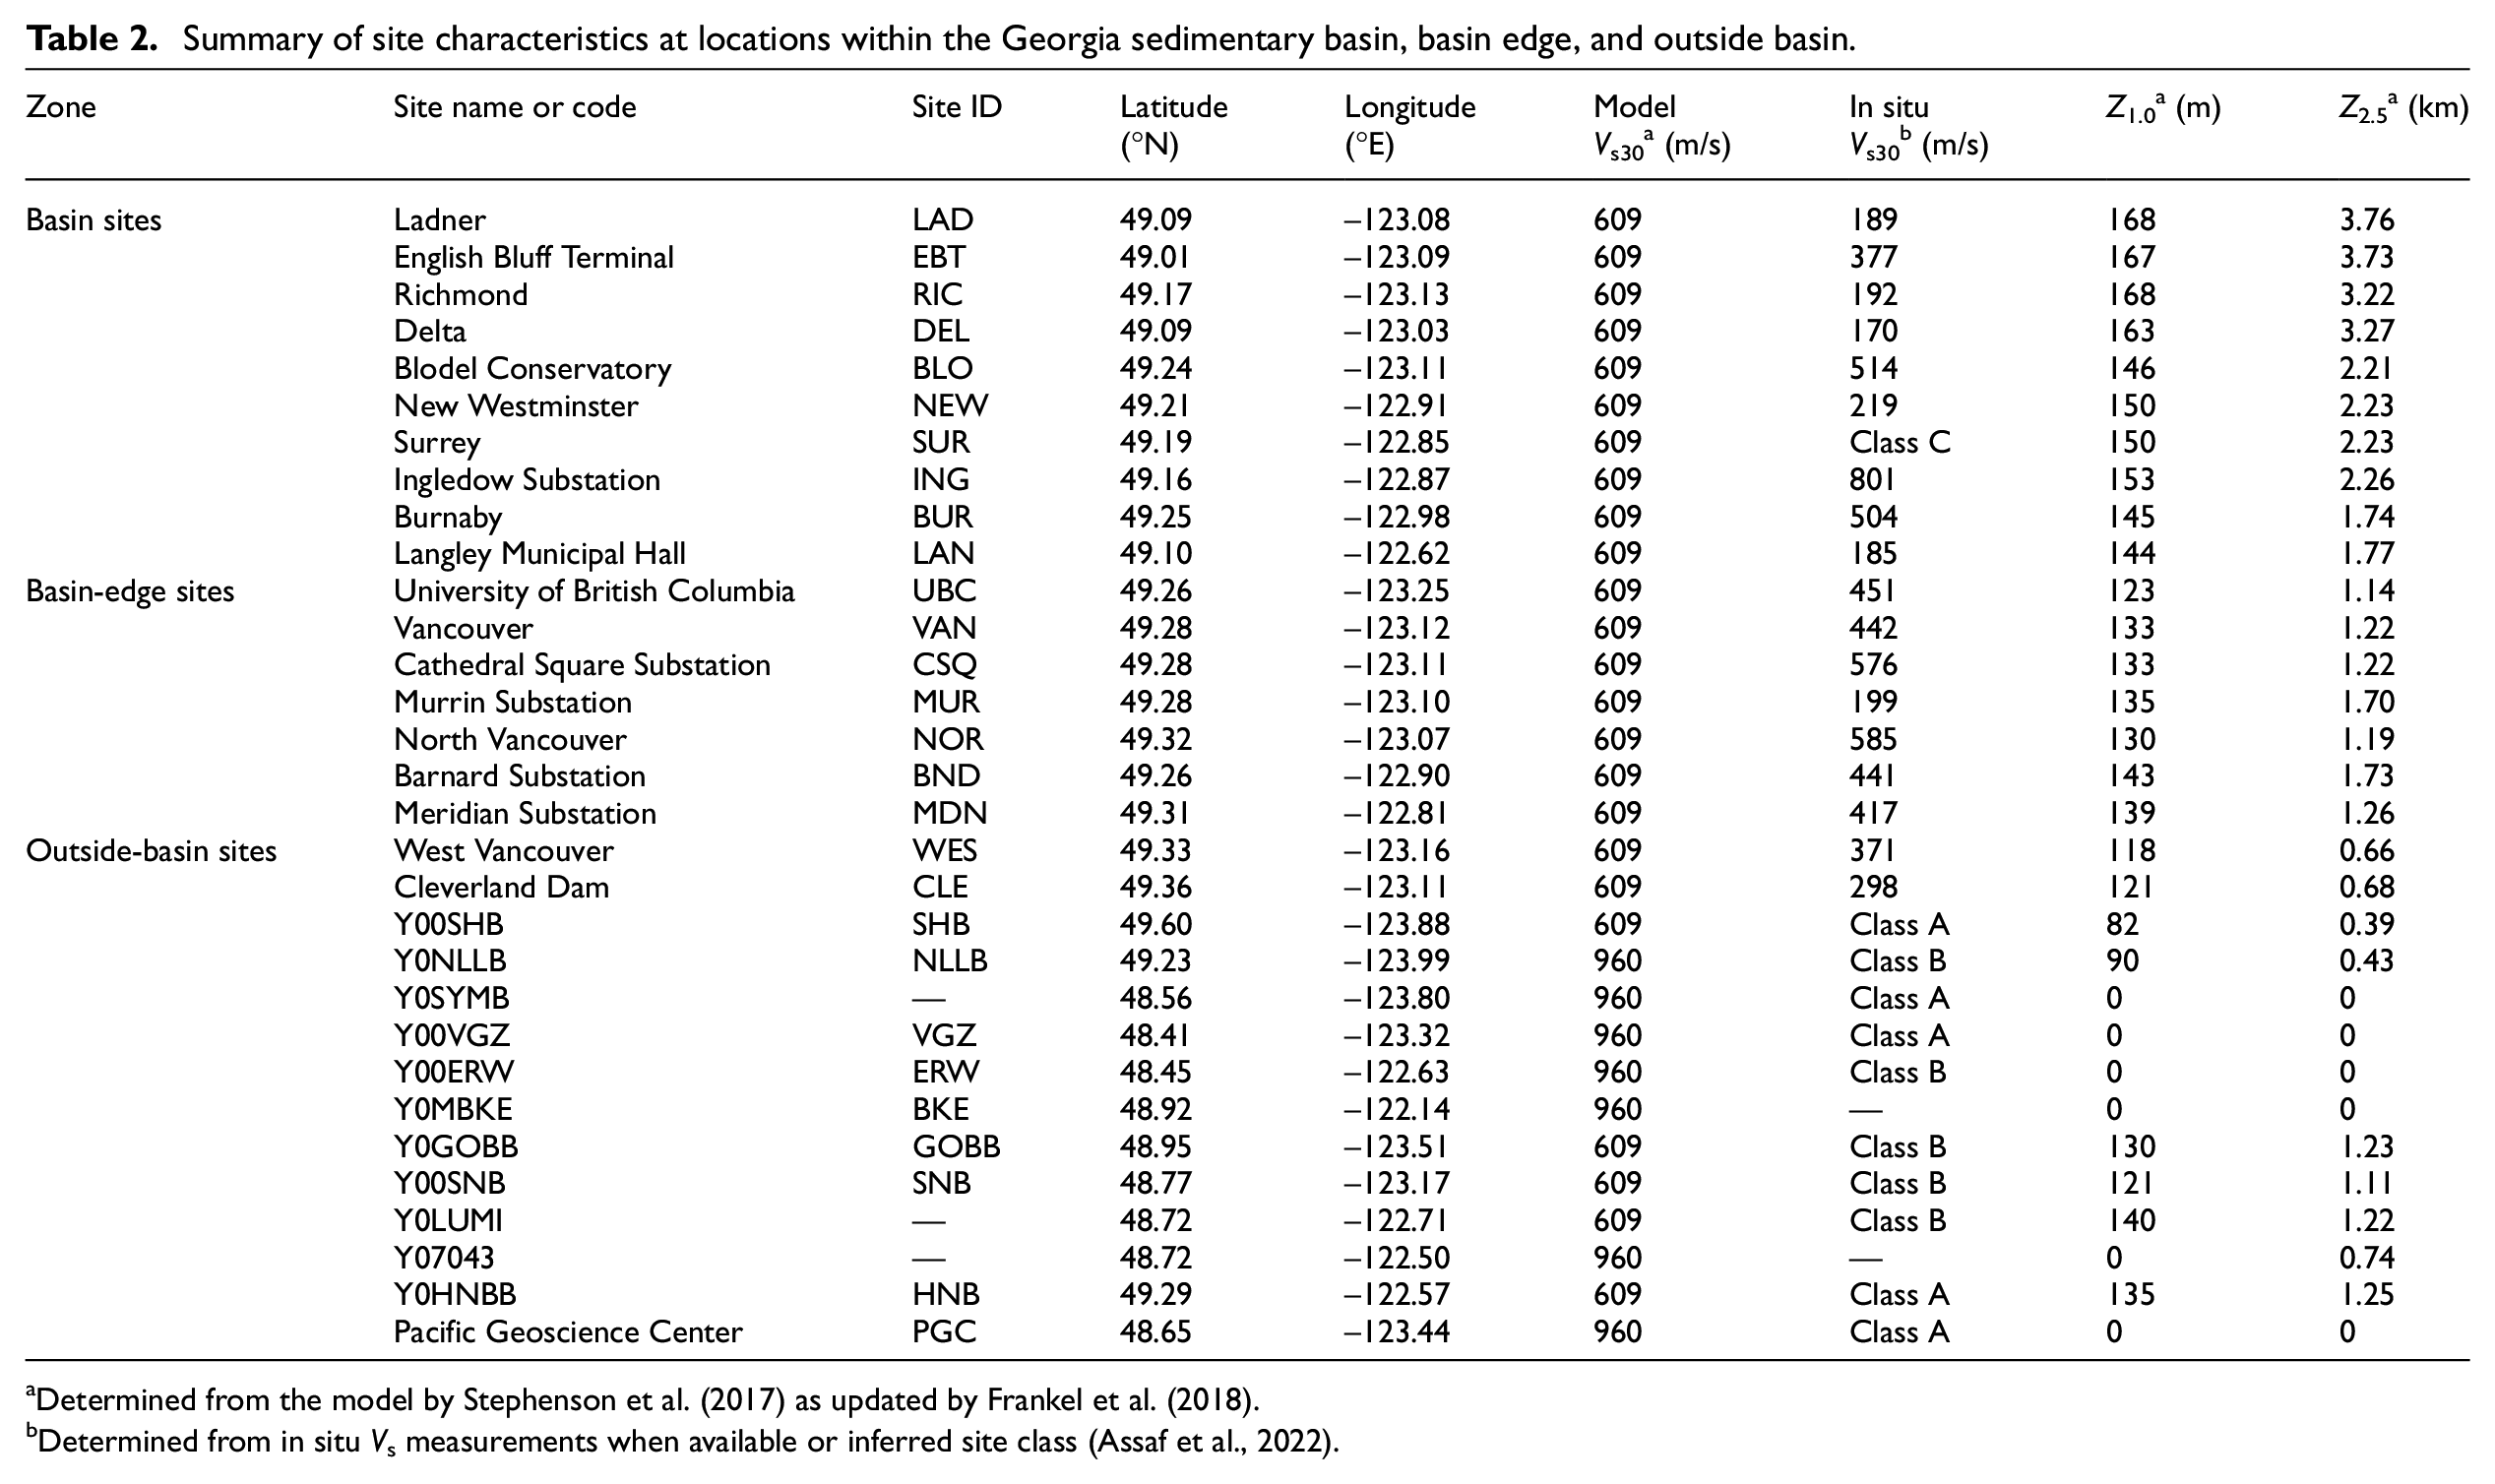
Determined from the model by Stephenson et al. (2017) as updated by Frankel et al. (2018).
Determined from in situ Vs measurements when available or inferred site class (Assaf et al., 2022).
Benchmarking simulated M9 spectra against GMMs in CSHM 2020
Selection of reference sites within and outside the basin
The choice of a reference site is pivotal to estimating basin amplification. A reference condition can have a significant impact on the shape (both the peak amplitude and peak frequency/period) of the calculated basin amplification function. When non-basin synthetic ground motions are not available, the selected reference condition is commonly taken as a site (or sites) outside the basin and near the interface of Z2.5≈ 1 km ( Kakoty et al., 2021; Marafi et al., 2019; Wirth et al., 2018). This selection is based on the concept that the basin effect is not present or minimal when Z2.5 < 1 km. For example, using Z2.5≈ 3 km as a reference condition around the Seattle basin, Wirth et al. (2018) showed that the mean BAF from the M9 project’s simulations was ∼1.5 at 1 s, increasing to ∼2 at periods greater than 2–3 s (see their Figure 6). When the reference condition is changed to Z2.5≈ 1 km, BAFs determined by Frankel et al. (2018) ranged from about 1.5 to 5 at periods of 1–10 s, with peak basin amplification of 5 at about 3 s (see their Figure 25).
For this study, we define three zones in the model by Stephenson et al. (2017; refer back to Figure 1): outside of basin with Z2.5 < 1 km, basin edge with 1 km ≤ Z2.5 ≤ 2 km and (deep) basin with Z2.5 > 2 km. We therefore introduce two options as the reference condition to determine basin amplification using the synthetic broadband ground motions from the set of 30 CSZ simulations of the M9 project (Frankel et al., 2018): (1) relative to the basin-edge sites and (2) relative to the outside-basin sites. Furthermore, to minimize the risk of error arising from localized effects at any particular station, we select a number of reference sites at various azimuthal distributions within each of the two reference condition groups.
The selected non-basin rock reference condition where Z2.5 is < 1 km include several areas (as seen in Figure 1) on Vancouver Island including Greater Victoria and westward to Port Renfrew, as well as much of the area west of Duncan/Nanaimo. In the Lower Mainland, non-basin rock conditions occur along Vancouver’s North Shore (West and North Vancouver) and near the eastern model limit straddling the United States–Canada international border. As the first layer of the Stephenson et al. (2017) model is 500 m, the shear wave velocity in this layer serves to characterize the Vs30 at each site of interest according to the NBCC seismic site class (as listed in Table 2). The range of Vs30 for non-basin reference sites is 609–960 m/s or seismic site class C (Vs30 = 361–760 m/s) to B (Vs30 = 761–1500 m/s).
Basin-edge reference sites are locations with Z2.5 between 1 and 2 km. Both basin-edge and basin sites have the same Vs30 of 609 m/s in the velocity model by Stephenson et al. (2017). However, in reality, basin-edge sites correspond to consistently higher in situ Vs30 (> 400 m/s) relative to basin sites (as listed in Table 2). Since the
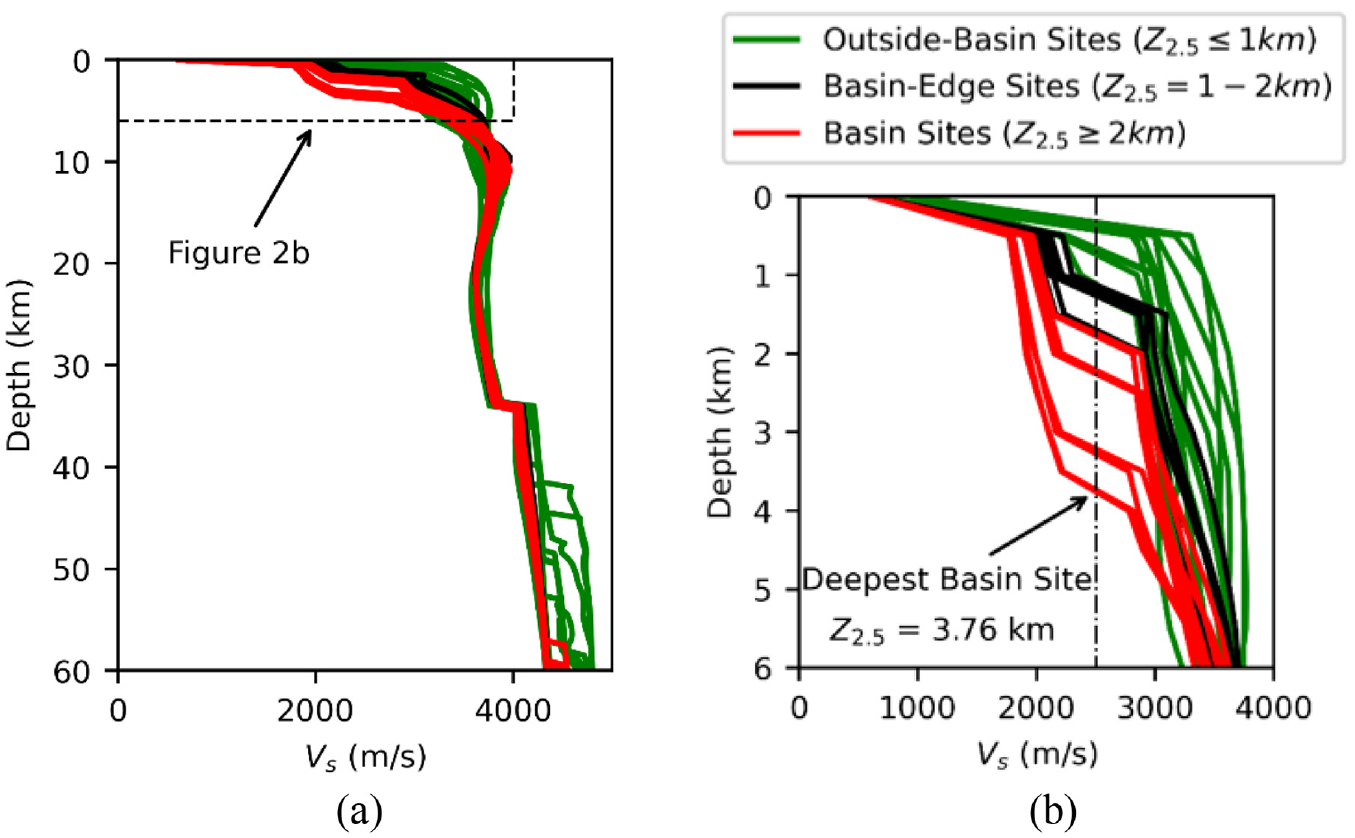
V s profiles at selected locations as per Stephenson et al. (2017) grouped by the three selected zones up to a depth of (a) 60 km and (b) 6 km. The vertical dashed black line in Figure 2b indicates a Vs of 2500 m/s and the corresponding depth for each site yields Z2.5.
Comparison of SA estimates inside and outside the basin
At all sites of interest, SAs of the simulated
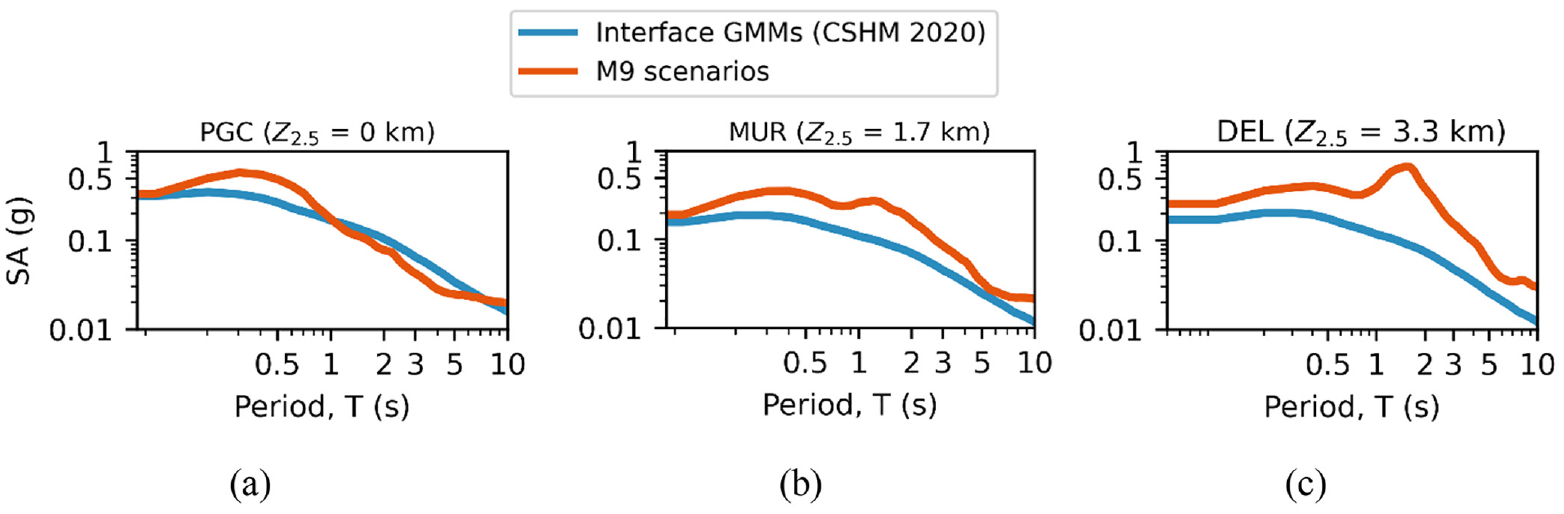
Average geomean response spectra of the 30 simulated
As shown in Figure 3a, SA estimates are consistent between the simulated
Basin amplification factors
Formulation
In this study, an extension of the site-specific and period-dependent BAF formulation employed by Kakoty et al. (2021) is used to quantify amplification in SA at basin sites. Equation 1 illustrates the BAF calculation, which uses the simulated set of
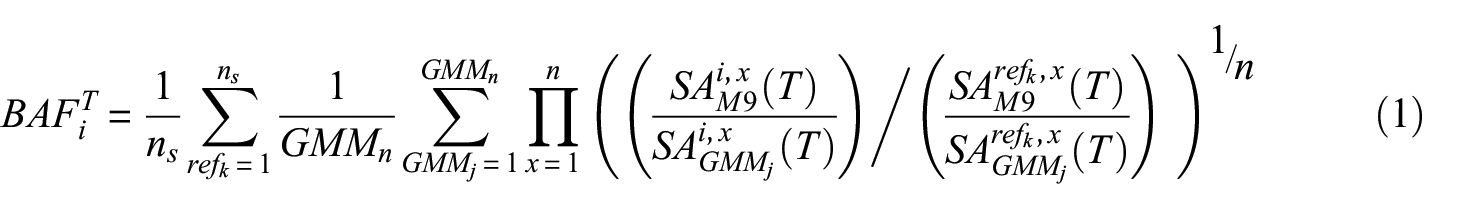
Figure 4 highlights variability in the resulting BAF calculated at a basin site due to differences in GMM estimates, as seen in Figure 4a, and due to differences in reference sites within a zone, as seen in Figure 4b. Figure 4a illustrates calculated BAF for one basin site (DEL) with one reference site (PGC) to highlight the difference in BAF estimated using the four GMMs as listed in Table 1. Whereas Figure 4b illustrates the calculated BAF for one basin site (DEL) using one GMM (Abrahamson et al., 2016) to highlight the variation that occurs due to the selection of different reference sites.
Variability in average (μ) BAF with one standard deviation (σ) for a site in Delta due to (a) variation in GMM estimates for a given reference site (i.e. PGC) and (b) 13 reference sites within the outside-basin zone as listed in Table 2 for a given GMM (Abrahamson et al., 2016).
Results
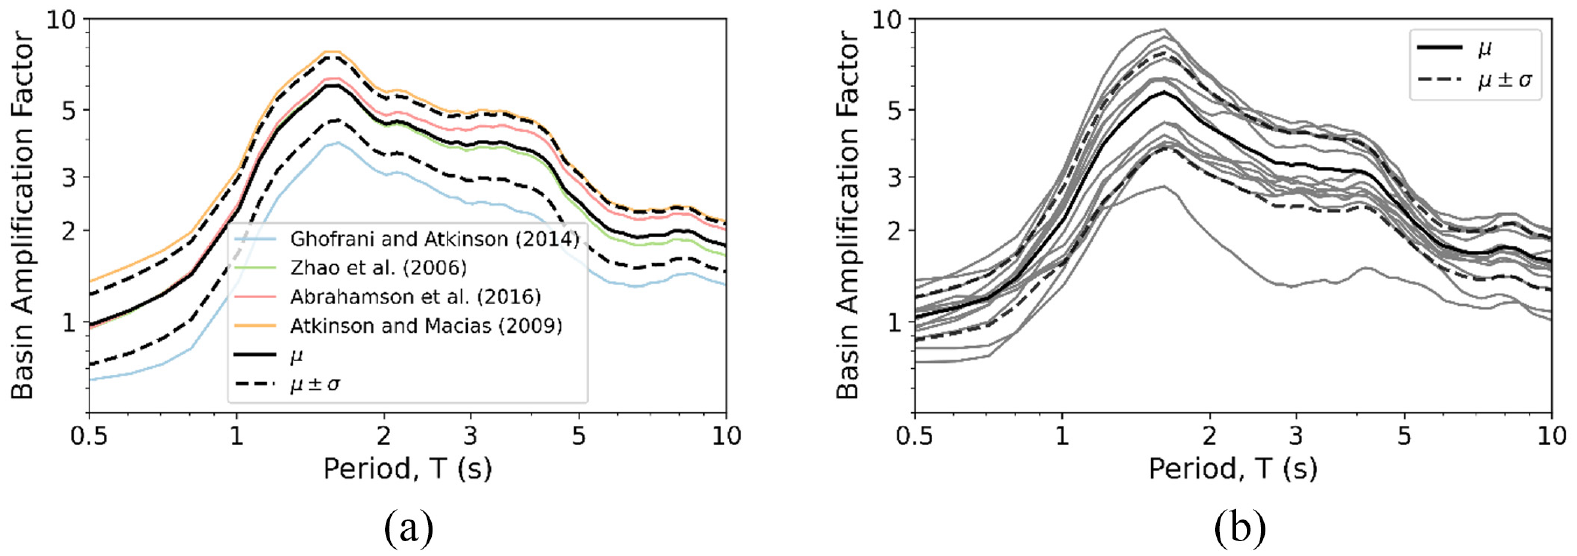
Figure 5a and b illustrate the resulting variability in BAFs as a function of the choice of reference condition, that is, basin-edge or outside-basin zones. Each geometric mean BAF is computed using 30 simulated ground motions at the site of interest with respect to a reference site located in the basin-edge and outside-basin zones. The average of the geometric mean BAFs captures the azimuthal variability for each of the two reference conditions where the n value in Figure 5 indicates the number of reference sites within each zone. The maximum average BAF among the sites of interest occurs at the Ladner (LAD) basin site and are 8.09 and 2.74 at a 1.61 s period, with respect to outside-basin and basin-edge reference sites, respectively. The difference in the average BAF between the two reference conditions is consistently 2.6–3.1 times higher for the outside-basin when compared to the basin-edge reference condition. The variability in the BAF estimates is generally lower when using basin-edge reference sites than outside-basin reference sites, as observed by comparing Figure 5a and b. The lower variability in BAF for basin-edge reference sites is attributed to lower variability in the SA estimates from the GMMs resulting from the proximity of the site of interest and reference locations as inferred from Figure 1.
Average (μ) and one standard deviation (σ) basin amplification factors for the 30
Generally, the period-dependent BAFs in Figure 5c and d result in two types of shape: broad and narrow peak amplification. The narrow peak amplification shapes (e.g. DEL, EBT, LAD sites) are associated with sites with Z2.5 greater than 3 km, whereas the broad peak amplification shapes (e.g. BLO, ING, BUR) are associated with sites with Z2.5 between 2 and 3 km. The outside-basin reference sites are much more scattered geographically compared to the basin-edge reference sites, which results in higher variation in SA estimates due to the difference in local site conditions as well as a higher degree of variation in the source-to-site distances than basin-edge sites. These effects combine in the BAF calculations resulting in greater BAF variation for outside-basin reference sites than basin-edge reference sites. Average BAF at the selected basin sites generally increase with increasing Z2.5, especially in the period range of 1–5 s. These findings are consistent with those from Olsen (2000). Figure 6 shows the distribution of BAFs at 3 s period for each basin site in decreasing order of Z2.5, with respect to outside-basin and basin-edge reference sites.
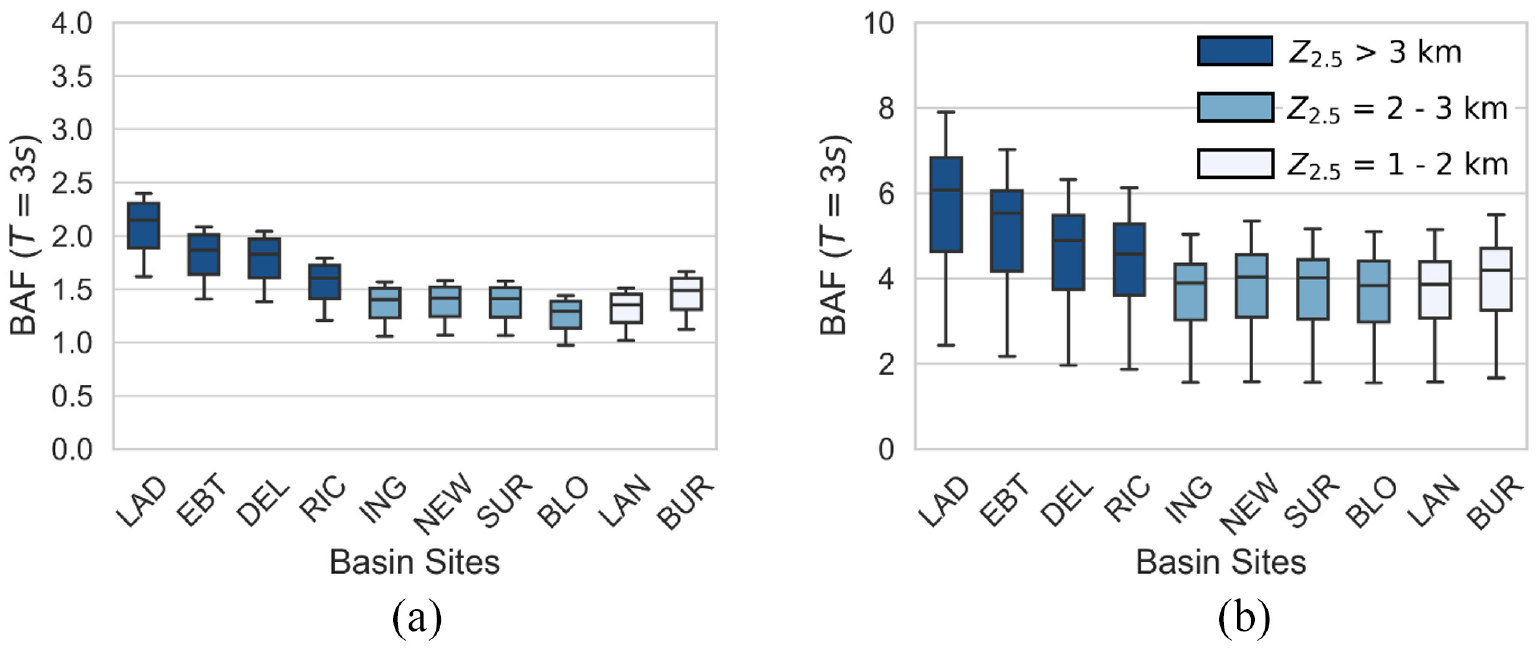
Distribution of basin amplification factors (BAFs) for all basin sites in decreasing order of Z2.5 (lighter shading corresponds to shallower Z2.5) at a period of 3 s with respect to reference sites located within the (a) basin-edge (n = 7) and (b) outside of the basin (n = 13). Note different BAF axis scaling of (a) and (b).
Development of modified uniform hazard spectra
Currently enforced seismic design provisions of the 2020 NBCC (NRC, 2020) utilize a 5% damped uniform hazard spectrum (UHS) with a 2% probability of exceedance in 50 years to define the design level earthquake. By definition, the UHS envelopes SA estimates at all periods with a specified hazard level (e.g. 2475 year return period) as obtained by probabilistic seismic hazard analysis, considering all potential earthquake sources, magnitudes and distance combinations. Currently, the UHS defined in the 2020 National Building Code does not explicitly account for basin amplification due to the Georgia sedimentary basin because the underlying GMMs within the 2020 National Seismic Hazard Model do not explicitly include these effects. As a result, in southwestern British Columbia, buildings within the Georgia Sedimentary Basin, particularly long-period structures, are currently being designed for a hazard level that is lower than anticipated when basin amplification effects are considered. To address this issue, a modified UHS is proposed to incorporate the BAFs previously computed to explicitly incorporate basin amplification effects in the calculation of the UHS used in design. Because the BAFs are derived from physics-based simulations from the
The methodology involves three steps: (1) disaggregating the UHS at the site of interest per seismic source contribution, that is, crustal, interface, and inslab earthquakes; (2) applying the calculated BAFs to the interface contribution to the hazard at each period; and (3) re-aggregating the hazard estimates to obtain the modified UHS. In doing so, the modified UHS explicitly accounts for the amplification effects of the Georgia basin in the interface contribution to the hazard. Because BAFs are computed using basin-edge and outside-basin reference conditions, the resulting UHS is also computed for these two reference conditions. An example is provided to showcase the methodology as applied to the UHS defined in the 2020 edition of the NBCC (NRC, 2020). However, because the seismic hazard disaggregation data from CSHM 2020 is not yet publicly available, we assume seismic hazard disaggregation per source will not vary significantly between the 2015 and 2020 CSHM.
To illustrate a practical implementation of the methodology, the modified UHS, considering the amplification effects of the Georgia basin on CSZ megathrust earthquakes, is calculated for the BLO site (as listed in Table 2). Figure 7 illustrates in a solid blue line the UHS for the BLO site of interest as derived from CSHM 2020. Figure 7 also illustrates the seismic source disaggregation of the UHS, highlighting how interface earthquakes dominate the hazard at periods greater than 1 s, with negligible contributions from crustal and inslab seismic sources at longer periods. The interface BAF calculated at this site, applied to the interface contribution of the hazard, is illustrated by the dashed brown line. This modified interface hazard contribution is then re-aggregated with the crustal and inslab hazard estimates to obtain the modified UHS as shown by the dotted blue line. Figure 7 illustrates the results of the calculation using basin-edge (Figure 7a) and outside-basin (Figure 7b) reference locations. Since this study only explores basin amplification for interface sources, the resulting factors are only applied to the interface contribution to the hazard. However, basin amplification for inslab earthquakes would raise the modified UHS because inslab earthquakes represent a considerable contribution to the hazard, particularly at the 1–2 s period range.
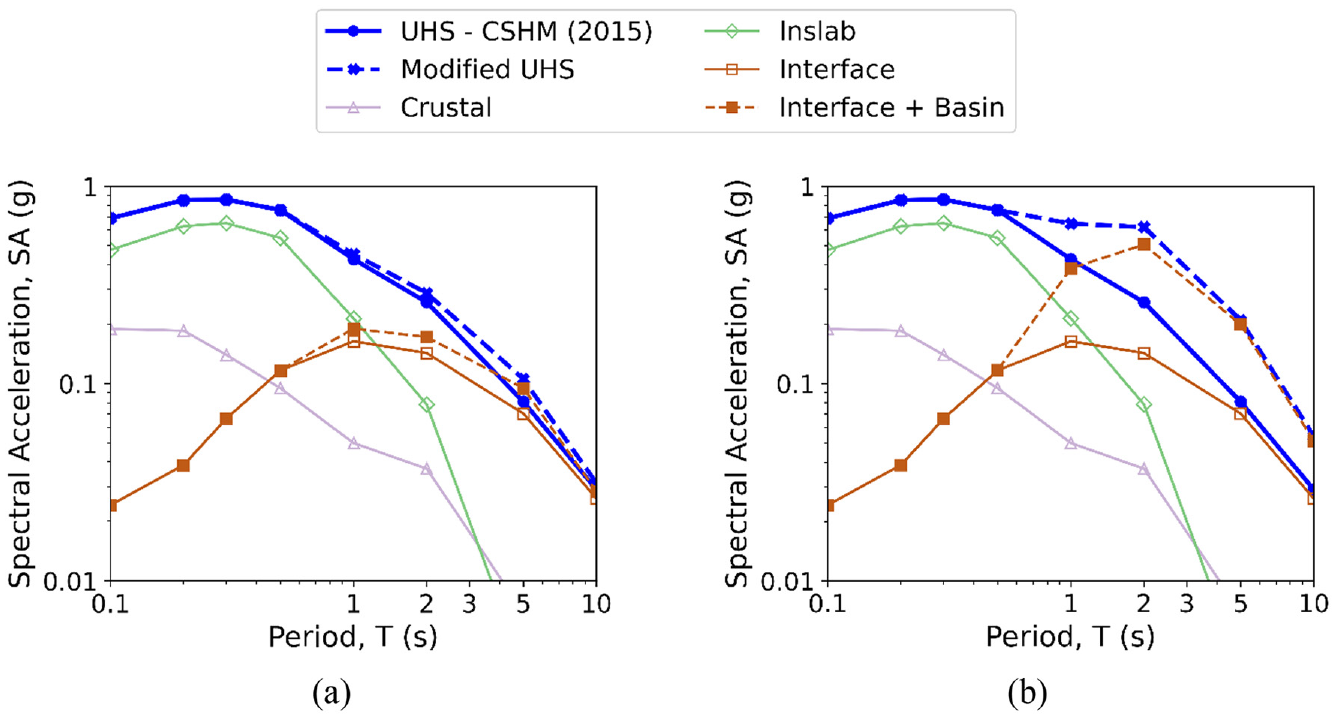
Modified uniform hazard spectrum or UHS (dashed blue line) at BLO explicitly considering interface–source basin amplification calculated with (a) basin-edge and (b) outside-basin reference locations compared to the CSHM 2020 UHS (solid blue line).
As observed in Figure 7, the modified UHS results in considerably higher SA at longer periods than currently estimated by CSHM 2020. For the BLO site considered in Figure 7, the average increase in SA estimates in the 1–5 s period range is 29% and 141% when BAFs with respect to basin-edge sites and outside-basin sites are adopted, respectively. The SA amplifications follow the trends previously presented in Figure 5, resulting in the greatest amplifications in the 1–2 s period range. For instance, at a 2 s period, the modified UHS at the BLO site of interest is 0.32 and 0.69 g with respect to basin-edge and outside-basin reference sites, respectively, as compared to 0.26 g for the non-basin UHS, that is, there is 23% and 165% increase in SA, respectively, when basin effects are considered. Similarly, at a 5 s period, the modified UHS results in a 43% and 184% increase for basin-edge and outside-basin reference sites, respectively. Results in Figure 7 adopt BAFs for periods exceeding 1 s since basin amplification is explicitly considered only for that period range. Modified UHS calculations are carried out at other basin sites in an identical way, and these results are summarized in the Electronic Appendix.
Long-period amplification from recorded strong-motion data
Ground motion recordings of the 2001 M6.8 Nisqually earthquake
The 2001
Strong-motion recordings of the Nisqually earthquake in southwest British Columbia were documented by Cassidy et al. (2003). Molnar et al. (2014a) evaluated Nisqually earthquake recordings in the Georgia basin region of both British Columbia and Washington State. Nisqually earthquake ground motions in the Georgia basin region are significantly lower than in the Seattle basin region (Molnar et al., 2014a), as the deep earthquake is more than 150 km away from Metro Vancouver. The Nisqually recordings contain significantly more long-period (1–5 s) energy compared to other available strong motion data sets with sufficient signal-to-noise ratio for this region, for example, the 1996 Duvall, 1997 Georgia Strait, and 2015 Victoria earthquakes (Cassidy and Rogers, 1999; Jackson et al., 2017). Other recorded earthquakes with long-period energy generally do not have a sufficient signal-to-noise ratio for further consideration here (Assaf et al., 2022).
The Nisqually earthquake was recorded in the Georgia basin region by continuously recording Canadian National Seismograph Network (CNSN) and Pacific Northwest Seismic Network (PNSN) seismograph stations, as well as trigger-based strong-motion instruments. Strong-motion stations on rock and stiff ground (equivalent to non-basin and shallow basin-edge sites of the velocity model by Stephenson et al., 2017) either did not trigger and hence no recording is available, or triggered but the recording is short and captures the largest amplitude shear and/or surface wave content. The longest duration Nisqually earthquake waveforms were recorded on soft Holocene delta sediments (minimum Vs of 70 m/s) of the Fraser River delta, which are sediments not present in the velocity model by Stephenson et al. (2017; minimum Vs of 600 m/s), that is, stations grouped as basin sites have lower in situ Vs30 than the model Vs30 as previously discussed (refer back to Table 2). As a result, these recordings may reflect amplification from multiple sources, including those associated with the shallow Holocene Fraser River delta sediments as well as those associated with the deeper Georgia sedimentary rock basin. As it is not possible to divorce these two site effects, we refer to the amplification observed in these empirical recordings as LPA.
Long-period amplification factor
To estimate the LPA observed in strong-motion recordings of the 2001 Nisqually earthquake, the recorded SA estimates are benchmarked against SA estimates from subduction inslab GMMs in CSHM 2020. The subduction inslab hazard is estimated in CSHM 2020 as an equally weighted average of four GMMs: (1) Abrahamson et al. (2016), (2) Atkinson and Boore (2003), (3) García et al. (2005), and (4) Zhao et al. (2006). Consistent with the interface–source BAFs previously estimated, we maintain the “basin,”“basin-edge,” and “outside basin” identifiers for the selected seismic stations. Figure 8 shows the spatial distribution of the seismic stations from which Nisqually earthquake time histories are used to estimate the LPA. To maintain consistency with the empirical recordings when estimating SAs at the seismic stations from the GMMs, in situ VS30 at the seismic stations are used, reported as in situ Vs30 in Table 2.
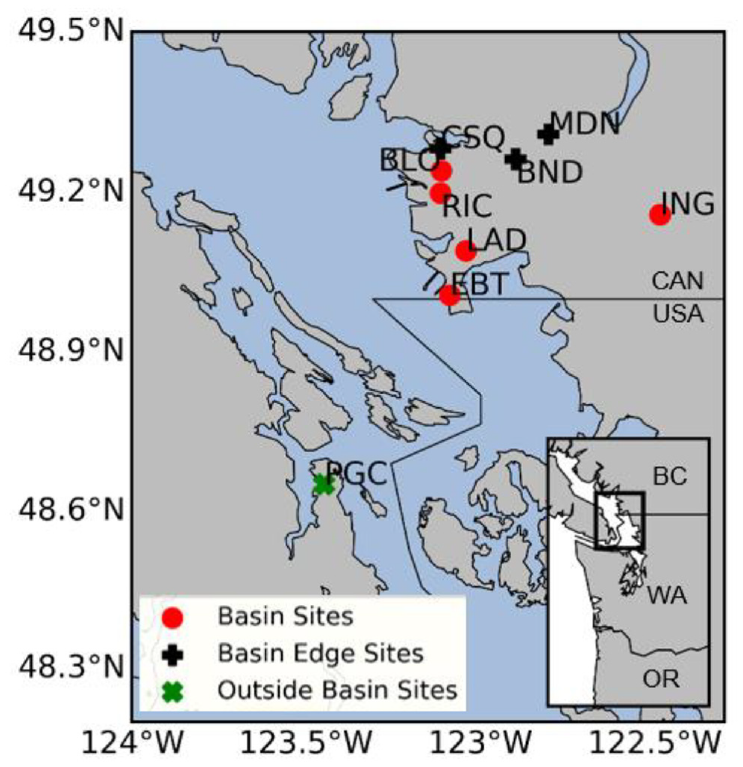
Strong motion stations from which 2001 Nisqually earthquake recordings are used to estimate long-period amplification: Red (EBT, LAD, RIC, BLO, ING), black (CSQ, MDN, BND), and green (PGC) colors indicate sites in basin, basin-edge, and outside-basin zones, respectively, with site ID listed in Table 2.
Figure 9 illustrates the LPA estimates at two sites, LAD and EBT, previously listed in Table 2 and shown in Figure 8. Namely, Figure 9a and c highlight the LPA observed during the 2001 Nisqually earthquake ground motion recordings at the LAD and EBT sites in Vancouver relative to three basin-edge reference sites: BND, CSQ, and MDN. The observed long-period basin-edge amplification at LAD and EBT is overlaid with the interface–source basin-edge BAF estimates previously calculated (as seen in Figure 5a) enveloped by one standard deviation. LPAs observed from the Nisqually motions are consistent with simulated interface–source BAF computed at the same site up to a period of around 2 s. However, BAFs seem to underestimate amplification for periods greater than 2 s. Similarly, Figure 9b overlays the empirical LPA factors and simulated BAF estimates using an outside-basin reference location, namely, the PGC site. These results suggest that simulated BAF predicts higher amplification at shorter periods (≤ 2 s) than the observed LPA, but it is consistent at higher periods (> 2 s). Overall, when basin-edge reference sites are used, empirical LPA factors are greater than the simulated BAFs derived from the physics-based ground motion simulations. There is greater agreement between empirical Nisqually LPAs and the simulated basin amplification estimates with respect to outside-basin reference sites.
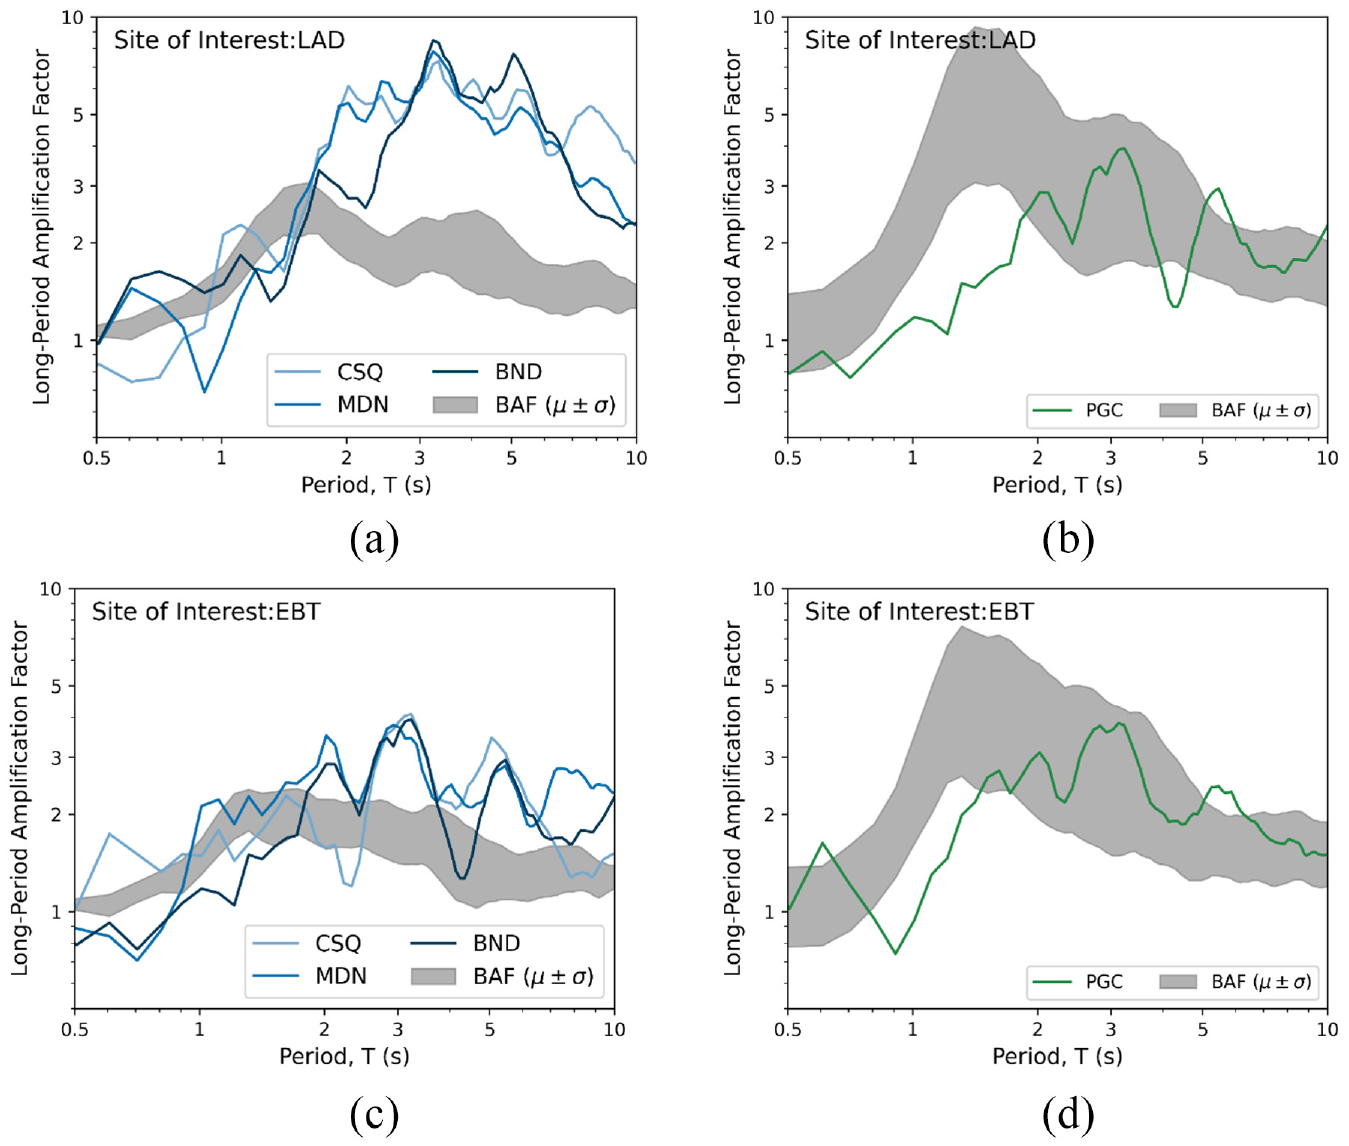
Long period amplification for sites of interest: LAD with reference sites located at (a) basin-edge (BND, CSQ, and MDN) and (b) outside-basin (PGC); and EBT with reference sites located at (c) basin-edge (BND, CSQ, and MDN) and (d) outside-basin (PGC). The shaded area represents calculated average BAF ± one standard deviation with reference sites located in basin-edge and outside-basin, respectively, (as seen in Figure 5a and b).
The SA BAF computed using physics-based ground motion simulation are greatest in the 1–5 s period range (as seen in Figure 5), empirical LPA of SAs determined from the inslab Nisqually earthquake ground motion recordings are observed at longer periods and over a wider range, that is, 2–8 s. In addition, these are most predominant at periods of 2, 3, and 5 s. The most notable observations are (1) agreement in amplification factors (long-period vs basin) observed when outside of basin reference sites are used, as well as the (2) high amplification factors, which range from 5 to 10 over a 2–8 s period range.
It is important to note that different mechanisms of basin amplification would be expected for the Nisqually inslab earthquake and
Conclusion
This study leverages broad-band synthetic ground motions for a suite of 30
SA BAFs generally correlate well with the Z2.5 of the site of interest. Maximum BAFs occur at the deepest basin site Ladner (Z2.5 = 3.76 km), with values of 8.09 and 2.74 at a 1.61 s period when reference sites located outside the basin and in the basin-edge, respectively, are used in the calculations. The average BAFs for the same site at a period of 2 s are 6.29 and 2.24 with reference sites outside the basin and in the basin-edge regions. Average BAFs at the same period for a site with Z2.5 of 2.21 km are 3.53 and 1.21 with reference sites outside the basin and in the basin-edge regions. The modified UHS, which incorporate BAFs for the interface contribution of the hazard, result in 271% and 58% higher spectral ordinates at 2 s period, at the deepest basin site (Ladner), with respect to outside-basin and the basin-edge reference sites, respectively, when compared to the non-basin UHS as derived from CSHM 2020.
LPA factors calculated for recorded ground motions from the
Future work should extend the simulated
Footnotes
Acknowledgements
The authors are very grateful to the M9 team at the University of Washington for sharing the results of their M9 simulations in southwest British Columbia, particularly Nasser A. Marafi, Marc O. Eberhard, Jeffrey W. Berman, Arthur D. Frankel, and Erin A. Wirth. The authors are also grateful for the feedback provided by three independent reviewers and the associated editor, which have greatly improved the quality of the article.
Declaration of conflicting interests
The author(s) declared no potential conflicts of interest with respect to the research, authorship, and/or publication of this article.
Funding
The author(s) disclosed receipt of the following financial support for the research, authorship, and/or publication of this article: This research was funded by Canada’s Natural Sciences and Engineering Research Council under Discovery Grant No. RGPIN-2019-04599, as well as Canada’s New Frontiers in Research Fund—Exploration under Grant No. NFRFE-2018-01060. The authors would also like to thank the University of British Columbia’s Cascadia Engagement Fund for supporting this collaboration with the University of Washington.