
Abstract
We evaluate Cascadia subduction ground-motion models (GMMs), considered for the 2023 US National Seismic Hazard Model (NSHM) update, by comparing observations to model predictions. The observations comprise regional recordings from intraslab earthquakes, including contributions from 2021 and 2022 events in southern Cascadia and global records from interface earthquakes. Since the 2018 NSHM update, new GMMs for Cascadia have been published by the Next Generation Attenuation (NGA)-Subduction Project that require independent evaluation. In the regional intraslab comparisons, we highlight a characteristic frequency dependence for Cascadia data, with short periods having lower ground motions and longer periods being comparable to other subduction zones. We evaluate differences in northern and southern Cascadia and find that the NGA-Subduction GMMs developed using southern Cascadia data perform better in this region than the model that did not consider these data. We compare ground-motion variability in Cascadia with the NGA-Subduction model predictions and find differences at short periods (T = 0.1 s) due to the use of global versus regional data in the development of these models. Moreover, the within-event component of aleatory variability from the GMMs overpredicts the standard deviation of Cascadia recordings at very short periods (T < 0.05 s). Using global interface earthquakes as a proxy to evaluate the Cascadia GMMs, we find long-period overprediction from a simulation-based GMM and some of the empirical GMMs. When comparing recent observations, we find a similar misfit to GMMs and the 2010 and 2022 Ferndale earthquakes. Finally, we observe different basin amplification factors arising in different subsets of the data, which indicate that differences in basin factors between empirical GMMs could arise from the data selection choices by the developers. As part of evaluating the regional basin terms, we apply basin amplification factors from the magnitude 9 Cascadia earthquake simulations to the empirical GMMs for interface earthquakes. The comparisons presented in this study indicate that the NGA-Subduction GMMs for Cascadia perform well relative to observations and older subduction GMMs.
Keywords
Introduction
Each update of the US National Seismic Hazard Model (NSHM) requires evaluating and selecting appropriate ground-motion models (GMMs) that are used to estimate the shaking for each earthquake in a hazard calculation (Petersen et al., 2020). Since the 2018 update of the NSHM, new subduction GMMs from the Next Generation Attenuation (NGA)-Subduction Project (Bozorgnia et al., 2022) have been published for Cascadia. Implementation of these new subduction GMMs in the 2023 NSHM is discussed by Rezaeian et al. (2024). However, regional Cascadia observations are limited to a small number of recordings from a few moderate intraslab earthquakes (Mazzoni, 2021). In addition, the developers of the NGA-Subduction GMMs used different selections of recordings and methodologies in constructing their models.
Seismic hazard is high in Cascadia due to subduction and crustal earthquake sources (Frankel et al., 2015). A major contributor to this seismic hazard is the potential for a megathrust earthquake, such as the one that shook the region in 1700 (Satake, 2003). However, no recordings from such an event are available for Cascadia. In addition, fractures in the northeastern subducting Juan de Fuca plate are a source of deep intraslab subduction events, such as the 2001 (
Another important factor in evaluating GMMs for application in the CSZ relates to their basin terms. The basin response to incoming seismic waves can amplify the ground motion for sites on deep basins due to multiple factors, including surface-wave conversions from S waves at the basin edge and focusing of the S waves from changes in basin geometry (Frankel et al., 2009). In northern Cascadia, the Puget Lowland region is a large forearc basin with multiple sub-basins, including the deep Seattle basin that is known to generate strong amplification at longer periods (Rekoske et al., 2022; Rezaeian et al., 2024). The basin terms in the NGA-Subduction GMMs are parameterized in a similar way, but the developers used different selections of recordings to develop their basin coefficients that result in varying levels of basin amplification. Previous studies that simulated interface earthquakes in Cascadia hypothesized that the shallower incidence angle of interface events may generate stronger basin amplifications (Wirth et al., 2019). This hypothesis is consistent with the high amplification factors in the Seattle basin from the M9 Cascadia earthquake simulations (Frankel et al., 2018b; Wirth et al., 2018b). The empirical basin terms in the NGA-Subduction GMMs were not adjusted to the higher basin amplification factors (BAFs) computed from the M9 simulations. The NGA-Subduction modelers utilized the M9 simulation results in their development process, but only to make comparisons to the model’s empirical basin terms (Abrahamson and Gulerce, 2022; Kuehn et al., 2023; Parker et al., 2022). The 2023 NSHM has incorporated BAFs based on the M9 simulations for interface earthquakes recorded in the deep Seattle basin (Rezaeian et al., 2024). We compare the M9 BAFs for consistency with the observed data and with the parameterizations of the NGA-Subduction GMMs.
The aleatory variability describes the unmodeled uncertainty in the prediction of the median ground motions and has a direct impact on the probabilistic ground motions in a probabilistic seismic hazard analysis. Larger values of aleatory variability increase ground motions at the longer return periods (Bommer and Abrahamson, 2006). Previous studies have looked at ways to use regional data to reduce the standard deviation for site-specific studies. Two of the NGA-Subduction GMMs used global recordings to develop their aleatory model. The global recordings are predominantly from earthquakes in Japan, which may have different variability in site effects compared with Cascadia recordings (Atkinson, 2003). However, the Abrahamson and Gulerce GMM (AG20) divided their data set into similar subduction groups based on their spectral shapes in a way that predicts smaller variability for Cascadia relative to Japan (Abrahamson and Gulerce, 2022). It is not known if the variability of ground motions from future Cascadia events will better reflect the global observations or the small number of regional recordings.
In this study, we evaluate data fits to GMMs for Cascadia subduction earthquakes. The data are divided into NGA-Subduction recordings that include both intraslab regional and global interface recordings, and recent data that are limited to the 2021 Petrolia and 2022 Ferndale earthquakes in southern Cascadia. We compare the average differences between the GMM predictions and observations and examine the standard deviations of the Cascadia GMMs. Finally, we compute the linear BAFs for the Seattle basin and integrate the “factor-of-two” adjustment that comes from the M9 Cascadia earthquake simulations into the Casadia GMM basin terms (Frankel et al., 2018b). The 2023 NSHM update incorporates this adjustment for interface earthquakes in the deep part of the Seattle basin (Moschetti et al., 2024; Rezaeian et al., 2024).
Cascadia subduction GMMs
The selection of GMMs for the CSZ is an important step in computing the seismic hazard for both site-specific studies and at regional scales. Subduction GMMs have historically been developed from global recordings that did not account for regional differences in ground motions, whereas the NGA-Subduction GMMs include region-specific terms for the source, path, and site terms. Cascadia has very few intraslab records and no interface records of significance (
A key question in Cascadia relates to the smaller short-period ground motions observed in past intraslab earthquakes relative to other subduction zones and whether this should be expected for future events. All of the developers recognized the potential to constrain site and basin effects from Cascadia observations, but took different approaches in constraining the path and source effects. Some of the NGA-Subduction modelers pooled the data from different subduction regions, whereas others used global observations to constrain the source terms of the GMMs. We distinguish between “unadjusted GMMs,” which directly fit the Cascadia observations and predict smaller short-period ground motions, to “adjusted GMMs,” which adjust the short-period ground-motion level of the predictions by modifying the source terms. The size of the adjustment can be derived from the global average, a subset of specific events, or restricting the adjustment to the average from subduction zones with similar spectral shapes.
The NGA-Subduction GMMs for Cascadia intraslab earthquakes comprise the unadjusted GMM—Abrahamson and Gulerce (2022, hereafter AG20 Unadjusted) and three adjusted NGA-Subduction GMMs—Abrahamson and Gulerce (2022, hereafter AG20), Kuehn et al. (2023, hereafter KBCG20), and Parker et al. (2022, hereafter, PSBAH20) (Table 1). AG20 Unadjusted is based on the smaller short-period observed ground motions in Cascadia, whereas the adjusted AG20 GMM adjusts the ground motion to match the subduction data from other regions with similar spectral shapes (Central America, New Zealand, and Taiwan). The AG20 model developers do not recommend their unadjusted model for seismic hazard application in Cascadia (Abrahamson and Gulerce, 2022). In contrast, KBCG20 modified the intraslab ground motion to fit the data for the two largest events (2001 Nisqually and 2010 Ferndale), but did not incorporate the smaller magnitude Cascadia earthquakes that would have resulted in a smaller adjustment (Kuehn et al., 2023). PSBAH20 adjusted the intraslab constant to increase the smaller short-period ground motions so that the global level is matched at
List of GMMs used in this study with their region of applicability, magnitude range, distance range, site term, basin term, and number of events and records used in development. The events are limited to intraslab for Cascadia, but combine interface and intraslab for the global models.
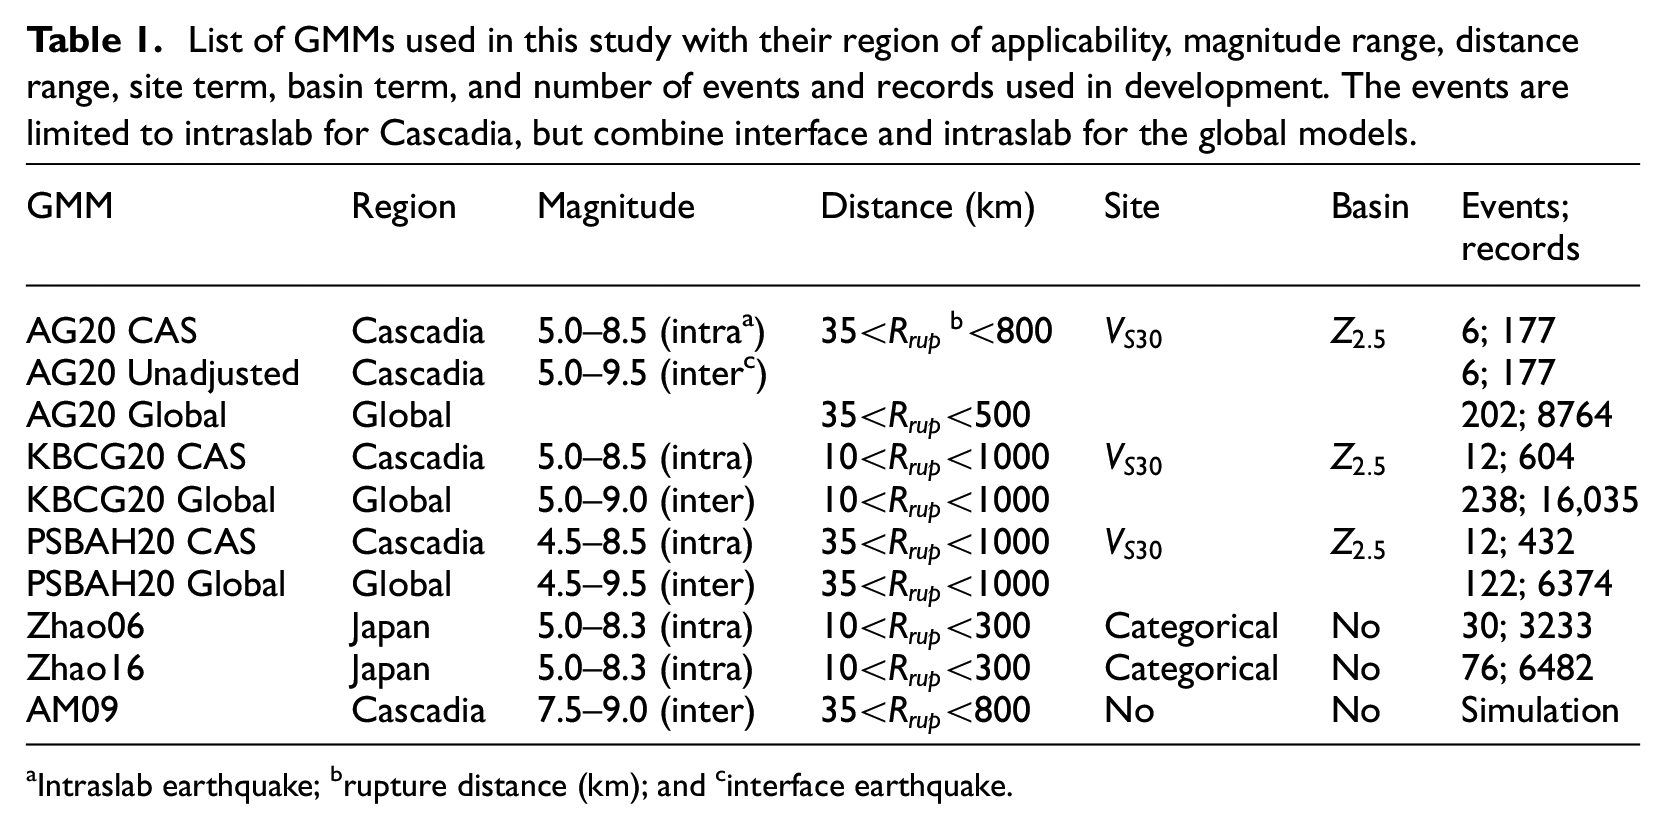
Intraslab earthquake; brupture distance (km); and cinterface earthquake.
In the case of interface earthquakes, no Cascadia observations are available for
Table 1 provides the recommended magnitudes, distances, and the predictive parameters for shallow site response (
In addition to the NGA-Subduction GMMs, we evaluate two older subduction GMMs due to their use in the NSHM (Petersen et al., 2020). The Zhao (2006, hereafter Zhao06) GMM is based primarily on Japanese recordings, and this results in larger short-period predictions relative to the regional Cascadia observations. The Atkinson and Macias (2009, hereafter AM09) is a simulation-based GMM that was developed for interface earthquakes with
Both Zhao06 and Zhao16 use a binned
Cascadia basin terms
Ground-motion amplification by sedimentary basins is modeled through both the shallow site predictor (
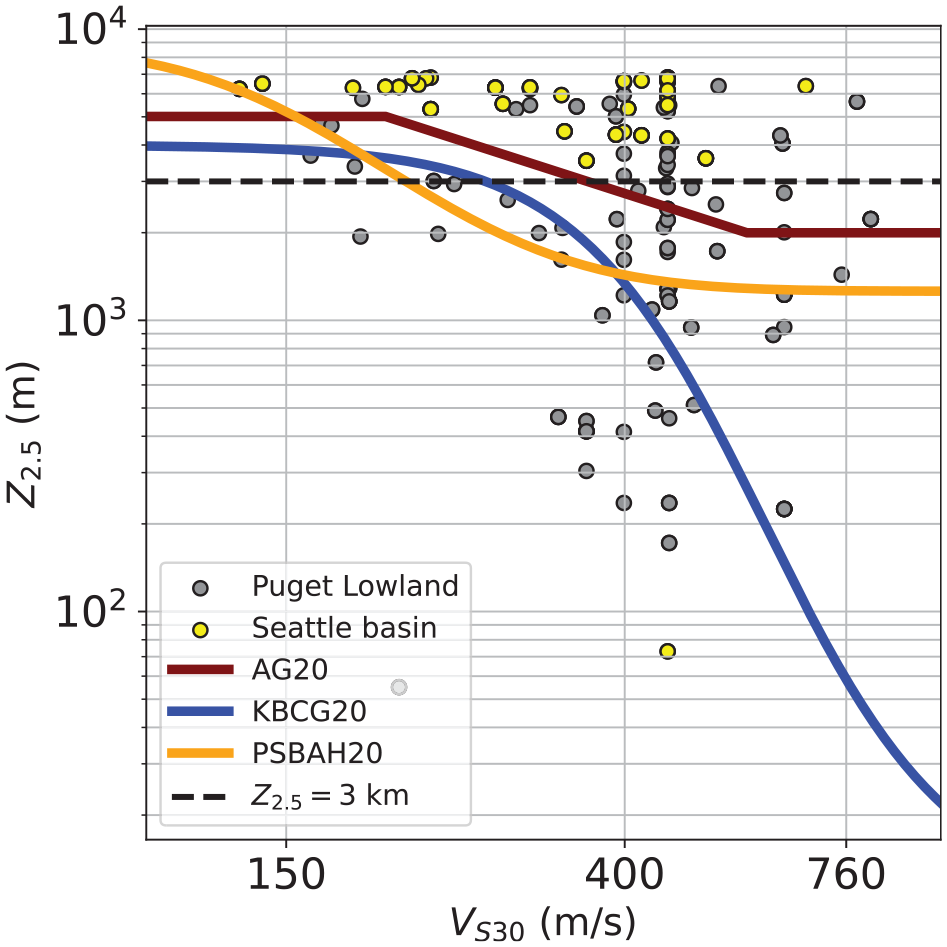
The global GMMs do not include a basin amplification term. The Cascadia GMMs use


Figure 1 plots the above functional forms as well as the
Data used in comparisons
We compare GMMs for application to the CSZ using three data sources: Cascadia intraslab recordings from the NGA-Subduction database, global interface recordings from the NGA-Subduction database, and independently processed records from earthquakes near the Mendocino Triple Junction that occurred after the end of the NGA-Subduction project. We do not compare the GMMs using the log-likelihood score, stochastic area metric, or similar criteria, because the independent observations are insufficient to provide robust estimates of these metrics. Moreover, ranking GMMs for regions with sparse data may result in unwarranted confidence when selecting GMMs for hazard applications.
NGA-Subduction database
The NGA-Subduction Project developed a database of earthquake observations for subduction regions (Mazzoni, 2021). The database includes a total of 214,020 individual records from 1880 subduction events. For the CSZ, there are 35 regional earthquakes with 2543 regional recordings. No significant subduction earthquakes in northern Cascadia have been recorded since the
Cascadia intraslab recordings
Cascadia intraslab recordings from the NGA-Subduction database are used for the regional GMM comparisons. When selecting Cascadia recordings from the database, we gave consideration to the recommended magnitude and distance range as defined in Table 1. Records were removed if they had problematic flags (bad quality, late P-trigger, multiple events, and non free-field stations). The sampling bias was accounted for by only selecting records with rupture distances less than
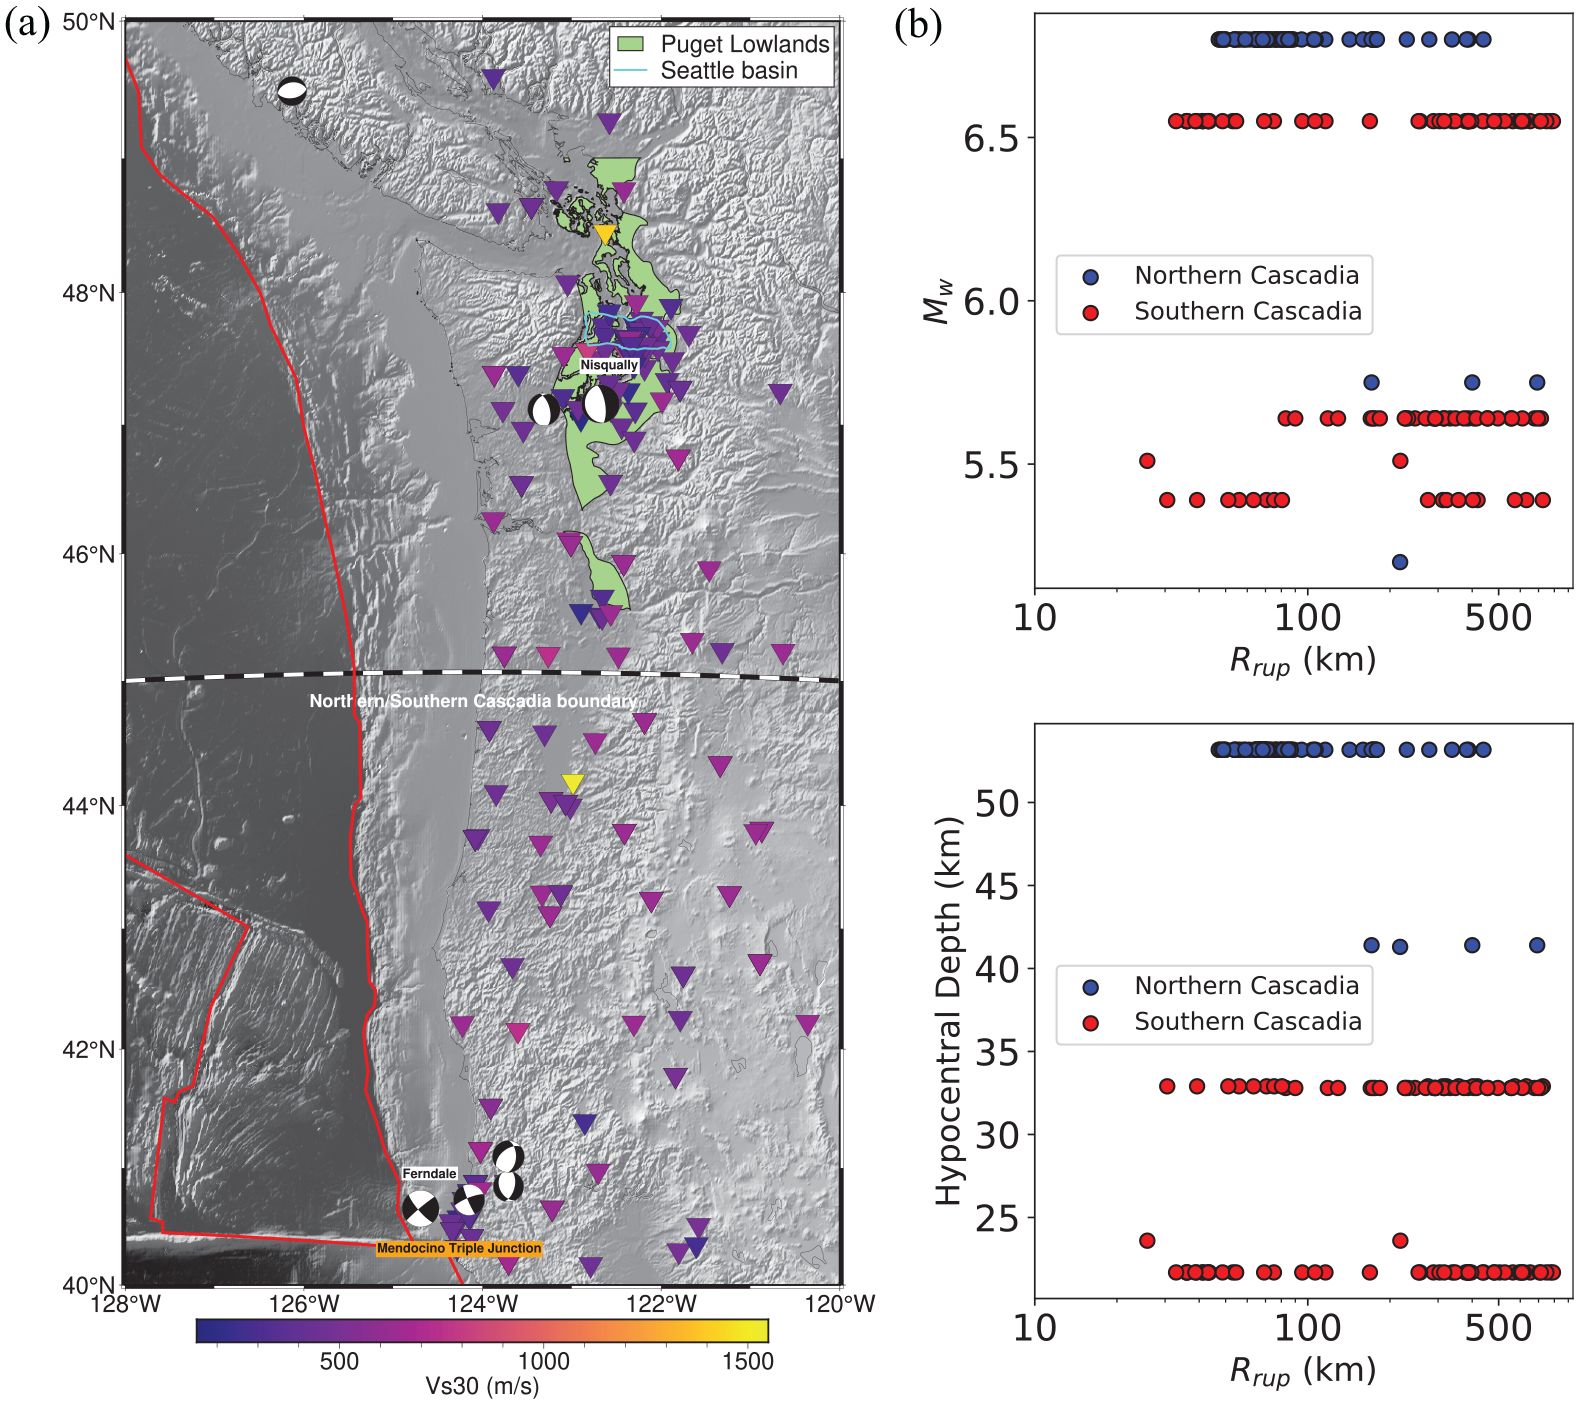
Intraslab earthquakes, sites, and recordings from Cascadia used in this study:
Global interface recordings
The lack of recordings from interface earthquakes in Cascadia resulted in selecting global interface recordings as a proxy for the ground motion from a future Cascadia interface earthquake. An important question for the interface GMMs is whether they are consistent with global observations of subduction interface events; certainly, the NGA-Subduction GMMs are developed from these records, but other GMMs were developed from alternative data sets, and this comparison provides an evaluation of these GMMs. The seismic hazard in Cascadia from interface events in the NSHM is based on large-magnitude (
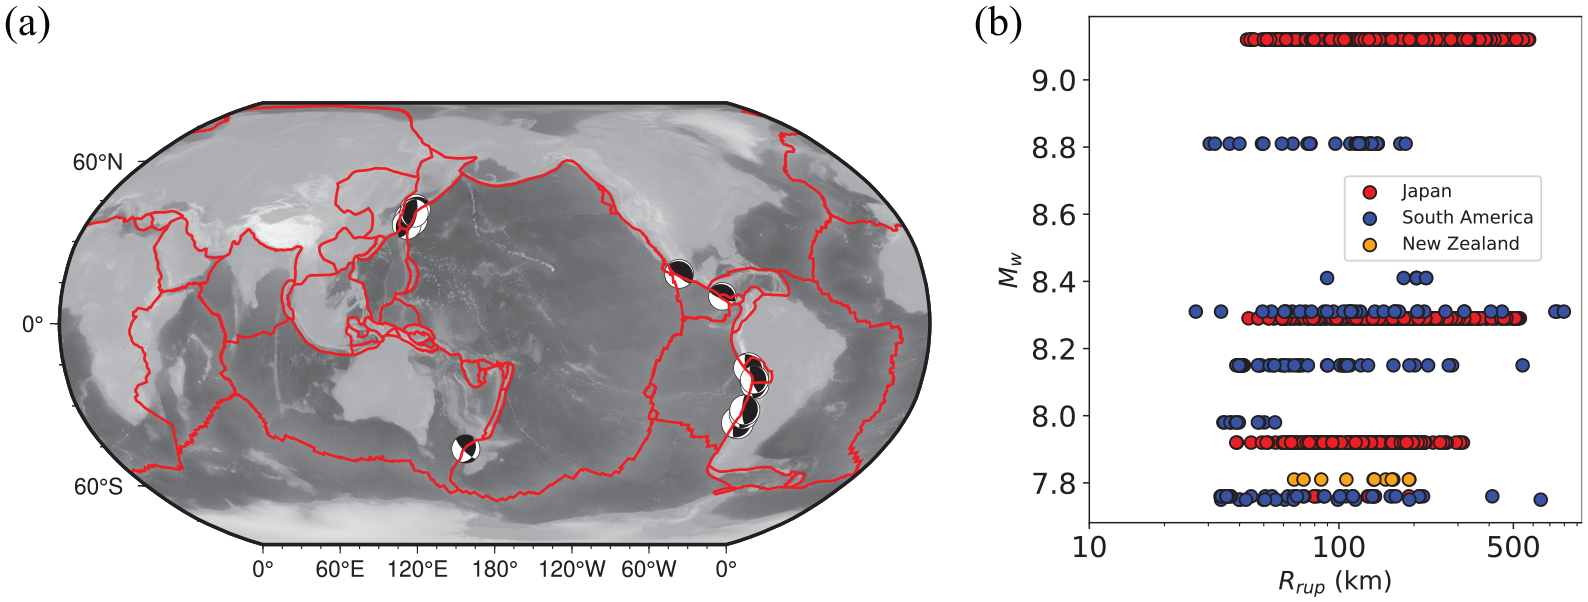
Global interface earthquakes and recordings used in this study:
Intraslab recordings independent of NGA-Subduction database
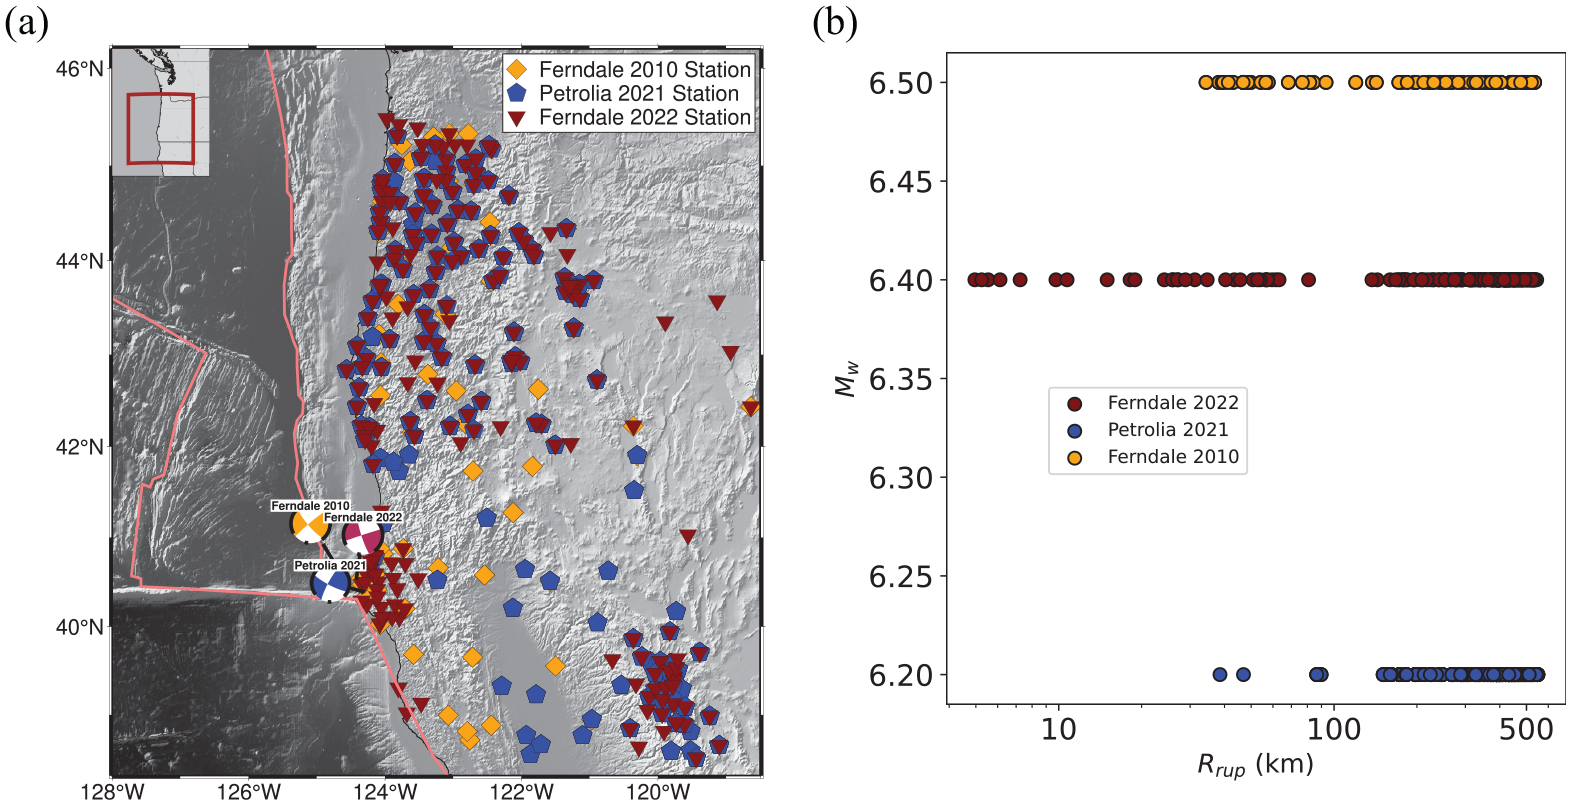
Two notable earthquakes were recorded in southern Cascadia after the final version of the NGA-Subduction database was published—the 2021 Petrolia earthquake and the 2022 Ferndale earthquake. Both events occurred inside the Gorda plate and feature shallower depths of 27.0 km and 17.9 km, respectively, compared with typical intraslab earthquake depths of 40–50 km. These events are important because they are independent of the NGA-Subduction database that was used by the model developers and are appropriate recordings for comparing GMMs as described by Mak et al. (2017). We compile and process records from these two earthquakes that are independent of the NGA-Subduction database and also the 2010 Ferndale earthquake that is included in the NGA-Subduction database. We used the US Geological Survey Python-based package gmprocess to automate the downloading and processing of recordings from the these two earthquakes in a uniform manner (Hearne et al., 2019). Recordings are restricted to latitudes greater than 38.5° to exclude recordings from northern California that were within the 500 km search radius, but recorded on California sites that had
Earthquakes and recordings from the independent data set
Residual analysis
When evaluating the difference between the GMM predictions and the earthquake observations, a mixed-effects approach is used so that repeatable effects from an earthquake or site location can be handled in the analysis and for its ability to account for irregular sampling in sparse data sets (Abrahamson and Youngs, 1992). The prediction for each GMM for each record in the data set is made using the Python OpenQuake package (Pagani et al., 2014). The required input parameters for the NGA-Subduction GMMs are as follows:

where

where
The bias
The within-event terms

where
This study includes comparisons of the standard deviations of the within-event terms from regional records. The modeling groups made different choices with respect to whether to use regional data (or analog regional) data or global data for developing the aleatory variability models. To account for the

where

We emphasize that the reason to compare
GMM performance against observations
GMMs against Cascadia intraslab observations
2001 Nisqually earthquake
We compare the GMMs to data from a relatively well-recorded earthquake. For this purpose, we use the 2001 (
Nisqually data against GMM predictions for two spectral periods. The prediction is an average site condition of
Nisqually bias computed using site-specific
The Nisqually bias, shown in Figure 6, incorporates the basin terms of the NGA-Subduction GMMs by including the site-specific
GMMs against NGA-Subduction intraslab observations including Nisqually
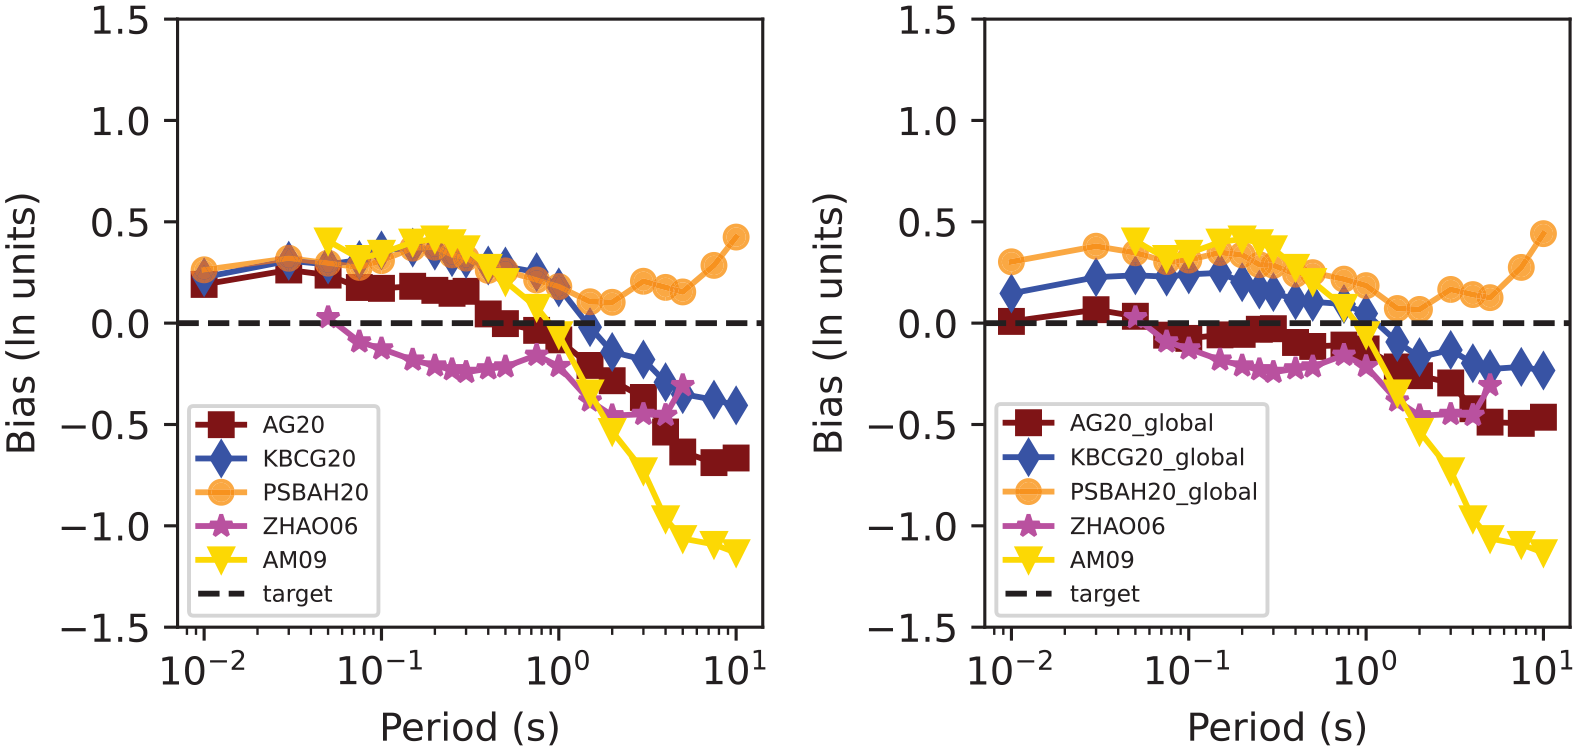
We next evaluate the mixed effects using the data set of selected intraslab recordings, including the Nisqually observations previously discussed, for Cascadia (Figure 2a). Figure 7 displays the bias for nine GMMs. At short periods
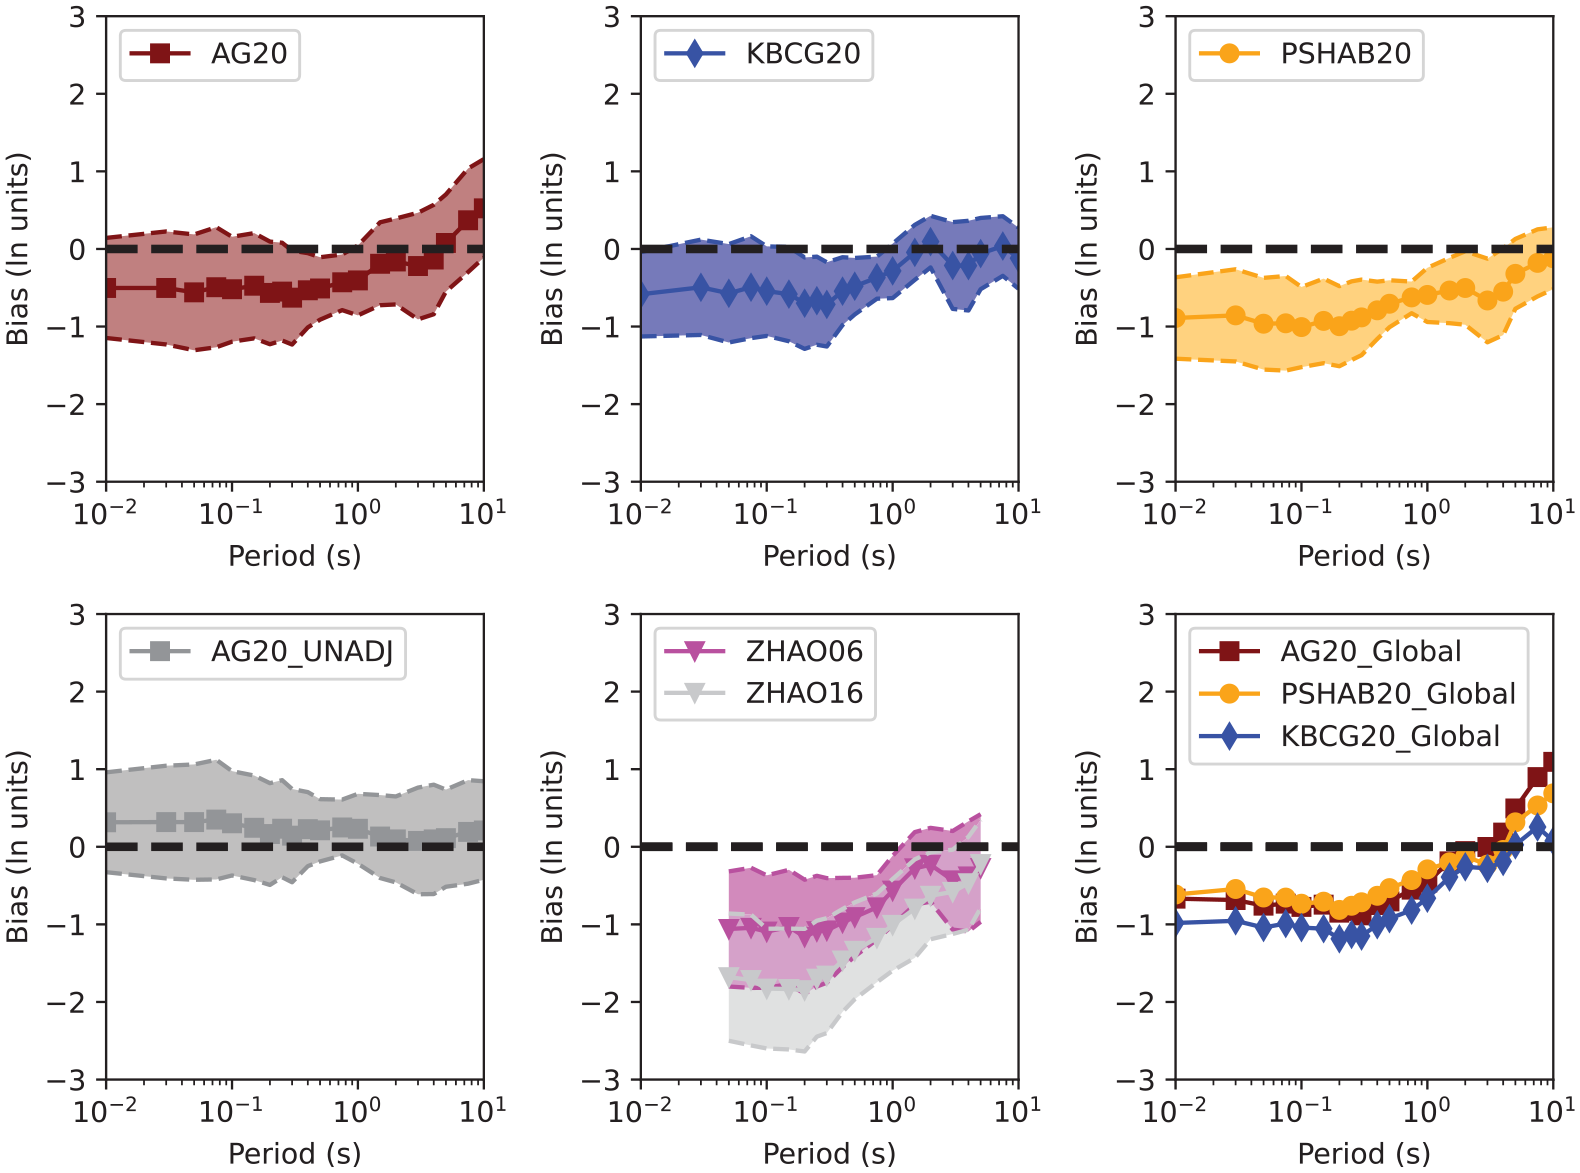
Bias for Cascadia GMMs with 95% confidence intervals based on the regional Cascadia data set. The bias for the global versions of the GMMs is in the bottom right subplot.
The NGA-Subduction global GMMs are shown in the bottom right-hand plot in Figure 7. At short periods, the difference between the bias from the global GMMs and the adjusted regional models can be explained by the developers’ different approaches to the adjustment terms for Cascadia. At longer periods, all of the global GMMs underpredict observations due to differences between the global and Cascadia GMMs. In addition, some of the underprediction may be explainable because of recordings in deep basins, where the site response is not fully captured by the global GMMs.
The event terms against magnitude are shown for a representative short period,
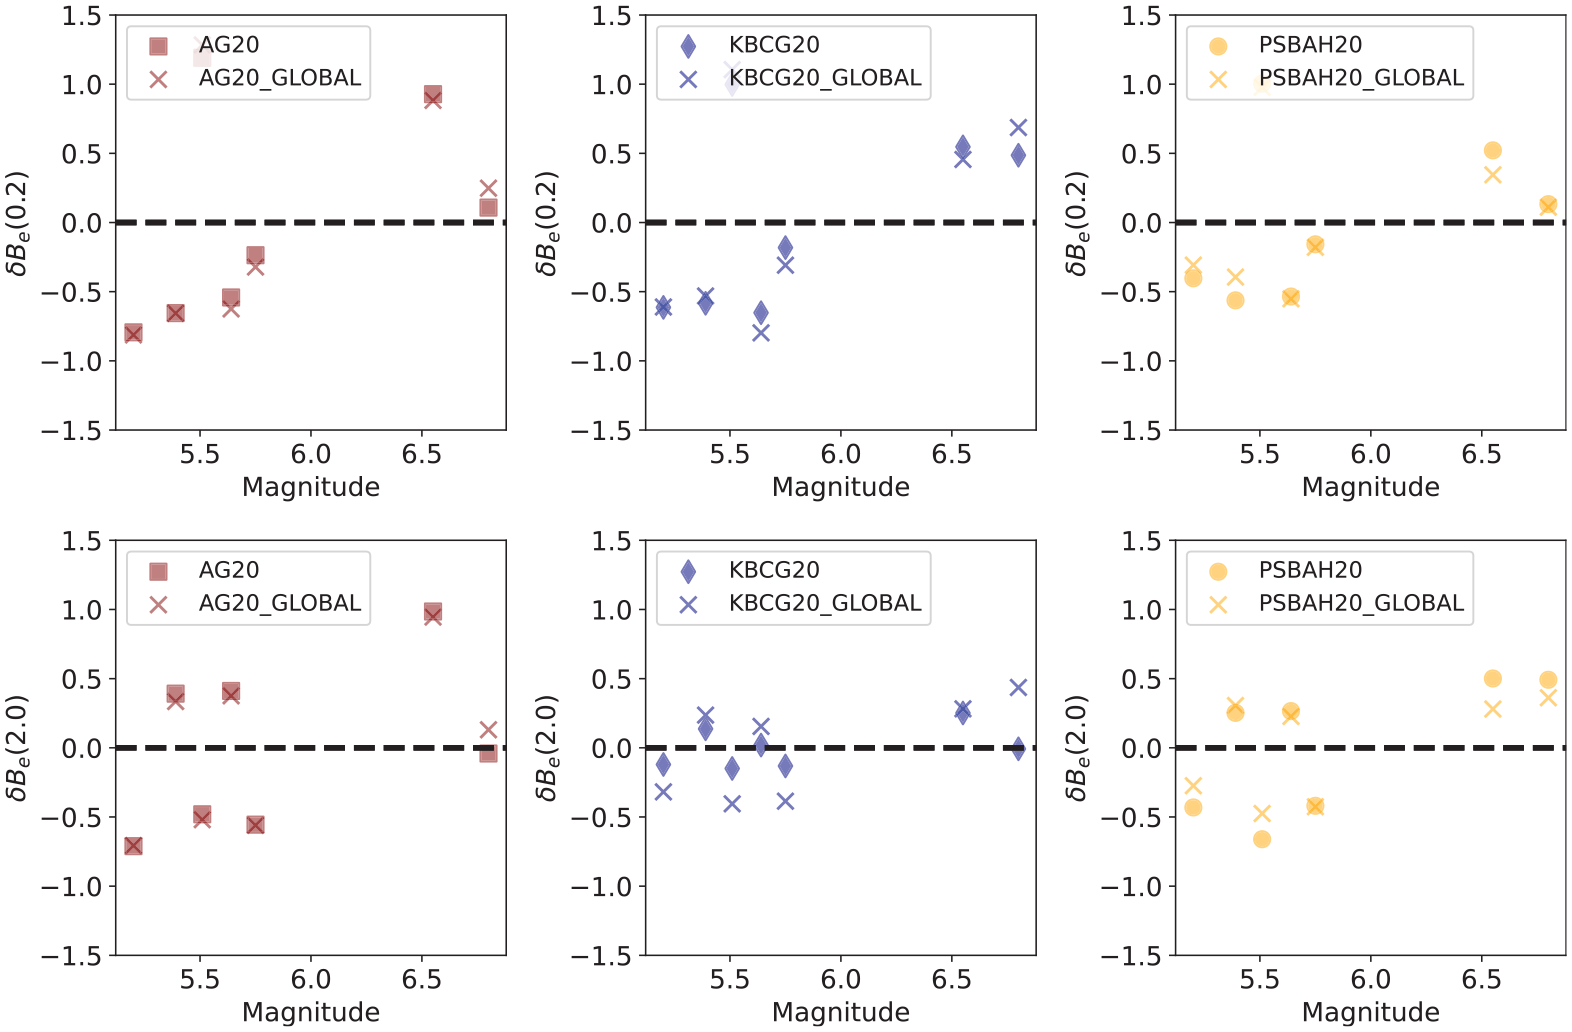
Cascadia versus Global NGA-Subduction event terms for Cascadia for regional earthquakes.
We also assess distance trends by evaluating the within-event terms as a function of rupture distance. The within-event terms for
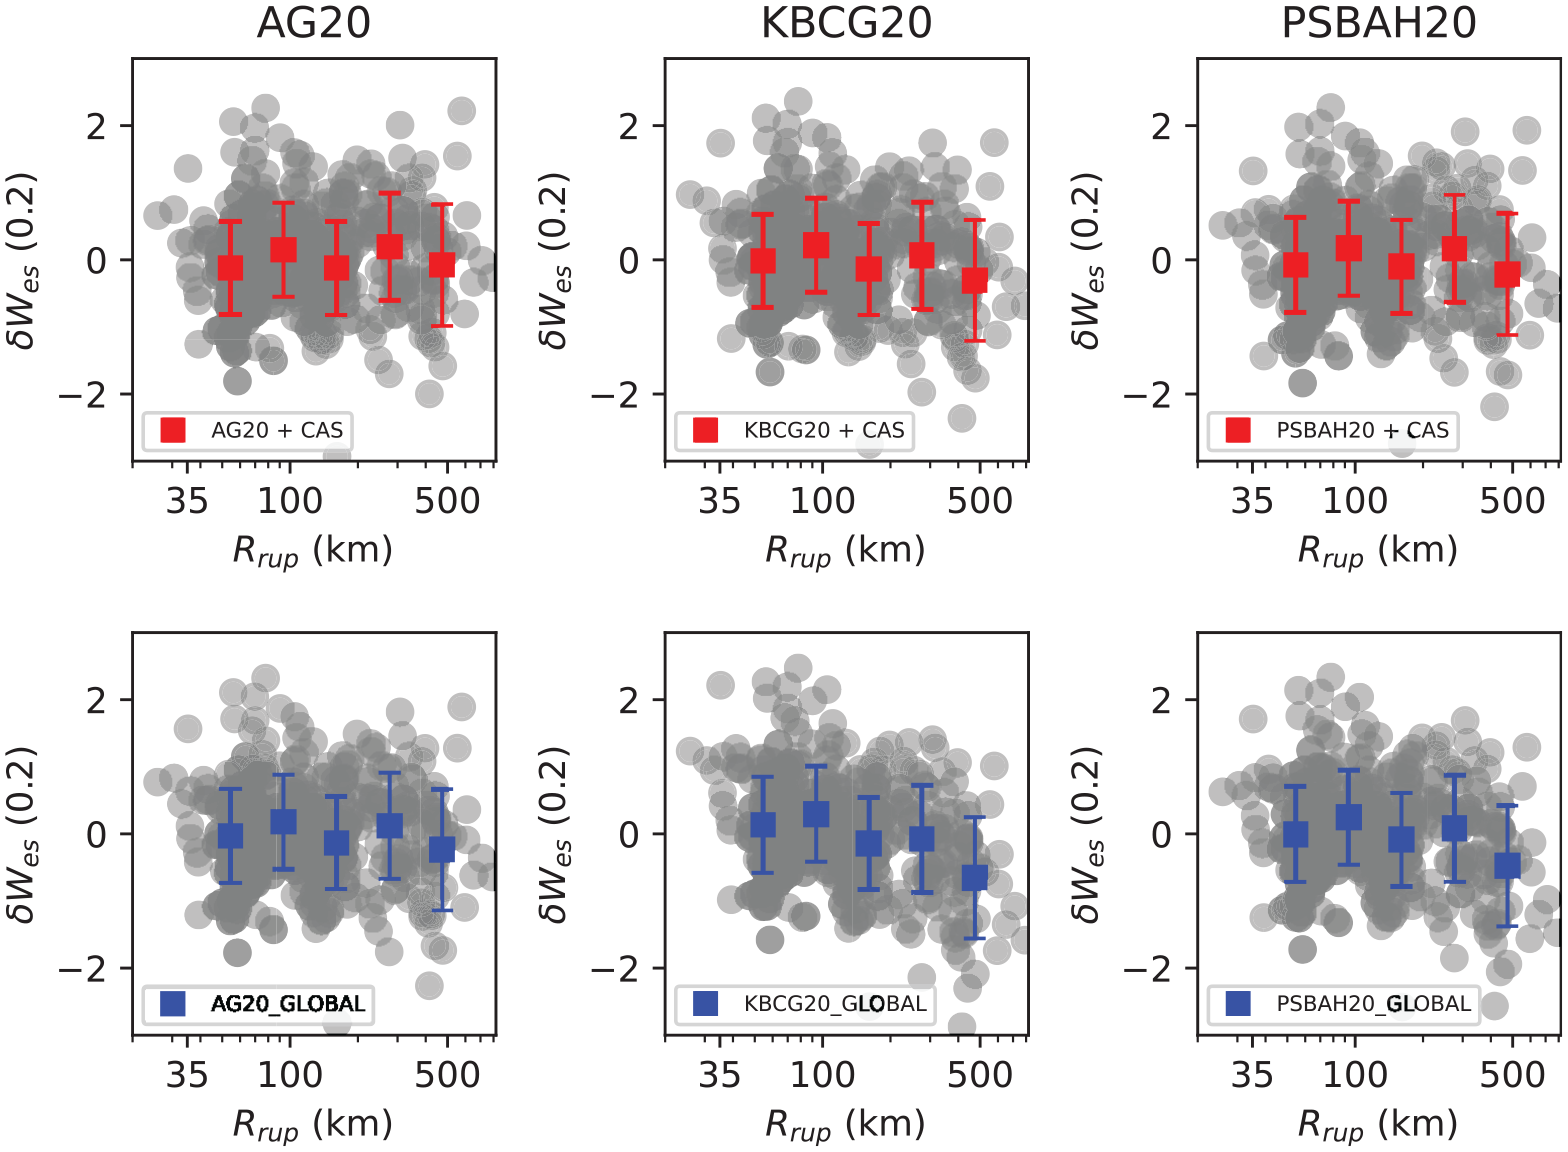
Within-event terms against rupture distance for
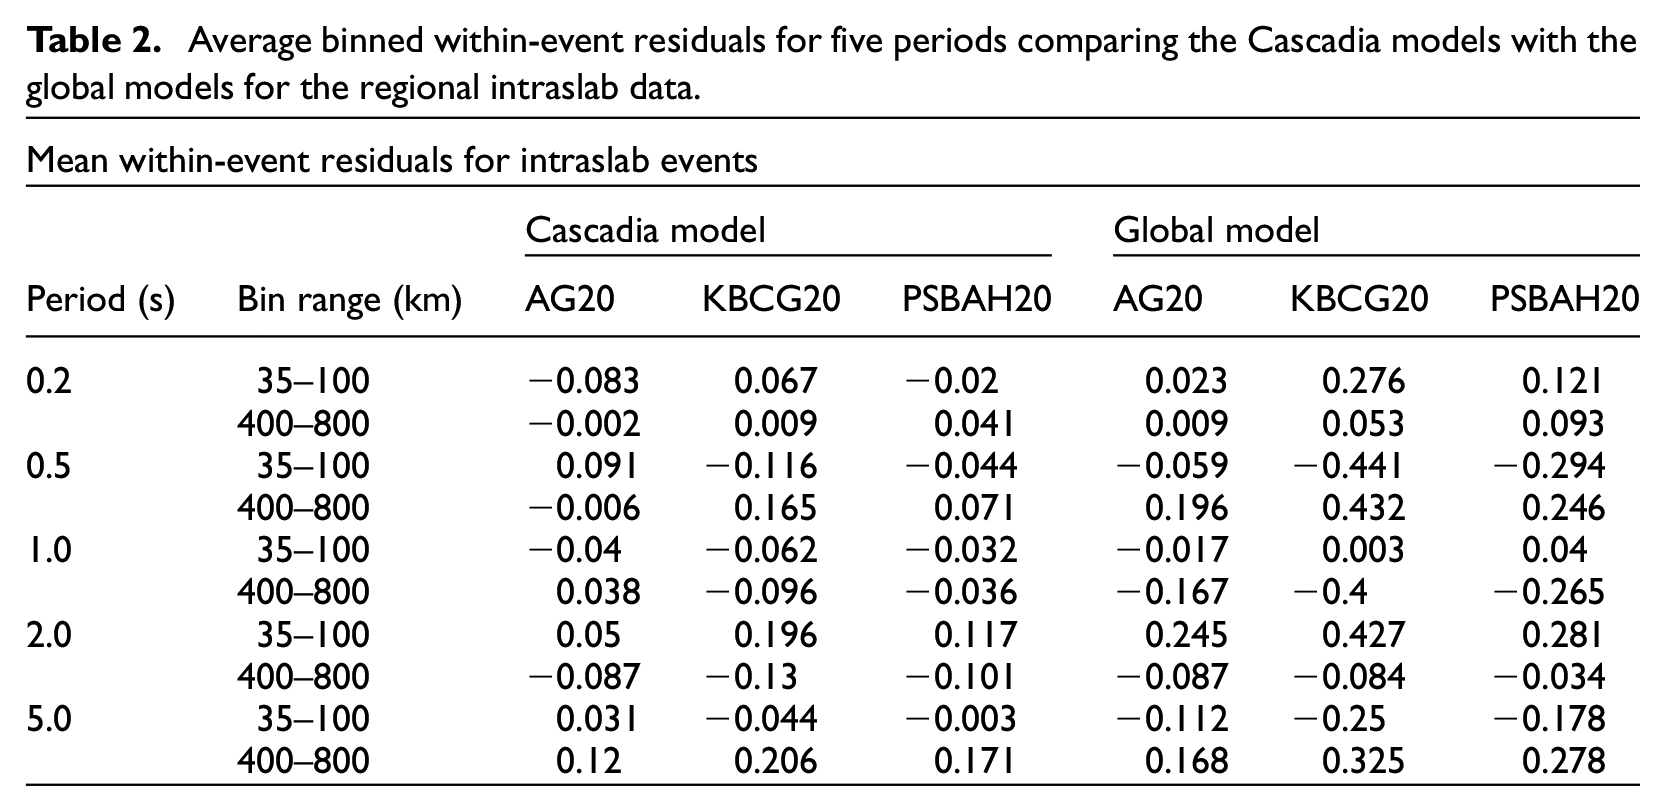
Average binned within-event residuals for five periods comparing the Cascadia models with the global models for the regional intraslab data.
Assessment of regional and global aleatory models
We next compare the predictions of the GMM aleatory models to the variance in the regional data, using a standardized-residual approach (Equation 8). There are not sufficient earthquakes to constrain a regional between-event standard deviation term
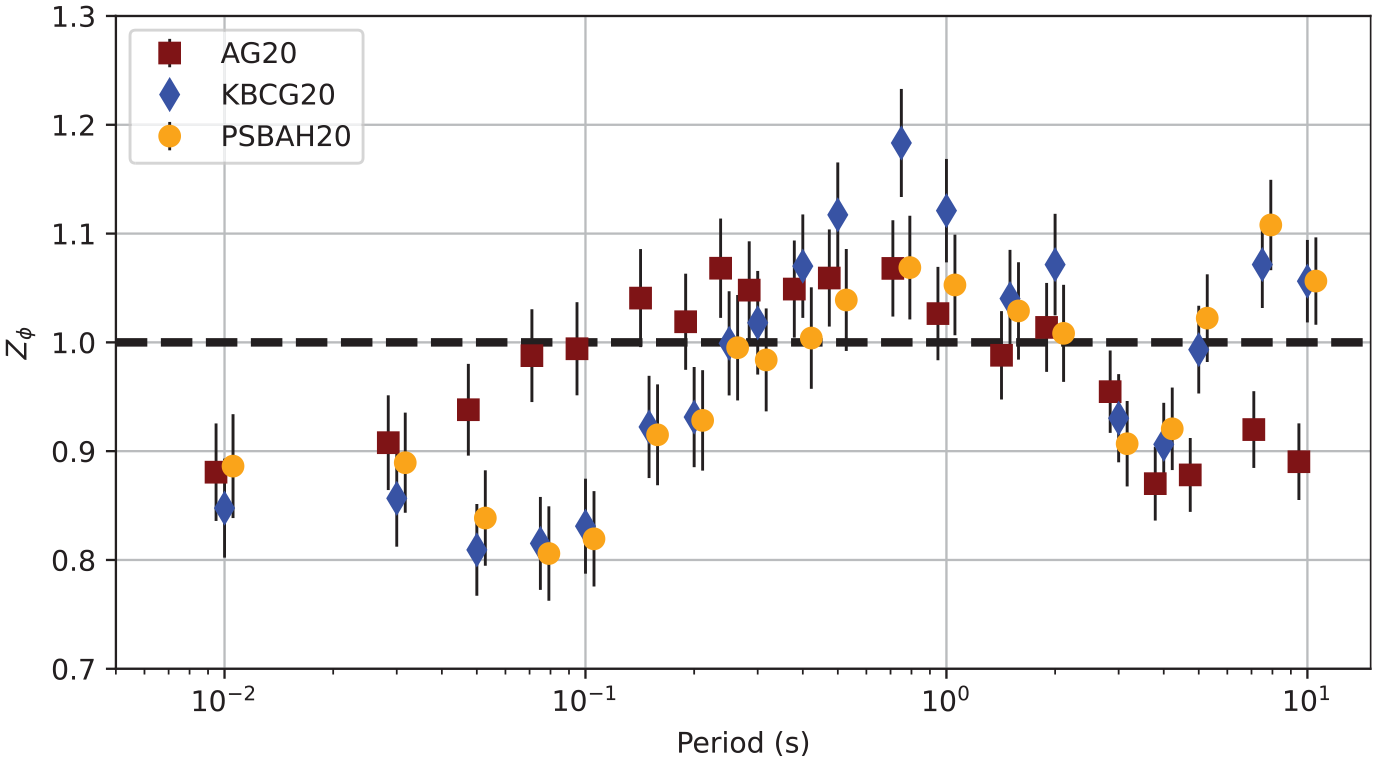
Z ϕ for the three adjusted NGA-Subduction Cascadia GMMs. The unadjusted AG20 GMM uses the same aleatory model as the adjusted AG20 and so is not shown. The vertical lines represent the standard error. The symbols for the different GMMs are plotted with minor offsets in the period values for better visualization.
In interpreting
Regional Cascadia influence on GMM comparisons
We examine geographical influences on the GMM predictions by dividing the recordings between northern and southern Cascadia, using a latitude of 45.5° as the dividing threshold (Figure 2a). Seismicity in the data set is clearly distinct, with deeper intraslab earthquakes in northern Cascadia beneath the Puget Lowlands and Olympic Peninsula and shallower intraslab events in southern Cascadia near the Mendocino Triple Junction. The northern Cascadia bias (Figure 11) shows a strong overprediction at short periods (0.01–1 s), whereas the overprediction is less (but more variable) for southern Cascadia. The unadjusted AG20 model notably underpredicts shaking for southern Cascadia across all 22 periods, whereas the adjusted AG20 performs well relative to the observations for

Bias for northern Cascadia data compared with southern Cascadia data.
The event terms against hypocentral depth are shown for
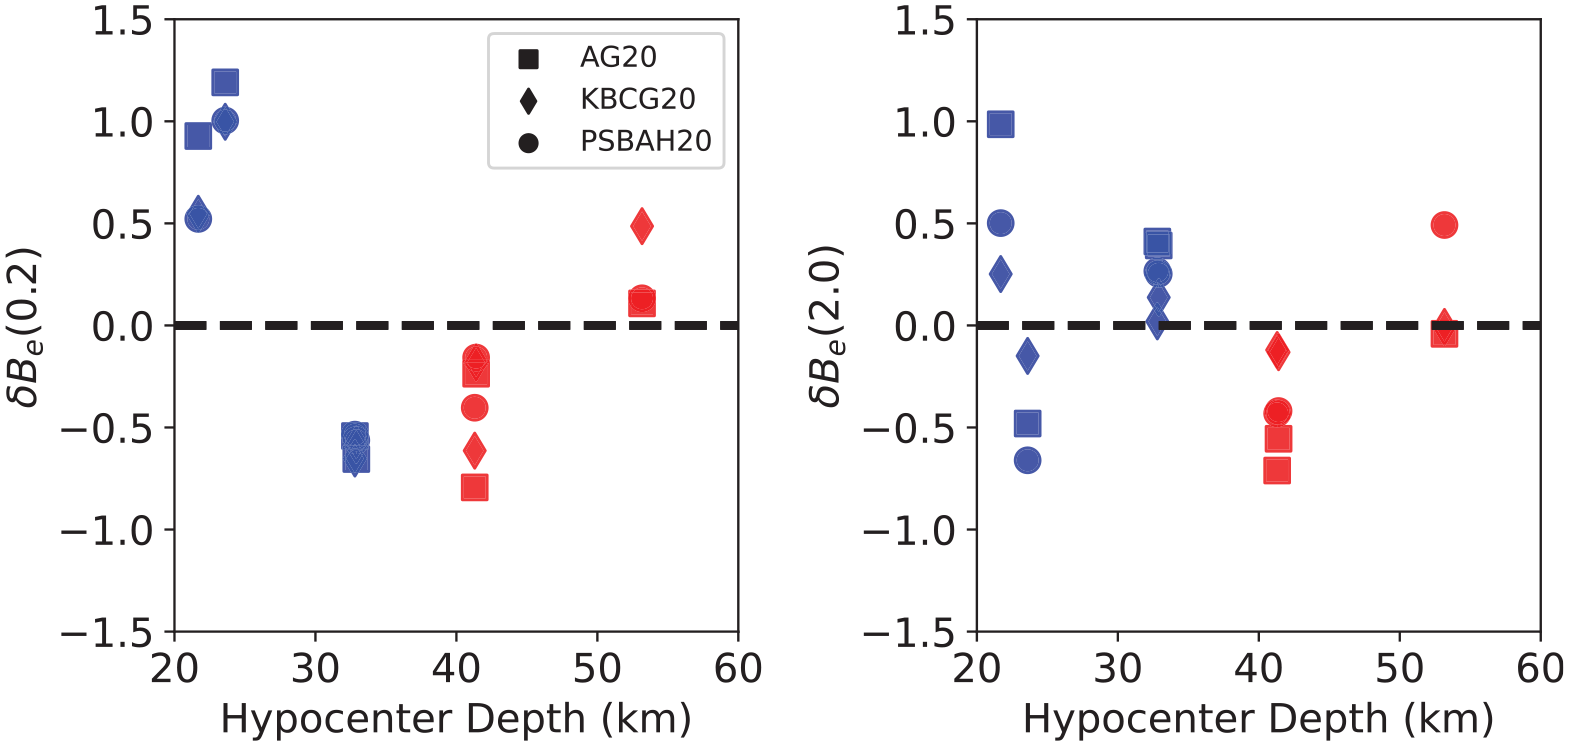
Cascadia event terms against hypocentral depth. Northern Cascadia events are plotted in blue, and southern Cascadia events are shown in red.
GMMs against global interface events
The regional data comparison was restricted to intraslab earthquakes because we lack interface recordings from Cascadia. As an alternative, a subset of NGA-Subduction ground-motion recordings of global interface records with
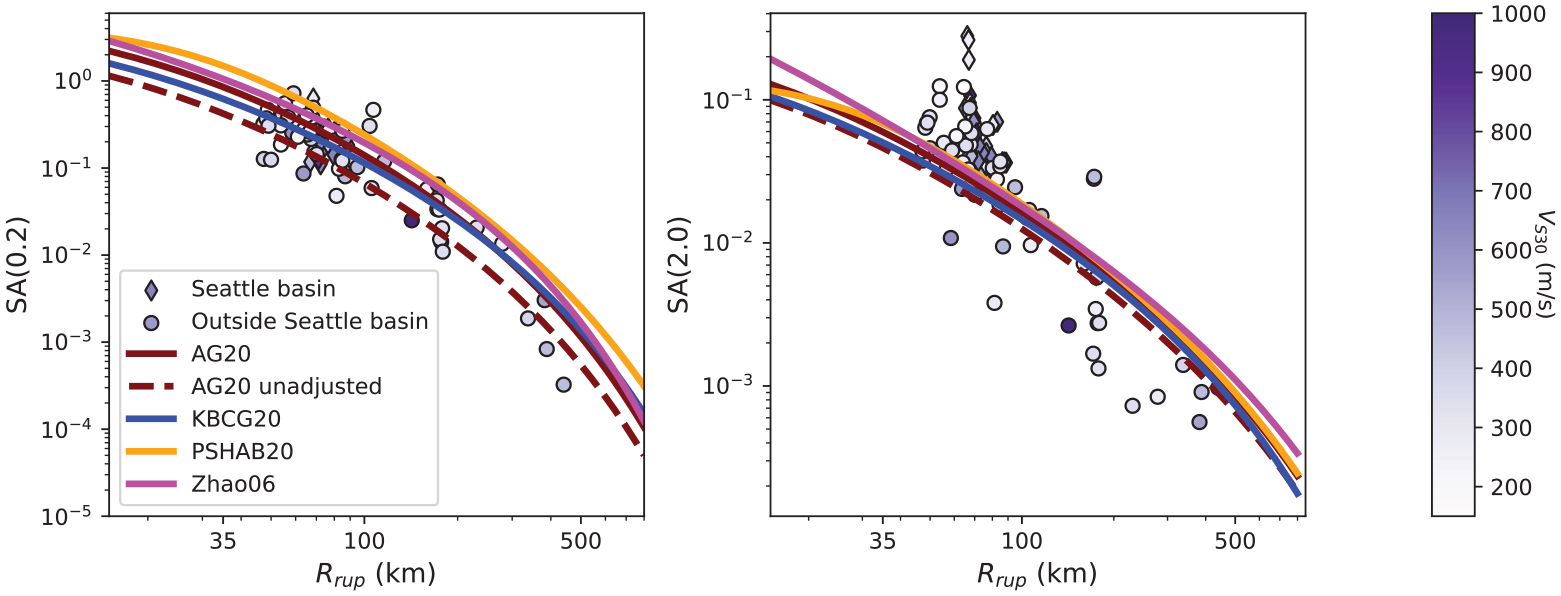
Figure 13 compares the Tohoku observations at two spectral periods with all GMMs—0.2 and 2.0 s. There is good agreement betweeen the NGA-Subduction GMMs and AM09 at shorter periods, but the GMMs exhibit significant (order of magnitude) differences in their predictions at longer periods.
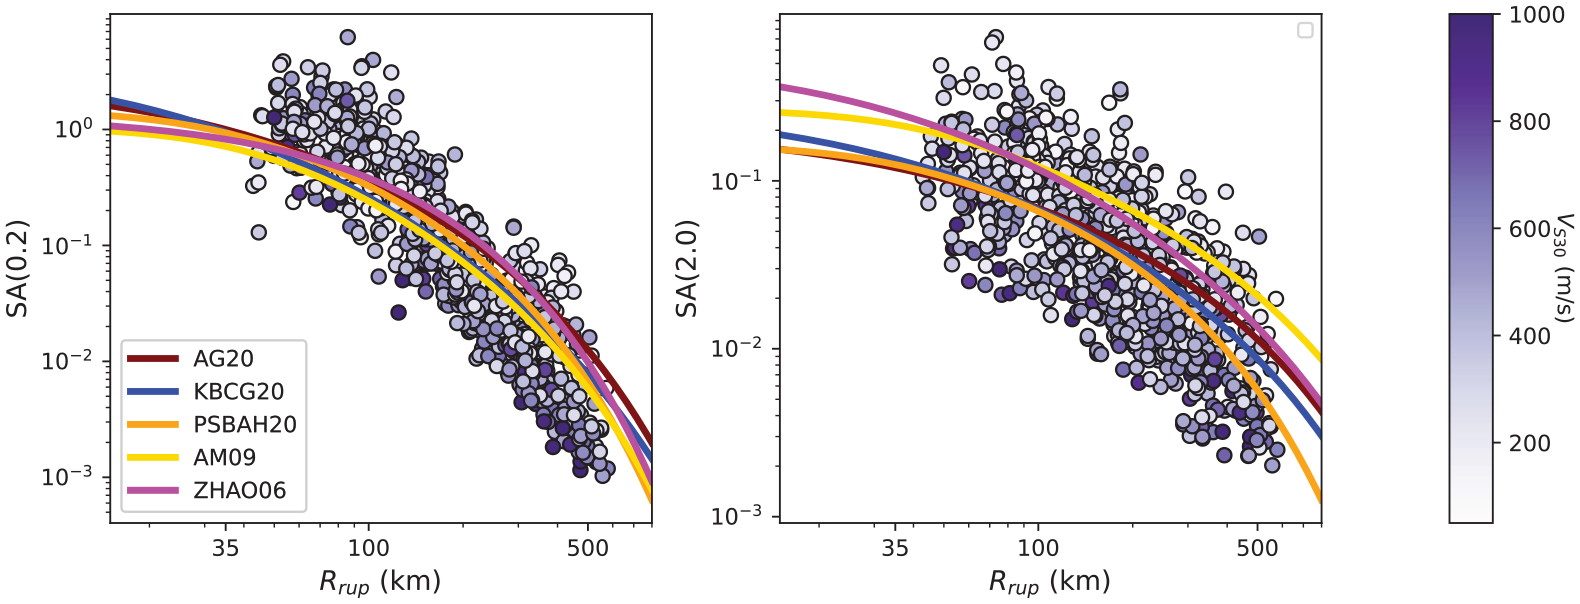
Tohoku observations for SA (0.2 s) and SA (2.0 s). GMM predictions are uniform
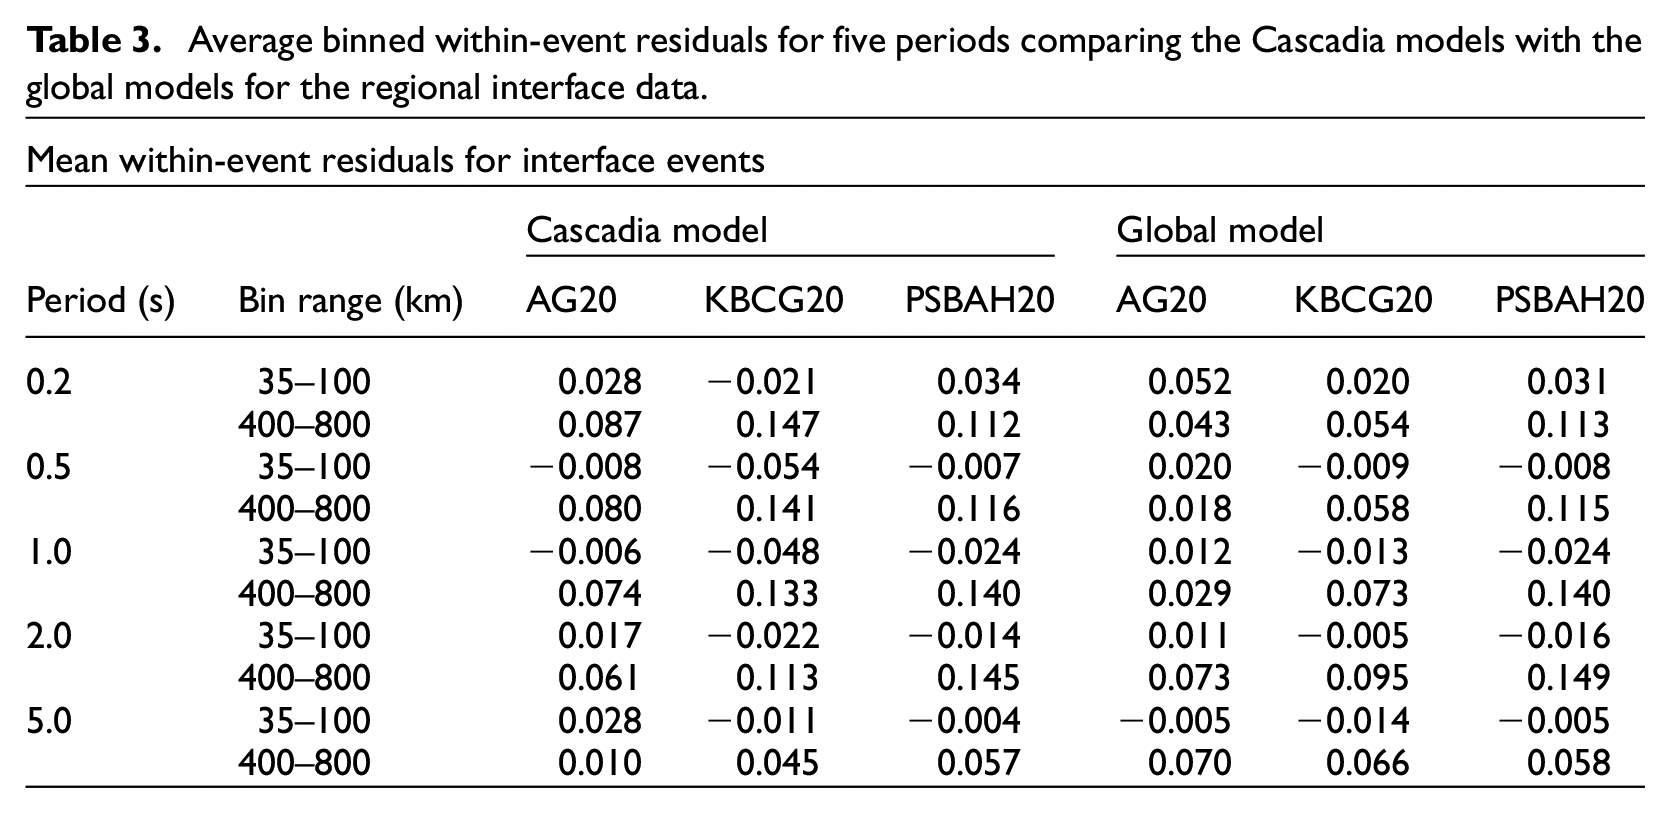
We checked for distance trends for the Cascadia and global GMMs by plotting within-event terms as a function of distance (Figure 14 and Table 3). AG20 and PSBAH20 assume interface path attenuation is the same for Cascadia as it is for the global case. KBCG20 uses the intraslab-derived stronger path attenuation in Cascadia. The difference is not clearly visible in Figure 14, but there is a subtle upward trend in KBCG20 Cascadia residuals at the farthest distances compared with the global version of that model. At longer periods, the binned values in Table 3 show little and no trends with distance. Figure 15 uses the global data set to compare the bias for the NGA-Subduction GMMs, along with AM09 and Zhao06. The long-period behavior was examined for various subsets of the large global interface events (one example is removing all Tohoku records), and the results were consistent with Figure 15.
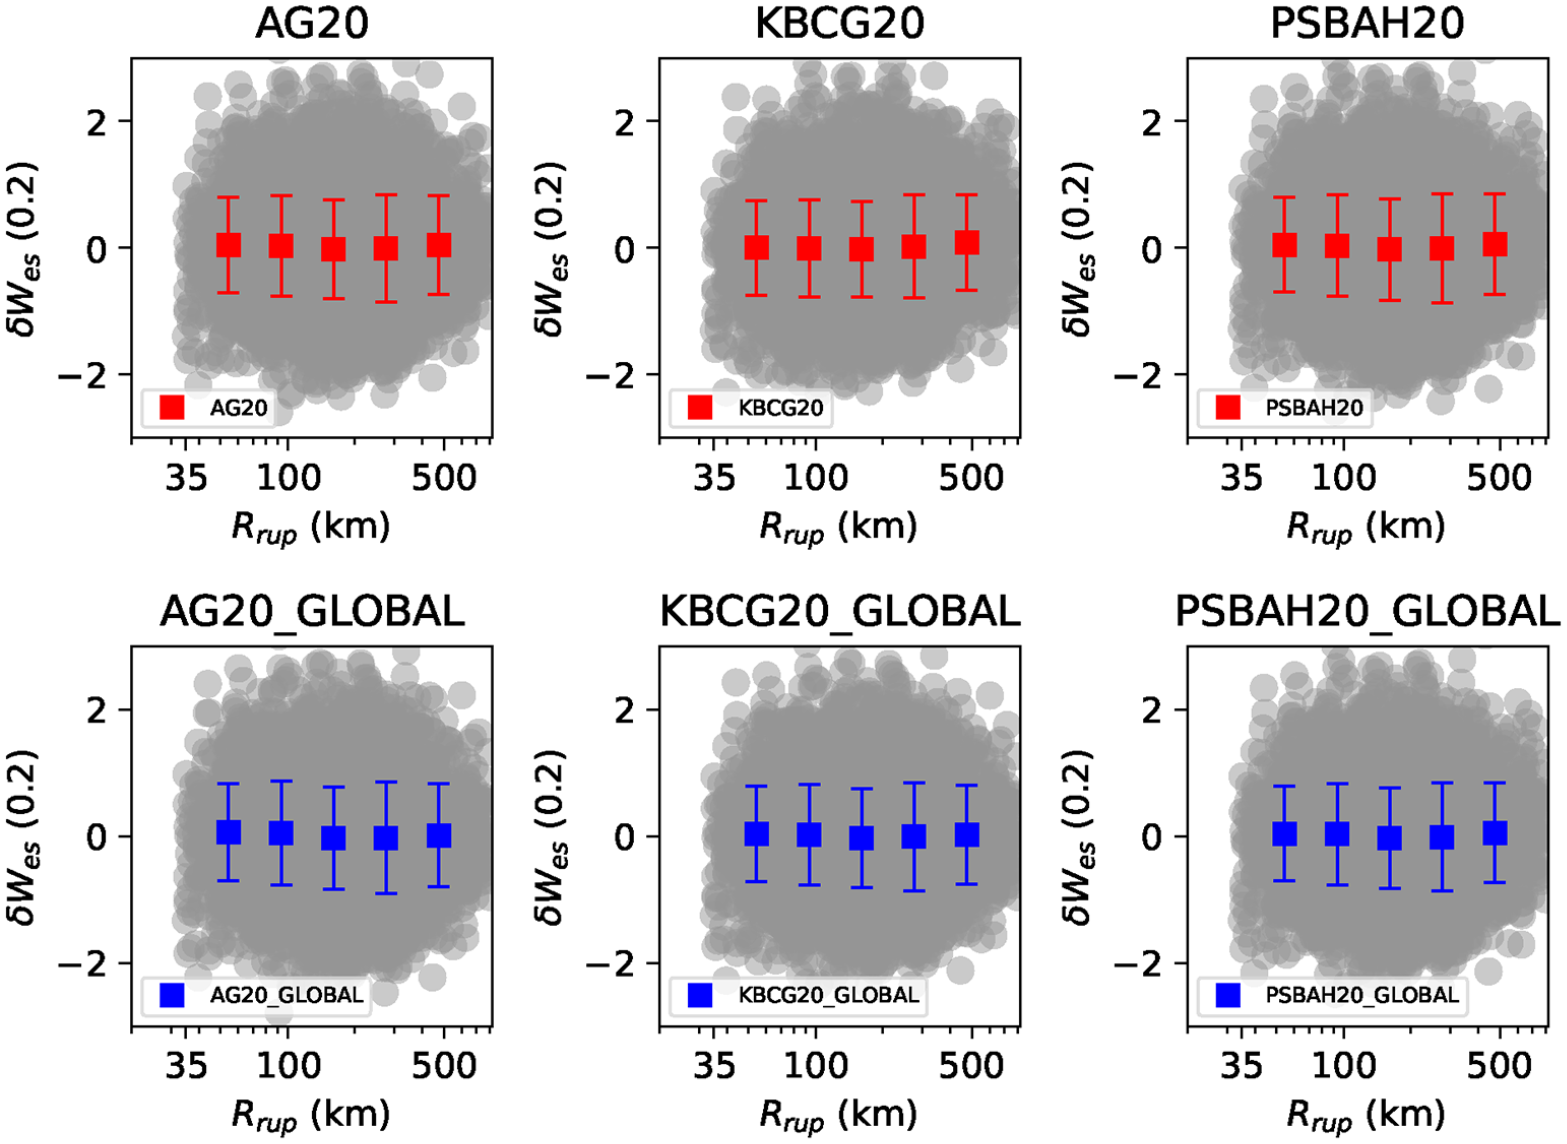
Within-event terms against rupture distance for Cascadia (top row) and Global interface NGA-Subduction GMMs (bottom row). Binned means are shown as squares with their corresponding error bars.
Average binned within-event residuals for five periods comparing the Cascadia models with the global models for the regional interface data.
Bias for GMMs and global NGA-Subduction GMMs, as well as AM09 and Zhao06. The data used are interface records with
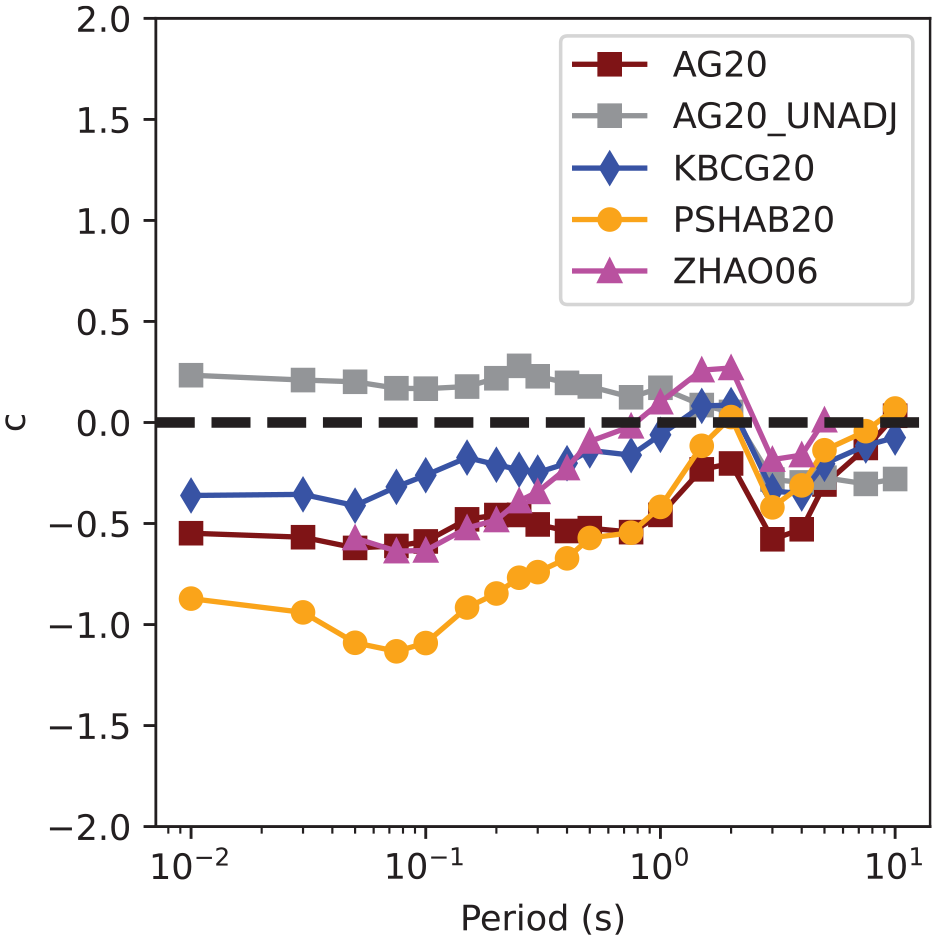
There is a clear period-dependent trend in the bias for the suite of GMMs, with all GMMs performing well at short periods
GMMs against NGA-Subduction independent observations
We next use the observations from the 2010 (
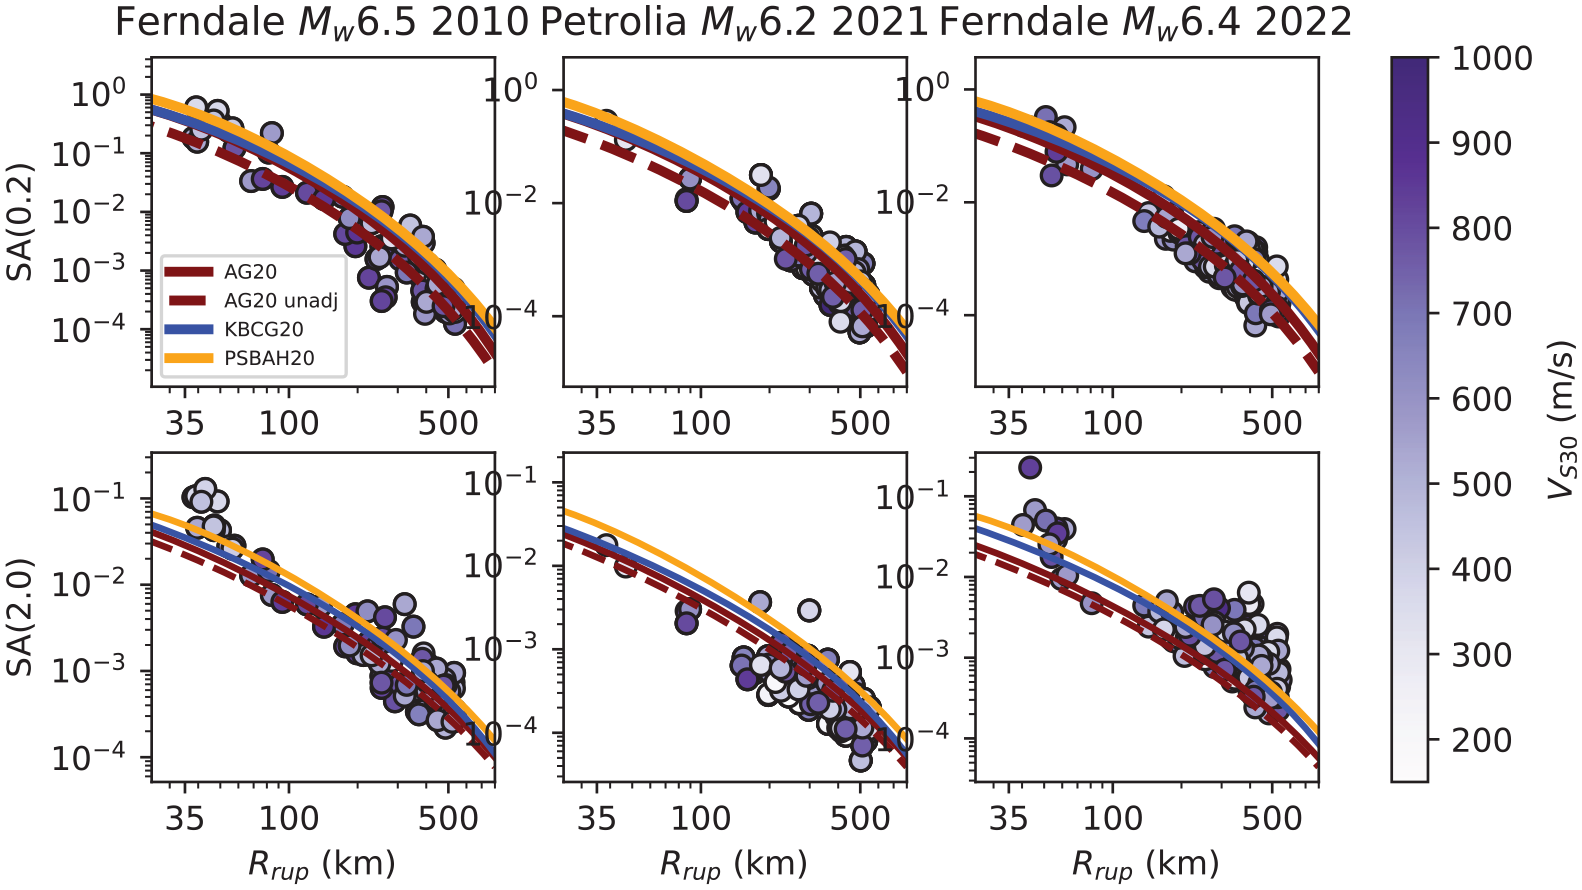
2010 Ferndale, 2021 Petrolia earthquake, and 2022 Ferndale earthquake observations compared with GMM predictions against rupture distance for two spectral periods. The GMM predictions are for a uniform site condition
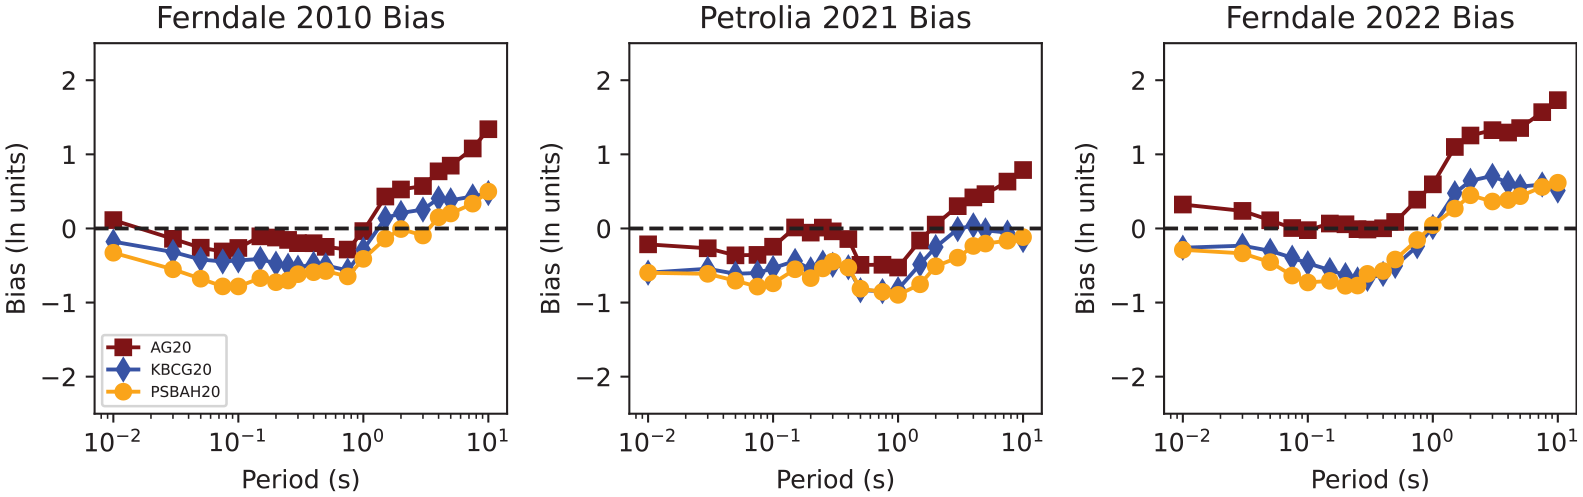
Bias for the three earthquakes used in the independent data evaluation.
Average Seattle BAFs
We compute linear BAFs for the Seattle basin with respect to a reference region defined outside of the Puget Lowlands basin and restricted to the Pacific Northwest observations. The Seattle basin is defined based on geological constraints and the estimated

where the 〈〉 brackets indicate to compute the mean of what is enclosed,
We compute BAFs using the two different magnitude thresholds selected by the NGA-Subduction modelers for Cascadia. AG20 used data from
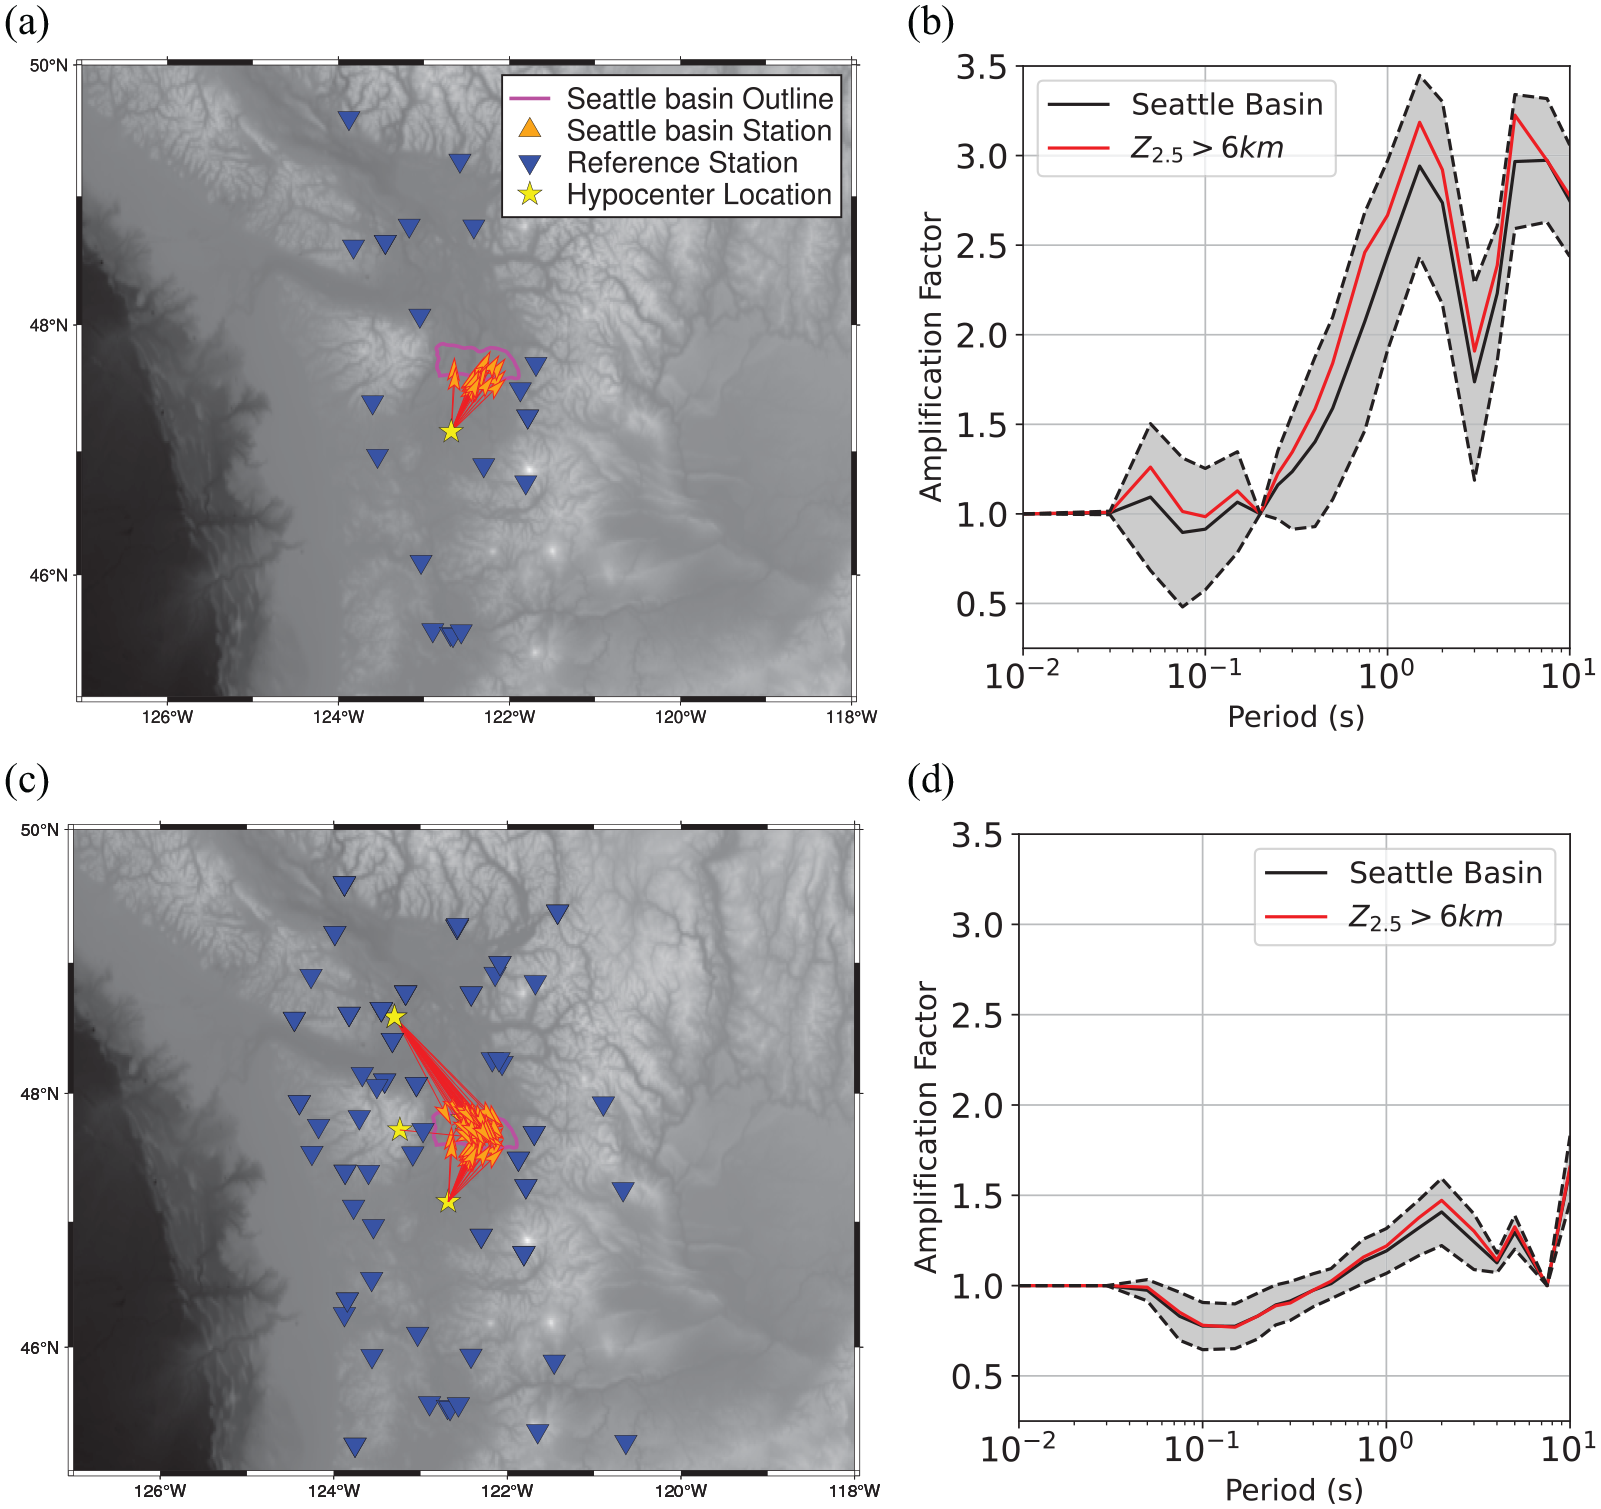
Figures (a) and (c) plot the station-event pairs inside the Seattle basin and the reference stations used to compute the average BAF shown in Figures (b) and (d). The red lines in (a) and (c) illustrate the azimuths for the source-site pairs used for the respective data sets. The gray shaded area in (b) and (d) shows the confidence intervals:
M9-based basin adjustment
The M9 project for Cascadia simulated the ground motions from a M9 megathrust event for the Cascadia Interface, and the results were discussed by Frankel et al. (2018a). The simulated ground motions indicate an average BAF of two for
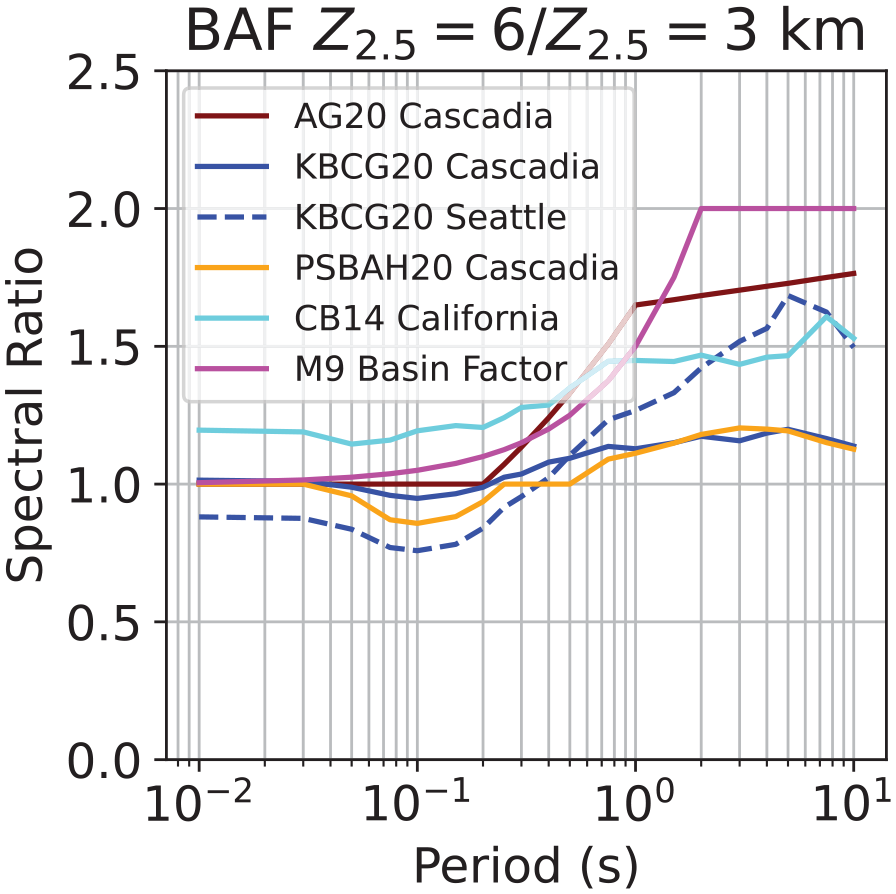
Spectral ratios for the NGA-Subduction GMMs for a 6 km basin site relative to 3 km reference site.
If we compare the NGA-Subduction empirical BAFs to the factors from M9 where the BAFs are defined using the ratio of sites with
Multiple approaches could be used to adjust the basin terms in NGA-Subduction GMMs to match the M9 basin amplifications. One approach is to apply a factor-of-two with respect to a defined reference condition as the basin term. The M9 simulations were run using a minimum uniform
The reference conditions are specified by the mean
The reference conditions are specified by the
The ground motions for Seattle basin sites with

where
In approach 1, the factor-of-two adjustment is relative to the average

KBCG20 average

The original basin terms for the NGA-Subduction GMMs and the adjusted factor-of-two basin terms using the two different reference conditions are shown as heat maps in Figure 20. The adjustment terms are computed for the uniform
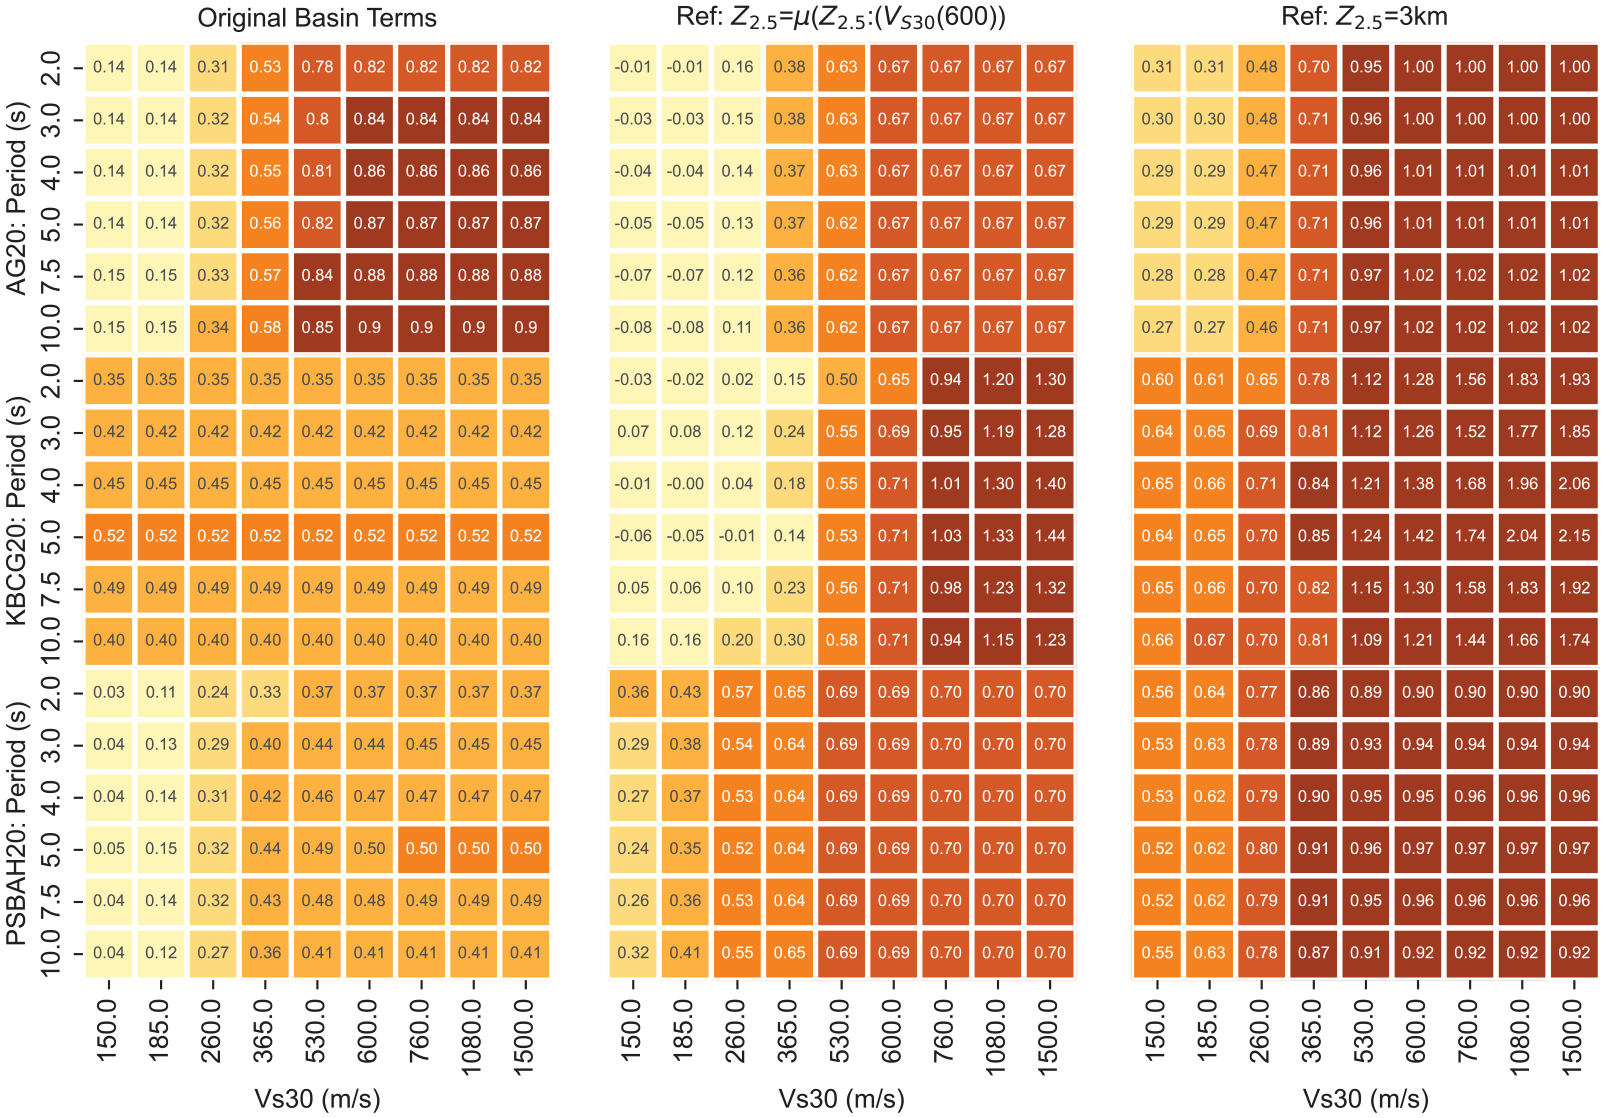
Heat maps of basin terms where the three framed columns correspond to the type of adjustment (no adjustment, approach 1, and approach 2) and the three framed rows correspond to the NGA-Subduction GMMs. Yellow corresponds to smaller basin terms, and red boxes correspond to larger basin terms.
The first reference condition results in slightly lower ground-motion levels for AG20. Because it is not defensible to lower the ground motions based on the factor-of-two, we propose a modification to the adjustment such that the maximum of the original basin term and this adjustment is used as described in the following equation:

KBCG20 period-dependent Seattle basin model uses a reference basin depth that is unusually shallow (200 m) compared with the other two GMMs, and this can result in factors greater than two for high
In approach 2, the reference condition
Note that Powers et al. (2021) used the basin-depth scaling models from the active crustal GMM of CB14 to model basin effects for the Zhao06 and AM09 GMMs in the 2018 NSHM. The basin terms for the CB14 are not defined using differential depth but directly use
Considerations for seismic hazard analysis in Cascadia
The data comparisons are useful in evaluating Cascadia GMMs based strictly on data-fit criteria. Regional intraslab comparisons reveal that AG20 Unadjusted performs well when compared
The development of aleatory variability models from regional (versus global) data is an important consideration for hazard model development. Too few events are available for regional data to provide guidance on the development of
Because no interface records are available for testing Cascadia interface GMMs, we use the global data set to evaluate NGA-Subduction and other GMMs. Comparisons of the GMMs developed prior to the NGA-Subduction Project—Zhao06 and AM09—are useful because the NGA-Subduction data set comprises the best compilation of subduction ground motions and enables evaluation of these GMMs with current observations. Short-period
Evaluation of regionalization effects in Cascadia ground motions shows that GMMs that included southern Cascadia data (KBCG20 and PSBAH20) show a smaller misfit when compared to a GMM based strictly on northern Cascadia (AG20). Between-event terms reveal an intriguing correlation with hypocentral depth, except for the shallowest events, which produce much higher than predicted ground motions. Bias from the Ferndale 2010 and 2022 events is highly similar, as are their distance attenuations, indicating repeatable ground-motion effects. The 2021 Petrolia event, however, has a distinctive bias pattern. This effect may result from the complex rupture of this event, with two distinct, spatially separated slip patches.
Calculation of basin amplifications reveals that gross features in the basin-depth scaling models of the NGA-Subduction GMMs can be reproduced using different magnitude subsets of the regional data. Using a higher magnitude threshold
Conclusion
This study compared Cascadia subduction GMMs against a common but limited set of regional recordings, in addition to global interface recordings, and two recent earthquakes from southern Cascadia. The comparison highlighted differences in the Cascadia GMMs based on the data and the influence of the adjustment terms in these GMMs. The unadjusted AG20 GMM is consistent with stress drops and attenuation that result from a young and warm Juan de Fuca slab (Frankel et al., 2015) and fits the data the best for the regional intraslab data set. The limited data indicate an adjustment to increase the short-period ground motions to be more in line with other subduction zones is reasonable. Moreover, Cascadia interface events pose a high hazard for this region, and the adjusted regional NGA-Subduction GMMs are useful for hazard studies in Cascadia. The factor-of-two adjustment was incorporated into the NGA-Subduction GMMs for interface sources based on the minimum
Footnotes
Appendix 1
This appendix provides details about the workflow used for compiling and processing the 2010 Ferndale, 2021 Petrolia, and 2022 Ferndale earthquakes. All data were downloaded and processed using the USGS software gmprocess, an automated Python package for strong-motion data workflows (Hearne et al., 2019). Even though observations from the Ferndale 2010 earthquake are provided in the NGA-Subduction database, we use gmprocess to download, assemble, and process this event so that the three earthquakes would be compared using consistent methods. Free-field seismic sites with SEED network codes corresponding to velocity and accelerometer sensors (EN, BH, HH, BN, and HN) were downloaded from the International Federation of Digital Seismic Networks (FDSN) using a search radius of
In addition to the processing workflow, a series of quality control steps is applied to each seismic waveform. These include checking for both horizontal components, verifying a minimum number of zero crossings, testing for clipping of the waveforms (Kleckner et al., 2021), and verifying that the ends of the velocity and displacement traces are stable.
Acknowledgements
Any use of trade, firm, or product names is for descriptive purposes only and does not imply endorsement by the US Government. Three anonymous reviewers provided valuable feedback that improved the article.
Declaration of conflicting interests
The author(s) declared no potential conflicts of interest with respect to the research, authorship, and/or publication of this article.
Funding
The author(s) received no financial support for the research, authorship, and/or publication of this article.
Data and resources
The NGA-Subduction database can be accessed from https://www.risksciences.ucla.edu/nhr3/nga-sub-database. Python scripts to reproduce the figures from this article are available from https://code.usgs.gov/ghsc/gmp/projects/2023-cascadia-gmms. The response spectra from the independent data set are available from ![]() .
.