Impact of ground-motion duration on nonlinear structural performance: Part I: spectrally equivalent records and inelastic single-degree-of-freedom systems
Open accessResearch articleFirst published online May, 2023
Impact of ground-motion duration on nonlinear structural performance: Part I: spectrally equivalent records and inelastic single-degree-of-freedom systems
In current seismic performance-based assessment approaches, nonlinear dynamic analysis of structures generally relies on ground motions selected based on their pseudo-spectral accelerations, with little or no consideration for ground-motion duration. Part I of this study, presented in this article, attempts to comprehensively quantify the impact of ground-motion duration on the nonlinear structural performance of case-study inelastic single-degree-of-freedom systems for shallow-crustal seismicity conditions. The effect of duration is decoupled from that of ground-motion amplitude and spectral shape by assembling sets of spectrally equivalent long- and short-duration records. Such sets are employed in incremental dynamic analyses of a wide range of computational models incorporating in-cycle and cyclic strength and stiffness deterioration. The structural response is quantified in terms of peak- and cumulative-based engineering demand parameters. Formal hypothesis testing is used to assess the statistical significance of duration’s impact on the median structural capacity of the considered structural systems. Furthermore, the derivation of duration-dependent fragility and vulnerability relationships demonstrates that ground-motion duration effectively impacts the nonlinear structural performance of various systems, and it should be accounted for in current practice. The fragility median values for highly deteriorating structural systems under long-duration ground motions are found to be up to 21% or 34.0% smaller than the short-duration counterpart if a peak- or cumulative-based engineering demand parameter is adopted, respectively.
Earthquake-induced ground motions and subsequent structural/nonstructural damage have resulted in devastating human, environmental, and economic losses in societies over the years. Therefore, investigating the ground-motion characteristics influencing nonlinear structural performance is essential for understanding the primary structural response and damage/loss drivers. Current seismic performance-based assessment procedures generally characterize ground motions in terms of amplitude and frequency-related parameters such as peak-ground acceleration () and pseudo-spectral acceleration () ordinates (i.e. using the pseudo-acceleration response spectrum) without explicitly considering duration. This may lead to structures with lower safety margins than expected in sites susceptible to long-duration ground motions—assuming that ground-motion duration does impact the structural response. The importance of amplitude and frequency content ground-motion characteristics have been extensively investigated (e.g. Baker and Cornell, 2006; Eads et al., 2015). However, it was not until recent years that consensus was reached on the impact of ground-motion duration on structural response (e.g. Bravo-Haro and Elghazouli, 2018; Chandramohan et al., 2016). Yet, limited analysis exists on the impact of ground-motion duration on the resulting direct seismic losses (e.g. Hwang et al., 2020). Hence, this article presents an extensive parametric study to model, quantify, and assess the significance of the potential impact of ground-motion duration on nonlinear structural performance (i.e. structural response and resulting damage/loss) using spectrally equivalent ground motions and inelastic single-degree-of-freedom (SDoF) systems.
The dependence of engineering demand parameters (EDPs) on ground-motion duration was examined at an early stage by Cornell (1997). The study considered several bilinear SDoF systems (without in-cycle and cyclic strength and stiffness deterioration; as defined by Ibarra et al., 2005) with different characteristics and three sets of ground motions. Those sets were characterized by ground motions with short, moderate, and very long duration, respectively. The global displacement ductility and the normalized hysteretic energy were used as EDPs in the nonlinear dynamic analysis of the considered SDoF systems. The resulting structural response per system was investigated, showing that as the utilized damage measure (i.e. or the factor by which a ground motion record must be scaled to cause a certain damage level) increased, the effect of duration became more apparent when the cumulative energy-based EDP was used, at least for higher damage levels and long fundamental-period systems.
To address which EDPs are more sensitive to ground-motion duration, Hancock and Bommer (2006) performed a complete literature review on the influence of ground-motion duration on nonlinear structural response. More than 100 investigations were compared, concluding that selecting an appropriate EDP (eventually impacted by ground-motion duration) must be based on the failure mode of interest for the structural system under consideration. For example, peak-based EDPs were recommended in the case of displacement levels leading to the formation of plastic hinges, global buckling, and a global mechanism triggering the structural collapse. In contrast, cumulative-based EDPs were recommended in the case of repeated cyclic loading leading to fractures (generally in the joints of steel frames), which can grow to produce global failures and structural collapse. The fact that guidelines of most seismic codes do not account explicitly for ground-motion duration was highlighted by the authors of the described study.
Iervolino et al. (2006) used bilinear and peak-oriented SDoF systems (24 in total without in-cycle and cyclic strength deterioration) and six sets of real (i.e. as-recorded) ground motions representing three different duration scenarios—small, moderate, and long duration—selected based on the Cosenza–Manfredi damage index (Cosenza and Manfredi, 1997). The study evaluated the nonlinear structural response via incremental dynamic analysis (IDA) to derive fragility relationships for the collapse damage state (DS) in terms of six different EDPs. In addition, hypothesis testing was performed to investigate the statistical significance of the results. The study showed that duration’s influence on the structural response and median collapse fragility (i.e. the median value of a collapse fragility relationship) could be captured differently depending on the chosen EDP. Cumulative energy-based EDPs were more suitable for capturing the duration effects of such estimates. The less obvious conclusion was that the results were statistically not significant if displacement ductility and cyclic ductility EDPs were used, regardless of the structural configuration, since strength deterioration was not considered.
Owing to the increasing availability of long-duration ground-motion records from large-magnitude earthquakes, research on duration effects became more robust than in past studies in which long-duration records were mainly generated synthetically (e.g. Raghunandan and Liel, 2013; Sarieddine and Lin, 2013). For instance, Raghunandan and Liel (2013) analyzed the ground-motion duration impact on the median collapse fragility of old and modern (i.e. non-ductile and ductile, respectively) reinforced concrete (RC) frames using both recorded and simulated ground motions. Record selection was based solely on and 5%–95% significant duration (), without accounting for spectral shape, although it is known that spectral shape affects the structural response significantly (Haselton et al., 2011). Two-dimensional building computational models were constructed using a lumped plasticity nonlinear modeling strategy, with models able to account for in-cycle and cyclic deterioration of strength and stiffness (Ibarra et al., 2005; Lignos and Krawinkler, 2011) and including geometric nonlinearities from effects. The study concluded that duration leads to a 26%–56% reduction in the median collapse fragility obtained via IDA (comparing long- against short-duration ground motions).
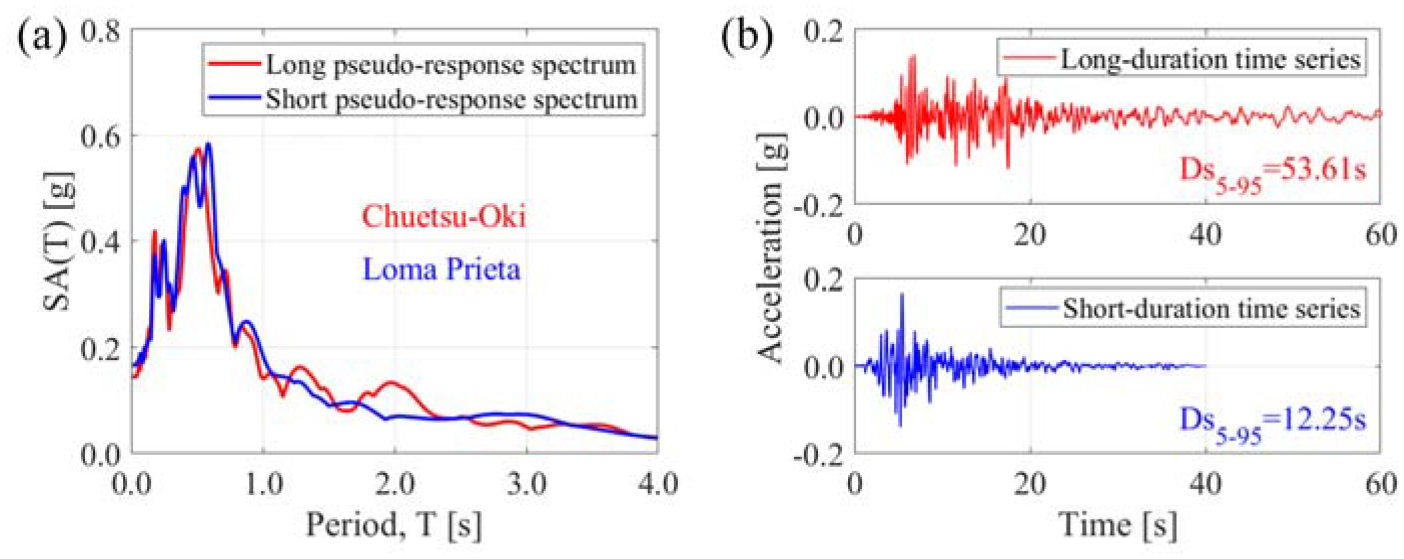
To decouple the impact of ground-motion amplitude and spectral shape from that of duration, Chandramohan et al. (2016) selected sets of spectrally equivalent (i.e. ground motions with matching pseudo-acceleration response spectra) long- and short-duration ground motions (Foschaar et al., 2011), with earthquake records from subduction tectonic regions (ground-motion duration was quantified using 5%–75% significant duration). The effect of ground-motion duration on structural collapse was examined using the maximum interstory drift ratio (MIDR) as an EDP for two structural systems: a steel moment-resisting frame and an RC bridge pier model. In both models, a lumped plasticity nonlinear modeling strategy was adopted. The plastic hinges included models capturing the in-cycle and cyclic deterioration phenomena and geometric nonlinearities from effects. It was concluded that the median collapse fragility of the considered structural systems could decrease up to 29% in the steel moment-resisting frame and up to 17% for the RC bridge pier. In Figure 1a and b, an example of long and short spectrally equivalent ground motions is shown. This method to decouple spectral shape from duration effects is also used in this study, as detailed in section “Ground-motion selection.”
Chuetsu-Oki (Japan) and Loma Prieta (USA) earthquake-induced ground motions: (a) pseudo-acceleration response spectra, and (b) long- and short-duration time series.
To investigate the influence of ground-motion duration at different levels of structural damage less severe than collapse, Barbosa et al. (2017) analyzed three different steel moment-resisting frames designed using pre-Northridge seismic codes. Two-dimensional building computational models were developed with columns modeled using nonlinear force-based fiber-section elements and beams modeled using force-based finite-length plastic-hinge elements. Shallow-crustal and subduction ground-motion records were utilized, but only 10 of them were spectrally matched to account for the spectral shape effects. MIDR and two different damage indices (DIs) were used as EDPs (i.e. Park and Ang, 1985; Valles and Reinhorn, 1996). The results were estimated in terms of median DS fragility obtained directly from the IDAs. This study concluded that for low levels of spectral acceleration (i.e. low-intensity levels), the influence of duration on the structural response is negligible using the selected EDPs; the opposite behavior was observed for large spectral accelerations. Two levels of damage were utilized to assess the response of the systems using the DIs. Due to the impact of duration, reductions in the DIs ranging from 12% to 67% were observed.
More recently, Bravo-Haro and Elghazouli (2018) determined that the influence of duration (quantified as 5%–75% significant duration) is particularly evident at intensity levels near the dynamic instability of the considered structures. Specifically, various IDAs were performed on four selected steel moment-resisting frames, indicating a higher probability of collapse for long-duration ground-motion records, with an average reduction of 17% in the median collapse fragility (maximum of 24%). The two-dimensional building computational models included in-cycle and cyclic deterioration phenomena and geometric nonlinearities from the effects. By examining a broader range of fundamental structural periods using the median collapse capacity spectrum, reductions of up to 40% were observed, highlighting the inadequacy of typical seismic-code guidelines, primarily based on short-duration ground motions (i.e. based on peak nonlinear structural response). This was particularly evident when the median collapse capacity spectrum results obtained through a long-duration ground-motion set were compared with results achieved from a duration-independent set of records, the latter being recommended in the FEMA P695 (FEMA, 2009).
In general, the conclusions reached by previous studies depend on the nature of the ground motions used, the intensity measures (IMs) used to quantify duration, the characteristics of the computational models implemented, and notably, the considered EDPs. Peak-based demands (e.g. maximum displacement, ) did not show a clear correlation with ground-motion duration, whereas cumulative-based demands (e.g. dissipated hysteretic energy, ) showed a much stronger correlation. Despite the significant number of studies on this subject, the impact of ground-motion duration on structural response and, more generally, on seismic fragility and vulnerability still requires further research (e.g. Hwang et al., 2020). Current performance-based assessment practice classifies structural damage using maximum global deformations obtained from nonlinear structural analyses, considering a range of ground-motion levels. The results are then statistically processed to derive the distribution of structural response and resulting damage/loss estimates. However, no consideration is typically made regarding the severity and the number of inelastic cycles a system may undergo, with cumulative inelastic deformations leading to an excessive deterioration of relevant mechanical properties such as strength and stiffness. Indeed, long-duration ground motions usually cause significant damage to structural components at deformation levels considerably lower than those noted under a monotonic loading (e.g. Bojórquez Mora et al., 2009; Cheng et al., 2015; Choi and Kim, 2009).
In the literature, DIs have been generally used to assess the duration effects on structural damage (i.e. fragility analysis), accounting for the number of inelastic cycles experienced by a structural system (e.g. Belejo et al., 2017; Pan et al., 2020). However, most DIs (e.g. Park and Ang, 1985) do not consider the decrease in strength and stiffness of structural components, leading to increased deformations in a system. Currently, advanced deterioration models incorporating cyclic and in-cycle strength and stiffness deterioration have been derived to deal with the above issue (e.g. Ibarra et al., 2005; Lignos and Krawinkler, 2011), having a twofold deterioration behavior equivalent to the two-part damage concept as the Park-Ang index. Chandramohan et al. (2016) demonstrated that by using such models and a peak-based EDP, duration effects on structural response could be observed at high-intensity levels when approaching collapse DS.
Together with Part II of this study (i.e. Otárola et al., 2023), this article aims to broadly model, quantify, and assess the impact of ground-motion duration on the nonlinear structural performance, from structural response to damage/loss. Specifically, this first study investigates whether ground-motion duration effectively influences the nonlinear structural performance of case-study SDoF systems through a comprehensive parametric analysis using spectrally equivalent ground motion records, appropriate nonlinear modeling strategies, EDPs accounting for duration explicitly, and efficient and sufficient (e.g. Luco and Cornell, 2007) IMs able to capture the combined effects of duration and spectral shape. Notably, it aims to provide the required tools to assess the impact of ground-motion duration in large-scale (regional) seismic risk assessment exercises (i.e. fragility/vulnerability relationships) according to current state-of-the-practice (e.g. Martins and Silva, 2021; Villar-Vega et al., 2017). The companion paper introduces an end-to-end seismic performance-based assessment framework relying on site- and building-specific analyses, including ground-motion duration explicitly, as a direct continuation of this article. In such manner, the main novelties of this study are summarized as follows:
Implementation of as an explicit indicator of damage accumulation: structural response assessment is performed using average pseudo-spectral acceleration () as the primary IM and alternatively as an EDP: (a) , implicitly accounting for duration through the adopted nonlinear modeling strategy; and (b) , explicitly accounting for duration through the adopted nonlinear modeling strategy and its cumulative nature.
Case-study SDoF systems with several dynamic properties and hysteretic behaviors: a total of 180 distinct SDoF systems are used to study the potentially exacerbated reduction of structural capacity observed using as EDP, compared with the one obtained in terms for the full range of structural behavior. Hypothesis testing is extensively used to confirm the statistical significance of the attained results in terms of both EDPs.
Assessment of the impact of ground-motion duration on damage/loss: duration effects on damage and loss estimates are investigated at different DS than collapse. Fragility and vulnerability relationships are derived to investigate such effects on fragility median values and expected annual losses (EALs) through relative comparisons between the results achieved under long- and short-duration ground motions using a single synthetic hazard curve.
This article is organized as follows. Section “Methodology” describes the methodology employed in this article, namely, the ground-motion selection procedure and the approach to assess the impact of ground-motion duration on the nonlinear structural performance. Section “Results and Discussion” presents the main findings from the analyses based on thoroughly examining the results. These results are also compared against the relevant literature findings mentioned above. Section “Conclusions” outlines the main conclusions of this study.
Methodology
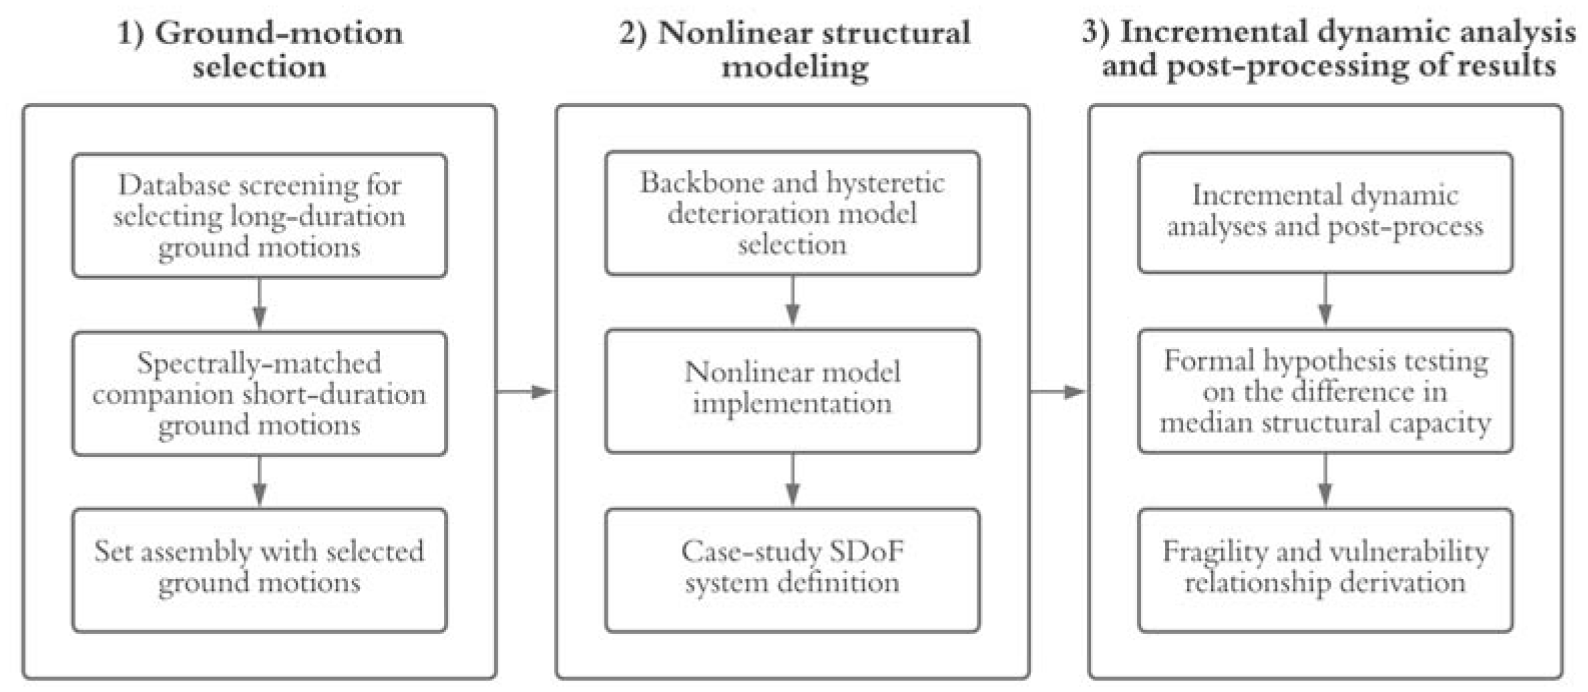
The adopted methodology (Figure 2) consists in decoupling the ground-motion duration effects from those of amplitude and response-spectral shape, assembling sets of spectrally equivalent long- and short-duration ground motions as described in Chandramohan et al. (2016). These ground-motion sets are employed in comparative IDAs to derive fragility and vulnerability relationships for various structure-specific DSs and each SDoF system in analysis. Formal hypothesis testing is extensively used to quantitatively assess the statistical significance of the differences in the structural capacity due to duration effects. The reductions in fragility median values and EALs due to duration are carefully examined. Details related to each aspect of this methodology are introduced in the specific subsections.
Adopted methodology to assess the impact of earthquake-induced ground-motion duration on nonlinear structural performance.
Case-study systems
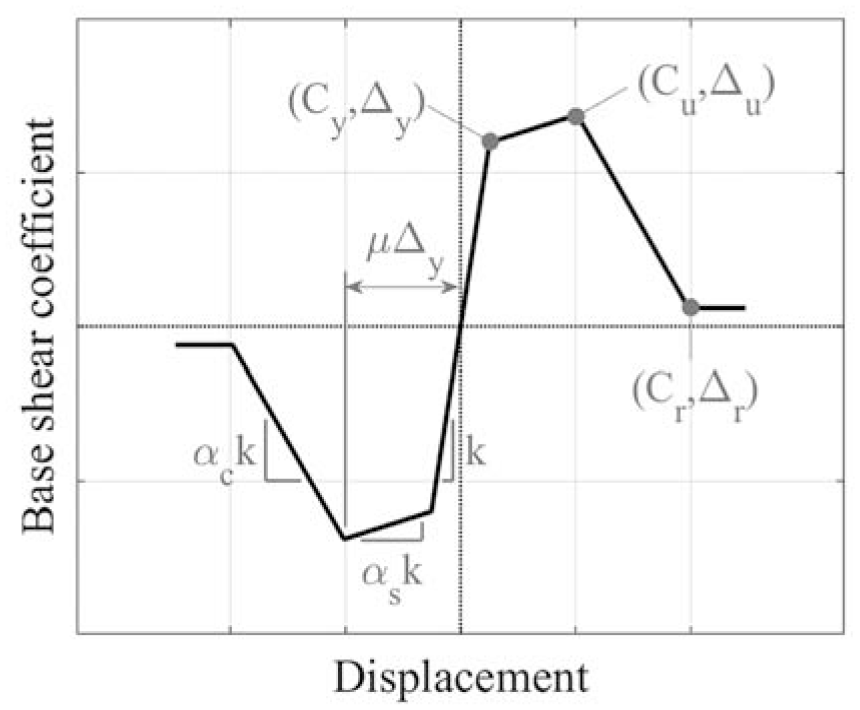
A parametric study on a set of SDoF systems is conducted to identify the influence of ground-motion duration on nonlinear structural performance with limited computational effort. These systems are used since they depend on a low number of parameters and assumptions, providing valuable insights into a broader range of general cases, and are currently employed in state-of-the-practice regional seismic risk assessment applications such as the Global Earthquake Model (e.g. Martins and Silva, 2021; Villar-Vega et al., 2017). To numerically simulate the structural response of the SDoF systems, OpenSees v3.2.2 (Mazzoni et al., 2006) is adopted. A linear piece-wise backbone curve (Figure 3) describes the inelastic behavior of the systems under monotonic loading (including in-cycle strength deterioration). Specifically, backbones are defined in this study by the following parameters: yield base shear coefficient, ; residual base shear coefficient, ; hardening stiffness ratio, ; post-capping stiffness ratio, ; ductility capacity, ; fundamental structural period, (base shear coefficient is equal to the base shear at each displacement of interest over the total system weight). The initial stiffness, (Equation 1); ultimate base shear coefficient, (Equation 2); yield displacement, (); ultimate displacement, (); residual displacement, (equation 3) are computed using the above-defined parameters as indicated. The built backbones are symmetric with respect to the origin (i.e. base shear coefficient and displacement equals zero). It is worth mentioning that is the threshold defining the pre-capping and post-capping structural behavior. Each study case is assumed to have a unitary mass () and a constant mass-proportional viscous damping coefficient (equal to 5% of the critical damping):
General definition of SDoF system backbones.
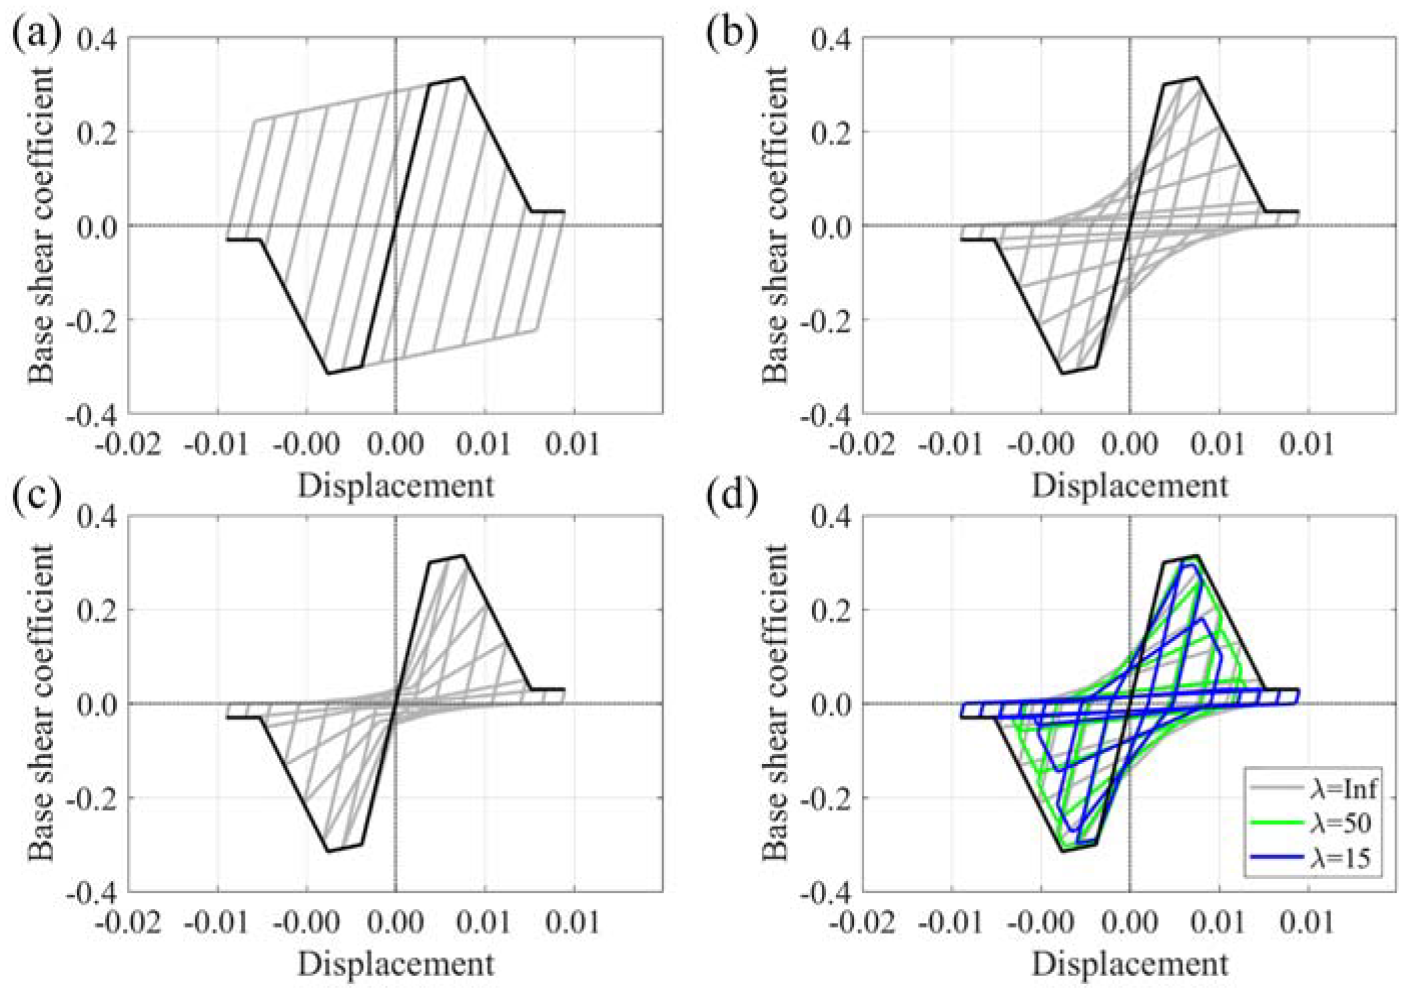
The complex nonlinear cyclic and in-cycle behavior of each study case is characterized by the modified Ibarra–Medina–Krawinkler (IMK) deterioration model (Ibarra et al., 2005; Lignos and Krawinkler, 2011) with different hysteretic behaviors: (a) “kinematic hardening” response with no stiffness deterioration (Figure 4a), to ideally represent ductile welded steel structures (BL) (e.g. Bravo-Haro and Elghazouli, 2018); (b) “peak-oriented” response with stiffness deterioration (Figure 4b), to ideally represent ductile reinforced concrete structures (PO) (e.g. Chandramohan et al., 2016); and (c) “pinched” response with stiffness deterioration (Figure 4c), to ideally represent existing structures with non-ductile behavior and pinching like some pre-seismic-code concrete and wood structures (PI) (e.g. Pan et al., 2020). Although these deterioration models were developed for structural components (rather than for structural systems), it is assumed that the global structural response follows the same hysteresis and deterioration behavior as a representative component. It may be unrealistic to consider that all the structural components have the same deterioration properties and yield and deteriorate simultaneously. Nevertheless, such assumptions are often made when multi-degree-of-freedom (MDoF) structures are represented with SDoF systems (e.g. for building-portfolio seismic risk assessment) without jeopardizing the generality of the results (e.g. Ibarra et al., 2005).
SDoF system hysteresis: (a) Ibarra–Medina–Krawinkler (IMK) deterioration model with a BL (i.e. kinematic hardening) response, (b) IMK model with a PO (i.e. peak-oriented) response, (c) IMK model with a PI (i.e. pinched) response, and (d) sensitivity of the cyclic behavior for various values of a model with PO response.
It is worth mentioning that these deterioration models present a twofold behavior (i.e. cyclic strength and backbone deterioration), similar to the two-part damage concept adopted in some cumulative damage models (e.g. Park and Ang, 1985). Consistently to Ibarra et al. (2005), cyclic strength deterioration depends on following the rule developed by Rahnama and Krawinkler (1993), with the so-called “deterioration parameter” () controlling the deterioration rate: large values will cause the SDoF systems to experience low deterioration, while small values will cause the SDoF systems to experience high deterioration (Figure 4d). To provide a wide sensitivity study, the selected values for this parameter are = 15, = 25, = 50, = 100, and = Inf (no cyclic strength deterioration will be experienced for = Inf) based on a sensitivity analysis performed by the authors (similar values were utilized in Ibarra et al., 2005). The backbone controls the in-cycle strength deterioration of the SDoF systems through its decreasing trend, where the negative stiffness can be observed (i.e. between and ). Two different strength deterioration modes are used simultaneously, as defined within the IMK model, the first called “basic strength deterioration” and the second “post-capping strength deterioration.” No “unloading stiffness” and/or “accelerated reloading stiffness” deterioration modes are utilized in this study since attention is given to cyclic and in-cycle strength deterioration; stiffness deterioration influence can be inferred from a comparison between SDoF systems with BI and PO hysteretic responses, for instance. For both the aforementioned deterioration modes, the same value is used according to Ibarra et al. (2005).
The analyzed SDoF systems are grouped according to their respective backbones from A to L (Table 1). Each backbone is related to a combination of the above-mentioned hysteretic models and parameters, thus defining 180 different SDoF systems in total. The same yield base shear coefficient is assigned in all the cases since the results would simply be scaled linearly by changing this parameter (= 0.30) (Vamvatsikos and Cornell, 2006), especially true for systems with low-to-moderate displacement ductility capacity. The same residual base shear coefficient is assigned in all the cases to have a minimum residual structural capacity, where collapse is assumed to occur (= 0.10) (i.e. systems assumed to be affected by effects). The same hardening stiffness ratio is assigned in all the cases since previous investigations revealed that this parameter has a minor influence on structural response for values between 0.03 and 0.08 (= 0.03) (e.g. Nassar and Krawinkler, 1991). The chosen post-capping stiffness ratios characterize small- to high-strain-softening structures (e.g. Elwood and Moehle, 2003). The ductility capacity values are characteristic of low- to high-ductile structures. Finally, the selected fundamental structural periods represent typical low- to high-rise structures. It is worth mentioning that geometric nonlinearities are not included in the computational models; although important, this is not considered a major drawback since the pre-capping and post-capping structural behavior are explicitly modeled; mimicking the potential effects on the backbones (e.g. development of negative post-capping stiffness and reduced residual base shear). The importance of such effects has been investigated in Chandramohan et al. (2016).
As mentioned, the defined SDoF systems can capture ground-motion duration effects on the structural response because controls the strength cyclic and in-cycle deterioration. Other deterioration models unable to capture this deterioration phenomenon were utilized in the past literature, making it highly unlikely to capture duration effects when the demands are measured in terms of peak-based EDPs (e.g. ; MIDR), as duration does not influence peak response directly (e.g. Iervolino et al., 2006). Ground-motion duration impacts the structural strength and stiffness in a cumulative damaging process, affecting peak response in turn. Therefore, duration’s influence on peak response cannot be captured unless stiffness and strength cyclic and in-cycle deterioration is explicitly modeled. Since spectrally equivalent ground motions are employed, other ground-motion characteristics (e.g. amplitude and spectral shape) are not expected to contribute significantly to the structural response variability when comparing results using long- and short-duration record sets. and are used in this study as EDPs for comparison purposes. In the case of , the impact of duration on nonlinear structural response and performance is captured implicitly through the effect of the strength and stiffness deterioration (e.g. Chandramohan et al., 2016). In the case of , this effect is captured explicitly by definition, based on the previous point, and due to its cumulative behavior, as discussed in more detail in section “General trends.”
DS thresholds definition
Structure-specific DSs are necessary to describe the structural performance level of each SDoF system. These can be defined by setting specific values of the chosen EDPs (i.e. and ). The DS thresholds in terms are defined according to the ASCE/SEI 41-17 guidelines (American Society of Civil Engineers, 2017) as follows: (a) slight damage state (DS1), for which the DS threshold corresponds to ; (b) moderate damage state (DS2), for which the DS threshold corresponds to 75% of ; (c) extensive damage state (DS3), for which the DS threshold corresponds to ; and (d) complete damage state (DS4), for which the DS threshold corresponds to (i.e. collapse). These thresholds are set to investigate further the impact of ground-motion duration at different nonlinear structural performance levels. Although a detailed derivation of the thresholds based on more realistic criteria is out of the scope of this study, this specific issue is tackled in Part II of this study using multiple measurable criteria from the component to the global system level (e.g. Aljawhari et al., 2021).
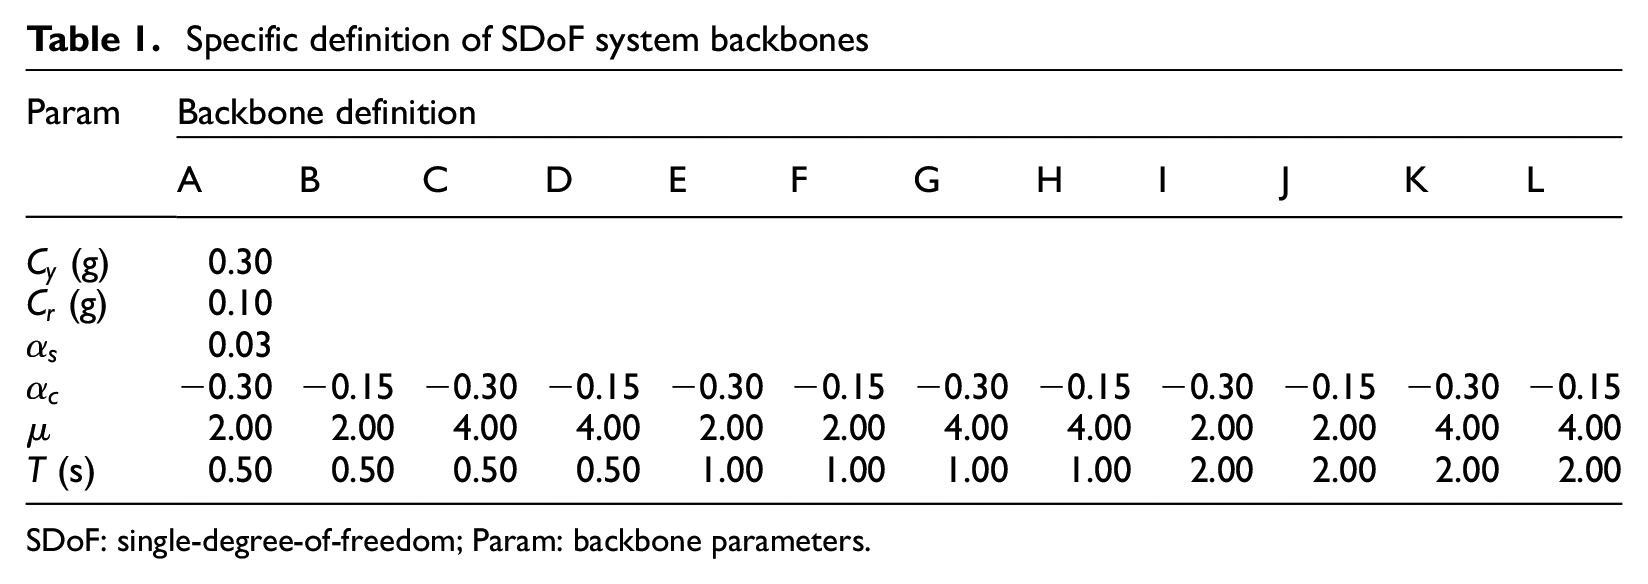
For the case of DS thresholds defined in terms of (i.e. a cumulative-based EDP that monotonically increases with the length of the applied excitation), a structure-specific pseudo-parabolic relationship between and , as proposed by Gentile and Galasso (2021), is used to define energy-based DS thresholds established from the more reliable (and widely available) deformation-based ones. Since is ground-motion-dependent, IDA (section “Seismic response analysis”) is used to compute an individual versus relationship (Figure 5a) for each record (including both short- and long-duration ground-motion records), where is estimated as the area under the force–displacement relationship (without including elastic strain energy since it is zero for a system in the elastic range). Consistently with the common practice of neglecting the variability of the -based DS thresholds in deriving fragility relationships, the to conversion is herein carried out neglecting the | variability; therefore, -based DS thresholds are obtained in median terms. The existence of such a stable relationship between a peak-based EDP and (e.g. vs ) has been confirmed by numerical dynamic analyses of SDoF systems subjected to ground motions (e.g. Quinde et al., 2021; Terán Gilmore, 2001) and quasi-static, cyclic experimental tests on individual structural components (e.g. Erberik and Sucuoǧlu, 2004; Scribner and Wight, 1980). A wide distribution of is used to build such a median relationship (Figure 5b), avoiding bias in the estimations due to an improper consideration of the structural response variability due to ground-motion duration. It is observed that duration is well correlated to the amount of hysteretic energy dissipated by a structure (Pearson correlation coefficient between 0.6 and 0.7; for example, Gentile and Galasso, 2021); therefore, duration can explain the variability of given , because can be a good proxy for the number of plastic excursions of a structural system. Nevertheless, the relevant experimental/field data may be used to provide a deeper confirmation to such hypothesis.
Definition of energy-based DS thresholds from the versus curve for an SDoF system with an IMK model with PO-A- = 15: (a) energy-based DS thresholds derivation, and (b) distribution for each curve associated with the selected ground-motion records.
Ground-motion selection
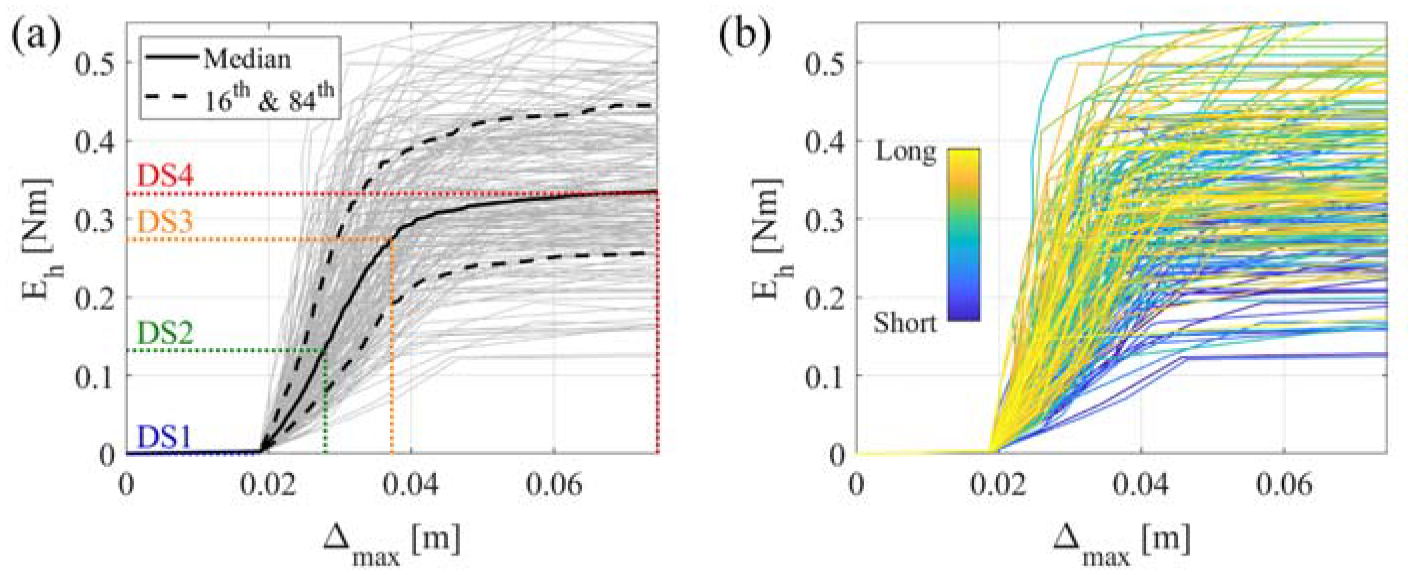
The main definitions of ground-motion duration include (a) uniform duration, which considers the sum of the intervals for which the ground acceleration is above a specified threshold acceleration (Bolt, 1973); (b) bracketed duration, which is defined as the interval between the first and last excursions of a specified threshold acceleration (Ambraseys and Sarma, 1967); and (c) significant duration, which is defined as the interval between the times at which different specified values of Arias intensity are reached (Trifunac and Brady, 1978). Many other metrics that are implicitly correlated to ground-motion duration, which may not directly be expressed in time units, have also been proposed (e.g. Cosenza and Manfredi, 1997). representing the interval between 5% and 95% of the normalized area under the Arias intensity integral is regarded as an efficient and sufficient IM (Chandramohan et al., 2016) as well as hazard computable and is adopted in this study. Figure 6a and b illustrates the definition of significant duration using a Chuetsu-Oki (Japan) ground motion.
Significant duration of a Chuetsu-Oki () earthquake-induced ground motion: (a) ground-motion acceleration time series, and (b) definition.
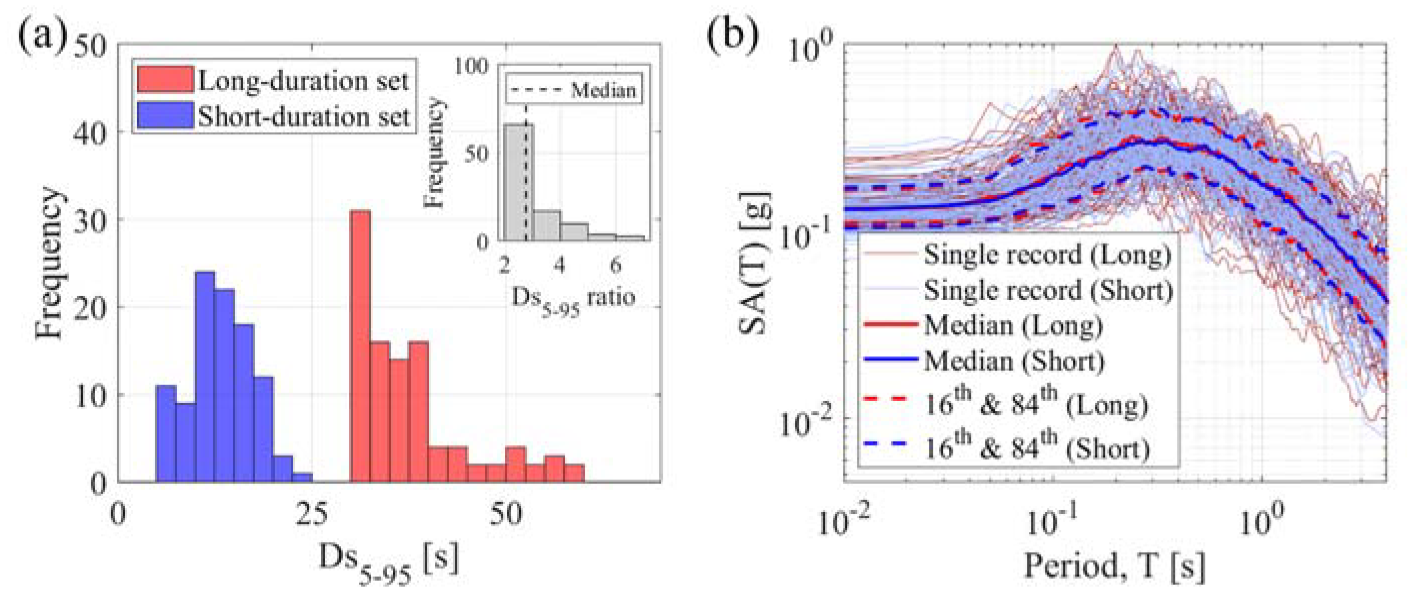
The ground-motion records employed in this study are a subset of the Pacific Earthquake Engineering Research Center–Next Generation Attenuation Relationships for Western United States (NGA-West2) database (Ancheta et al., 2013). The database includes over 21,000 three-component uniformly processed records from shallow-crustal earthquake events in worldwide active tectonic regions, with a moment magnitude () ranging from 3.0 to 7.9 and rupture distances of 0.1–1533 km. Subsets of this database have been used to develop the NGA-West2 suite of ground-motion models (GMM) for various IMs worldwide. For this study, two spectrally equivalent sets are defined, named long and short duration, with duration defined in terms of . Initially, the long-duration ground-motion set is selected considering all the records within the NGA-West2 database complying with the following criteria (defined by the authors to have a set of records of engineering significance and to avoid near-fault effects in the ground motions): (a) 10 km ≤≤ 250 km; (b) 30s ≤≤ 60s; (c) minimum = 5.0; (d) minimum = 0.10 g; and (e) minimum = 10 cm/s. is the minimum source-to-site distance, while is the peak-ground velocity.
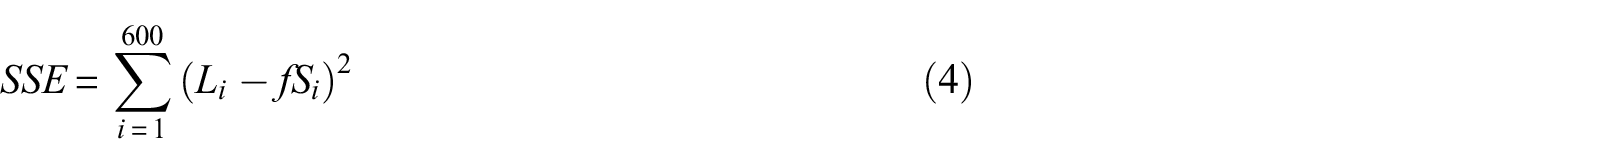
The previous data screening results in the selection of 188 long-duration ground-motion records. A companion short-duration record set is assembled, selecting for each long-duration record a corresponding record with smaller than 30 s and closely matching its response spectrum. Such limit is selected after checking the distribution of for the available ground-motion records (Figure 7a), finding a balance between records being suitably long to observe an impact due to duration, but not that long to result in a small set (similar to Chandramohan et al., 2016). An upper limit of 60 s was defined to avoid bias in further analyses, as discussed later in section “Hypothesis testing.” As described in Chandramohan et al. (2016), the target response spectrum of each long-duration record is discretized at periods from 0.01 to 6.00 s, with a step of 0.01 s (i.e. a total of 600 periods), with a geometric mean . The corresponding spectral ordinates with a geometric mean , are calculated for all the companion short-duration ground-motion records. The spectral ordinates of each short-duration record are then scaled by a factor =/, such that the geometric mean of the spectral ordinates of the scaled record () is equal to the one initially computed for the long-duration record (). A conventional constraint of 0.2 ≤≤ 5.0 is imposed to avoid excessive scaling in the record selection (Luco and Bazzurro, 2007). The sum of squared errors (SSEs) is used to measure the difference between each candidate pair of long- and short-duration records (Equation 4). Ultimately, the 100 record pairs with the lowest SSE are selected for performing IDAs on the several case-study SDoF systems (the attained SSE values vary from 0.19 up to 0.95 g2):
Selected long- and short-duration ground-motion record sets: (a) Distributions of for the selected sets and of ratio between spectrally equivalent ground-motion records, and (b) median, 16%, and 84% percentile pseudo-acceleration response spectra for each set.
Figure 7a also presents the distribution of the ratios between pairs of spectrally equivalent ground motions. It is noted that the for the selected long-duration records is always at least twice when compared with the short-duration ones ( ratio median equals 2.76, with 66 values between 2.0 and 3.0). This could indicate that structural response and damage/loss estimates can vary strongly with duration if spectrally equivalent ground motions with ratios as small as 2.0 can produce significant differences in the results. Following the above-described procedure, duration effects are expected to be decoupled from those due to ground-motion amplitude since each spectral shape pair has a close match (Figure 7b). In other words, by having such a good agreement between median, 16th, and 84th percentile pseudo-acceleration response spectra, the exhibited variability in the results (i.e. structural response and hence, damage/loss) will be a direct consequence of ground-motion duration effects. It is important to highlight that is negatively correlated (i.e. ∼−0.6) with ordinates (i.e. spectral shape) up to fundamental structural periods of 1.5–2.0 s, as demonstrated by Huang et al. (2020) (among others; for example, Bradley, 2011). As a result, it is highly unlikely that ground motions from distinct earthquakes recorded at the same location exhibit similar response spectra, yet very distinct durations. However, such a scenario can represent a pair of ground motions observed at two different sites (a condition of interest in the case of regional seismic loss analyses) or sites characterized by seismic hazard disaggregation showing a bimodal distribution of earthquake magnitudes and source-to-site distances contributing to ground-motion exceedance. Another critical aspect inherent to the IDA framework is that the variation of spectral shape with different conditional intensities is not captured. The stated issues are thoroughly addressed in Part II of this study.
Seismic response analysis
IDA involves subjecting a building/structure computational model to several ground-motion records, each scaled to multiple intensity levels, producing curves of EDP versus IM (Vamvatsikos and Cornell, 2004). The scaling levels are appropriately selected to force the given structure through the entire range of behavior, from elastic to inelastic and finally to global dynamic instability, likely corresponding to collapse. (e.g. Eads et al., 2015) is the amplitude-based IM considered in this study. It is computed as the geometric mean of s in the period range [, ] with increments of 0.05 s and is considered a good proxy of amplitude and spectral shape. Such range was selected since for the defined study cases, the dispersion in the nonlinear structural response will not decrease significantly when using ordinates below the fundamental structural period, as demonstrated by Eads (2013). In addition, higher-mode periods are not deemed relevant because only SDoF systems are considered. This IM is selected since it is proven to be more efficient and sufficient than other typical IMs (e.g. Eads et al., 2015; Kohrangi et al., 2017a), meaning that (a) its use results in relatively small variability of the EDP given IM, reducing the number of nonlinear dynamic analyses and ground-motion records necessary to estimate the conditional distribution of EDP versus IM with adequate confidence—efficiency; and (b) fragility and vulnerability analysis outcomes are expected to be less sensitive to other seismological features and ground-motion characteristics (e.g. earthquake magnitude and source-to-site distance), compared with typical IMs—sufficiency. In other words, both record-to-record and site-to-site variability are reduced. Moreover, can serve as a single common IM for a class of structural systems (e.g. building types). This makes it a practical tool for large-scale (regional) seismic risk assessment exercises, given the reduced site dependency (i.e. the adverse multi-site effects are reduced; Kohrangi et al., 2017b). The IDA curves for an example SDoF system with an IMK model with PO-A-= 15 (with as EDP; Table 1) using the long- and short-duration ground-motion sets are shown in Figure 8a and b, respectively. is estimated as the maximum displacement experienced by the system under a certain earthquake-induced ground motion; while is estimated as the area under the hysteretic (i.e. force–displacement) response as mentioned before.
IDA curves for an SDoF system with an IMK model with PO-A-= 15 when implementing a nonlinear dynamic analysis using the (a) long- and (b) short-duration ground-motion sets.
Hypothesis testing
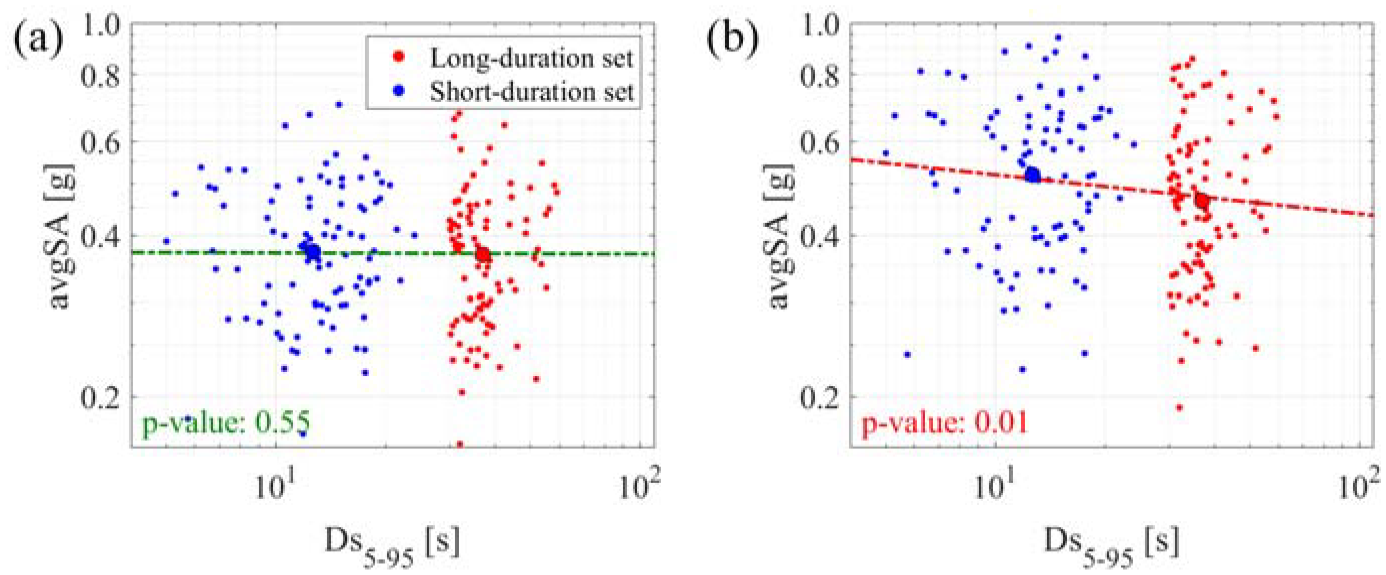
Formal hypothesis testing (e.g. Kass et al., 1974) is used to evaluate whether the impact of ground-motion duration on nonlinear structural response is statistically significant or not. The corresponding nonlinear structural capacity values at the onset of a DS (e.g. colored points in Figure 8a and b) are acquired from the IDA results associated with each SDoF system. Linear regression through the ordinary least squares approach (e.g. Neter et al., 1996) is fitted to the versus data points in log–log space, for the DS as shown in Equation 5. and are the model’s regressor coefficients, while is a normal random variable related with the error of the residuals with zero mean and variance . The above procedure is repeated per each study case; therefore, a total of 180 models are fitted for each DS:
The performed test refers to the significance of the coefficient (or slope), assuming that the null hypothesis () is that is equal to zero, while the alternative hypothesis () is that the coefficient is different from zero, with a 95% significance level (i.e. choosing an I-type risk equal to 0.05). The probability of obtaining test results at least as extreme as the results observed under the assumption that the null hypothesis is correct (i.e. p-values) is estimated (the t-statistic value to apply this test is calculated by dividing the value over the standard error of this coefficient). If the p-value is smaller than the conventional threshold of 0.05, the result is considered statistically significant (e.g. Neter et al., 1996). To avoid bias in the results, it is checked that the residuals are normally distributed for each linear regression performed utilizing the Jarque–Bera test of normality (Jarque and Bera, 1987). Figure 9a and b corresponds to the results from an example SDoF system with an IMK model with PO-A-= 15, of the above-depicted approach for DS2 and DS4, respectively. In the case of Figure 9b, the reduction of capacity with an increase in duration is evident and statistically significant, as quantitatively verified by the corresponding p-value, as opposed to what is observed in Figure 9a.
versus obtained from an SDoF system with an IMK model with PO-A-= 15: (a) constant structural capacity in DS2, and (b) structural capacity decrease in DS4.
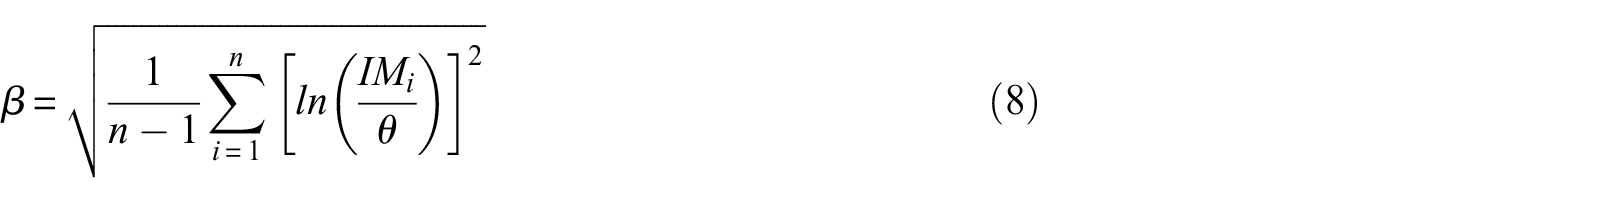
Fragility and vulnerability relationships
System-level seismic fragility is the probability of reaching or exceeding a DS for a given value of IM. Assuming a lognormal distribution (Equation 6), the fragility relationships mean, (i.e. represents the median of the IM values in linear space) and logarithmic standard deviation, (i.e. dispersion) are computed with Equations 7 and 8, respectively (e.g. Porter et al., 2007). In these equations, is the number of considered ground motions and is the IM value associated with the onset of a DS for the ground-motion record. An example of fragility relationships fitted employing this approach (using the long- and short-duration ground-motion sets) for an SDoF system with an IMK model with PO-A-= 15 is shown in Figure 10a, in which the colored dots represent the empirical cumulative distribution function (ECDF):
(a) Fragility, and (b) vulnerability relationships utilizing the long- and short-duration ground-motion sets on an SDoF system with an IMK model with PO-A-= 15.
Vulnerability relationships are herein expressed in terms of mean loss ratio (LR); in other words, the mean repair-to-replacement cost ratio of the building/structure, conditional on the level of ground-shaking IM. According to Equation 9, such functions are derived using the total probability theorem. The term (Equation 10) is the probability that the DS is equal to (i.e. the probability of being in a DS), while is the damage-to-loss ratio for the DS. It is worth mentioning that the is equal to , Equation 10 applies for the other DSs. DLRs are usually estimated empirically through post-earthquake reconnaissance or employing expert judgment and, more rarely, using probabilistic approaches accounting for their inherent uncertainty. These ratios are both site-specific and building-type-specific and must be carefully selected while developing vulnerability relationships (e.g. Rossetto and Elnashai, 2003). However, the same DLRs are herein used for every case since a relative comparison between loss estimates under the long- and short-duration ground-motion sets is desired, rather than achieving building-type actual results (i.e. by using appropriate DLRs for each structural system). In this study, the DLRs suggested by Di Pasquale et al. (2005) are considered without utilizing its first defined DS. Thus, the DLRs used correspond to (a) 0.10 for DS1, (b) 0.35 for DS2, (c) 0.75 for DS3, and (d) 1.00 for DS4. Figure 10b depicts vulnerability relationship examples, obtained separately using the short- and long-duration ground-motion sets for an example SDoF system with an IMK model with PO-A-= 15:
Results and discussion
General trends
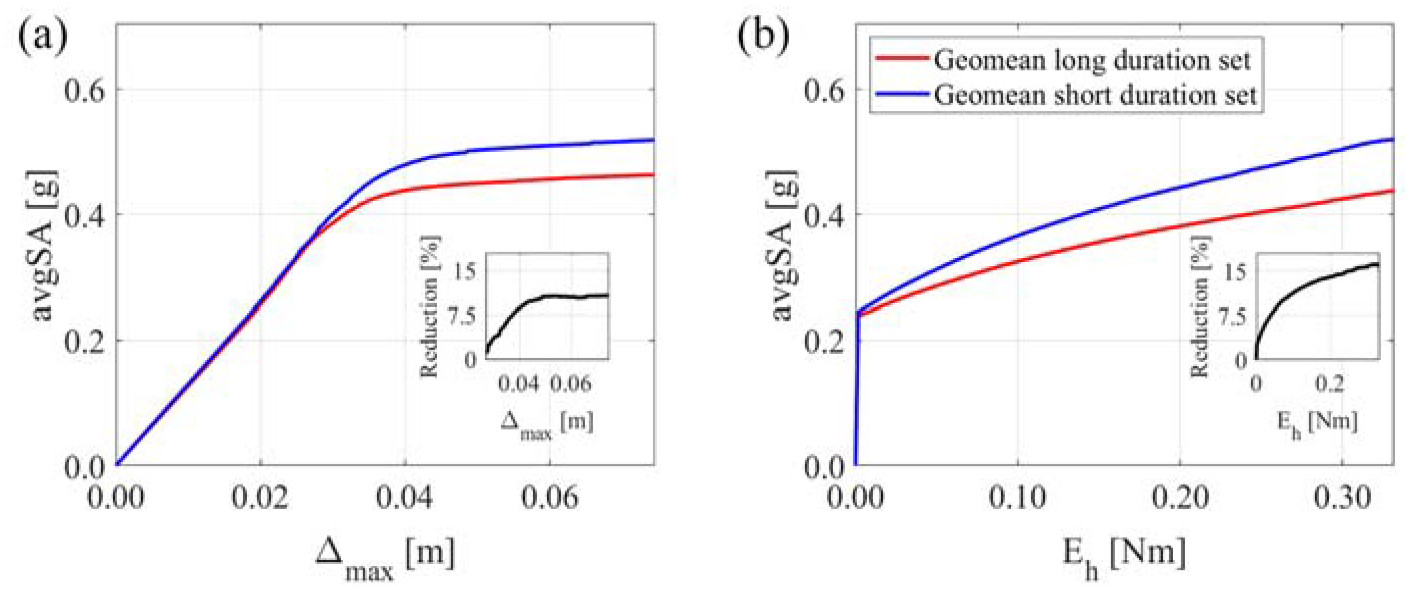
Figure 11a and b shows the geometric mean IDA curves for one example SDoF system with an IMK model with PO-A-= 15, in terms of both and . Such results allow a qualitative discussion that helps interpret the results for the entire case-study database. If is used as an EDP, the impact of duration on the IDA curve becomes apparent only after the system has reached its peak strength and begins to strain-soften, agreeing with the past literature (e.g. Bravo-Haro and Elghazouli, 2018; Chandramohan et al., 2016). Indeed, the results obtained using the long-duration ground-motion set show a collapse capacity about 10.0% smaller than that obtained using the short-duration set (Figure 11a), with the IDA curves starting to diverge after the peak-strength (i.e. ultimate) displacement. By using , the capacity reduction can be noticed immediately after the yielding point, with a maximum long-to-short capacity reduction equal to 15.8% (Figure 11b). From a qualitative perspective, this means that it is possible to observe decreases in the median structural capacity for any DS, leading to at least yielding, using cumulative-based demand parameters (e.g. Belejo et al., 2017). Clearly, cumulative-based EDPs allow explicitly capturing duration-related effects. However, no experimentally calibrated energy-based DS thresholds are available yet. Since this study adopted energy-based DS thresholds based only on numerical analyses, the results should be interpreted keeping in mind this assumption. It is worth noting that for systems with a nonzero residual strength in the backbone, the -based IDA curves never flatten, unlike -based ones. This is because depends on the input energy of the ground motion, which always increases while scaling the record. Evidently, must go to infinity as IM approaches collapse intensity, but unlike the horizontal asymptote of the IDA in terms of , an oblique asymptote is expected to occur.
Geometrical mean IDA curves for an SDoF system with an IMK model with PO-A-= 15: (a) in terms of , and (b) in terms of .
The results in this study confirm the effect of duration on collapse capacity, provided that the considered structure shows a cyclic and in-cycle deterioration of strength and stiffness. Moreover, the results show that a capacity reduction at DSs lower than collapse can be observed. This result is trivial if duration effects are accounted for explicitly (i.e. using and directly accounting for duration-induced cumulative damaging effects) since it derives from the definition of itself. In general, since sizes the energy dissipated by the system given the accumulated damage during a ground motion (which is directly affected by duration), it can better account for this phenomenon. In contrast, tends not to be sensitive to duration unless its influence is implicitly modeled through the selected nonlinear modeling strategy when accounting for cyclic and in-cycle strength and stiffness deterioration using the IMK model as done in this study and also reported in past literature (e.g. Iervolino et al., 2006). It is worth noting that short-duration ground motions can cause structural damage at relatively large intensities since they rely on large initial inelastic excursions to cause dynamic instability. In contrast, long-duration ground motions can cause structural damage at lower ground-motion intensities, since the relatively smaller initial inelastic excursions produced at these lower intensities may be gradually amplified due to cyclic deterioration of strength and stiffness until causing dynamic instability (i.e. collapse), as also already observed by Chandramohan et al. (2016) (among others). This reaffirms that cumulative-based EDPs can be better structural response indicators when dealing with long-duration ground motions or damage accumulation-related processes.
Hypothesis testing
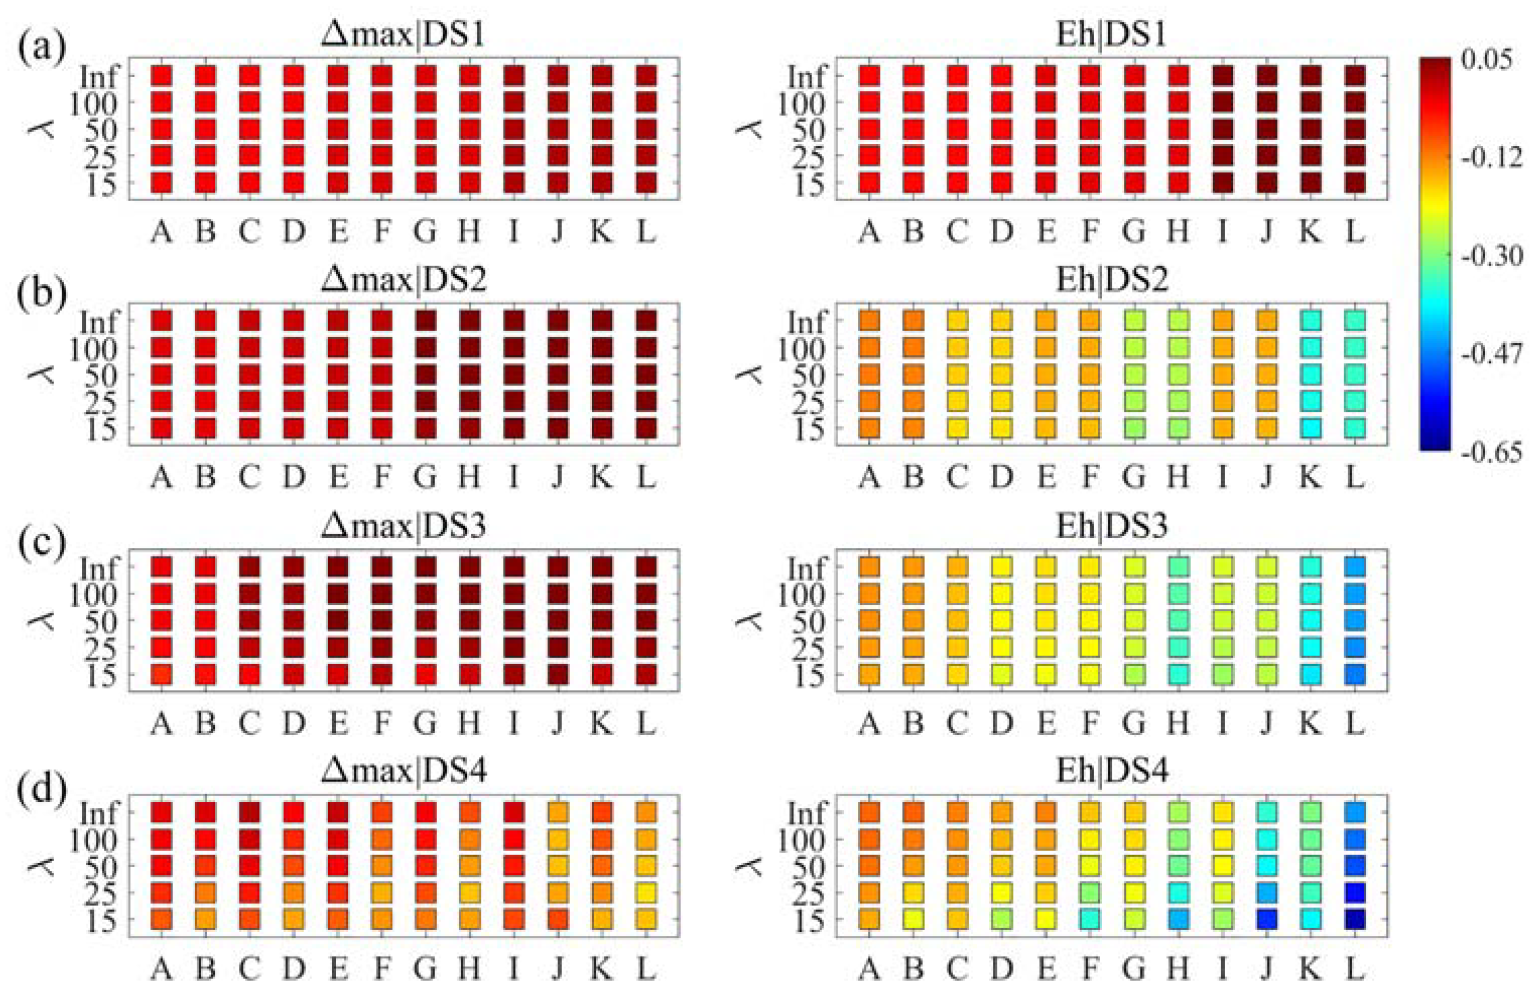
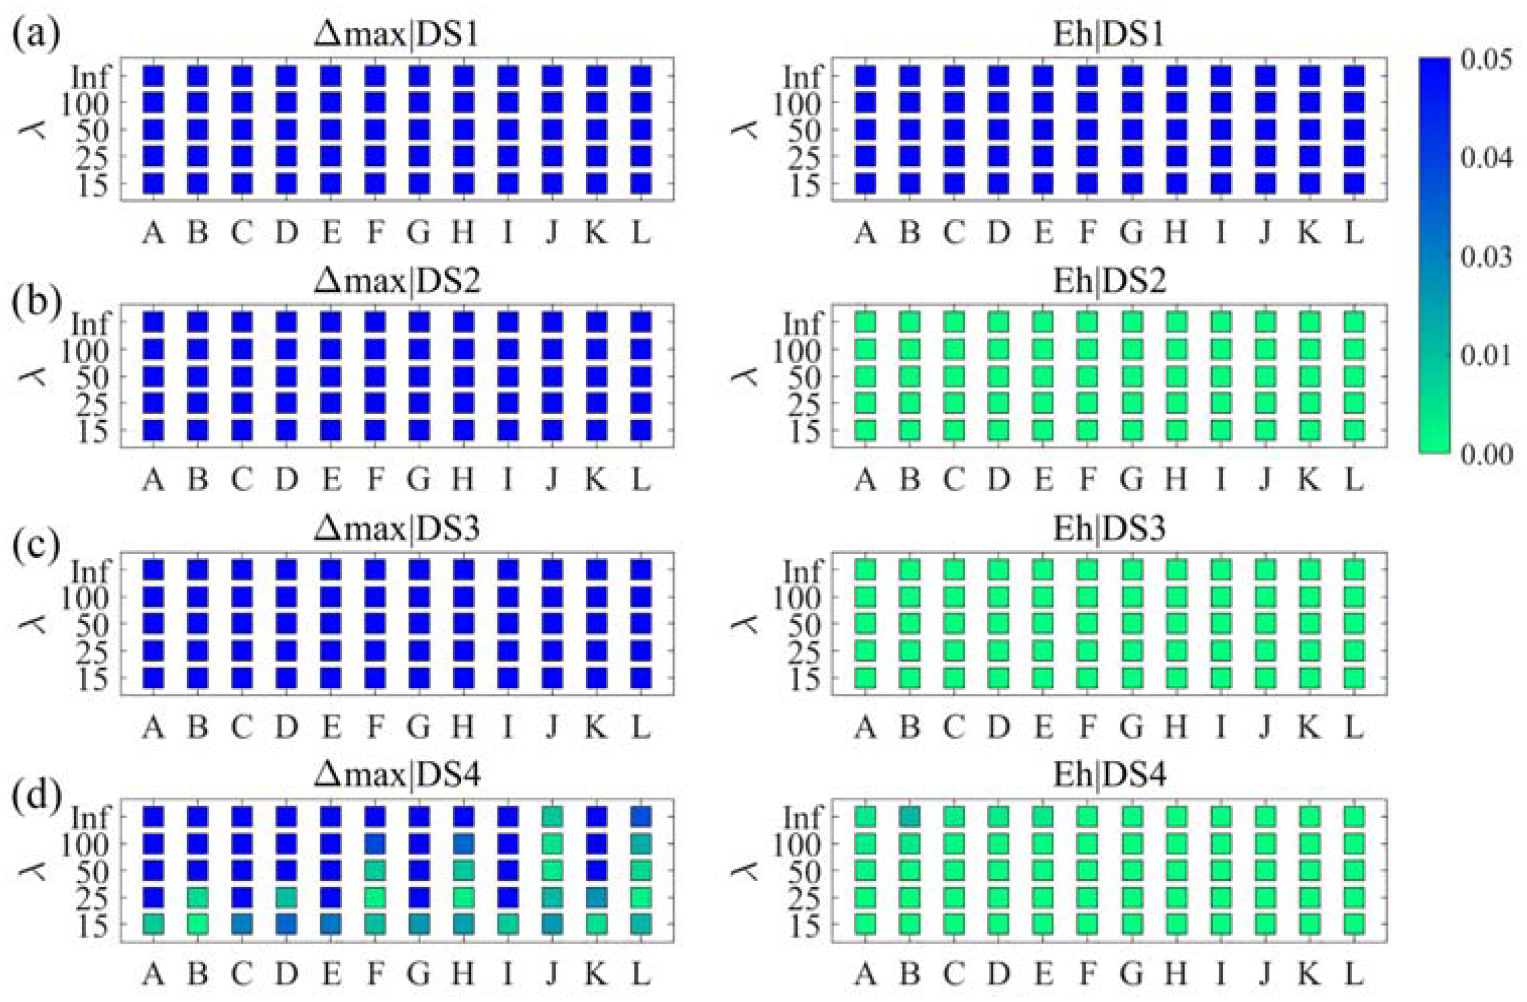
This section carefully revises the statistical significance of the differences between the median structural capacity obtained using the long- and short-duration sets. Figure 12a to d summarizes the computed values for the SDoF systems with an IMK model with PO hysteretic response (i.e. 60 systems), while Figure 13a to d summarizes the associated hypothesis testing results. Using as an EDP, there is no statistically significant reduction of the median capacity due to long-duration ground motions for DS1 (Figure 13a), DS2 (Figure 13b), and DS3 (Figure 13c), having coefficient values varying between [−0.03,0.02], [−0.02,0.06], and [−0.07,0.07], respectively. Although certain slopes seem to be significant, it is observed that the p-values are in the ranges [0.26,0.67], [0.14,0.98], and [0.07,0.97], respectively, for those DSs; hence, there is no robust evidence of duration impact on them. For some systems with small post-capping stiffness ratio and moderate-to-long periods (i.e. having high-displacement capacity up to collapse), especially those with highly deteriorating behavior, there is a statistically significant reduction in median structural capacity due to long-duration ground motions for DS4 (Figure 13d), with values between [−0.19,0.01]; the p-value range for the DS4 is [0.00,1.00]. Instead, when is used as an EDP, the median structural capacity reduction due to long-duration ground motions is statistically significant for all the systems and DSs except DS1, where no cyclic or in-cycle strength deterioration is expected. Furthermore, such capacity reduction is more significant than the one measured using . For this case, the values vary in the ranges [−0.04,0.05], [−0.39,−0.12], [−0.48,−0.14], and [−0.62,−0.11] with p-values being in the ranges [0.14,0.61], [0.00,0.00], [0.00,0.00], and [0.00,0.01], respectively, for DS1, DS2, DS3, and DS4. It is worth mentioning that the hypothesis testing results for the other analyzed hysteretic models (BI and PI) are analogous to those discussed in this section, with p-values in similar ranges; these are not shown for brevity. Overall, the results show that the difference between using one or another EDP is substantial. Thus, a careful EDP selection should be considered in practice depending on the analyzed structural system, confirming the recommendations presented in Hancock and Bommer (2006), but including other DSs apart from the collapse one.
values for SDoF systems with an IMK model with a PO hysteretic response. Results for (a) DS1, (b) DS2, (c) DS3, and (d) DS4.
Hypothesis test results for SDoF systems with an IMK model with a PO hysteretic response: Results for (a) DS1, (b) DS2, (c) DS3 and (d) DS4.
Apart from the adopted EDP, a higher reduction in structural capacity due to duration is especially exhibited by systems with first, a highly deteriorating behavior; second, a small post-capping stiffness ratio (i.e. with long post-capping displacement); and third, a long fundamental structural period (i.e. long pre-capping displacement). Hence, ground-motion duration is generally expected to be more apparent for deteriorating structures with large displacement capacity (particularly able to sustain large post-capping displacements), since these can dissipate more hysteretic energy (i.e. experience a higher number of inelastic cycles). The ductility capacity seems to be of lesser importance when assessing the potential duration effects on structural response; however, it is inferred that an increase in the ductility capacity will increase the impact of duration since it increases the pre-capping displacement capacity. Indeed, the importance of the pre-capping displacement capacity is much more apparent when using as an EDP because the impact of duration can be observed immediately after a system’s yielding displacement (recalling that when using as EDP, the impact of duration can be observed when a system is about to reach its ultimate displacement). Clearly, structures with lower displacement capacity could also be affected (especially those with high deterioration, such as systems with = 15 or = 25, although highly deteriorating structural systems may be uncommon at present); the difference relies on the fact that fewer inelastic excursions can cause extensive damage to those systems (i.e. duration effects can be less apparent due to the low damage accumulation potential). Specifically, in the case of expressing structural response in terms, the above behavior can just be observed for the DS4 agreeing with past studies (e.g. Bravo-Haro and Elghazouli, 2018; Chandramohan et al., 2016), and to a much lesser degree compared with the results obtained in terms. No statistically significant impact (nor a clear trend) can be noticed related to lower DSs, conversely to results obtained in terms also. Ground-motion duration effects are not appreciable for DS1 in general.
Structural capacity reduction
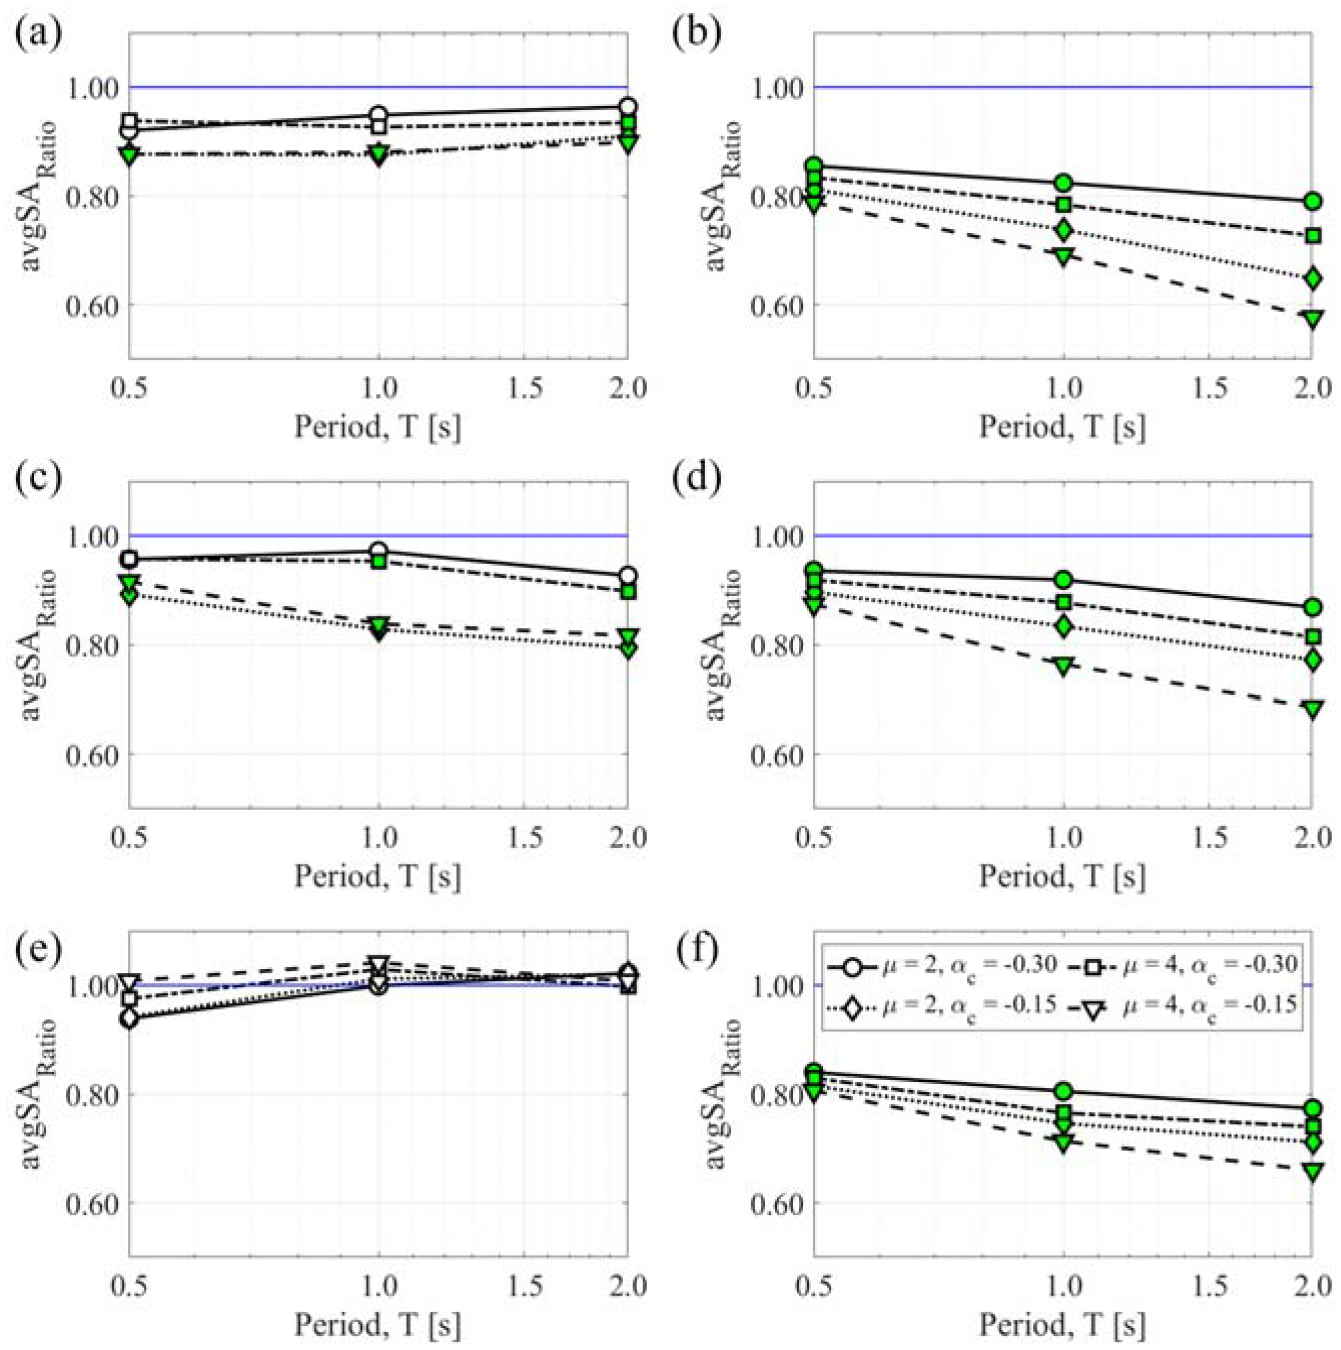
This section further discusses the median structural capacity reduction trends due to long-duration ground motions. Based on the results in the former section “Hypothesis testing,” DS4 is selected for the discussion since it allows considering the highest number of case studies with statistically significant results (i.e. both using and ). Nevertheless, the following discussion can be extrapolated to lower DSs when the structural response is expressed in terms. The long-to-short capacity ratio () is calculated by dividing the median structural capacity obtained using the long- and short-duration ground-motion sets, respectively. The above-defined capacity ratio for SDoF systems with an IMK model with PO, BI, and PI hysteretic responses with = 25 (green filled markers indicate statistically significant results as defined in section “Hypothesis testing”) is shown in Figure 14a to f. It is worth noting that the impact of duration is more pronounced when = 15 is utilized and lesser pronounced when = 50 is utilized—for instance, but the entire set of results is not displayed for brevity. Systems with = 25 present moderate-to-high deterioration given long-duration ground motions; thus, this case is of interest for the discussion presented herein, since this study already demonstrated that highly deteriorating systems are more prone to duration effects, with an increasing impact as decreases.
Long-to-short median collapse (DS4) capacity ratio for the SDoF systems (= 25) with an IMK model with: (a) PO response in terms, (b) PO response in terms, (c) BI response in terms, (d) BI response in terms, (e) PI response in terms, and (f) PI response in terms. Green markers represent statistically significant results. Backbone parameters are shown in Table 1.
For the SDoF systems using the IMK model with PO response, a not-negligible capacity reduction is observed if is adopted, particularly for systems with small . In terms of and , there are no substantial differences in the structural capacity when those parameters change. The observed varies between 87.5% and 96.4% (Figure 14a). This indicates that post-capping behavior is the most important feature when using , as expected. Hence, systems with large post-capping displacement capacities will be more prone to duration effects. There is no apparent impact of duration for systems with different pre-capping displacement capacities, confirming that by using peak-based EDPs, duration effects are of interest after a system surpasses its peak strength and starts to strain-soften, but not before. Interestingly, the potential impact of duration among the parameters is quite clear if is adopted, with ranging between 57.7% and 85.5% (Figure 14b). In this sense, if , , and especially increase, a clear (almost linear) decreasing trend in the capacity of the systems is noted. Therefore, it is confirmed that systems with a high-displacement capacity (through the entire range of structural behavior) that can dissipate high levels of , experience more severe capacity reductions due to long-duration ground motions.
For the SDoF systems using the IMK model with BI response, a different trend is noticed by using compared with the above case (i.e. PO). The impact of duration translated to capacity reductions is more noticeable for systems with small and large ; however, there are no significant differences in capacity by changing . The noted varies between 79.4% and 97.1% (Figure 14c). The absence of stiffness deterioration allows a system to dissipate a larger amount of hysteretic energy within the pre-capping behavior range, therefore, having a higher cyclic deterioration in such range. Since large values increase the pre-capping displacement capacity of the systems (given the backbone definition), it is inferred that this parameter is critical for systems with kinematic hardening. A large will exacerbate the above phenomenon (i.e. the cyclic deterioration); nevertheless, this parameter is of much lesser significance than . Therefore, the impact of duration can be more critical for systems with this type of hysteretic response (i.e. lacking stiffness deterioration). By using , a fast-decreasing trend in the capacity ratio is found for increasing , , and values; with ranging between 68.6% and 93.5% (Figure 14d). Similar behavior to systems with PO response is displayed, although lower capacity reductions are found.
The capacity ratios for SDoF systems using the IMK model with PI response contrast with the previous two cases (i.e. PO and BI). In the case of , most capacity ratios are slightly above one, except perhaps for the SDoF systems with low and short . The trend for this case interestingly seems to have higher capacity ratios as and increase, with varying between 94.2% and 104.1% (Figure 14e). These are not statistically significant even if capacity ratios are slightly higher than one. Concerning this, it is worth recalling that the considered cyclic deterioration depends directly on (Rahnama and Krawinkler, 1993); hence, for the same level, the system with PI response will exhibit very low cyclic deterioration and, therefore, the impact of duration is less apparent (i.e. negligible) in the peak structural response than the one observed in systems with a BI or PO response. By using , the ranges between 66.0% and 84.0% (Figure 14f), and a more evident trend is observed in contrast with the case. In general, this is because can properly capture the cumulative damage, as mentioned before for the other cases. It is worth noting that differences between the capacity ratios are smaller for this case. This is due to the discussion above concerning the amount of hysteretic energy dissipated by the structural systems.
The above results show how cumulative-based EDPs can explicitly capture ground-motion duration effects (i.e. directly from their definition). In contrast, even by using nonlinear modeling strategies that can capture strength and stiffness reduction and damage accumulation, peak-based EDPs could not properly capture the duration impact on the nonlinear structural response except for long-enough durations (usually much above = 30 s) for DS4 (associated with the collapse DS in this study) and for highly deteriorating systems (not following modern seismic design practice). In addition, there exists an impact of duration in other DSs if is used as EDP (such as DS2 and DS3). This is particularly evident for structural systems with small post-capping stiffness ratios (in absolute values), long fundamental structural periods, and large ductility capacities (i.e. systems capable of sustaining high-displacement damaging levels without collapsing).
Fragility and vulnerability relationships
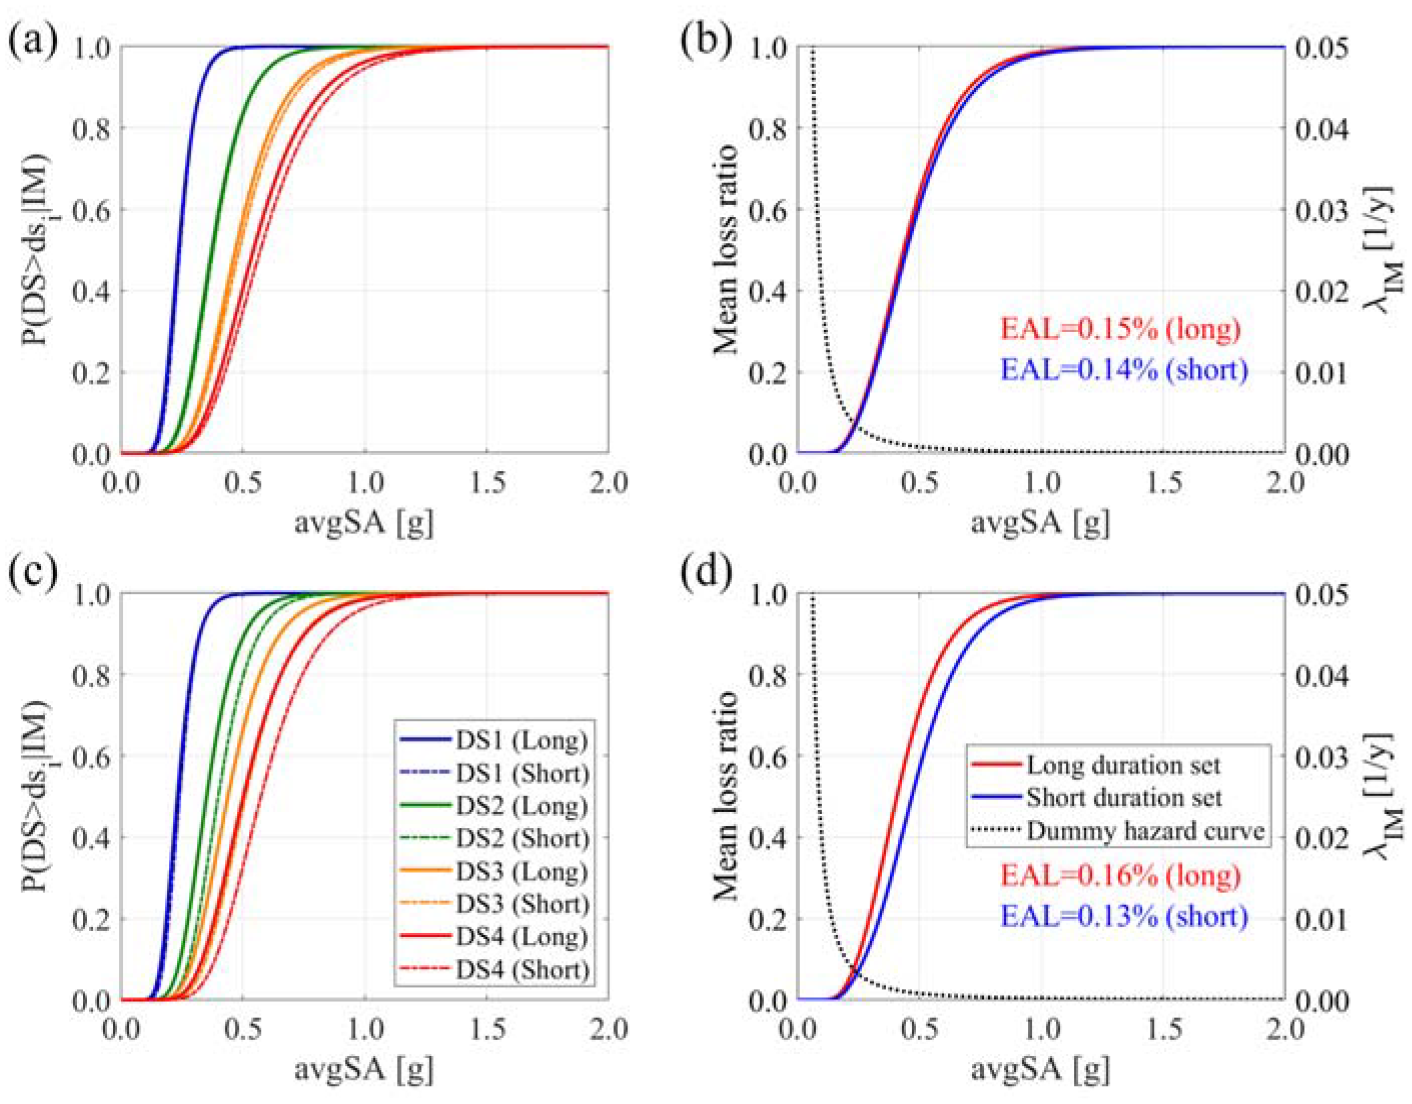
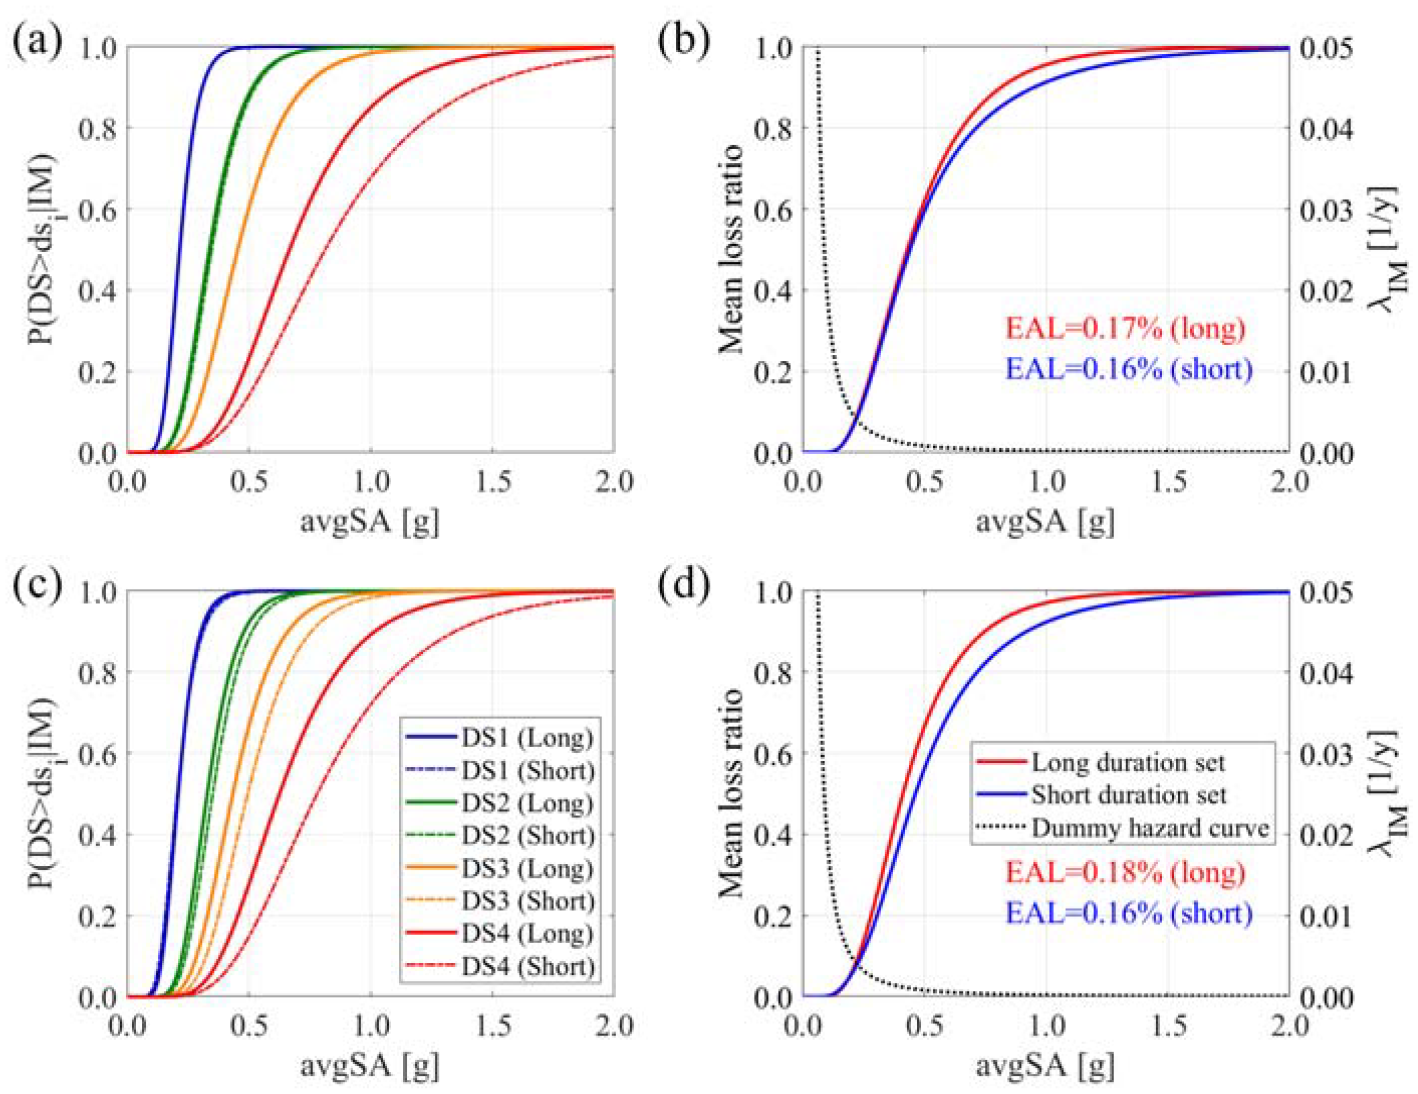
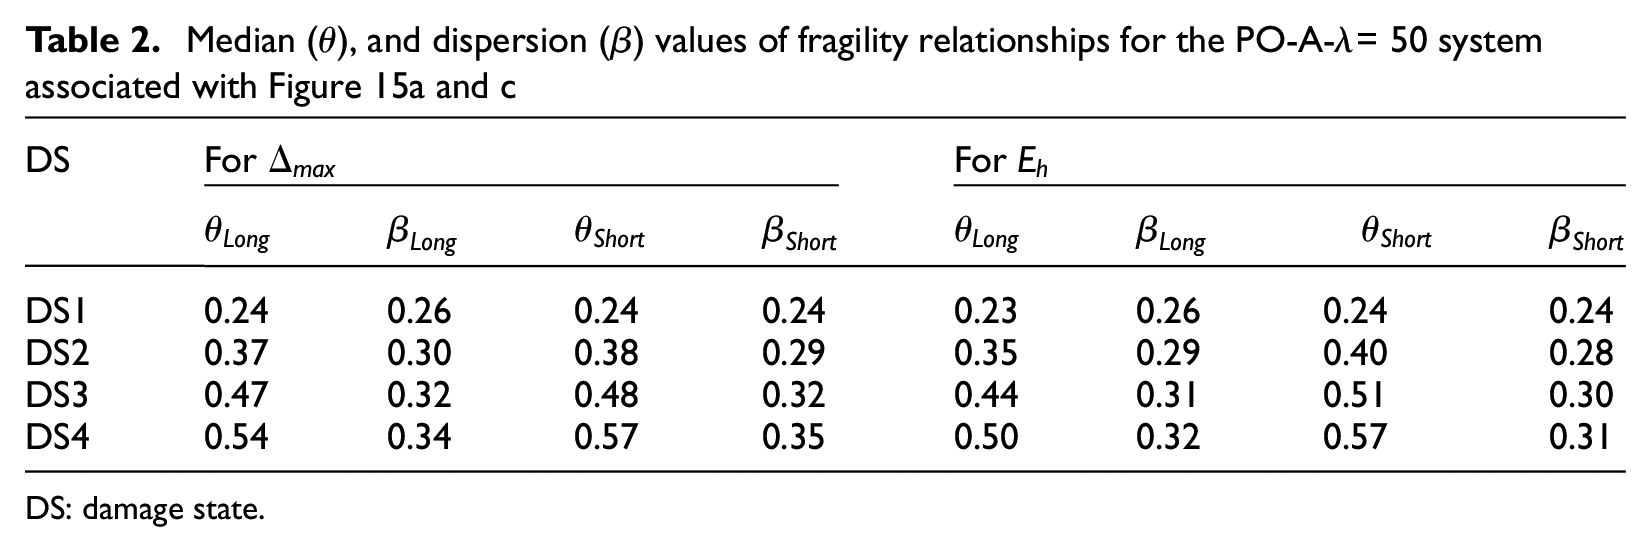
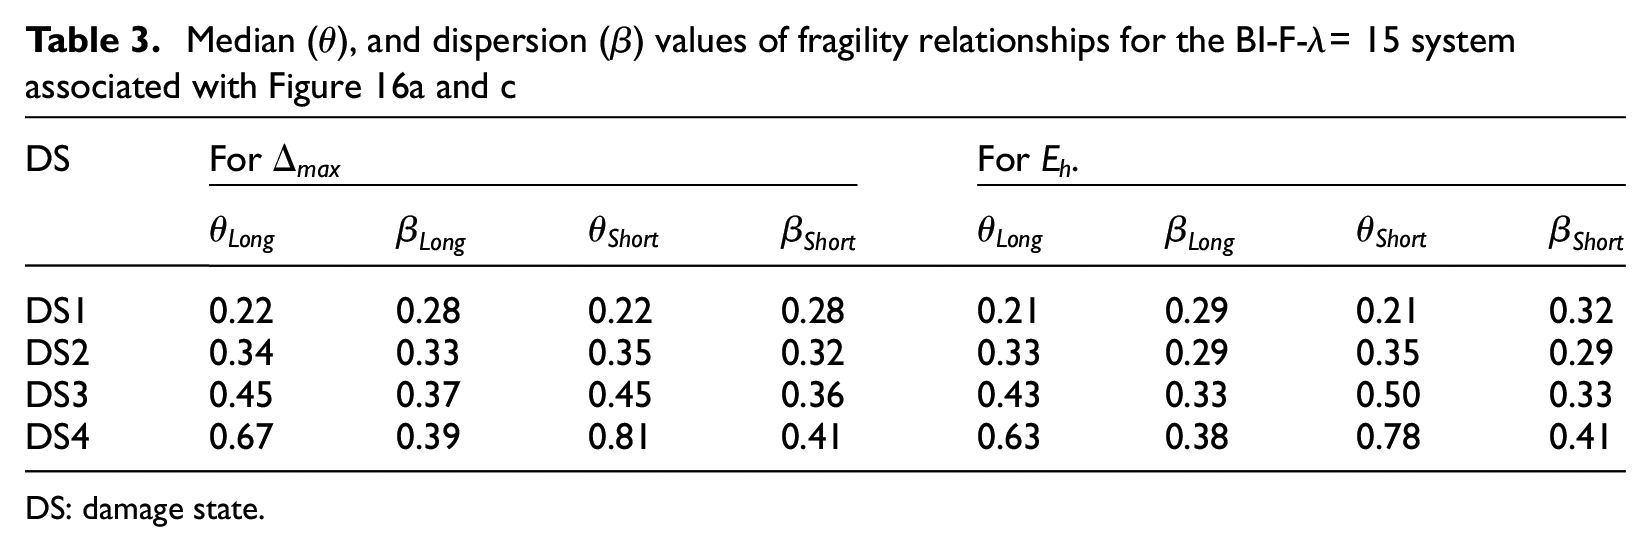
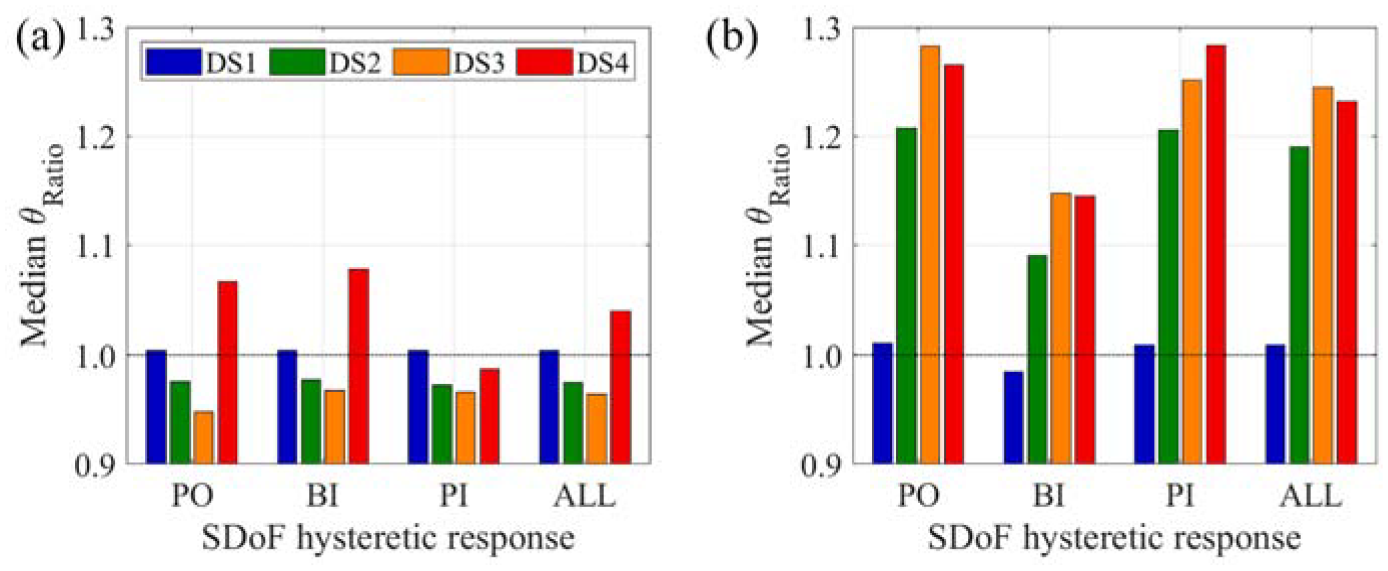
This section investigates ground-motion duration impact on direct losses by presenting a relative comparison using a single idealized synthetic (dummy) hazard curve. Fragility and vulnerability relationships are shown for two representative SDoF systems with PO-A-= 50 and BI-F-= 15 parameters shown in Figures 15a to d and 16a to d, respectively. The associated DS median and dispersion of the fragility relationships are reported in Tables 2 and 3. Specifically, the fragility relationships for the system with a PO-A-= 50 using as an EDP are shown in Figure 15a. It is confirmed that a slight decrease in the fragility median value is registered only for DS4. The fragility relationships using as an EDP are shown for the same system in Figure 15c. The reduction in the fragility median values for every DS (except DS1) is considerable. Therefore, the fragility relationships calculated using the long- and short-duration ground-motion sets show a relatively higher discrepancy when utilizing . The fragility relationships for the system with a BI-F-= 15 using as an EDP are shown in Figure 16a. The same behavior as the case with a PO-A-= 50 is observed. The fragility relationships using as an EDP are shown for the same system in Figure 16c. Higher discrepancies between the fragility relationships are noticed, because this system has a higher energy dissipation capacity. To provide a more generic view of the results, the median of the short-to-long fragility median value ratios () for each system with specific hysteretic response is provided in Figure 17a and b. All the results corroborate the previous observation that the considered systems are more vulnerable to long-duration ground motions. This is observed even for systems with low ductility capacity and is more apparent for systems with small post-capping stiffness ratios, moderate-to-long structural fundamental periods, and moderate-to-high deterioration. It is also worth recalling that the dispersion of the fragility relationships does not exhibit significant variations due to the impact of duration.
(a) Fragility, (b) vulnerability relationships in terms of ; (c) fragility, and (d) vulnerability relationships in terms of , using the long- and short ground-motion duration sets on an SDoF system with an IMK model with a PO-A-= 50.
(a) Fragility, (b) vulnerability relationships in terms of ; (c) fragility, and (d) vulnerability relationships in terms of , using the long- and short ground-motion duration sets on an SDoF system with an IMK model with a BI-F-= 15.
Median (), and dispersion () values of fragility relationships for the PO-A-= 50 system associated with Figure 15a and c
DS
For
For
DS1
0.24
0.26
0.24
0.24
0.23
0.26
0.24
0.24
DS2
0.37
0.30
0.38
0.29
0.35
0.29
0.40
0.28
DS3
0.47
0.32
0.48
0.32
0.44
0.31
0.51
0.30
DS4
0.54
0.34
0.57
0.35
0.50
0.32
0.57
0.31
DS: damage state.
Median (), and dispersion () values of fragility relationships for the BI-F-= 15 system associated with Figure 16a and c
DS
For
For .
DS1
0.22
0.28
0.22
0.28
0.21
0.29
0.21
0.32
DS2
0.34
0.33
0.35
0.32
0.33
0.29
0.35
0.29
DS3
0.45
0.37
0.45
0.36
0.43
0.33
0.50
0.33
DS4
0.67
0.39
0.81
0.41
0.63
0.38
0.78
0.41
DS: damage state.
Median of the short-to-long fragility median value ratios (i.e. median ), expressing structural response in (a) terms, and (b) terms.
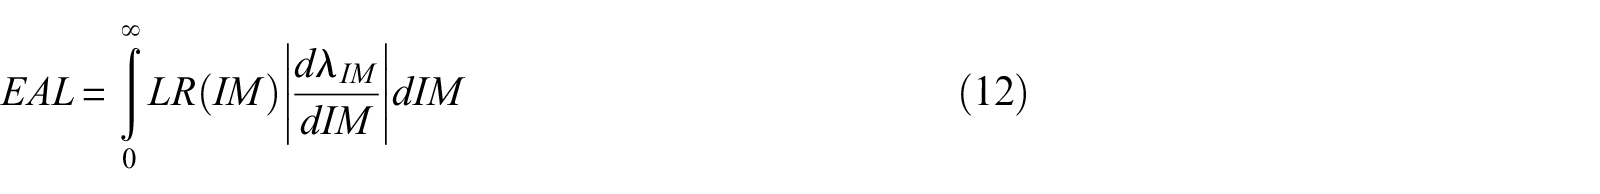
To provide a more straightforward comparison between vulnerability relationships calculated using the long- and short-duration ground-motion sets, the EAL for the considered systems is also calculated. The EAL is commonly used to estimate annual hazard insurance premiums (Mitchell-Wallace et al., 2017) or as a performance metric (e.g. Calvi et al., 2014; Consiglio dei Ministri, 2017; Gentile and Galasso, 2022) for various engineering applications (e.g. conceptual loss-based design; seismic retrofit selection/design). It is worth noting that EAL estimates are usually given in monetary terms (e.g. dollars); however, these are shown in LR terms within this study (i.e. the estimate is actually an EAL ratio). To estimate this metric, a dummy hazard curve described in Equation 11 is used (with = 0.0002 and = 2.0), generated as an idealized power-law curve. Such an equation provides the mean annual frequency of exceedance () of a given IM value (i.e. level). The exponent represents the steepness of the dummy hazard curve. The value of = 2.0 is used to represent typical shapes of spectral acceleration hazard curves observed in seismically active parts of the United States (Yun et al., 2002). The coefficient scales the overall ground-motion rate of occurrence. In this study, = 0.0002 is chosen to approximately match the Los Angeles hazard curve (Baker, 2015). The IM levels at a return period of 475 and 2475 years are equal to 0.30 and 0.70 g, respectively. It is worth stating that the considered dummy hazard curve is not conditioned on ; to effectively account for duration, seismic hazard should be computed in terms of a vector of IMs including both and (further considering their correlation). This issue is thoroughly addressed in Part II of this study.
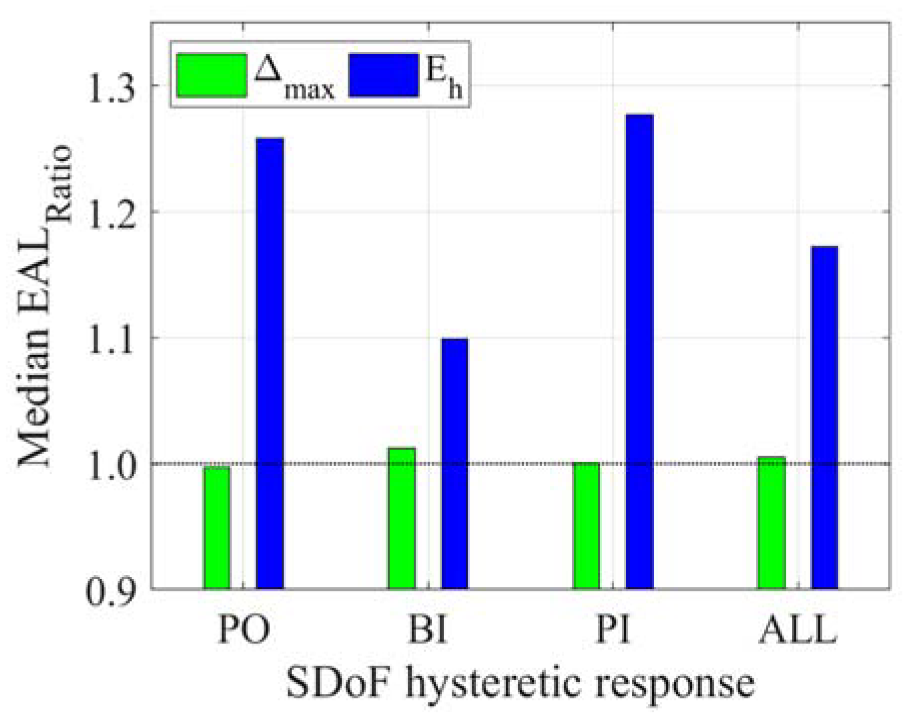
The EAL is estimated as the area under a given median loss curve (i.e. under the LR versus median curve). The EAL is calculated as the combination of the dummy hazard curve and the vulnerability curve per intensity level IM as in Equation 12. The long-to-short increase in EAL when is used are equal to 5.9% (Figure 15b) and 4.7% (Figure 16b) for the systems with PO-A-= 50 and BI-F-= 15, respectively. Such impact may be negligible for engineering purposes. However, when is considered, the above EAL increments are equal to 21.0% (Figure 15d) and 11.0% (Figure 16d) for the same case studies considered before. This indicates a potentially significant impact of duration on the loss estimation, with higher versus discrepancies for systems with higher cyclic deterioration. This result also holds for a system with low ductility capacity and short structural fundamental period. Another interesting aspect involves the apparent effect of duration on the computed EAL values, if is used to measure nonlinear structural performance. The fragility relationships in terms of usually show higher median values with respect to those expressed in terms of if short-duration ground motions are employed (vice versa for the long-duration sets). Clearly, this effect propagates to the EAL, which is reduced for short-duration conditions (and vice versa for long-duration sets). This behavior is also more extensively confirmed in Part II of this study. Of course, the results above are specific and cannot be generalized. To further examine the differences in the EAL, the attained median of the long-to-short EAL ratios () for each system with a specific hysteretic response is illustrated in Figure 18, providing a deeper confirmation of the above discussion in median terms. It is noticed that the EAL values under long-duration ground-motion records tend to be larger than the ones obtained under the companion short-duration ones (according to the computed ), agreeing with the specific results from the above-discussed case studies. Therefore, it is inferred that duration effects can also be significant when performing loss assessments (even by not explicitly considering the seismic hazard in terms of duration). Given the assumptions made, the previous point needs further verification; this can be addressed in further studies for building-portfolio applications, for instance (e.g. Otárola et al., 2022).
Median of the long-to-short EAL ratios (i.e. Median ), expressing structural response in terms and terms.
Conclusions
A comprehensive parametric study on the impact of ground-motion duration on the nonlinear structural performance of case-study SDoF systems using spectrally equivalent ground motions from shallow-crustal earthquake events is presented. It is shown that duration can effectively influence both nonlinear structural response and damage/loss, mainly for structures susceptible to cumulative effects (e.g. cyclic strength deterioration) and large displacement capacity (at capping and most important, at post-capping behavior range). This article (first of a two-part study) involves a parametric analysis involving short- and long-duration ground-motions sets. The companion paper involves a more-refined study based on realistic MDoF systems and robust site-specific, hazard-consistent scenarios.
The proposed methodology evaluates the impact of duration selecting spectrally matched long- and short-duration ground-motion records used to perform IDAs on 180 different SDoF systems comprising various dynamic parameters, hysteretic response rules, and strength deterioration models. The outcomes from these analyses are later used extensively to perform hypothesis testing on the differences in median structural capacity attained for the short- and long-duration ground-motion sets. Moreover, fragility and vulnerability relationships are derived to quantitatively assess ground-motion duration impact on different DSs and the various systems’ nonlinear structural performance in terms of EAL (estimated using a single synthetic hazard curve in a relative comparison).
If the maximum displacement () is used to define the DSs, the hypothesis testing results provide robust evidence that duration can be significant for the collapse DS (DS4) of highly deteriorating systems. The median structural-collapse capacity under short ground-motion sets can be up to 21% higher than for long-duration ones. This is in agreement with the previous literature. DS thresholds defined in terms of are derived based on the structure-specific, pseudo-parabolic relationship between and , therefore converting displacement-based DS thresholds into energy-based ones. This enables considering cumulative effects in the nonlinear structural performance explicitly. Conducting hypothesis testing on the -based median structural capacity shows that duration may affect all the DSs beyond yielding (DS1). In this case, the median structural-collapse capacity under short ground-motion sets can be up to 34.0% higher than for long-duration ones. Furthermore, significant long-versus-short differences for other DSs are noticed, which are not reported in the previous literature.
By propagation of such results, duration provides a negligible effect on all fragility median values except for the collapse DS (i.e. DS4), if is used. Furthermore, calculating vulnerability curves and the associated EAL, utilizing a single synthetic hazard curve, shows a relative increase of EAL maximum equal to 12.3% (long- vs short-duration ground-motion sets), which corresponds to the study cases with the highest strength deterioration. If the same exercise is conducted using as a measure of structural response, all the fragility relationships are impacted by duration except for the one associated with structural yielding (i.e. DS1). For this case, the highest long-to-short EAL relative discrepancy is equal to 37.2%. Such potential impact on direct loss estimates due to duration is also not reported in the previous literature.
Overall, ground-motion duration is found to provide a non-negligible impact on the nonlinear structural performance of SDoF systems. Robust evidence shows that introducing an energy-based DS-threshold definition (capable of considering cumulative effects) fundamentally increases the detrimental effects of duration, and it would most likely affect performance-based and seismic risk assessment applications involving these kinds of numerical models.
Footnotes
Acknowledgements
The authors thank the anonymous reviewers for their constructive feedback.
Declaration of conflicting interests
The author(s) declared no potential conflicts of interest with respect to the research, authorship, and/or publication of this article.
Funding
This research has been developed within the framework of the project “Dipartimenti di Eccellenza,” funded by the Italian Ministry of Education, University and Research at IUSS Pavia. Verisk–Extreme Event Solutions London office is gratefully acknowledged. Dr Roberto Gentile has received funding from the European Union’s Horizon 2020 research and innovation program under Grant Agreement No. 843794.
ORCID iDs
Kenneth Otárola
Roberto Gentile
References
1.
AljawhariKGentileRFreddiFGalassoC (2021) Effects of ground-motion sequences on fragility and vulnerability of case-study reinforced concrete frames. Bulletin of Earthquake Engineering19: 6329–6359.
2.
AmbraseysNNSarmaSK (1967) The response of earth dams to strong earthquakes. Geotechnique17(3): 181–213.
3.
American Society of Civil Engineers (2017) Seismic evaluation and retrofit of existing buildings. ASCE/SEI 41-17, USA.
BakerJW (2015) Efficient analytical fragility function fitting using dynamic structural analysis. Earthquake Spectra31(1): 579–599.
6.
BakerJWCornellCA (2006) Which spectral acceleration are you using?Earthquake Spectra22(2): 293–312.
7.
BarbosaARRibeiroFLANevesLAC (2017) Influence of earthquake ground-motion duration on damage estimation: Application to steel moment resisting frames. Earthquake Engineering & Structural Dynamics46(1): 27–49.
8.
BelejoABarbosaARBentoR (2017) Influence of ground motion duration on damage index-based fragility assessment of a plan-asymmetric non-ductile reinforced concrete building. Engineering Structures151: 682–703.
9.
Bojórquez MoraETerán GilmoreABojórquez MoraJRuiz GómezSE (2009) CONSIDERACIÓN EXPLÍCITA DEL DAÑO ACUMULADO EN EL DISEÑO SISMICO DE ESTRUCTURAS A TRAVÉS DE FACTORES DE REDUCCIÓN DE RESISTENCIA POR DUCTILIDAD. Revista de Ingeniería Sísmica80. Available at: https://www.scielo.org.mx/scielo.php?script=sci_arttext&pid=S0185-092X2009000100002 (accessed 10 February 2023).
10.
BradleyBA (2011) Correlation of significant duration with amplitude and cumulative intensity measures and its use in ground motion selection. Journal of Earthquake Engineering15(6): 809–832.
11.
Bravo-HaroMAElghazouliAY (2018) Influence of earthquake duration on the response of steel moment frames. Soil Dynamics and Earthquake Engineering115: 634–651.
12.
CalviGMSullivanTJWelchDP (2014) A seismic performance classification framework to provide increased seismic resilience. In: AnsalA (ed.) Perspectives on European Earthquake Engineering and Seismology. Geotechnical, Geological and Earthquake Engineering, vol. 34. Cham: Springer, pp. 361–400.
13.
ChandramohanRBakerJWDeierleinGG (2016) Quantifying the influence of ground motion duration on structural collapse capacity using spectrally equivalent records. Earthquake Spectra32(2): 927–950.
14.
ChengYLucchiniAMollaioliF (2015) Correlation of elastic input energy equivalent velocity spectral values. Earthquake and Structures8(5): 957–976.
15.
ChoiHKimJ (2009) Evaluation of seismic energy demand and its application on design of buckling-restrained braced frames. Structural Engineering and Mechanics31(1): 93–112.
16.
Consiglio dei Ministri (2017) Linee Guida per La Classificazione Del Rischio Sismico Delle Costruzioni. Allegato A Del Decreto Ministeriale 58, 28 Febbraio. Rome: Consiglio dei Ministri (in Italian).
17.
CornellCA (1997) Does duration really matter? In: FHWA/NCEER workshop on the national representation of seismic ground motion for new and existing highway facilities. Available at: https://trid.trb.org/view/487439 (accessed 10 February 2023).
18.
CosenzaEManfrediG (1997) The improvement of the seismic-resistant design for existing and new structures using damage concept. In: FajfarP (ed.) Seismic Design Methodologies for the Next Generation of Codes. London: Routledge, pp. 207–215.
19.
Di PasqualeGOrsiniGRomeoRW (2005) New developments in seismic risk assessment in Italy. Bulletin of Earthquake Engineering3(1): 101–128.
20.
EadsL (2013) Seismic collapse risk assessment of buildings: Effects of intensity measure selection and computational approach. PhD Thesis, Stanford University, USA.
21.
EadsLMirandaELignosDG (2015) Average spectral acceleration as an intensity measure for collapse risk assessment. Earthquake Engineering & Structural Dynamics44(12): 2057–2073.
ErberikASucuoǧluH (2004) Seismic energy dissipation in deteriorating systems through low-cycle fatigue. Earthquake Engineering & Structural Dynamics33(1): 49–67.
24.
FEMA (2009) Quantification of building seismic performance factors. FEMA P695, USA.
GentileRGalassoC (2022) Surrogate probabilistic seismic demand modelling of inelastic single-degree-of-freedom systems for efficient earthquake risk applications. Earthquake Engineering & Structural Dynamics51(2): 492–511.
28.
HancockJBommerJJ (2006) A state-of-knowledge review of the influence of strong-motion duration on structural damage. Earthquake Spectra22(3): 827–845.
29.
HaseltonCBBakerJWLielABDeierleinGG (2011) Accounting for ground-motion spectral shape characteristics in structural collapse assessment through an adjustment for epsilon. Journal of Structural Engineering137(3): 322–344.
30.
HuangCTarbaliKGalassoC (2020) Correlation properties of integral ground-motion intensity measures from Italian strong-motion records. Earthquake Engineering & Structural Dynamics49(15): 1581–1598.
31.
HwangSHMangalathuSJeonJS (2020) Quantifying the effects of long-duration earthquake ground motions on the financial losses of steel moment resisting frame buildings of varying design risk category. Earthquake Engineering & Structural Dynamics50: 1451–1468.
32.
IbarraLFMedinaRAKrawinklerH (2005) Hysteretic models that incorporate strength and stiffness deterioration. Earthquake Engineering & Structural Dynamics34(12): 1489–1511.
JarqueCMBeraAK (1987) A test for normality of observations and regression residuals. International Statistical Review/Revue Internationale de Statistique55(2): 163–172.
35.
KassGVMoodAMGraybillFABoesDC (1974) Introduction to the Theory of Statistics. 3rd ed.New York: McGraw-Hill.
36.
KohrangiMBazzurroPVamvatsikosDSpillaturaA (2017a) Conditional spectrum-based ground motion record selection using average spectral acceleration. Earthquake Engineering & Structural Dynamics46(10): 1667–1685.
37.
KohrangiMVamvatsikosDBazzurroP (2017b) Site dependence and record selection schemes for building fragility and regional loss assessment. Earthquake Engineering & Structural Dynamics46(10): 1625–1643.
38.
LignosDGKrawinklerH (2011) Deterioration modeling of steel components in support of collapse prediction of steel moment frames under earthquake loading. Journal of Structural Engineering137(11): 1291–1302.
39.
LucoNBazzurroP (2007) Does amplitude scaling of ground motion records result in biased nonlinear structural drift responses?Earthquake Engineering & Structural Dynamics36(13): 1813–1835.
40.
LucoNCornellCA (2007) Structure-specific scalar intensity measures for near-source and ordinary earthquake ground motions. Earthquake Spectra23(2): 357–392.
41.
MartinsLSilvaV (2021) Development of a fragility and vulnerability model for global seismic risk analyses. Bulletin of Earthquake Engineering19(15): 6719–6745.
42.
MazzoniSMcKennaFScottM (2006) Open system for earthquake engineering simulation (OpenSees). Pacific Earthquake Engineering Research (PEER) Center, University of California, Berkeley, Berkeley, CA.
43.
Mitchell-WallaceKJonesMHillierJFooteM (2017) Natural Catastrophe Risk Management and Modelling: A Practitioner’s Guide. Hoboken, NJ: Wiley-Blackwell.
NeterJKutnerMHNachtsheimCJWassermanW (1996) Applied Linear Statistical Models. Boston: McGraw-Hill, p. 1408.
46.
OtárolaKGentileRSousaLGalassoC (2022) Accounting for earthquake induced ground-motion duration in building-portfolio loss assessment. Earthquake Engineering & Structural Dynamics (in press).
47.
OtárolaKSousaLGentileRGalassoC (2023) Impact of earthquake-induced ground-motionÝuration on nonlinear structural performance. Part II: Site- and building-specific analysis. Earthquake Spectra (in press).
48.
PanYVenturaCETannertT (2020) Damage index fragility assessment of low-rise light-frame wood buildings under long duration subduction earthquakes. Structural Safety84: 101940.
49.
ParkYAngAH-S (1985) Mechanistic seismic damage model for reinforced concrete. Journal of Structural Engineering111(4): 722–739.
QuindePTerán-GilmoreAReinosoE (2021) Cumulative structural damage due to low cycle fatigue: An energy-based approximation. Journal of Earthquake Engineering25(12): 2474–2494.
52.
RaghunandanMLielAB (2013) Effect of ground motion duration on earthquake-induced structural collapse. Structural Safety41: 119–133.
53.
RahnamaMKrawinklerH (1993) Effects of soft soil and hysteresis model on seismic demands. Technical Report Series No. 108. The John A. Blume Earthquake Engineering Center. Available at: https://stacks.stanford.edu/file/druid:xr254mk7856/TR108_Rahnama.pdf (accessed 10 February 2023).
54.
RossettoTElnashaiA (2003) Derivation of vulnerability functions for European-type RC structures based on observational data. Engineering Structures25(10): 1241–1263.
55.
SarieddineMLinL (2013) Investigation correlations between strong-motion duration and structural damage. In: Proceedings of the 2013 structures congress: Bridging your passion with your profession. Available at: https://ascelibrary.org/doi/10.1061/9780784412848.255 (accessed 10 February 2023).
56.
ScribnerCFWightJK (1980) Strength decay in reinforced concrete members under load reversals. Journal of the Structural Division ASCE106(4): 861–875.
57.
Terán GilmoreA (2001) Consideraciones de uso de la energía plástica en el diseño sísmico. Revista de Ingeniería Sísmica65: 81–110.
58.
TrifunacMDBradyAG (1978) A study on the duration of strong earthquake ground motion. Bulletin of the Seismological Society of America65(3): 581–626.
59.
VallesREReinhornAMKunnathSKLiCMadanA (1996) IDARC 2D Version 4.0: a program for the inelastic damage analysis of buildings. National Center for Earthquake Engineering Research - State University of New York at Buffalo.
VamvatsikosDCornellCA (2006) Direct estimation of the seismic demand and capacity of oscillators with multi-linear static pushovers through IDA. Earthquake Engineering & Structural Dynamics35(9): 1097–1117.
62.
Villar-VegaMSilvaVCrowleyHYepesCTarqueNAcevedoABHubeMAGustavoCDMaríaHS (2017) Development of a fragility model for the residential building stock in South America. Earthquake Spectra33(2): 581–604.
63.
YunS-YHamburgerROCornellCAFoutchDA (2002) Seismic performance evaluation for steel moment frames. Journal of Structural Engineering128(4): 526–533.