
Abstract
This article explores several area-based tests of long-term seismic hazard forecasts for the Australian continent. Using the observed seismicity, ShakeMaps are calculated for earthquakes that are expected to have generated moderate-to-high levels of ground shaking within continental Australia in the past 50 years (January 1972 through December 2021). A “composite ShakeMap” is generated that extracts the maximum peak ground acceleration “observed” in this 50-year period for any site within the continent. The fractional exceedance area of this composite map is compared with four generations of Australian seismic hazard maps for a 10% probability of exceedance in 50 years (~1/500 annual exceedance probability) developed since 1990.
In general, all these models appear to forecast higher seismic hazard relative to the ground motions that are estimated to have occurred in the last 50 years, with the most recent hazard model yielding a fractional exceedance area most similar to the target 1/500 annual exceedance probability. The sensitivity of these results to various modeling assumptions was tested by exploring an alternative ground-motion characterization model that forecasts higher overall ground-shaking intensities. The sensitivity of these results is also tested with the interjection of a rare scenario earthquake with an expected regional recurrence of approximately 8700 years. While these area-based analyses do not provide a robust assessment of the performance of the candidate seismic hazard for any specific location given the limited independent data, they do provide—to the first order—a guide to the performance of the respective maps at a continental scale.
Introduction
Probabilistic seismic hazard assessment (PSHA) is the most common method to determine seismic demands for both national codes and standards, as well as for site-specific assessments for major infrastructure and other critical facilities. Map-based hazard forecasts, such as those produced for building codes, show the level of ground-shaking intensities that have a certain probability of being exceeded in a specific time period (e.g. 2% or 10% in 50 years). Put simply, if the forecast is correct, the mapped ground-motion intensities will be exceeded at the target exceedance rate—on average—over sufficiently long time periods.
Since 1990, four widely cited continental-scale hazard assessments have been developed for Australia, with the two most recent PSHAs being published in the last decade (Allen et al., 2020; Burbidge, 2012). Despite these latter two assessments being rigorously developed on modern computational platforms (Pagani et al., 2014; Robinson et al., 2005) using modern data and models, the 1990s-era seismic hazard map of McCue et al. (1993) continues to form the basis for the 2018 amendment to the Australian earthquake loading standard, the AS1170.4–2007 [R2018] (Standards Australia, 2018). This was largely because of concerns that these latter assessments would lead to some cities and regions being exposed to unacceptable risks at the 1/500 annual exceedance probability (AEP), given their low estimated hazard relative to the McCue et al. (1993) map (Australian Earthquake Engineering Society, 2021).
At a site-specific level, the PSHA framework defines seismic hazard as the ground-motion that has a given probability of being exceeded within a given time horizon. However, when considered over many sites (e.g. at continental scale), the PSHA framework equivalently defines that mapped hazard values will be exceeded—on average—at a given proportion of sites, as defined by the map’s probability of exceedance. For the Australian earthquake loading standard AS1170.4–2007 [R2018] (Standards Australia, 2018), this is defined as a 1/500 AEP. In general terms, a 1/500 AEP means that in any 50-year period, we should expect that, on average, 10% of the Australian continental landmass will experience ground shaking exceeding mapped hazard values (Allen et al., 2009; Vanneste et al., 2018; Ward, 1995). This assumes that independent earthquake occurrence and consequent ground shaking is approximately uncorrelated in time when considered over sufficiently large parts of Australia. Because the PSHA framework explicitly allows for the mapped hazard values to be exceeded by observations at a certain proportion of sites, it is expected that even moderate levels of ground shaking could exceed forecast hazard levels where mapped hazard is low (Hanks et al., 2012; Iervolino, 2022).
While we do not attempt to quantify it here, it is expected that this approach is most suitable over large spatial (i.e. continental) scales where the distances are sufficiently large that different earthquake sources may be treated independently, and that, in any 50-year window, the earthquake rate will be approximately constant. At smaller spatial scales, the seismicity rate—and by extension, the ground-motion exceedance rate—will be more variable and will be dependent on the earthquake cycle and any strain sharing between faults. To a first order, this effect has been observed in the historical New Zealand earthquake catalog, with decadal-scale periods of high activity, followed by longer periods of relative quiescence lasting more than half a century (Rollins et al., 2022).
Australia has a short historical record of seismicity relative to many regions globally and, in particular, relative to the return periods of large earthquakes on intraplate seismogenic faults (Clark et al., 2012). Nevertheless, empirical studies elsewhere in the world indicate that large and potentially damaging earthquakes are more likely to occur in areas where there have been prior small earthquakes (Kafka, 2002). That is, the assumption that past seismicity is the best predictor for future seismicity holds true. This seems to be a reasonable assumption in the eastern highlands of Australia, the Flinders Ranges within the Sprigg Orogen, and the northwest offshore extended continental crust (Figure 1) where seismicity has remained relatively stationary in space and time in the historical era (Griffin et al., 2017; Leonard, 2008). By contrast, many Quaternary fault scarps mapped in the Yilgarn Craton of Western Australia (Clark et al., 2012) appear to be uncorrelated with regions of high rates of contemporary seismicity. This suggests that the seismicity in the region may be transient and migratory (Leonard and Clark, 2011).
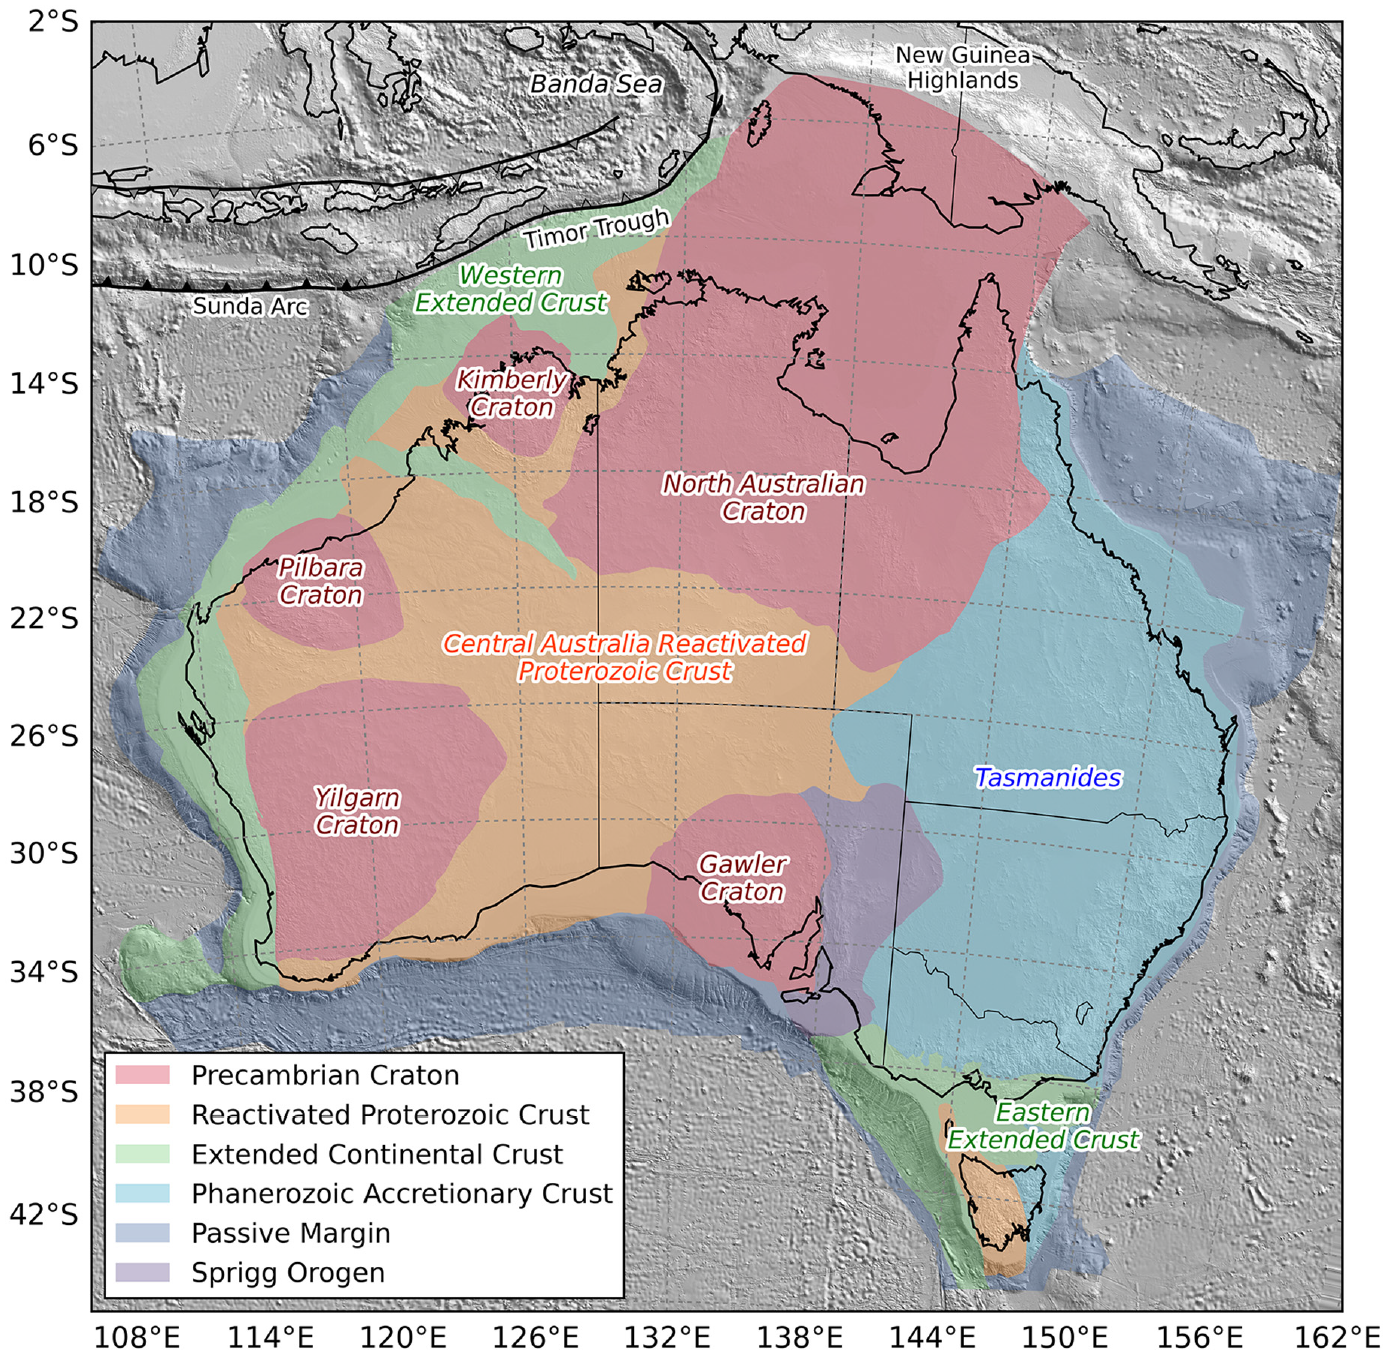
Simplified tectonic setting of Australia (Clark et al., 2012) relative to the collision of the Sunda–Banda Arc.
In this article, the ShakeMap software (Wald et al., 1999; Worden et al., 2017) is used to calculate the peak ground acceleration (PGA) shaking field for all earthquakes of MW 4.25 and larger within continental Australia and approximately 200 km of the coastline over the last 50 years (1972–2021). Ground-motion fields for large plate margin events (from eastern Java, Indonesia, to East New Britain, Papua New Guinea) of MW 6.45 and above are also estimated for the same period. These latter events account for earthquakes at Australia’s northern plate-boundary region that induce ground shaking within the continent and are commonly felt in northern Australia (Allen, 2022). A “composite ShakeMap” is developed that extracts the maximum modeled PGA at any given grid location within the onshore Australian continental landmass from all ShakeMaps. The proportional area of observed ground-motion exceedance (i.e. the fractional exceedance area) of this composite map is calculated relative to four generations of Australian seismic hazard maps for a 10% probability of exceedance in 50 years (approximately 1/500 AEP) developed since 1990, as required by AS1170.4–2007 [R2018] (Standards Australia, 2018). The results are intended to provide a guide as to the performance of the respective hazard maps at a continental scale. These results are considered in the context of their uncertainties in earthquake occurrence, ground-motion estimation, and limited independent data for testing.
Existing national hazard models
The AS1170.4–2007 [R2018] (Standards Australia, 2018) hazard design factors trace their lineage back to the PSHA of Gaull et al. (1990). This was a landmark study for its time and was developed based on scientific understandings and available data up to the late 1980s. The Gaull et al. (1990) probabilistic assessment was subsequently modified through a process of expert judgment (McCue, 1993) for inclusion in the then new design standard AS1170.4–1993 (McCue et al., 1993). This hazard map compiled in 1991 was not a probabilistic assessment, but reflected the collective understanding of earthquake occurrence and seismic hazard at the time and has guided engineering design in Australia since its publication. The McCue et al. (1993) hazard map also underpinned the Australian contribution to the 1999 Global Seismic Hazard Assessment Program (GSHAP; Giardini et al., 1999; McCue, 1999).
Since the development of the 1991 hazard map, national-scale seismic models have been developed to support various national and site-specific hazard assessments (Brown and Gibson, 2004; Hall et al., 2007). However, these models were not developed specifically with building codes in mind. In 2012, Geoscience Australia (GA) released the National Seismic Hazard Maps (NSHM12) that were intended to supersede the 1991 seismic design factors in the Standard (Burbidge, 2012; Leonard et al., 2013). This assessment used contemporary probabilistic methods, an improved characterization of tectonic region type and maximum earthquake magnitude (Clark et al., 2012; Leonard and Clark, 2011), and included Australian-specific ground-motion models (GMMs; Allen, 2012; Somerville et al., 2009). In addition, the earthquake catalog was augmented with an additional two decades of data (i.e. magnitudes and epicenters) relative to the 1991 assessments.
A further effort to update national-scale seismic hazard assessments was completed in 2018 (Allen et al.,2018b, 2020);. The National Seismic Hazard Assessment (NSHA18) built upon the NSHM12 by better exploring the epistemic uncertainties in seismic source characterization through the use of third-party source models and weighting these models using structured expert elicitation (Griffin et al., 2018, 2020). For the first time in Australia, a national fault-source model was employed (Clark et al., 2016), together with an earthquake catalog consistently expressed in terms of moment magnitude (Allen et al., 2018c). Neither the NSHM12 nor NSHA18 were accepted for use in the Standard owing to concerns that: the models were based on limited earthquake data from low-seismicity regions; and some cities and regions would be exposed to unacceptable risks assuming the modern assessments of seismic hazard at an AEP of 1/500 (Australian Earthquake Engineering Society, 2021).
An additional study by Lam et al. (2016) recommended that a uniform PGA hazard of 0.07 g for a 1/475 AEP is applicable for stable continental regions (SCRs). This study assessed the rate of magnitude 5.0 earthquakes in SCRs worldwide to determine an average PGA threshold that may be applied for building codes and standards in regions of low seismicity (Looi et al., 2018).
A comparison of the Gaull et al. (1990), GSHAP (McCue, 1999), NSHM12 (Burbidge, 2012; Leonard et al., 2013), and NSHA18 (Allen et al., 2018b, 2020) mean PGA hazard maps with a 10% probability of exceedance in 50 years using a consistent color palette is shown in Figure 2. These four maps are assessed in terms of their fractional (area-based) ground-motion exceedance from earthquakes in the past 50 years. In addition, the uniform hazard model of Lam et al. (2016) is also evaluated in terms of its area-based exceedance rate.
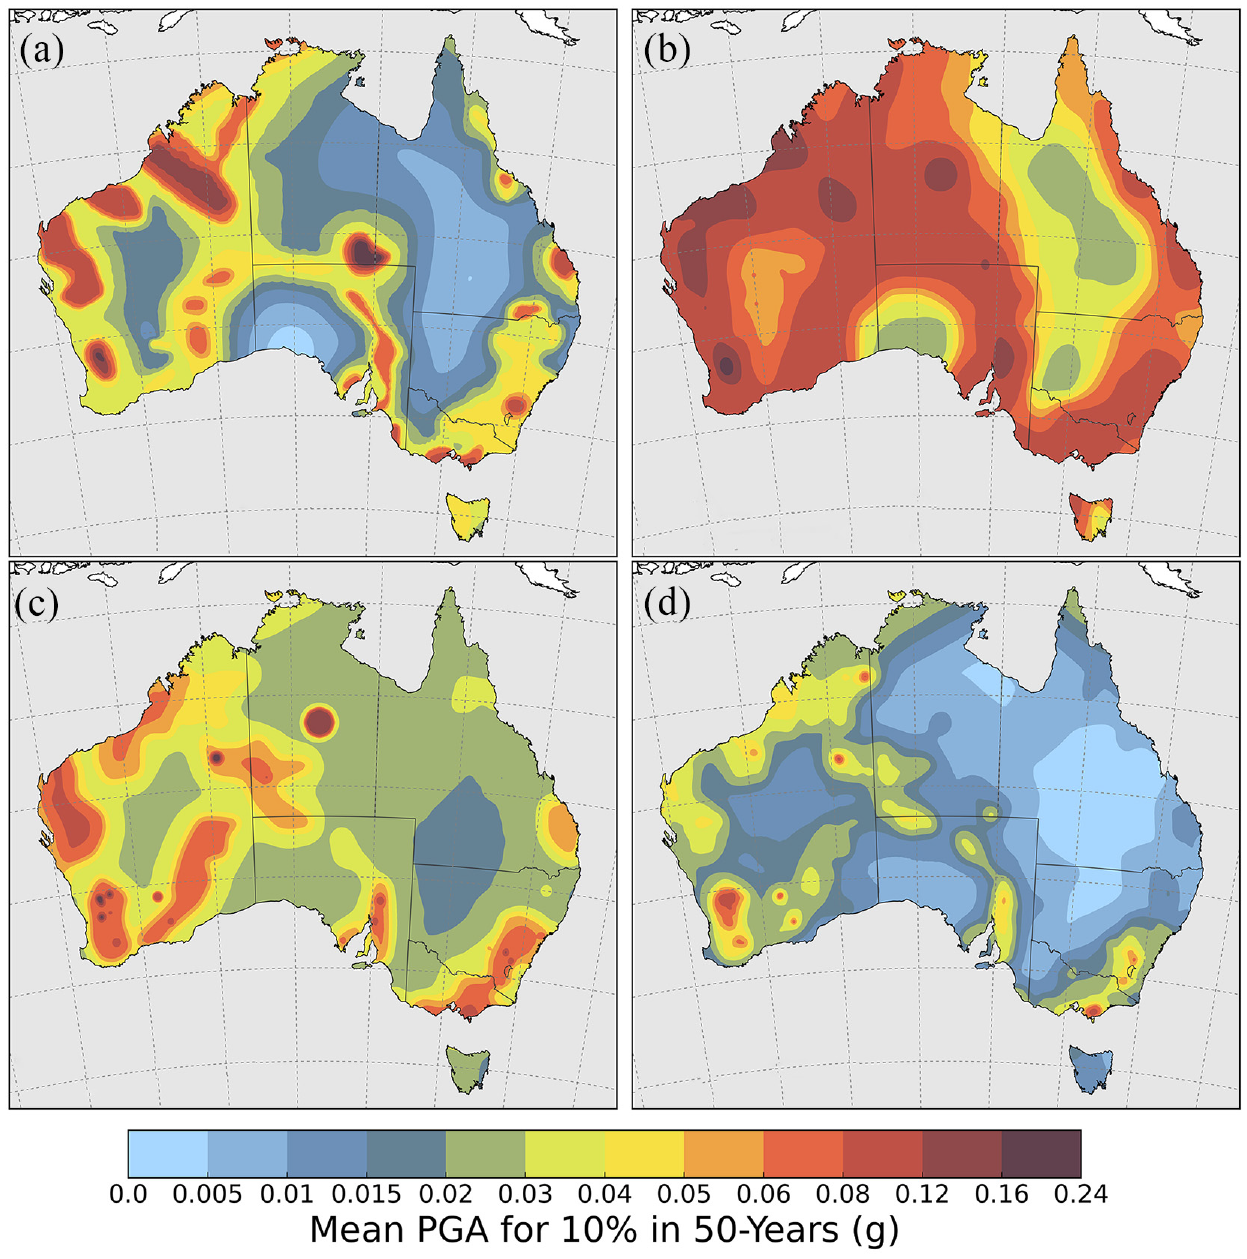
Comparison of four generations of seismic hazard maps showing mean PGA for a 10% probability of exceedance in 50 years. Maps include (a) Gaull et al. (1990), (b) the GSHAP (McCue, 1999), (c) the NSHM12 (Burbidge, 2012; Leonard et al., 2013), and (d) the NSHA18 (Allen et al., 2018b) models.
The maps in Figure 2 generally all show the same pattern of seismic hazard, but with the absolute values being quite different between the models. It is interesting to note that the NSHA18 is most consistent with the earliest model investigated (Gaull et al., 1990). However, the average level of hazard increased markedly from the Gaull et al. (1990) assessment to the McCue et al. (1993) assessment. As noted above, the contours of the latter map were based on expert opinion, and it is believed that a number of conservative assumptions at the time of the development of this map led to the hazard increase. The decrease in hazard from the NSHM12 to the NSHA18 is due to the latter model’s use of a catalog uniformly expressed in terms of MW, which first decreases catalog magnitudes for moderate-sized events and second, increases the Gutenberg–Richter b-value due to the non-linear relationship between ML and MW (Allen et al., 2020). A possible explanation for similarity of Gaull et al. (1990) and the NSHA18 models is that each were internally consistent with the magnitude type used for both the source-rate model and ground-motion characterization model. For example, the Gaull et al. (1990) hazard model used local magnitude to characterize both the source rate and GMMs, whereas, the NSHA18 used moment magnitude as is recommended for modern PSHAs (International Atomic Energy Agency, 2022).
While the spatially uniform hazard model of Lam et al. (2016) is not mapped in Figure 2, it is represented by significantly higher hazard than the NSHA18, for example. The authors believe this is due to several conservative assumptions related to estimating the rate of earthquakes. For example, the mean rate of MW 5.0 earthquakes per unit area was rounded, and then doubled as a conservative measure to account for uncertainty in earthquake occurrence. In contrast, the NSHA18 first corrected the magnitudes of historical earthquakes to account for the use of Californian local magnitude formulae (Allen, 2021) and then used the mean earthquake rate (with some uncertainty) to estimate the source-rate model. Lam et al. (2016) also assumed a b-value that is lower than that estimated through the NSHA18 (Allen et al., 2018b). The consequence of this is that the Lam et al. (2016) model would forecast more frequent large-magnitude earthquakes.
Method
ShakeMaps from the observed seismicity in the past 50 years (1972–2021) are calculated using the USGS’ ShakeMap software (Wald et al., 1999; Worden et al., 2017) for all earthquakes of MW 4.25 and greater within approximately 200 km of the Australian coastline. In addition, large MW 6.45 and greater earthquakes occurring in Australia’s northern plate margin region are included given they are frequently felt in northern Australia. In total, ShakeMaps are calculated for 252 Australian earthquakes together with 249 plate boundary events (Figure 3). Earthquake source parameters for Australian continental events were derived from the NSHA18 earthquake catalog with magnitudes uniformly expressed in moment magnitude (Allen et al., 2018c), augmented with recent events from Geoscience Australia’s National Earthquake Alerts Centre (NEAC; https://earthquakes.ga.gov.au/). Earthquake sources for the plate-margin events were taken from Version 8 of the International Seismological Centre-Global Earthquake Model’s (ISC-GEM’s) Global Instrumental Earthquake Catalogue (Storchak et al., 2015), again, augmented with recent events from the NEAC’s online catalog.
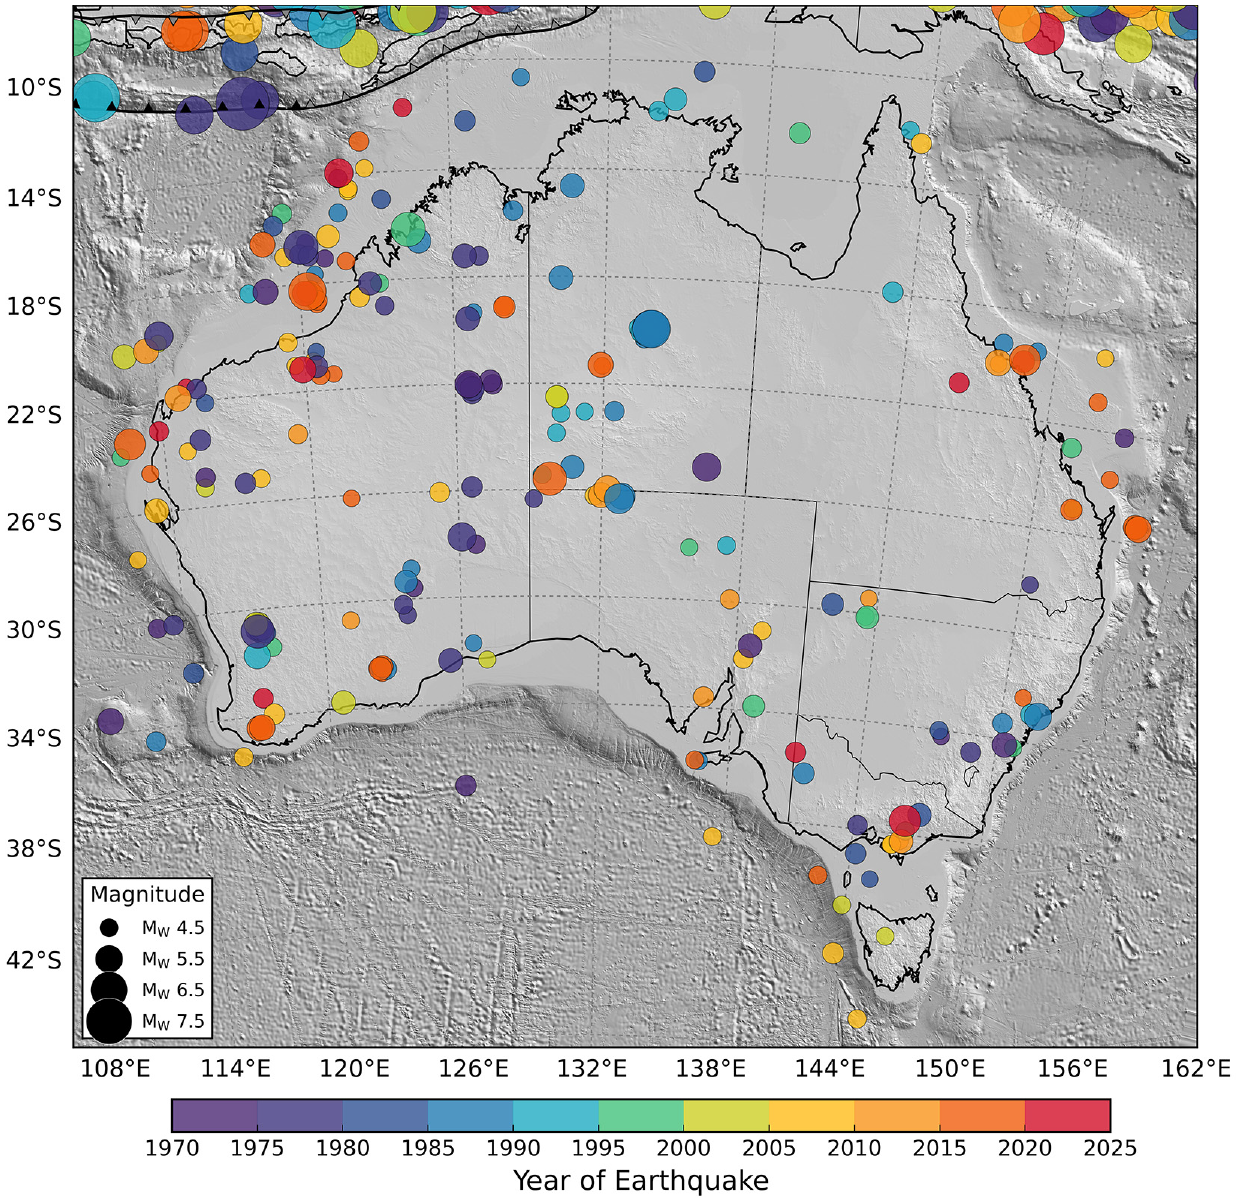
Map showing Australian continental earthquake epicenters for which event-specific ShakeMaps are calculated to compile the composite ShakeMap. Epicenters are color-coded by the year of the earthquake. Northern plate-boundary events contributing to this study are truncated from this map. The list of earthquakes contributing to this analysis is available in the online supplementary material.
Neither catalog was declustered of dependent events, meaning that the shaking distributions of aftershocks are considered in these analyses. While this might appear to make these analyses more conservative, the influence of aftershocks on the overall PGA maxima is considered to be negligible because the mainshock intensities will nearly always exceed those of the aftershocks. Furthermore, studies have generally concluded that aftershocks have lower stress drops than mainshocks and by definition, lower short-period ground motions (Allen et al., 2006; Baltay and Hanks, 2013; Wooddell and Abrahamson, 2014). Consequently, there is an even lower likelihood that short-period ground motions from real-world aftershocks will exceed that of the mainshock. These statements assume that aftershocks are defined as events that re-rupture the mainshock rupture plane and occur within a time window appropriate for aftershocks to occur (Abrahamson et al., 2014; Wooddell and Abrahamson, 2014). The authors consider nearby events, off the mainshock rupture plane, that occur on unfractured or healed fault asperities to be “triggered” events rather than aftershocks. As highlighted by some authors, these triggered events can contribute significantly to seismic hazard (Marzocchi and Taroni, 2014) and should be considered in analyses such as those undertaken herein.
For six surface-rupturing earthquakes occurring in this time period (King et al., 2019), mapped finite-source ruptures were used to estimate distance to rupture for the ground-shaking fields. For events without mapped fault ruptures, a point source with the preferred longitude, latitude, and depth was applied. For these events, an equivalent finite-source distance metric was estimated internally within the ShakeMap software assuming the approach of Thompson and Worden (2018).
For Australian continental events, the mean PGA ground-shaking field was calculated using four of the highest weighted GMMs from the non-cratonic tectonic region type as selected from the NSHA18 expert elicitation (Griffin et al., 2018), including Atkinson and Boore (2006), Somerville et al. (2009) non-cratonic, Allen (2012) and Boore et al. (2014) at equal weighting. These are the same models currently being applied in Geoscience Australia’s real-time ShakeMap system (Allen et al., 2019). While the selection of GMMs for the NSHA18 was based on a structured expert elicitation (Griffin et al., 2018), the GMM logic tree can be simplified to improve model performance for real-time applications, with only minor variations to the mean ground-motion fields relative to those applied in the NSHA18. One of the main changes to the NSHA18 GMM logic tree is the use of the Somerville et al. (2009) non-cratonic model for Archean and Proterozoic cratons (Figure 1). While chosen in the expert elicitation, it was recognized by the core NSHA18 team that the Somerville et al. (2009) GMM developed for the Yilgarn Craton systematically overestimates short-period ground motions (Ghasemi and Allen, 2018). This has been observed through subsequent studies for shallow earthquakes in the Yilgarn Craton (e.g. Miller et al., 2023).
A new GMM was recently developed for ground motions that propagate through the low-attenuation North Australian Craton (Figure 1) from earthquakes occurring in Australia’s offshore plate margin regions (Allen, 2022). While only developed using earthquakes from the Banda Sea region, this model is thought to be more regionally applicable than any other published model given the unique tectonic setting of the region (Allen, 2022).
Macroseismic intensity data exist for many historical earthquakes in Australia (Everingham et al., 1982; McCue, 1996; Rynn et al., 1987) that, when combined with a national-scale site condition map (McPherson, 2017), could be used to ground-truth the ShakeMaps. However, there are no available Australian datasets that correlate instrumental strong-motion intensity measures to macroseismic intensity scales. This is largely due to both a sparse monitoring network and sparse population density. As a consequence, the authors cannot confidently recommend the use of any macroseismic intensity to PGA conversions that could be used for this purpose. Furthermore, this would invalidate the intended purpose of assessing the respective hazard maps, which represent a ground-motion with a given chance of being exceeded on a uniform site condition.
A uniform site condition with a time-averaged shear-wave velocity in the upper 30 m (VS30) of 760 m/s—consistent with site class Be in the AS1170.4–2007 [R2018] (Standards Australia, 2018) and that used by the NSHM12 and NSHA18—is applied to all ShakeMaps. The McCue et al. (1993) map assumed “average ground conditions” (McCue, 1993), but is applied in the AS1170.4–2007 [R2018] as site class Be, or “rock.” The Gaull et al. (1990) assessment does not specify the reference site condition for which it was defined.
A composite ShakeMap is compiled where the maximum PGA observed across a regular 0.05° grid was generated from the combined event-specific maps. The fractional exceedance area of the composite ShakeMap relative to the four generations of national hazard models (with a 10% probability of exceedance in 50 years) is calculated. The same calculation is performed for the uniform hazard model of Lam et al. (2016). In this study, there is an expectation that the latest models should yield a fractional exceedance area closest to the 10% target given their advantage of using the most complete datasets and scientific knowledge.
Results
The fractional area of exceedance for the respective hazard models are presented in three subsections. First, an assessment of ground-motion exceedance is provided relative to the composite for the historical catalog, 1972–2021 (Figure 4a). This first analysis uses GMMs preferred for use for Australian crustal conditions (Allen et al., 2019). Second, an alternative composite map is produced using the mean next-generation attenuation (NGA)-East GMM (Goulet et al., 2017, 2021)—developed for Central and Eastern North America (CENA)—with a 0.50 weight, and maintains the four preferred GMMs at a weight of 0.125 each (Table 1; Figure 4b). The latter GMM logic tree represents a more conservative scenario given the propensity of these CENA GMMs to overestimate short-period ground motions for Australian earthquakes (Ghasemi and Allen, 2018; Hoult et al., 2021a; Miller et al., 2023), particularly in the far-field (Allen and Atkinson, 2007). In the third example, a rare scenario earthquake is supplemented with the Australian GMM composite ShakeMap. This is to assess the sensitivity of the area-based exceedances in the event of a rare, but plausible earthquake that could occur by chance in the observation window. A MW 6.9 earthquake is modeled on the Eden-Burnside fault (https://neotectonics.ga.gov.au/feature/442931), near the city of Adelaide in South Australia, and this is added to the composite map of historical events to explore changes in the national-scale exceedances.
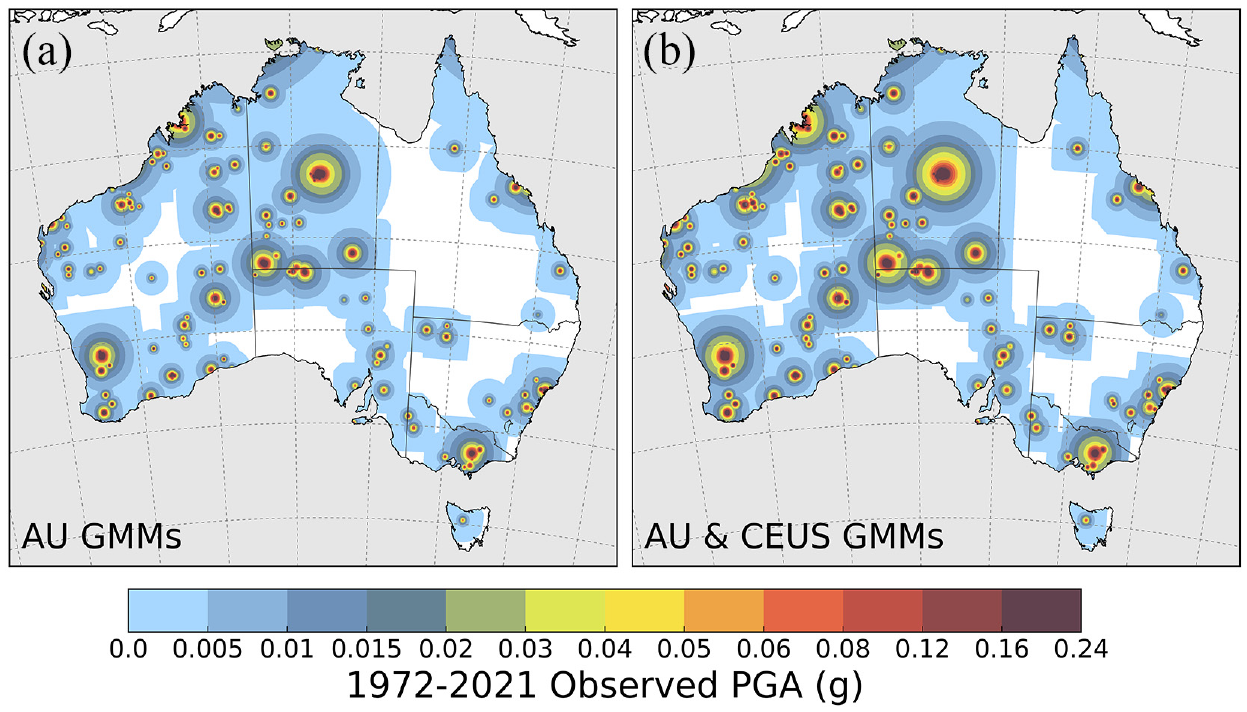
Composite ShakeMaps showing the PGA “observed” from 252 Australian earthquakes of MW ≥ 4.25 and 249 plate margin earthquakes of MW ≥ 6.45 from 1972 to 2021. Ground shaking for earthquakes within the Australian continental crust either use (a) preferred Australian GMMs or (b) weighted CENA and preferred Australian GMMs (see Table 1). Plate margin earthquakes use the GMM of Allen (2022) in each case.
Ground-motion models and weights preferred for use for Australian (AU) crustal conditions and for the case of the combined Australian and CENA GMMs
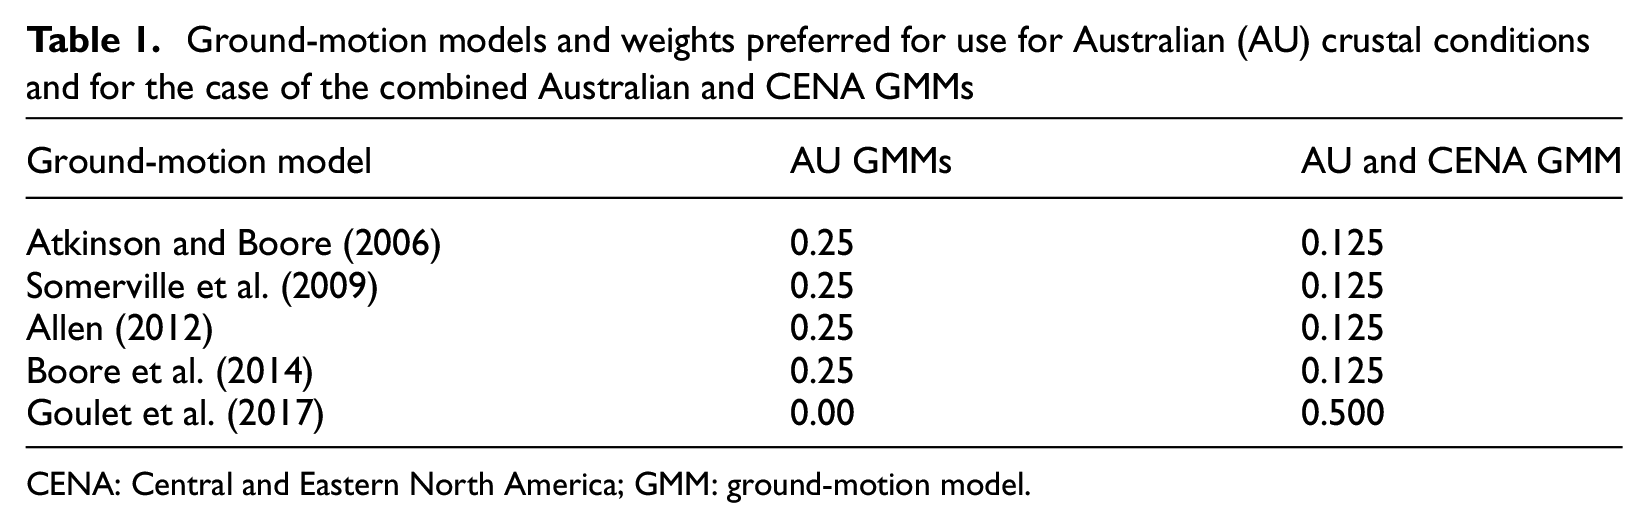
CENA: Central and Eastern North America; GMM: ground-motion model.
Hazard forecasts compared with historical events
Figure 4a shows the composite ShakeMap with the maximum “observed” PGA—based on GMMs currently preferred for use in Australia (AU GMMs)—from earthquakes of MW ≥ 4.25 for the 50-year period from 1972 through 2021. Figure 4b will be discussed in the “Sensitivity to Ground-Motion Model Selection.”
Ratios of the composite ShakeMap relative to mapped 10% in 50-year PGA values for the Gaull et al. (1990), GSHAP, NSHM12, and NSHA18 models are shown in Figure 5. For all candidate hazard maps, it can be observed that the areas exceeding the mapped hazard values are generally quite small for most events and are localized at an earthquake’s epicenter. The one exception to this observation is the exceedance levels observed for the 1988 Tennant Creek earthquake sequence in central Australia (Jones et al., 1991), particularly for the Gaull et al. (1990) and NSHA18 models. For Gaull et al. (1990) model, the model-building process had been undertaken prior to the occurrence of the Tennant Creek earthquakes. Therefore, this model reflected the sparse historical seismicity of the central Australian region prior to January 1988. Further discussion on the extent of the ground-motion exceedance for the Tennant Creek region in the NSHA18 model, given its use of a longer earthquake record, is provided in the Discussion section.
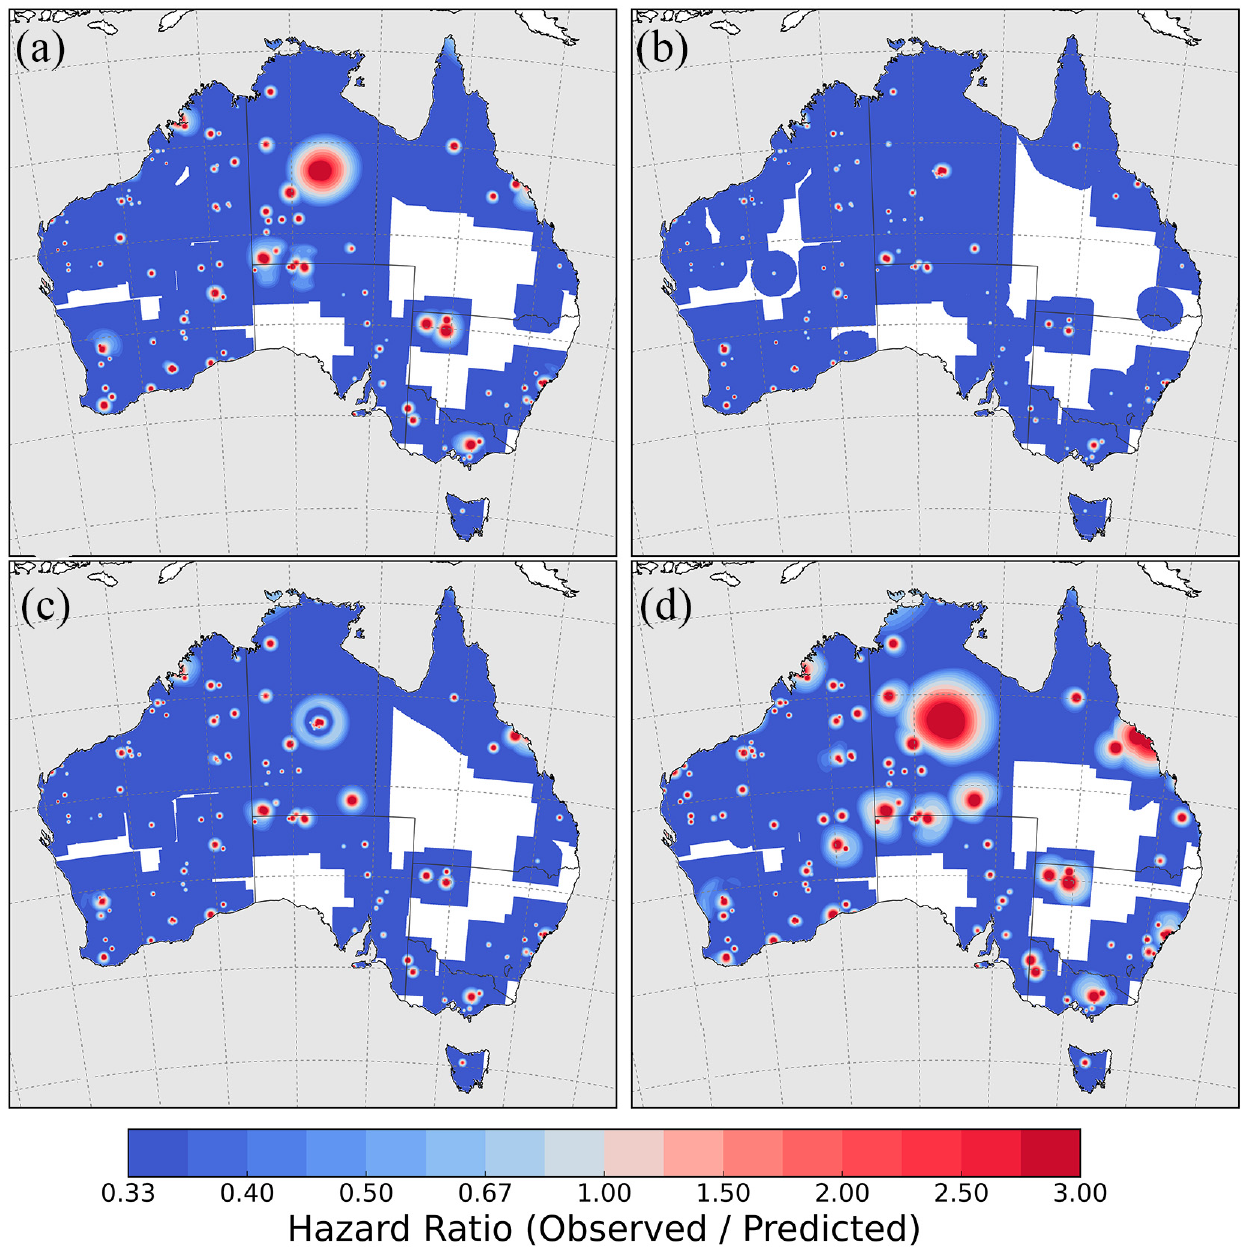
Ratios of the 1972–2021 composite ShakeMap to the estimated seismic hazard PGA for a 10% probability of exceedance in 50 years. Ratio maps relative to the Australian-preferred GMM suite are plotted for (a) Gaull et al. (1990), (b) the GSHAP (McCue, 1999), (c) the NSHM12 (Burbidge, 2012; Leonard et al., 2013), and (d) the NSHA18 (Allen et al., 2018b) models. Values greater than 1.0 show where the composite ShakeMap exceeds the respective hazard maps. The color palette is truncated between ratios of 1/3 and 3.0; however, for this purpose, the degree of the exceedance greater than 1.0 is of no consequence.
The fractional area of the Australian landmass, which exceeds the mapped 10% in 50-year PGA values for each of the candidate models, including the uniform 0.07 g recommended by Lam et al. (2016), is provided in Table 2. The number of years’ forecast that the hazard model represents is also provided in Table 2. In this context, the years’ forecast represents the duration from the end of the catalog used to construct each hazard model, through to the end of the period for which the ShakeMaps have been produced (e.g. December 2021). In general, all models are conservative relative to the maximum “observed” ground motions that are estimated to have occurred in the last 50 years. Fractional exceedances are found to be significantly lower than the expected 10% target rate for most models, particularly the GSHAP, NSHM12, and Lam et al. (2016) hazard forecasts. There are likely to be several reasons for these lower exceedance rates, which can be traced back to conservative decisions made during the model-building process. Some of these are discussed in the Existing National Hazard Models section. The Gaull et al. (1990) and NSHA18 models appear to provide the greatest skill in forecasting the 10% exceedance rates on a national scale. However, they would both still be considered as conservative estimates of hazard forecasts given the past 50-year snapshot of national earthquake occurrence. The other models considered appear to be overly conservative with fractional exceedances less than 2% of the continental landmass. These analyses assume that the past 50 years of seismicity will be representative of the future earthquake rates in any 50-year window. It is very difficult to test this hypothesis and the confidence of the statistics with a limited and incomplete historical catalog prior to the period assessed herein (e.g. 1972–2021). Furthermore, any statistical testing using multiple stochastic earthquake catalogs would need to, a priori, assume that the source-rate model for one of the existing hazard models is the true model, such as the modeling undertaken by Vanneste et al. (2018).
Fractional area of landmass that exceeds the target 10% in 50-year PGA values for different event and ground-motion model combinations for events from January 1972 through December 2021
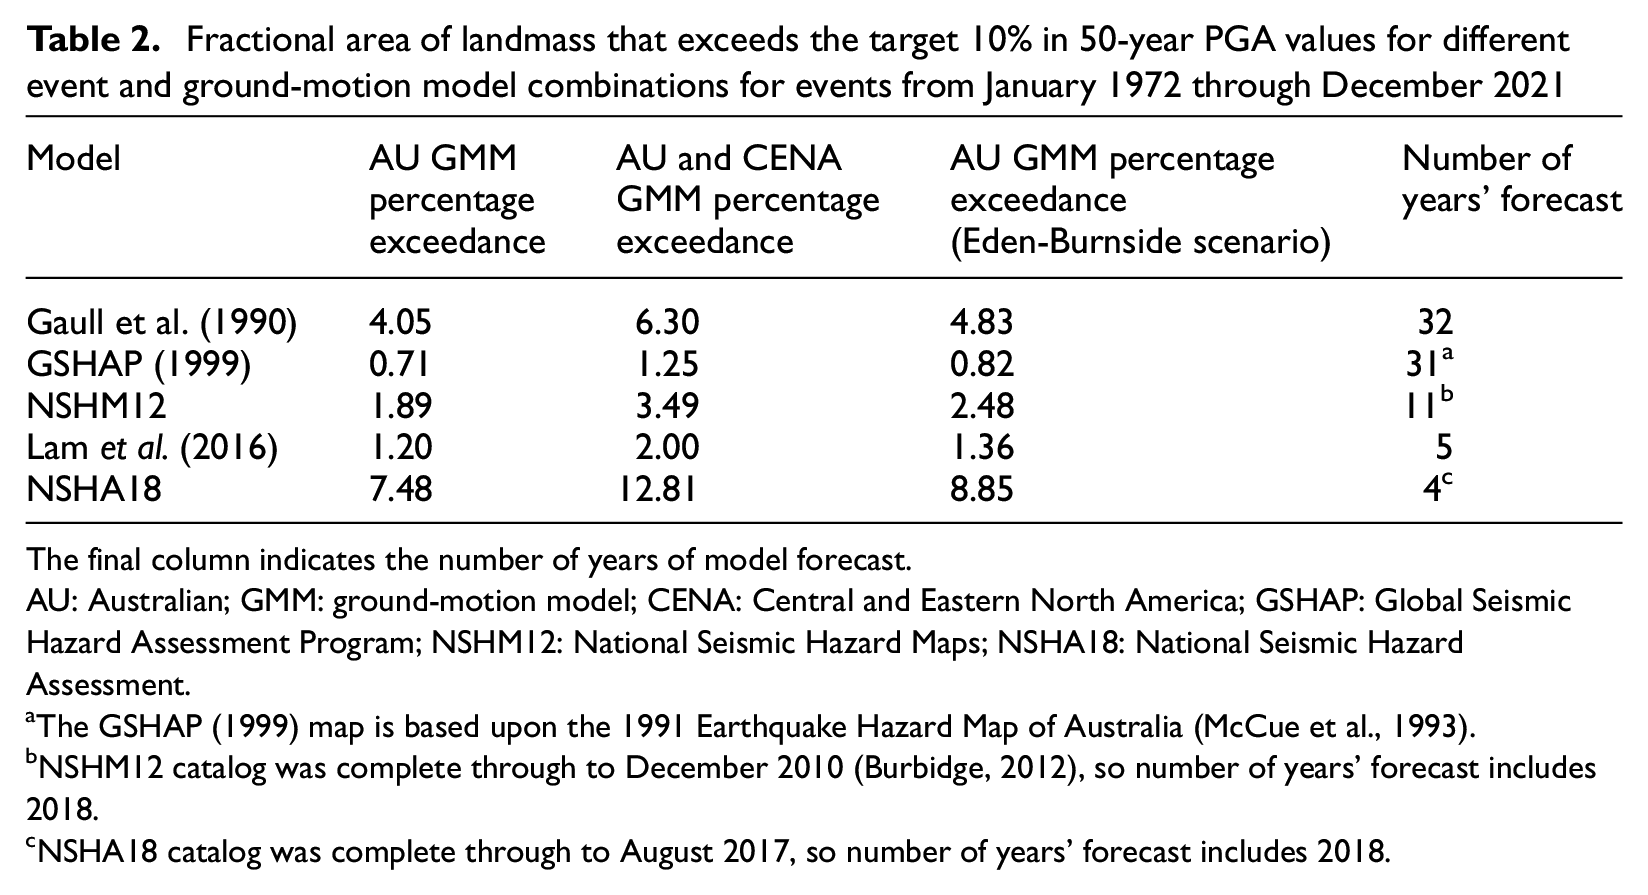
The final column indicates the number of years of model forecast.
AU: Australian; GMM: ground-motion model; CENA: Central and Eastern North America; GSHAP: Global Seismic Hazard Assessment Program; NSHM12: National Seismic Hazard Maps; NSHA18: National Seismic Hazard Assessment.
The GSHAP (1999) map is based upon the 1991 Earthquake Hazard Map of Australia (McCue et al., 1993).
NSHM12 catalog was complete through to December 2010 (Burbidge, 2012), so number of years’ forecast includes 2018.
NSHA18 catalog was complete through to August 2017, so number of years’ forecast includes 2018.
It is expected that the NSHA18 should yield the exceedance rate closest to the 10% target in these analyses given it has the advantage of using the most complete datasets and scientific knowledge of earthquake hazards in Australia, together with a similar suite of GMMs to that in Table 1.
Sensitivity to GMM selection
To explore the sensitivity in the results from the preceding section, the mean NGA-East GMM (Goulet et al., 2017, 2021) is substituted into the GMM logic tree with a 50% weighting. Figure 4b shows the composite ShakeMap using the alternative GMM set. What is clearly observed is the lower rate of attenuation from an earthquake’s epicenter, and consequent higher ground motions. Table 2 provides the fractional area of exceedance for the five 10% in 50-year hazard models. Using these GMMs, the exceedance rate is about a factor of about 1.5–2.0 relative to that of the GMMs preferred for use in Australia.
Previous studies show that the CENA typically demonstrates lower attenuation and larger far-field ground motions relative to observational data from Australia (Allen and Atkinson, 2007; Bakun and McGarr, 2002; Hoult et al., 2021a). Consequently, the example shown here would represent a more conservative scenario in terms of ground-motion exceedances. However, assuming an unbiased earthquake rate model, it shows the sensitivity of hazard results to the selected GMMs in regions where relatively few near-source ground-motion recordings exist from moderate-to-large events from which to select and rank GMMs for hazard studies (Ghasemi and Allen, 2018).
Sensitivity to rare earthquakes
The above analysis relies on the assumption that the past 50-year record of seismicity in Australia is representative of the long-term seismicity rate that might be expected in the future. Based on the historical observation window, we know that large-magnitude earthquakes can occur in locations with little to no historical evidence for seismicity. This presents a challenge to hazard modelers in striking a balance between providing realistic estimates of ground-motion hazard and not forcing architects and engineers to design for high seismic demands that may have a very-low probability of occurring. As noted by Hanks et al. (2012), there are so many regions in the world characterized by low seismicity and low seismic hazard that when a moderate-to-large earthquake occurs, it is likely that the mapped hazard will be exceeded proximal to the earthquake source. The PSHA methodology is defined such that probabilistic ground motions will be exceeded with a given probability over a given time horizon for a given area. The area of exceedance may be minimized by reducing the exceedance probability for which the maps are developed (e.g. 2% rather than 10% probability of exceedance in 50 years).
In this section, a chance occurrence of an MW 6.9 scenario on the Eden-Burnside fault, near the city of Adelaide in South Australia, is added to the composite map of historical events (Figure 6). Based on the fault-source model developed for the NSHA18 (Allen et al., 2018a; Clark et al., 2016), an event of this magnitude might be expected within 100 km of the Adelaide central business district (on known faults) approximately every 8700 years on average. Using the suite of GMMs preferred for use in Australia, the fractional area exceeding the mapped PGA values are calculated including this rare scenario event with the national composite map (Table 2). An earthquake of this magnitude would clearly be destructive to the built environment of the local area. However, even its occurrence would not see any of the models assessed herein exceed the 10% target exceedance rate for 50 years.
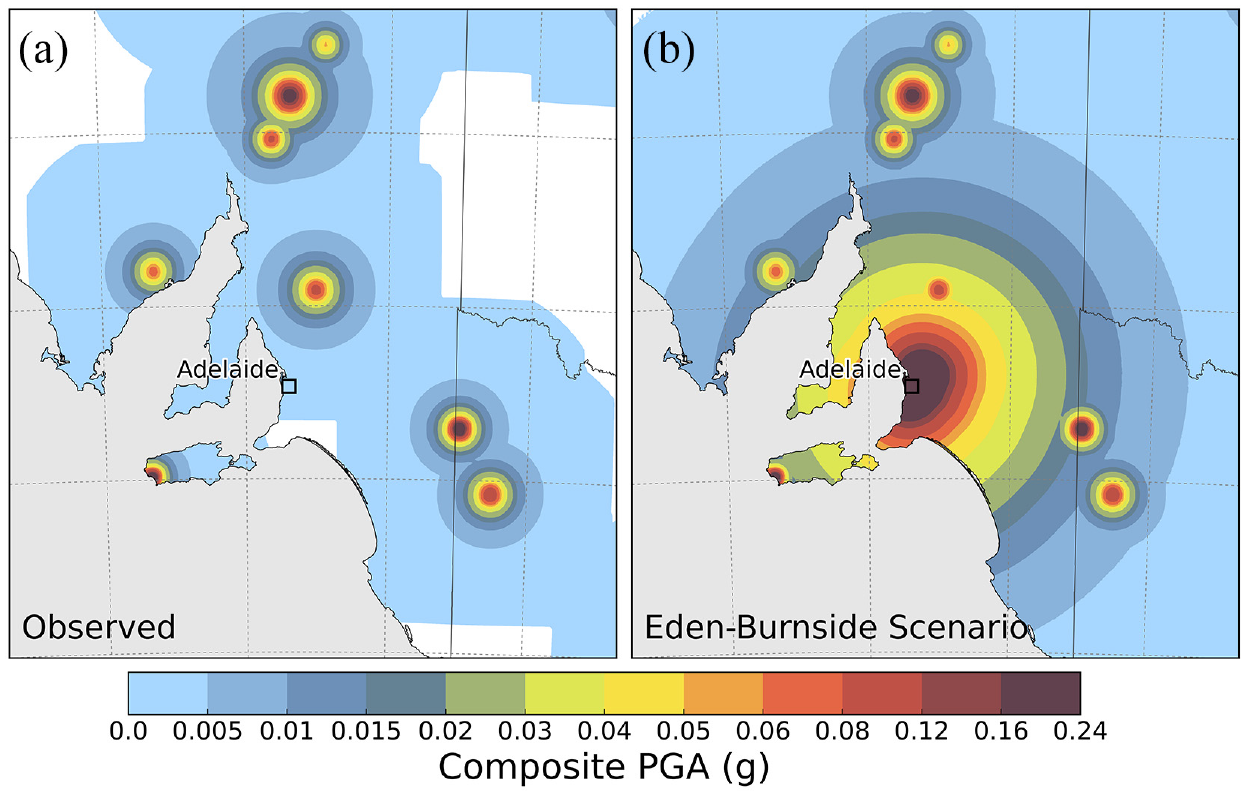
Composite ShakeMaps for the greater Adelaide region showing the (a) observed PGA from earthquakes of MW ≥ 4.25 from 1972 to 2021 estimated using preferred Australian GMMs and (b) a plausible MW 6.9 scenario on the Eden-Burnside fault added to the composite map of historical events.
Assumptions and limitations
As with any seismic hazard assessment, there are several assumptions and limitations embedded within this study that require disclosure. The key assumption herein is that the past 50-year earthquake history within Australia is representative of the long-term seismicity rate. In some regions across Australia, seismicity has remained relatively stationary in space and time (Leonard, 2008). However, it is also known, from rare events like the 1988 Tennant Creek earthquake sequence, that large events can occur in unanticipated locations. Hazard models are constructed acknowledging that these rare events may occur. There should also be recognition from end users that should these events occur, they will likely exceed the locally mapped hazard. The area over which exceedance occurs can be reduced by decreasing the AEP used for the seismic hazard map. Ideally, a study exploring the skill of a probabilistic hazard forecast would require independent data for testing and validation (Gerstenberger et al., 2020). Unfortunately, the short observation window and variable quality of Australian earthquake catalogs (particularly earthquake magnitudes), precludes the inclusion of data for periods much earlier than approximately 1970.
While progress has been made in characterizing ground-motion attenuation throughout the Australian crust in recent times (Allen, 2012; Somerville et al., 2009), there does remain some uncertainty in the selection and use of GMMs in the Australian context. While best efforts have gone into the selection of GMMs for generating the composite ShakeMaps in this study, the authors recognize that further work is required. Initial observations from the 21 September 2021 MW 5.9 Woods Point, Victoria, earthquake (Ninis et al., 2021; Quigley and La Greca, 2021) indicate higher than expected short-period accelerations (relative to the Australian-preferred GMM suite) at distances less than approximately 100 km from the source (Hoult et al., 2021b). As such, work is underway to develop an Australian ground-motion database that will further improve the characterization of GMM logic trees for future hazard assessments (Ghasemi and Allen, 2021, 2022).
If we assume that the GMM set preferred for use in this study is an accurate reflection of the mean ground-motion attenuation in Australia, we would still have expected to observe aleatory effects in the ground-motion fields from the real-world historical events if sufficient observations existed. An assumption is made that the aleatory event terms would be distributed log-normally relative to the mean ShakeMap predictions and the overall effect would reduce to near zero if considered for the full event set at a continental scale.
Finally, there remain uncertainties in catalog magnitudes, both through the correction of local magnitudes due to the use of inappropriate magnitude formulae (Allen, 2021) and through the conversion of local magnitudes to moment magnitudes (Allen et al., 2018c), as required for generating ground-shaking fields in ShakeMap.
Discussion
The performance of seismic hazard models is a key field of study for PSHA worldwide (Beauval et al., 2008; Hanks et al., 2012; Salditch et al., 2020; Vanneste et al., 2018). Given the role of PSHAs to establish earthquake-loading requirements for the built environment, it is important to understand how skilled these models are at forecasting future earthquake shaking given the often-limited observations in the intensity range of interest. However, model validation is challenging given the scarcity of independent data (Gerstenberger et al., 2020), particularly for site-specific assessments (Beauval et al., 2008; Mak et al., 2014). Since hazard models rely on historical data and knowledge, these same data ideally should not be used for prospective testing. However, they may be used to ensure a model is consistent with historical observations (Gerstenberger et al., 2020).
Some studies have used macroseismic intensity or instrumental data to estimate ground-motion exceedance rates for given locations to assess the performance of national-scale models (Griffin et al., 2019; Stirling and Gerstenberger, 2010; Stirling and Petersen, 2006). Indeed, in this study, there are many sites that are likely to have been subjected to ground shaking from multiple earthquakes from 1972 to 2021 for which PGA return periods may be estimated. However, in a low-seismicity region such as Australia, testing hazard at a given locality would require an observation window of many thousands of years (Beauval et al., 2008; Iervolino, 2013)—much longer than our instrumental records. If using macroseismic data, there are also considerable uncertainties in the conversion to PGA on a site class consistent with the reference site class of the hazard model. By contrast, to a first order, it is possible to test performance of many sites on aggregate to assess the overall performance of a PSHA over a broad region (Vanneste et al., 2018; Ward, 1995), such as the approach taken herein. The current assessment serves as a useful retrospective test for the national-scale models to determine whether they are roughly consistent with their stated objective (i.e. that ground motions are exceeded with a given probability over a given period of time) rather than grossly over- or underestimating ground-motion exceedances.
One of the most obvious relative changes in the most recent national hazard assessment—the NSHA18—is the difference in hazard forecasts in the Tennant Creek, Northern Territory, region in central Australia. Relative to previous hazard assessments (Burbidge, 2012; Leonard et al., 2013; McCue et al., 1993), the NSHA18 demonstrates significantly lower seismic hazard for this region, which in 1988 was subjected to three large earthquakes exceeding MW 6.0 within a 12-hour period (Jones et al., 1991), with aftershocks continuing to the present day. One might ask, with the benefit of hindsight, why does the NSHA18 have the largest area of exceedance in the Tennant Creek region? There are two main reasons for the relatively low hazard in the region. First, the PSHA methodology assumes earthquakes occur randomly in space in time (i.e. they follow a Poisson distribution). Consequently, standard PSHA practice is to decluster earthquake catalogs of dependent events (i.e. foreshocks and aftershocks). However, this significantly reduces the hazard in regions such as Tennant Creek. The declustering algorithm used in the NSHA18 (Allen et al., 2018c) effectively reduces this region to one earthquake; the MW 6.6 mainshock on 22 January 1988. Consequently, there are few other earthquakes in the immediate vicinity that contribute to the region’s overall earthquake rate model, resulting in overall low hazard.
While aftershocks do contribute to the total seismic moment budget of a given volume of crust and their ground motions could cause further damage to already weakened structures, their proportion of moment release and consequent ground-motion fields are often small relative to that of mainshocks (Zakharova et al., 2013). From an engineering perspective, if buildings are not damaged in the mainshock, it would be reasonable to assume that their collapse capacity is unaffected by aftershocks that generate lower-intensity ground motions (Raghunandan et al., 2014). However, with such protracted aftershock sequences (i.e. decades), this philosophy will have shortcomings, particularly when the built environment is redeveloped. These comments assume that aftershocks are defined as events that re-rupture the mainshock rupture plane and occur within a time window appropriate for aftershocks to occur (Abrahamson et al., 2014; Wooddell and Abrahamson, 2014).
Another reason for the low overall hazard in the Tennant Creek region from the NSHA18 is that the fault source that represents the Tennant Creek scarps is assigned with very low slip rates (Clark et al., 2016). These slip rates are based on paleoseismic information (Crone et al., 1997) and imply that the fault source does not contribute significantly to seismic hazard at the 10% in 50-year exceedance probability. This is consistent with other fault scarps in cratonic regions of Australia that have been studied in detail, which either show no evidence for recurrence, or evidence for limited recurrence of large events (Clark et al., 2020).
There is growing evidence to support the notion of “one-off” ruptures in cratonic regions of Australia (Clark et al., 2020; King et al., 2021). Therefore, we may expect that large infrequent earthquakes (possibly exceeding magnitude MW 7.0) could occur in an unanticipated location that is currently characterized by low seismicity and seismic hazard. When estimating seismic hazard in these settings, hazard modelers tend to use large background area-source models that allow for large earthquakes to “float” over wide spatial regions at low probabilities of occurrence (Allen et al., 2020; Lam et al., 2016). These infrequent earthquakes will cause shaking over a limited area that is much stronger than mapped probabilistic values (Hanks et al., 2012; Vanneste et al., 2018). However, these exceedances do not invalidate the PSHAs since hazard maps are designed to be exceeded at a certain probability over a given period. The study of Vanneste et al. (2018) used a Monte Carlo approach to simulate thousands of earthquake histories for observation times between 50 and 2500 years. This study found that the fractional area for a region of known uniform hazard would exceed the objective probability of exceedance for approximately 50% of the simulations. It was shown that the variances of these exceedances were larger in low-seismicity regions given the relatively fewer number of expected earthquakes from which to constrain earthquake histories, and the likelihood that when rare large events did occur, proportionally larger areas would be exceeded. The variances were also found to decrease for longer observation periods and lower exceedance probabilities. Thus, it can be inferred that even small overestimates of the objective exceedance rate should not be assumed to invalidate a well-calibrated national-scale hazard model.
It is worth noting that the minimum magnitude chosen to select historical events for this analysis within continental Australia (MW 4.25) is smaller than the minimum magnitude for the hazard integral assumed in many PSHAs, including the NSHA18, which assumed a minimum magnitude of MW 4.5 (Allen et al., 2020). The inclusion of earthquakes MW ≥ 4.25 was a deliberate choice to introduce some conservatism into these analyses given that Australia has experienced relatively small-magnitude earthquakes that have led to considerable levels of damage. This is underscored with the occurrence of the 2010 Kalgoorlie-Boulder, Western Australia, earthquake (ML 5.0, MW 4.0–4.1), which caused major damage to vulnerable heritage buildings (Edwards et al., 2010) and injured two people with an estimated loss of AU$36 million (2017 dollars; Insurance Council of Australia, 2022). While the local magnitude estimate of ML 5.0 for this earthquake suggests that it should be included in these analyses, two independent estimates of MW for the 2010 Kalgoorlie-Boulder earthquake are less than the MW 4.25 cut-off for these analyses (Ghasemi et al., 2016; Sippl et al., 2015). Nevertheless, the fractional exceedances represented in Table 1 may be slightly higher than if a minimum magnitude higher than MW 4.25 was assumed.
Finally, one could argue that all hazard models tested herein are overly conservative based on the requirements in the AS1170.4 and therefore do not meet the expectations of the Standard—some more so than others. However, the end-use of the AS1170.4 is intended to reduce risk for large earthquakes. If the risk perception is greater than that expressed by modern seismic hazard assessments for a given exceedance probably, then these risks could be managed through adjustment of the exceedance probability or through adjustments to the structural performance component of the standard.
Conclusion
A “composite ShakeMap” was generated from earthquakes of MW 4.25 and greater affecting the Australian continental landmass in the 50-year period from 1972 to 2021 (Figure 4a). The maximum PGA “observed” at any grid point across Australia for this period was used to assess the forecasting skill of several generations of national-scale seismic hazard models for a 10% probability of exceedance in 50 years. While there are a number of assumptions in this assessment and a lack of independent data for testing (particularly the more recent models), these analyses—to the first order—do provide a guide to the performance of the respective maps at a continental scale. Based on the assumptions described in this article and the observed seismicity in the past 50 years, all national models considered herein are conservative in terms of the fractional area of landmass for which PGA has exceeded the mapped hazard. In particular, the GSHAP hazard map (McCue, 1999), which was adapted from the map used as the basis for the AS1170.4–1993 (McCue et al., 1993) and underpins the hazard design factors in the 2018 amendment to the Standard (Standards Australia, 2018), is the most conservative hazard assessment with a fractional exceedance of less than one-tenth of the expected exceedance rate of 10%. The model with the highest apparent skill at forecasting ground-motion exceedances is the NSHA18 (Allen et al., 2018b, 2020). However, this should be expected given the similar assumptions in ground-motion estimation between the assessments and the significant overlap between the data used to construct and test the model. It could be inferred that the greater similarity between the Gaull et al. (1990) and NSHA18 models relative to the other models could be explained by the internal consistency of the magnitude type used to characterize both the source-rate model and ground-motion characterization model in each case.
The sensitivity of these analyses is explored using alternative GMMs to characterize the attenuation for the individual ShakeMaps. New GMMs developed for the stable continental CENA are equally weighted relative to the preferred suite of GMMs for Australia (Figure 4b). The GMM logic tree that more heavily weights the CENA models generally estimates larger accelerations and lower attenuation than would be expected from earthquakes in the Australian crust (Allen and Atkinson, 2007; Hoult et al., 2021a). As expected, the higher weighting of the CENA GMMs leads to higher fractional exceedances for all models; particularly the NSHA18. While the seismological community has developed a better understanding of ground-motion attenuation in Australia, it is clear that this remains one of the most uncertain and influential aspects for seismic hazard forecasts in Australia.
The models are also tested with the insertion of a rare scenario earthquake with a recurrence longer than the typical time horizon of building codes. An MW 6.9 event is modeled on the Eden-Burnside fault near Adelaide (Figure 6b). While an earthquake of this magnitude would be destructive to the built environment of the local area, its occurrence would not invalidate any of the models assessed herein, with each hazard model remaining below the target 10% exceedance rate for 50 years.
Finally, modern seismic hazard assessments for Australia suggest that some regions are characterized by particularly low earthquake activity rates and consequent low probabilistic hazard. In these cases, seismic demands calculated through PSHA are unlikely to provide reasonable protection to a structure and its occupants in the event of a strong earthquake. Therefore, complimentary approaches are available, such as the use of a floor in the seismic demands, to provide a minimum level of protection to structures.
Supplemental Material
sj-zip-1-eqs-10.1177_87552930231151977 – Supplemental material for Exploring Australian hazard map exceedance using an Atlas of historical ShakeMaps
Supplemental material, sj-zip-1-eqs-10.1177_87552930231151977 for Exploring Australian hazard map exceedance using an Atlas of historical ShakeMaps by Trevor I Allen, Hadi Ghasemi and Jonathan D Griffin in Earthquake Spectra
Footnotes
Acknowledgements
The authors are grateful to Gareth Davies, Phil Cummins, and Dan Clark for their thoughtful comments on this article. Dan Clark is also thanked for digitizing the Gaull et al. (1990) PGA contours that were used to interpolate the hazard surface. They thank David Wald for providing comments on an earlier conference paper (Allen et al., 2021) from which this study was based and encouraging its submission to the journal. Matt Gerstenberger also provided thoughtful comments to an earlier version of the article. The authors are grateful to Graeme Weatherill and two anonymous reviewers for their positive and constructive reviews. Grid processing of NetCDF (Network Common Data Form) data files used the Generic Mapping Tools (Wessel et al., 2013), while all figures were made using Python Matplotlib. The authors publish with the authorization of the CEO of Geoscience Australia.
Authors’ note
Declaration of conflicting interests
The author(s) declared no potential conflicts of interest with respect to the research, authorship, and/or publication of this article.
Funding
The author(s) received no financial support for the research, authorship, and/or publication of this article.
Supplemental material
Supplemental material for this article is available online.
References
Supplementary Material
Please find the following supplemental material available below.
For Open Access articles published under a Creative Commons License, all supplemental material carries the same license as the article it is associated with.
For non-Open Access articles published, all supplemental material carries a non-exclusive license, and permission requests for re-use of supplemental material or any part of supplemental material shall be sent directly to the copyright owner as specified in the copyright notice associated with the article.