
Abstract
The 2021 US National Seismic Hazard Model (NSHM) for the State of Hawaii updates the previous two-decade-old assessment by incorporating new data and modeling techniques to improve the underlying ground shaking forecasts of tectonic-fault, tectonic-flexure, volcanic, and caldera collapse earthquakes. Two earthquake ground shaking hazard forecasts (public policy and research) are produced that differ in how they account for declustered catalogs. The earthquake source model is based on (1) declustered earthquake catalogs smoothed with adaptive methods, (2) earthquake rate forecasts based on three temporally varying 60-year time periods, (3) maximum magnitude criteria that extend to larger earthquakes than previously considered, (4) a separate Kīlauea-specific seismogenic caldera collapse model that accounts for clustered event behavior observed during the 2018 eruption, and (5) fault ruptures that consider historical seismicity, GPS-based strain rates, and a new Quaternary fault database. Two new Hawaii-specific ground motion models (GMMs) and five additional global models consistent with Hawaii shaking data are used to forecast ground shaking at 23 spectral periods and peak parameters. Site effects are calculated using western US and Hawaii specific empirical equations and provide shaking forecasts for 8 site classes. For most sites the new analysis results in similar spectral accelerations as those in the 2001 NSHM, with a few exceptions caused mostly by GMM changes. Ground motions are the highest in the southern portion of the Island of Hawai’i due to high rates of forecasted earthquakes on décollement faults. Shaking decays to the northwest where lower earthquake rates result from flexure of the tectonic plate. Large epistemic uncertainties in source characterizations and GMMs lead to an overall high uncertainty (more than a factor of 3) in ground shaking at Honolulu and Hilo. The new shaking model indicates significant chances of slight or greater damaging ground motions across most of the island chain.
Keywords
Introduction
The Hawaiian islands are formed through complex volcanic and tectonic processes that cause high rates of earthquake activity under the southern portion of the Island of Hawai’i and moderate or low seismicity across the rest of the island chain (e.g. Klein et al., 2001). The islands evolve through stages of growth and decay, which influence the temporal and spatial variability in earthquake activity. As the Pacific tectonic plate slides to the northwest at a rate of ∼7.4 cm/year across the stationary Hawaiian hot spot, long-lived magma chambers form and feed complex venting systems resulting in highly productive volcanic eruptions that build the world’s largest shield volcanoes rising about 10,000 m above the seafloor (Peterson and Moore, 1987). Earthquake activity throughout the lower crust and upper mantle is the highest during the early stage of active volcanism, especially along the flanks of southern volcanoes that are known to rupture in large earthquakes (Wolfe et al., 2004). As older volcanoes on the plate continue to migrate away from the hot spot during the middle stages of evolution, they become dormant, and earthquakes in these areas are mostly generated by the flexure stresses within the oceanic plate due to the weight of the overlying volcanoes (Klein, 2016; Klein et al., 2001) and by ruptures along oceanic faults (e.g. Anchieta et al., 2011; Butler, 2020; Wolfe et al., 2004). While the islands continue to migrate to the northwest, they erode and subside, transforming into atolls and seamounts. Earthquakes greater than moment magnitude (M) 5 are rare near these late-stage features (Figure 1a; in this article, we consider moment magnitudes unless otherwise specified).
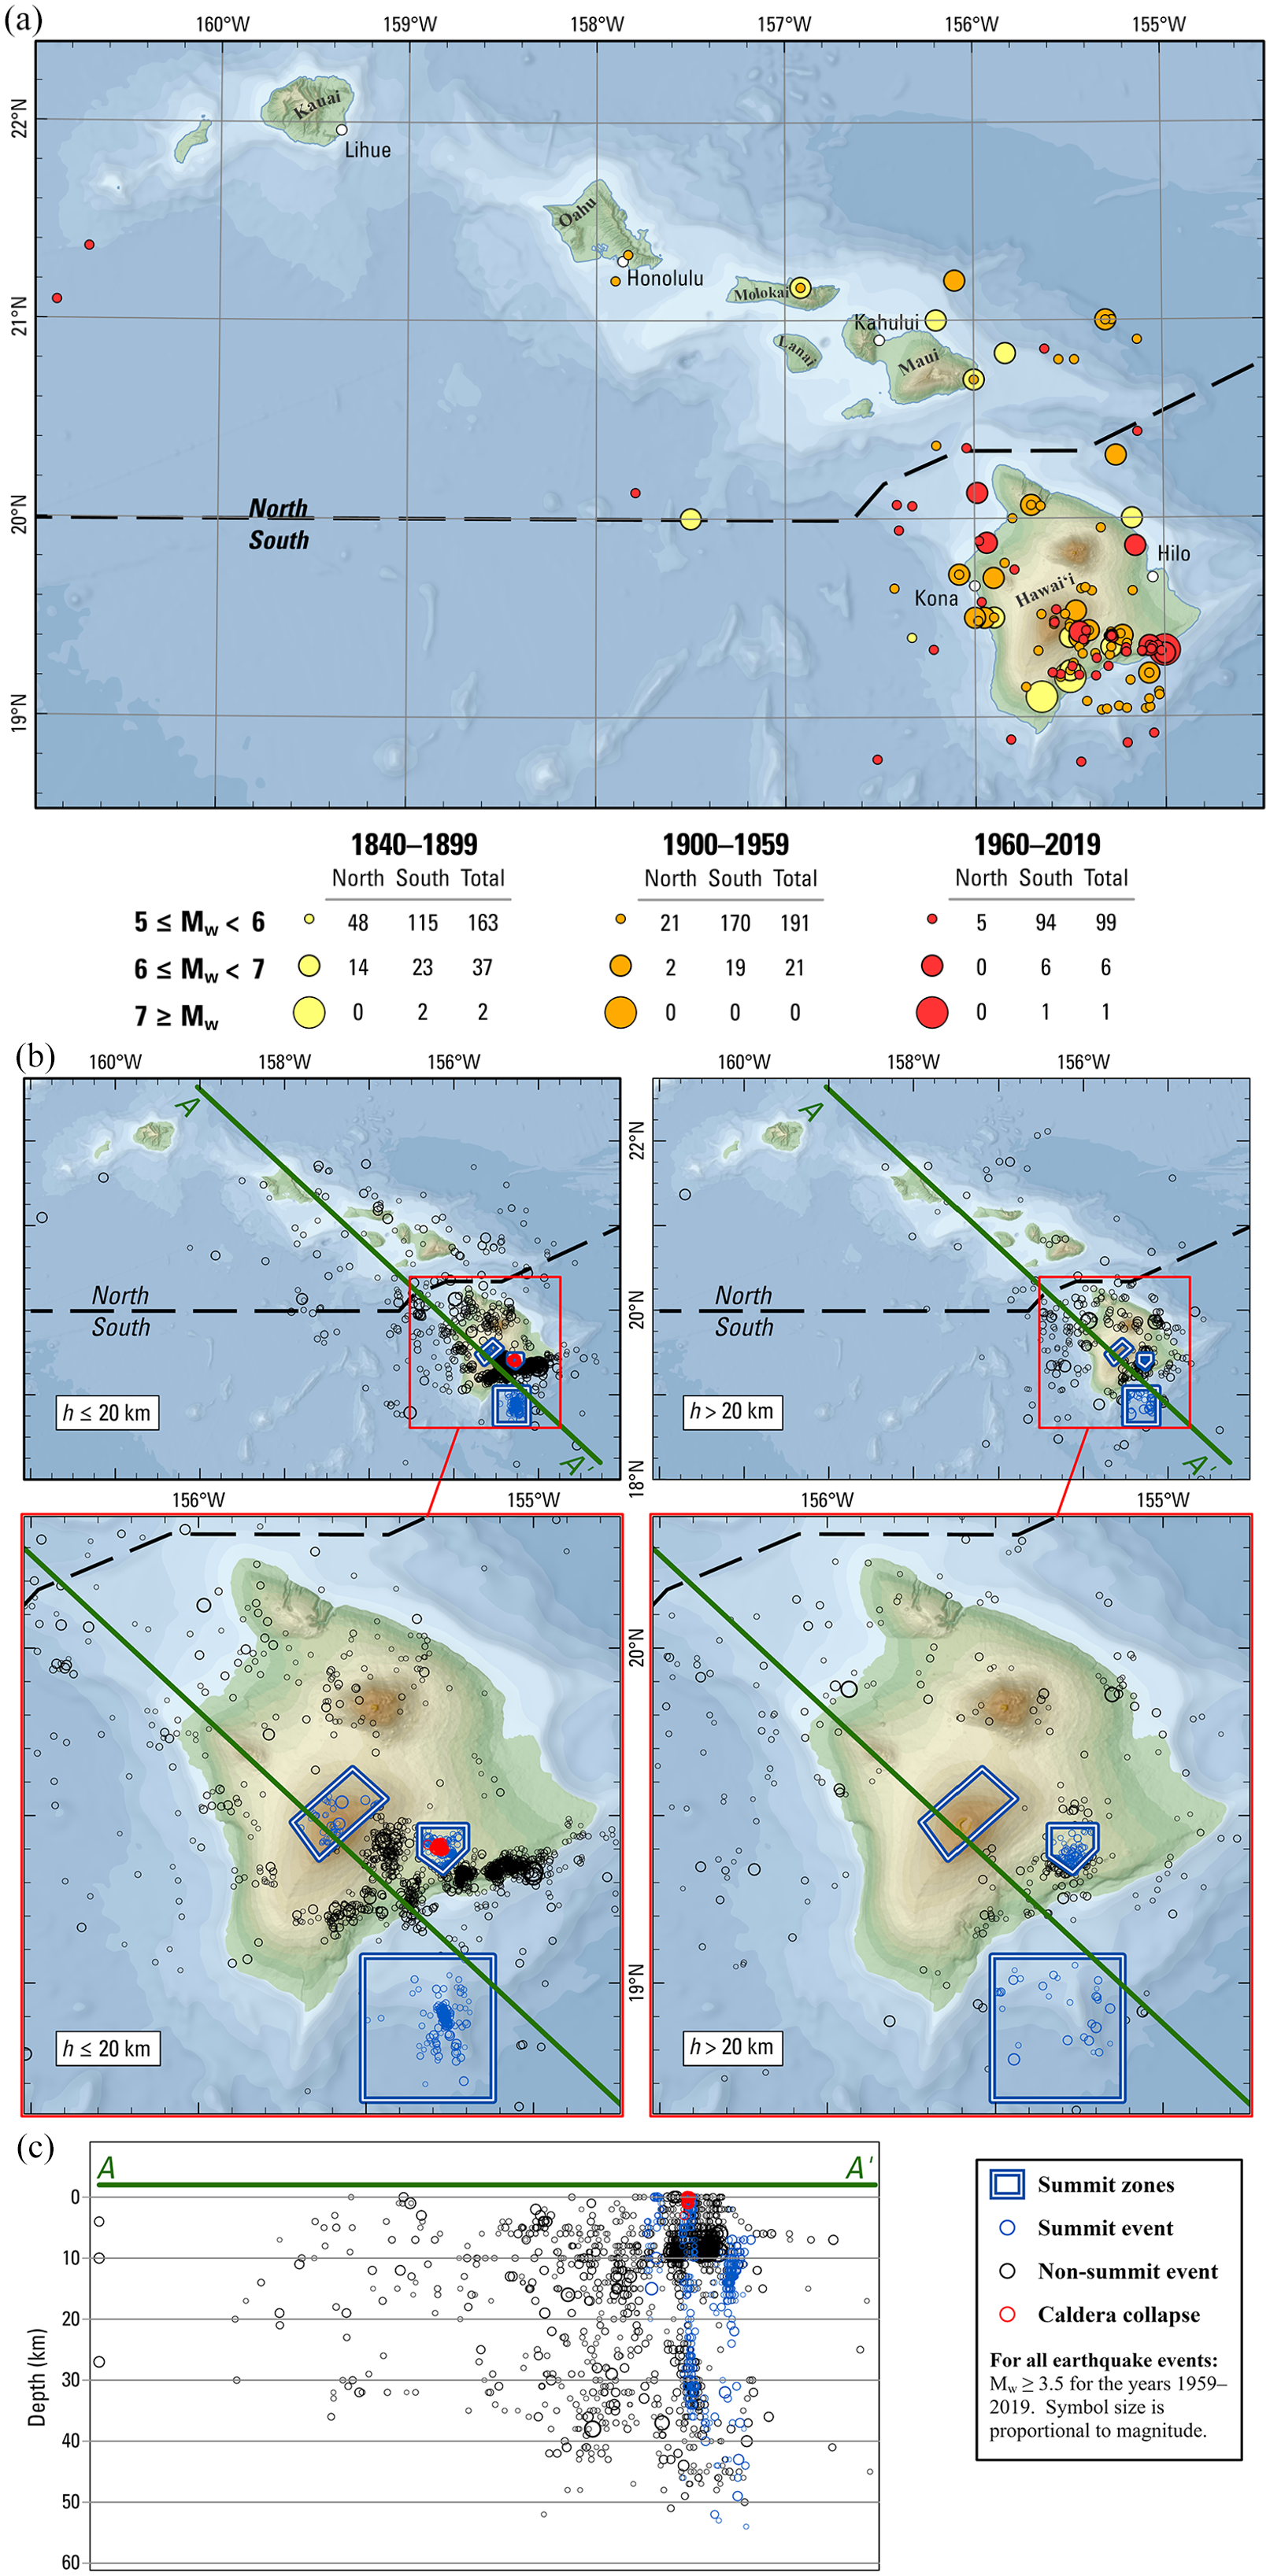
Seismicity of Hawaii (a) earthquakes M ≥ 5 showing 1840–1899, 1900–1959, 1960–2019 catalogs separately; (b) seismicity M ≥ 3.5 showing deep and shallow seismicity (1960–2019) for catalog zones considered in the model; and (c) cross section showing seismicity depths along profile shown in (b).
Today, earthquakes are frequent (Figure 1) across the southernmost region of the Island of Hawai’i which overlies the Hawaiian hot spot and they decrease toward the northwest where differences in volcanic activity, tectonics, stresses, and styles of faulting result in lower activity rates. The Island of Hawai’i is composed of five shield volcanoes generated over the past 0.5 million years: Kīlauea, Mauna Loa, Hualālai, Mauna Kea, and Kōhala, with the first three volcanoes as well as Lō’ihi—a submarine volcano 35 km off the southwest coast—being most active (Peterson and Moore, 1987). The island of Maui has one active volcano, Haleakalā, that is thought to have erupted about 400–600 years ago. Magmatic activity near these volcanoes will generate future hazardous seismicity. Along the southern coast of the Island of Hawai’i, repeated emplacement of lava onto the flank of the island gravitationally loads the discontinuity between the volcanic pile and the oceanic crust along nearly horizontal décollements and results in brittle fault ruptures up to and potentially exceeding M8 (Klein et al., 2001). The tectonic stresses associated with this flank loading and instability are manifested by large geodetic-measured displacement rates, and abundant moderate-to-large earthquake ruptures (Cannon et al., 2007; Ito et al., 2017). Observed earthquake rates in the southern portion of the Island of Hawai’i are high and comparable to the most seismically active areas of the world (Hawaii State Department of Defense, 2005; Klein et al., 2001). For example, over the past 152 years (1868—2020), this portion of Hawaii has experienced ∼49 M ≥ 6 earthquakes and 3 M ≥ 7 earthquakes (Figure 1). Federal Emergency Management Agency (FEMA) loss assessments for Hawaii County are similar to those in San Francisco and Los Angeles, California (FEMA, 2017; Klein et al., 2001). Moderate-to-large earthquakes occur across the island chain, and seismic risk is also significant near O’ahu where population and infrastructure exposure are high. Cox (1986) suggests that sites near Honolulu have experienced damaging shaking levels (Modified Mercalli Intensity: MMI ≥ VI) from three earthquakes during the past 120 years. Our primary objective in this article is to model the seismic hazard from these potentially damaging earthquakes using the best science available.
The US Geological Survey (USGS) Earthquake Hazards Program develops the probabilistic-based National Seismic Hazard Model (NSHM) using the latest seismic hazard information to (1) provide scientific information useful for mitigating earthquake damage and improving seismic safety, (2) facilitate development of seismic provisions of engineered structures and critical facilities, (3) give context for state disaster mitigation plans, (4) provide data necessary for FEMA- and industry-based risk assessments, and (5) contribute information for public policy documents and decision-making tools. The USGS updates the models with the best available information available on rates of earthquake sources and ground shaking. We account for the range of scientific opinions and models available in the scientific community by applying a logic tree structure that allows for alternative earthquake source and ground motion inputs, models that are weighted based on science-based criteria, and an assessment of the level of acceptance in the science community. The first version of the NSHM for Hawaii was a probabilistic seismic hazard analysis (PSHA) model released in 1998 that has been influential in guiding building codes and other public policy decisions over the past two decades (Klein et al., 2001).
Since the release of that model, new data, methods, and modeling techniques have been collected, analyzed, and applied to better define earthquake source rupture models and ground motion models (GMMs). For example, several tens of thousands of new earthquakes were recorded that can provide a better definition of earthquake active zones. These earthquakes extend down to depths of roughly 30–50 km beneath the island chain (Figure 1). A newly developed earthquake catalog improves the magnitudes and locations of past events and includes more recent events (Okubo et al., 2014; The Advanced National Seismic System Comprehensive Catalog (ComCat), 2021; Wolfe et al., 2004). Several methods for declustering earthquake catalogs to remove spatial and temporal rate biases have been developed that improve earthquake forecasting capabilities (Marzocchi and Taroni, 2014; Moschetti et al., 2015; Petersen et al., 2014, 2015, 2020; Reasenberg, 1985; Zaliapin et al., 2008). An adaptive smoothing method has been developed that allows for shorter smoothing distances in areas of dense seismicity and longer smoothing distances in areas of more dispersed seismicity (Helmstetter et al., 2007; Moschetti, 2015). For the first time, a hazard model for caldera collapse earthquakes was formulated (Llenos and Michael, 2021) and can be applied to make better shaking assessments near the Kīlauea caldera. A new Quaternary fault map shows locations and slip rates of dozens of active faults across the Island of Hawai’i (Cannon et al., 2007). Monitoring stations operated by the Hawaiian Volcano Observatory (HVO), National Strong-motion Project, Pacific Tsunami Warning Center, and Pacific Global Positioning System (GPS) Facility (including about 40 broadband, 76 strong motion, and 66 GPS stations) were installed or upgraded over the past few decades (Shiro et al., 2021). The thousands of strain-rate recordings from Synthetic Aperture Ranging (SAR) and other imaging data (Ito et al., 2017) as well as earthquake locations have been used to assess slip rates and earthquake rates across the islands. Hundreds of ground motions were recorded over the past two decades that can be used to improve the GMMs. In particular, two large earthquake sequences in 2006 and 2018 provided abundant ground motion data at strong motion recording stations. These ground motion data were used to develop two new Hawaii-specific GMMs that provide a better assessment of strong ground motions in Hawaii or to evaluate which set of global GMMs best fit the Hawaii data (Atkinson, 2010; McNamara et al., 2020a; Wong et al., 2015). Soils underlying strong motion stations were characterized to better understand the site effects associated with shallow site conditions and how they may amplify or attenuate shaking (Wong et al., 2011). These new data, models, and methods were used to improve this seismic hazard assessment of Hawaii.
The purpose of this article is to (1) explain and justify new seismic sources and GMMs; (2) show maps describing ground shaking for alternative hazard exceedance levels, oscillator periods, and site classes; (3) describe uncertainties and sensitivities to ground motions from inputs at a pair of sites in Hilo and Honolulu (a site near the volcanic and southern décollement earthquake sources and a site in the most populated city in Hawaii); (4) disaggregate hazard to highlight important earthquake sources; (5) provide tools and related information for users to access the data; (6) develop products that describe potential damage from earthquakes; and (7) discuss limitations and improvements of the data, models, and methods. We calculate the seismic ground shaking hazard across the Hawaiian island chain using a probabilistic methodology that forecasts where and how often earthquakes occur and with what intensity the ground will shake from future earthquakes. We produce these models for 23 ground-motion intensity measures and 8 site classes, many more than the peak horizontal ground acceleration (PGA), 0.2, 0.3, and 1-s spectra accelerations (SA), and one site class (firm rock) considered in the 2001 NSHM. We produce two types of hazard models: (1) a primary model that incorporates declustering models that are consistent with NSHMs for the other US states and territories and (2) a research model that includes a new methodology for including the rate of earthquakes in the full (non-declustered) catalog which has been published (Marzocchi and Taroni, 2014), but has not been thoroughly evaluated by USGS and other end users. Such information can help save lives and be used to efficiently apply resources by neither under-designing in more hazardous places nor over-designing in safer areas as well as to construct safer, more resilient cities. In this article, we show that the hazard and simple risk metrics vary significantly across the Hawaiian islands and that the risk increases over time due to the rapid population growth and increase in infrastructure exposure.
2001 Hawaii NSHM
The Klein et al. (2001) model (hereafter referred to as the “2001 Hawaii NSHM” or “2001 model”) was the first USGS seismic hazard model for Hawaii. It was developed using probabilistic methods to produce PGA and SA at 0.2, 0.3, and 1-s periods for 2% and 10% probabilities of exceedance in 50-year hazard levels and a reference site condition with a time-averaged shear-wave velocity (VS) from the surface to a depth of 30 m (VS30) of 760 m/s. These results indicated that the most seismically active region of Hawaii is comparable to ground shaking hazard levels found in the San Francisco Bay area or the greater Los Angeles region.
The 2001 model incorporated seismic sources derived from an earthquake catalog spanning 1868–1997. The pre-1959 catalog was from Klein and Wright (2000) and was based on intensity-area magnitudes by Wyss and Koyanagi (1992a), felt reports from newspapers and other published and unpublished materials, amplitude readings made from seismograms, and maximum intensity determinations. The post-1959 catalog was mostly based on earthquake phase data compiled from the HVO seismic network and with hypocenters calculated using available location algorithms. Preferred magnitudes were selected from the best available recorded data. This study carefully examined the various earthquake sequences across Hawaii to produce declustered earthquake catalogs using the Reasenberg (1985) methods with Hawaii-specific input parameters. For some older earthquakes (e.g. 1868 and 1929), aftershocks were removed manually (Klein et al., 2001). Aftershocks near Kīlauea and Lō‘ihi summit regions were not removed because the authors felt true aftershocks did not occur in areas associated with volcanic activity. Declustered catalogs were smoothed to produce (1) forecasted earthquake rates applied in a magnitude-frequency distribution determined at a regularly spaced grid of calculation sites using fixed smoothing methods and (2) a grid of rates that accounted for decreasing seismicity rates from Maui to Kaua’i, also referred to as a ramp model.
The 2001 model incorporated five different seismic source types: (1) nearly horizontal décollement faults found on the southern and western coastal areas of the Island of Hawai’i that incorporate rates defined with kinked earthquake magnitude–frequency distributions with slope b = 1.0 for events up to M5 and significantly shallower slopes around b = 0.6 for larger events, (2) uniform-area sources for the Kīlauea caldera and narrow rift zones, (3) shallow smoothed seismicity with a fixed 10-km distance (half-width) smoothing parameter, (4) deep smoothed seismicity that also incorporate a fixed 10-km smoothing distance, and (5) a ramp-type rate grid source that results in decaying earthquake rates away from the Island of Hawai’i. They found that probabilistic earthquake hazard from flank earthquakes is significantly higher than the probability of great slumps and landslides that could generate high-energy ground shaking and tsunamis. Klein et al. (2001) indicated that flank earthquakes may not follow a characteristic magnitude–frequency distribution and that seismic evidence does not show repeated ruptures on segments of the seaward-slipping volcano flank faults. However, they also suggested that flank earthquakes are physically constrained by the rift zones and volcanoes and that earthquakes on these décollements may be reasonably represented with a Gutenberg–Richter magnitude–frequency distribution for background seismicity and a partially characteristic earthquake model that allows for an excess of larger earthquakes than would be predicted by a simpler background distribution.
The 2001 NSHM considered several alternative GMMs all weighted equally. For earthquakes between M5 and 7, the 2001 model considered the following GMMs: for PGA, they applied the Boore et al. (1997), Sadigh et al. (1997), Campbell (1997), and Munson and Thurber (1997); for 0.2-s SA, they used the same suite but excluded the Campbell (1997) equation and applied a factor of 2.2 to the Munson and Thurber (1997) PGA GMM to estimate this high-frequency shaking; and for 1.0-s SA, they used the Boore et al. (1997) and Sadigh et al. (1997) equations. They considered similar models for earthquakes larger than M7: for PGA and 0.2-s SA, they applied the Sadigh et al. (1997) GMM and a modified version of Munson and Thurber (1997) GMM that considered alternative magnitude scaling parameters; for 1.0-s SA, they only used the Sadigh et al. (1997) GMM. For deep earthquakes, they applied the subduction zone GMM of Youngs et al. (1997).
The resulting hazard maps for firm rock site conditions showed PGA 2% in 50-year exceedances of 1.75 g on the southern part of the Island of Hawai’i and 0.27 g near Honolulu. The 2001 model has been considered for the past two decades in current building codes and other public policy applications and has been an effective component of risk mitigation efforts. We apply several components of this model in the 2021 NSHM for Hawaii.
2021 Hawaii NSHM input data and models
We base our new models on an updated earthquake catalog, new geologic and geodetic strain-rate data, and additional ground motion records. The earthquake source models include gridded background seismicity for shallow and deep earthquakes, caldera collapses, and fault ruptures. We currently have no method to forecast a seismic rate change over the period of this forecast. Therefore, for this study, we apply time-independent (Poissonian) earthquake rate models that assume stable long-term average rates of earthquakes. To account for uncertainty in these long-term rates, we apply alternative (weighted) 60-year averages and explain potential changes in mean rates over time. We also consider GMMs that are appropriate for Hawaii earthquakes and are capable of producing ground motion distributions at 21 spectral periods, 2 peak parameters, and 8 site conditions applied in the US building codes. We consider alternative earthquake types separately to account for differences in ground motion characteristics.
To assess earthquake hazard, we categorize Hawaiian earthquakes into four types based on suspected origin and source mechanism: (1) tectonic-fault earthquakes driven by magmatic intrusions or other stresses that induce gravity-driven rupture along brittle faults, (2) tectonic-flexural earthquakes related to the release of bending stresses within the crust and uppermost mantle due to the load of overlying volcanoes (Klein, 2016), (3) volcanic earthquakes related to stresses associated with magma flow through volcanic vents, rifts, or fissures, and (4) caldera collapse seismogenic events, which are a different type of volcanic earthquake that is produced by the episodic collapses of the caldera precipitated by magma withdrawal (e.g. Anderson et al., 2019; Klein et al., 2001; Neal et al., 2019). Figure 1b and c shows the distribution of earthquakes by depth in volcanic summit and non-summit regions.
The largest earthquakes are related to tectonic faults and are thought to potentially range up to M8.2 and result from brittle failure along shallow décollement faults or other faults such as oceanic fracture zones (Butler, 2020; Klein et al., 2001). Tectonic-fault earthquakes result from gravitationally induced ruptures of the side of the volcano along shallow décollement faults that dip from about 1°–9° at a depth of about 5–13 km or through elastic strain release along other faults and oceanic fracture zones. The volcanic flank deforms as magma is injected into the rifts which applies lateral stresses that promote fault failure (Cannon et al., 2007; Chen et al., 2019; Crosson and Endo, 1982; Klein, 2016; Klein et al., 2001; Lay et al., 2018; Montgomery-Brown et al., 2015; Walter and Amelung, 2006). This activity causes continual displacements which are observed as ∼8 cm/year of motion accommodated across those faults (e.g. Montgomery-Brown et al., 2015). Over long time periods of several hundreds to thousands of years, these processes could lead to cyclical behavior. Over the historical record, however, the timing of volcanic eruptions and moderate to large earthquakes (M > 6) indicates that this does not seem to be the case (Klein et al., 2001). The short-term seismicity of large earthquakes does not seem to be very periodic and often occurs in short bursts of clustered behavior with variable periods of quiescence between active periods. Earthquake rates and volcanic activity vary significantly over the typical 50-year intervals considered in building codes. While correlations of volcanic activity and large earthquakes (M6+) are not obvious in Figure 2, several scientific publications discuss potential correlations. For example, Swanson et al. (1976) suggest that the 1975 earthquake modified pressures to enable the 1983–2018 Pu’u ’Ō’ō-Kupaianaha eruptions and the 1868 earthquake triggered eruptions on Mauna Loa. Klein et al. (1987) and Klein et al. (2001) described correlations between Mauna Loa eruptions and large décollement ruptures and suggested that lower Mauna Loa eruptive activity since 1951 may signal a period of lower hazard for earthquakes along the Mauna Loa flanks. Wyss and Koyanagi (1992a) indicated that extrusive and intrusive activity on the active volcanoes varies greatly and can lead to significant variability in strain rates.
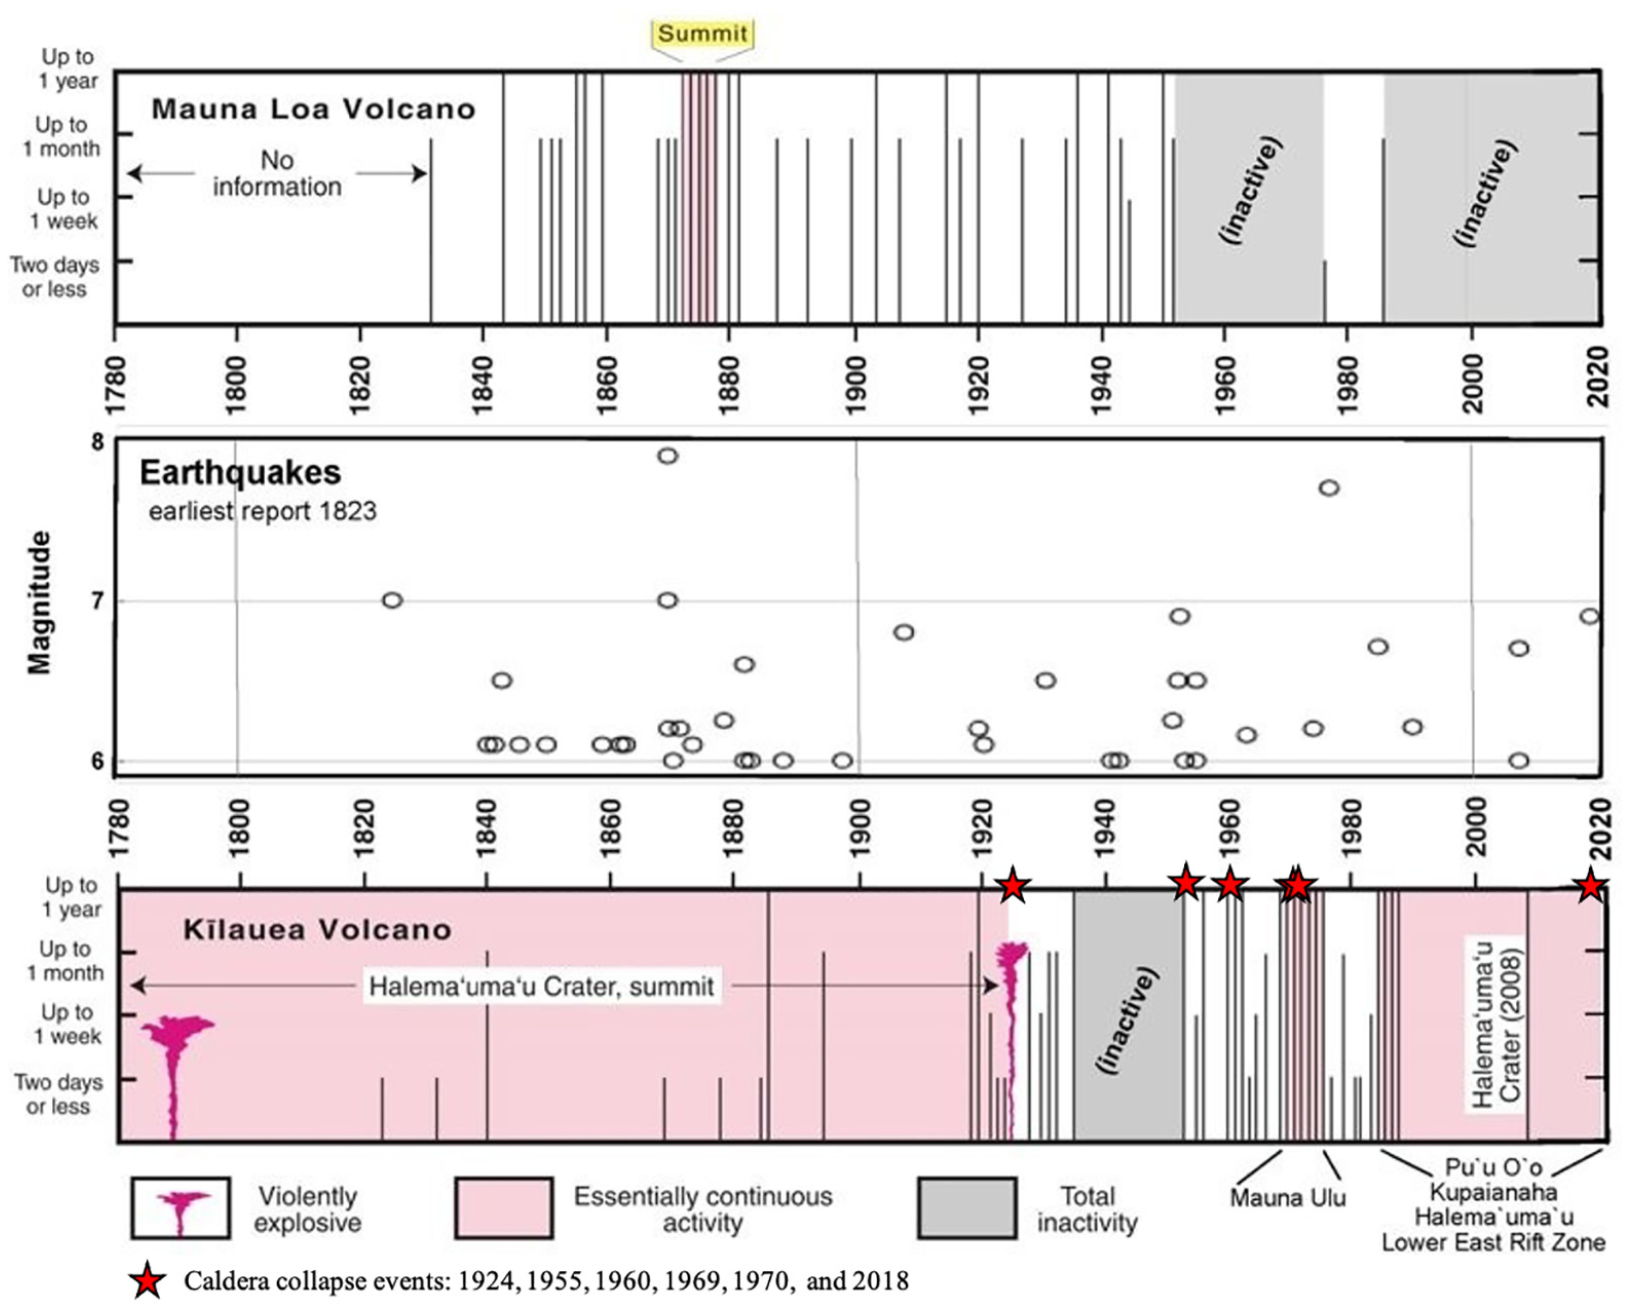
Correlations of episodic volcanic eruptions and moderate to large earthquakes (M6+) on the Island of Hawai’i. Six Kīlauea caldera collapse events are shown as stars (symbols for eruptive periods in 1969 and 1970 overlie one another). Timeline adapted from Tilling et al. (2010) with earthquake information from ComCat (2021).
Moderate to large damaging tectonic-fault earthquakes have occurred on the Island of Hawai’i over the past two centuries (Figure 1), including the 1868 Great Ka’u earthquakes (magnitude intensity 7.9 (mainshock) and 7.0 (aftershock)), Wyss (1988), Wyss and Koyanagi (1992a), 1951 Kona earthquake (M6.9, Beisser et al., 1994), 1975 Kalapana earthquake (M7.7, Nettles and Ekstrom, 2004), 1983 Ka’ōiki earthquake (M6.7), and the 2018 Kalapana earthquake that may have re-ruptured a portion of the 1975 rupture (Liu et al., 2018; ComCat, 2021; M6.9, Lay et al., 2018; Chen et al., 2019; M7.2). Tectonic-fault earthquakes can cause high levels of shaking similar to earthquakes in other active regions such as California (McNamara et al., 2020a, 2020b).
Tectonic-flexure earthquakes can be moderate or large in magnitude and are located in both the crust and upper mantle (with depths down to about 60 km) and have varying mechanisms that are dependent on the orientation of the bending stresses (Figure 1; Klein, 2016). They are thought to be caused by stresses caused by the weight of the overlying volcanic rock (Klein, 2016). They contribute to hazard near the Island of Hawai’i and along with elastic ruptures on oceanic faults are the principal seismic hazard sources for islands in the northwest. Flexure-type earthquakes, such as the 2006 Kīholo Bay M6.7 earthquake, which occurred at 38 km depth off the northwestern coast of the Island of Hawai’i, mainly occur in a circumferential zone surrounding the island and in the flexural bulge through Maui County as far away as O’ahu. Other deep earthquakes include the M7 Maui in 1938 and M6.2 Honomu in 1973 (Wong et al., 2015). Tectonic-flexure and earthquakes on oceanic fractures contribute to the ground shaking hazard especially at sites away from the southern and western flanks of the Island of Hawai’i. PGA from these earthquakes can be high, for example, exceeding 1 g at a site near the 2006 earthquake sequence (Wong et al., 2015). On the islands northwest of the Island of Hawai’i, the rate of damaging earthquakes occur at about 10% to 30% the rate observed across the Island of Hawai’i (Tables 1 and 2; Klein, 2016; Klein et al., 2001). Eight M6+ earthquakes have been recorded near the northwest islands, including significant events near Maui (1938, M6.6) and Moloka’i (Lāna’i earthquake 1871, M6.8–7.5; Butler, 2020; Klein et al., 2001). These large earthquakes, along with additional local moderate-sized earthquakes, have occurred near O’ahu (1948, M4.8) and caused damage to the highly populated capital city of Honolulu (Butler, 2020; Cox, 1986, 1987). Therefore, we cannot rule out large flexure or ruptures on oceanic faults near population centers on the northern islands (e.g. Moloka‘i Fracture Zone: Anchieta et al., 2011; Butler, 2020).
Earthquake catalog, declustering, b-values, smoothing, and rate parameters
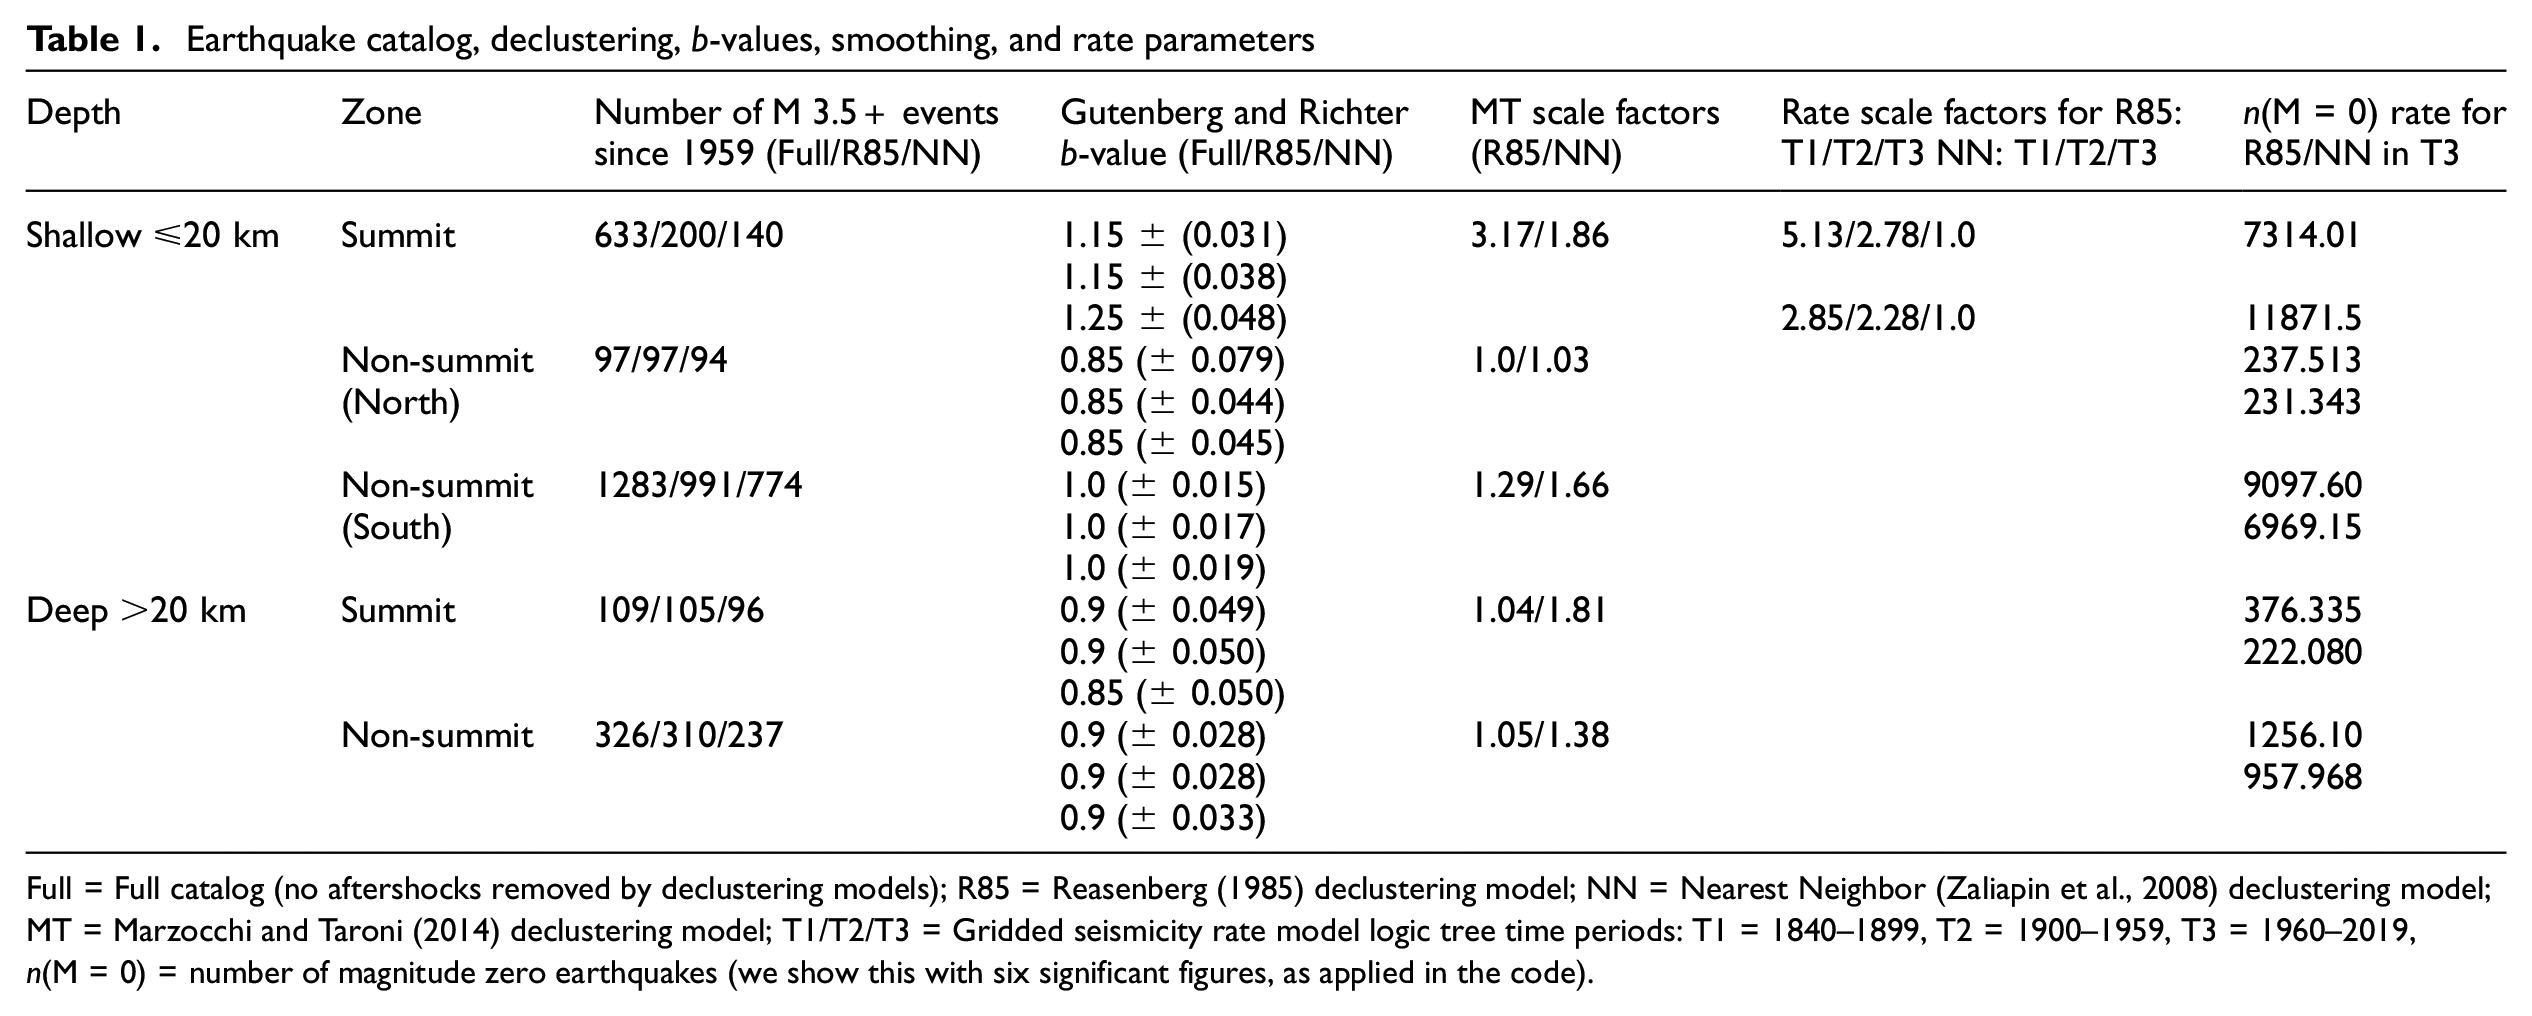
Full = Full catalog (no aftershocks removed by declustering models); R85 = Reasenberg (1985) declustering model; NN = Nearest Neighbor (Zaliapin et al., 2008) declustering model; MT = Marzocchi and Taroni (2014) declustering model; T1/T2/T3 = Gridded seismicity rate model logic tree time periods: T1 = 1840–1899, T2 = 1900–1959, T3 = 1960–2019, n(M = 0) = number of magnitude zero earthquakes (we show this with six significant figures, as applied in the code).
GMMs used in the 2001 and 2021 Hawaii NSHMs
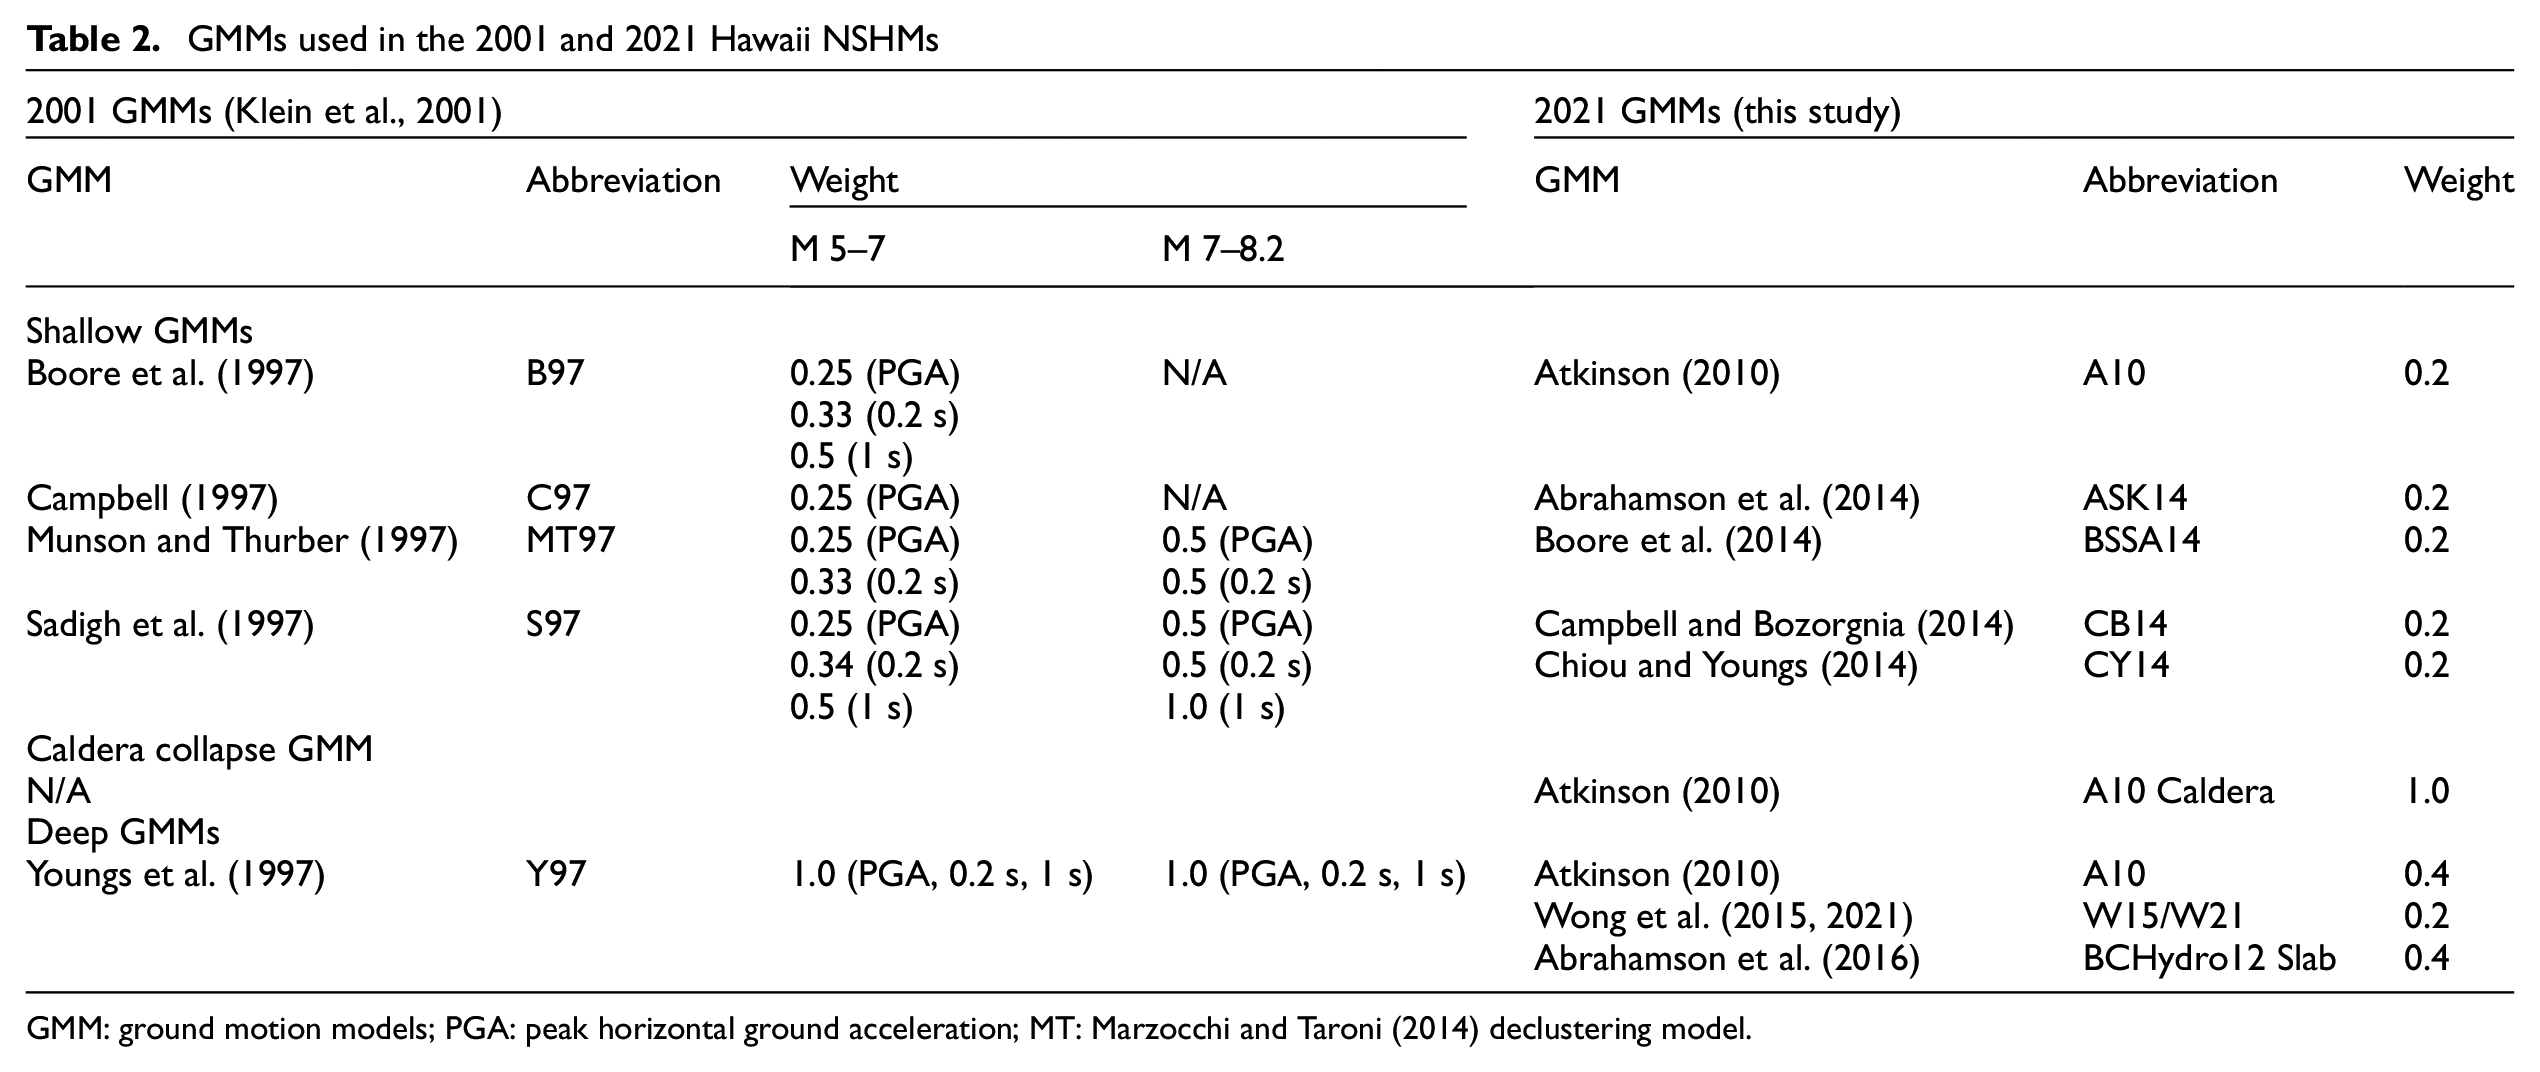
GMM: ground motion models; PGA: peak horizontal ground acceleration; MT: Marzocchi and Taroni (2014) declustering model.
Volcanic earthquakes and related caldera collapse seismogenic events often generate moderate-size earthquakes which can also influence earthquake hazard (Klein et al., 1987, 2001); These volcanic earthquakes typically occur with moderate magnitudes around M5 and at depths between 2 and 4 km and are caused by flow of magma, gases, or other fluids through cracks and conduits within various types of storage reservoirs under summit calderas and the more distal rift zones which comprise the active volcanoes (Klein, 2016). During the 2018 Kīlauea eruption, much of the summit magma reservoir drained and triggered a partial collapse of the caldera floor. HVO recorded 62 shallow caldera collapse events over 3 months that caused persistent, almost daily, seismogenic shaking (M4.8–5.2) leading to the severe damage of the building that housed HVO (Loomis, 2019; Neal et al., 2019; Shiro et al., 2021). We use these events to assess hazard at Kīlauea only, although this could be applied more broadly for other volcanoes such as Mauna Loa in future models. Other than the caldera collapses, the volcanic earthquakes are not modeled explicitly and are considered as part of the gridded background seismicity model.
The 2021 Hawaii seismic hazard assessment requires nine important datasets and modeling techniques to inform the earthquake rate forecasts and ground shaking models. The 2021 Hawaii seismic hazard assessment depends on (1) an earthquake catalog, (2) declustering models that identify independent earthquake mainshocks by removing suspected foreshocks and aftershocks, (3) seismicity rate models that include temporal variability in earthquake rates, (4) maximum earthquake magnitude (Mmax) models that account for the potential maximum sizes of earthquakes on each of the input sources, (5) earthquake smoothing models (gridded seismicity models) that assume large earthquakes will likely occur in the vicinity of smaller historical seismicity, (6) a model for assessing caldera-collapse seismogenic events, (7) fault models that account for ruptures on known or suspected faults/décollements, (8) GMMs that relate deep- and shallow-earthquake ground shaking to a range of magnitudes and distances, and (9) site effect models that allow amplification or de-amplification of ground shaking for different site conditions. These nine models are described in the following sections.
Hawaii earthquake catalog
For forecasting earthquake rates, one of the most important sources of information for this analysis is the historical earthquake catalog, which is divided into the following subcatalogs: (1) three 60-year periods (1840–1899, 1900–1959, 1960–2019), (2) shallow non-summit (northern area), (3) shallow non-summit (southern area), (4) deep non-summit, (5) shallow volcanic summit, (6) deep volcanic summit, and (7) caldera collapse events (Figure 1b and c). These catalogs are separated from the full catalog because they differ in accuracy of locations and magnitudes, completeness levels, rates, and source mechanisms. We define shallow earthquakes as those with hypocentral depths ≤20 km and deep earthquakes as those having depths ≥20 km, as in the 2001 model. The 20-km depth is thought to be consistent with the neutral plane of flexure where horizontal stresses change sign (Klein, 2016). Figure 1c shows a slight break in activity at 20-km depth where fewer earthquakes have been observed (Klein et al., 2001). We categorize volcanic summit earthquakes as those occurring near the Kīlauea, Mauna Loa, and Lō’ihi volcanoes and non-summit as earthquakes located in all other areas along the island chain (Figure 1). Caldera collapse earthquakes were separated from the full catalog to account for their special collapse mechanisms during the 2018 volcanic activity within the Kīlauea caldera that are thought to be induced by magma withdrawal (Anderson et al., 2019; Neal et al., 2019).
We have updated the Klein et al. (2001) catalog for this hazard model. The Klein and Wright (2000) and Klein et al. (2001) earthquake catalog ended in June 1997, and for this study we have added 9838 M2.5+ events from July 1997 to April 2019 from ComCat (2021) to supplement the earlier catalog. To make a full catalog covering the time period from October 1959 to April 2019, catalog files from three primary sources were processed and combined: (1) ComCat (2021), which includes seismicity from the HVO catalog and (2) the Hawaii part of the historical catalog developed by Stover and Coffman (1993) that lists principal US earthquakes (sometimes called US History, or USH). The two original catalogs were reformatted to the standard NSHM catalog format (Mueller, 2019) and trimmed to the Hawaii study region. For each earthquake, a uniform moment magnitude (M) was estimated (Mueller, 2019; ML, Md, and mb magnitudes are assumed equivalent to M), and local time was adjusted to Coordinated Universal Time (UTC) as needed. The HVO catalog in ComCat lists 21,148 earthquakes with M ≥ 2.5 earthquakes prior to 2009 having extensive human review quality control and earthquakes of that size post-2009 lacking as robust manual review quality control during certain periods such as the 2018 eruption. Okubo et al. (2014) describe the history of earthquake catalog production at HVO. The USH catalog lists 117 earthquakes with M ≥ 3.7. These two processed catalogs were merged and sorted chronologically (catalog hmm.c1). Duplicates were identified and deleted using a time and distance windowing scheme similar to that described by Mueller (2019). The resulting catalog includes earthquakes with 61% originating from HVO and 39% from ComCat. Table 1 shows the number of M5+ earthquakes included in the model.
We analyzed the Hawaii catalog for completeness, separating the data into the regions defined by Klein et al. (2001) and time periods based on both decades and obvious changes in catalog character judged from magnitude–time plots. Completeness was judged using 0.1 magnitude unit bins and the maximum curvature, goodness-of-fit (Wiemer and Wyss, 2000), and b-value stability methods (Cao and Gao, 2002). Based on those results, the catalog was divided into two regions: the earthquakes surrounding the Island of Hawai’i and the rest of the island chain out to Kaua’i (Figure 1a). Based on this approach, the post-1960 catalog appears to be complete above M3.0 over the Island of Hawai’i and M3.5 for earthquakes on islands to the northwest. This is true for the full and declustered shallow and deep subcatalogs. We apply an M3.5 completeness for earthquakes after 1960 for the 2021 NSHM. Using those constraints, the Gutenberg and Richter b-values (slope of the magnitude frequency distribution) were determined using maximum-likelihood (Aki, 1965), corrected for binning (Utsu, 1966), with uncertainties using bootstrap resampling (Amorese et al., 2010). Klein et al. (2001) also estimated that M5.9 earthquakes are complete back to 1868 for most of the state and back to 1904 for M5.2 earthquakes on the Island of Hawai’i. We analyze the cumulative M5 and M6 rates back to 1840, which are slightly larger than the estimates of Klein et al. (2001). We down-weight the rates obtained from the earlier catalogs because of these potential completeness, location, and magnitude issues in the earlier catalogs. Rates are significantly higher in these early periods (pre-1960), and if the earthquake numbers are incomplete, the rates in the earlier periods would be even greater than what we show in Table 1. As in the 2001 model, we feel it is important to account for potentially higher rates in the hazard forecasts.
Table 1 shows statistical parameters associated with these catalogs including b-values, the number of earthquakes for each catalog, and rate scaling parameters applied in the assessment. We use the 1960–2019 catalog to define the relative rates in each of the catalogs because these events are the best located and characterized earthquakes. Earthquake rates for M5+ are a factor of 2–6 times higher in the two pre-1959 periods than in the post-1959 catalog, indicating a significant temporal rate change, which is discussed further in section “2021 Hawaii NSHM input data and models.” Earthquakes are more numerous and more densely clustered in the southern part of the Island of Hawai’i than earthquakes spread across the islands to the northwest. The shallow and deep earthquakes are generally spread across the entire region (Figure 1) with rates of shallow earthquakes about a factor of 4 more frequent than deep earthquakes (mostly due to the intense seismicity in the southern portion of the Island of Hawai’i. The b-values for both shallow and deep earthquakes were estimated for the full catalog and the two declustering methods using maximum likelihood (Aki, 1965; Shi and Bolt, 1982), and 1-standard deviation uncertainties were calculated using bootstrap statistics (Amorese et al., 2010; Table 1). The b-value of the Gutenberg–Richter distribution was determined using seismicity from 1960 onward, which represents the longest time period with a high-quality catalog. An earlier starting time reduces the size of the dataset by reaching back into times when the magnitude of completeness is higher. A later starting time reduces the size of the data set by decreasing the duration without substantially decreasing the magnitude of completeness. The stability of the results with respect to the magnitude of completeness was checked by inspection.
Declustering models
In conducting a PSHA, we typically decluster a catalog to remove dependent earthquakes such as foreshocks or aftershocks in order to derive stationary Poissonian rates of independent earthquakes (e.g. Petersen et al., 2020). The declustered catalog should be temporally and spatially unbiased so it can be used to assess mean rates of future independent earthquakes across the region (Frankel et al., 1996; Llenos and Michael, 2020, 2021; Marzocchi and Taroni, 2014). NSHM for Hawaii considers the full catalog and several declustered catalogs in forecasting earthquake rates. We considered using the Gardner and Knopoff (1974) declustering model applied in other NSHMs (Petersen et al., 2020) and the Llenos and Michael (2020) ROBERE declustering model. However, these models did not seem to perform well, removing a majority of the earthquakes in the catalog, perhaps because the parameters were not suitable for seismicity rates that change rapidly due to time-varying volcanic processes. Therefore, these models were not applied in the final model. For this Hawaii assessment, we considered the Reasenberg (1985; R85) and nearest neighbor (Zaliapin et al., 2008; NN) declustering models. We did not manually decluster the older large earthquakes in the catalogs as in the 2001 NSHM but feel that these two alternative models are sufficient to allow epistemic uncertainty in the categorization of the dependent and independent earthquakes for the purposes applied here.
The R85 catalogs were declustered using default parameters from R85, with the exception of τmin (the minimum look-ahead time window within which we consider adding events to a cluster), which was set to 2 days instead of 1, and P (the probability of detecting the next event in the cluster), which was set to 0.99 instead of 0.95. These parameter values are Hawaii-specific and consistent with the models applied in the 2001 model. Similarly, we also applied a maximum distance of 30 km within which to consider adding events to a cluster in order to avoid removing unrelated earthquakes in different tectonic areas. We considered applying R85 declustering models that account for location errors, but because we do not have access to reliable location error estimates for many of these earthquakes, in the end we did not use these more complex models.
An alternative declustering model that has been developed more recently is the nearest-neighbor (NN) model. This model separates seismicity into independent and clustered events based on the bimodal behavior of the two-dimensional distribution of time and distance separation between nearest neighbors in the catalog. The main parameters are the Gutenberg–Richter b-value, the fractal dimension df of the earthquake locations, and the cluster threshold parameter η0. Here, we use the b-values of the catalog being declustered, and df = 1.6 (Zaliapin and Ben-Zion, 2013). We objectively determine η0 by fitting a Gaussian mixture model to the distribution of nearest-neighbor space–time distances and finding the point where the two Gaussians intersect (Hicks, 2011).
Table 1 outlines the number of earthquakes in the declustered catalogs. The R85 model tends to remove fewer earthquakes than the NN model. While the full catalog includes 1391 events in the non-summit shallow region since 1960, the R85 declustered catalog contains 1099 events (21% of earthquakes have been removed), and the NN catalog contains 879 events (37% of events have been removed; Table 1). These declustered catalogs are the basis of the primary model produced here.
Marzocchi and Taroni (2014) suggest that declustering can lead to significant underestimation of the true seismic hazard, but that it is useful to minimize the bias caused by clustered seismicity when estimating the long-term spatial distribution of all earthquakes (including triggered earthquakes). For this assessment, we want to see the impact of considering the full number of earthquakes in the catalog. To assess this impact, we apply the approach of first declustering to remove the spatial bias due to aftershocks, and then scaling the number of earthquakes in the declustered catalogs to equal the number in the full catalog while accounting for differences in b-values. This renormalization has the effect of essentially redistributing the full catalog of seismicity into the areas where earthquakes are more likely to occur over the long term. During our 18 November 2020, Hawaii workshop, participants expressed concern about application of the scaled rate grid model in the building code maps, so we decided to produce two models: (1) a primary model that only accounts for the declustered catalogs as previously applied in the conterminous US and (2) a research model that accounts for modified earthquake rate grid scale factors that consider the differences in b-values between the full and declustered catalogs (Table 1). In the future, we could consider a single hazard model that combines weighted declustered models from the primary and research models. In our current logic tree, we apply equal weights (0.5) to the R85 and NN declustered models. Seismicity catalogs used in this analysis can be found in Rukstales et al. (2021).
Seismicity rate models
A comparison of the number of earthquakes in the 1840–2019 earthquake catalogs indicates a temporally decreasing average rate of earthquakes, a point also made by Klein et al. (2001). This rate change could be caused by a lack of knowledge of earthquake sizes and locations before the establishment of regional and local seismographic networks around 1960 or could be consistent with a real decrease in rate during the most recent time. Correlations between large earthquakes and volcanic eruptions have been recognized in previous studies (e.g. Klein et al., 2001; Wright and Klein, 2006) (Figure 2). Very little volcanic activity has been associated with Mauna Loa over the past several decades, and this lack of volcanic activity could help explain why the rates have declined in recent years (Klein et al., 2001). We have no reason to suggest that future rates will remain low and not revert back to the higher rates observed in the pre-1960 catalog, because we do not understand the processes controlling hot spot volcanism and related seismicity.
For the 2021 Hawaii model, we consider three 60-year full (non-declustered) subcatalogs from 1840–1899, 1900–1959, and 1960–2019, which contain 349, 223, and 52 earthquakes M5 + and 43, 22, 7 earthquakes M6+, respectively, before declustering. Our primary hazard analysis utilizes the declustered catalog, and during these same three periods, the R85 subcatalog contains 20, 21, and 5 M5+ events in the region north of the Island of Hawai’i and 50, 96, 37 events in the south region including the Island of Hawai’i and southern areas (Figure 1); the NN subcatalog contains 14, 20, 5 M5+ events in the north and 24, 62, 31 in the south. Average rates of M5+ declustered earthquake rates are 2–6 times higher for 1840–1899 and 1900–1959 compared with the rates determined for 1960–2019 (Table 1). We generate the smoothed (declustered) rates for the 1960–2019 period and then apply productivity or scale factors shown in Table 1 to account for increased activity prior to 1960.
We tested whether this rate change is statistically significant by calculating the rate of M6+ earthquakes on the Island of Hawai’i from 1959 to 2019 (61 years) and then ensuring that this rate is consistent with the observed number of M6+ earthquakes from 1868 to 1959 (91 years). Using bootstrap resampling with 10,000 trials to estimate the uncertainties in the a- and b-values of the post-1959 magnitude frequency distribution (Amorese et al., 2010), we find that the rate of M6+ earthquakes extrapolated from the distribution is between 2.4 and 3.3 over 61 years (95% confidence limit). This leads to a predicted range of 3.6 to 4.9 M6+ earthquakes in 91 years, which is significantly smaller than the 43 M6+ earthquakes observed in the 91 years before 1959. Given an expected rate of 3.6–4.9 earthquakes, the probability of observing 43 or more is close to 0 (less than 1E-27). The physical basis of the rate change may not be known at this time, but the rate change is statistically significant.
We separated the northern and southern regions of the catalogs to confirm that the forecasts for northern earthquakes were not being overwhelmed by the much higher numbers of earthquakes across the southern region. We find that our NSHM for Hawaii in the northern region using the R85 model predicts 35 earthquakes compared with the 46 events observed in the R85 catalog and using the NN model predicts 24 earthquakes compared with the 39 observed in the NN catalog. Modifying the scale factors, which are based on the total number of earthquakes (northern and southern regions) in the two pre-1960 declustered catalogs divided by the number in the post-1960 declustered catalog to improve the northern region forecast did not seem needed. The earthquake rate factors based on the total number of earthquakes account for 2–6 times higher rates observed before the latest catalog (post-1960).
Overall, the numbers of predicted and observed earthquakes are very similar for the three time periods. Magnitude–frequency plots and data from the three full catalogs (1840–1899, 1900–1959, and 1960–2019) for Hawaii illustrate the differences between the rates of earthquakes for M5+, 6+, and 7+ earthquakes (Figure 3; shown as colored lines). The modeled rates fit the M5+ observed earthquake rates perfectly and are also fitting well at the M6+ observed rates (shown as squares) for the other periods. We also show the gridded seismicity and décollement fault rates along with the total rate that also incorporates the caldera collapses at magnitudes close to M5. An important point of this figure is to show that the modeled rates match the observed rates across the island chain.
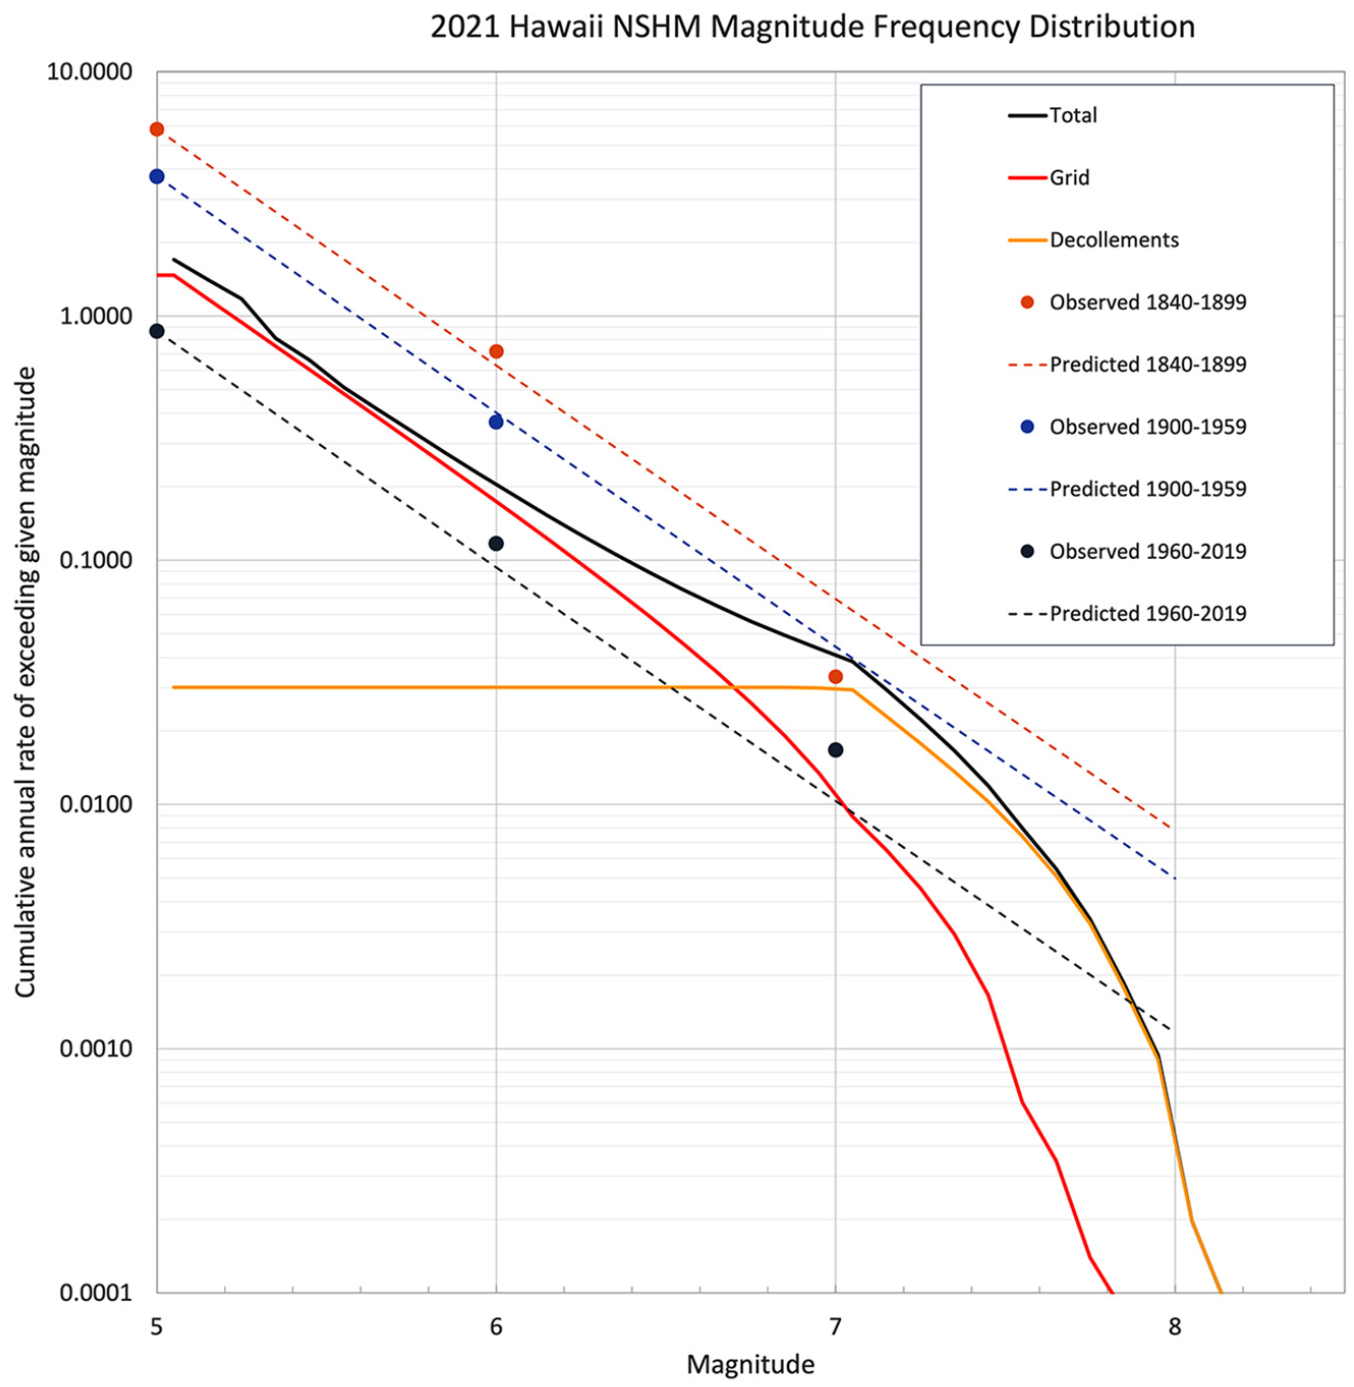
Magnitude–frequency distribution plot showing the 1840–1899, 1900–1959, and 1960–2019 and observed data from the earthquake catalog and the predicted rates from the NSHM. Solid lines show the predicted contributions from components in the model: gridded seismicity, décollement faults, and the total of these rates along with the caldera collapse rates.
Weights are assigned to models based on consideration of the total number of earthquakes recorded and the quality of the recording stations, which affect the estimation of earthquake magnitudes. Higher weights are assigned to the most recent period where earthquakes are better characterized and with the assumption that the most likely predictor of future activity is the recent past. We assign a weight of 0.25 to the two pre-1960 periods and a weight of 0.5 to the 1960–2019 rate branch.
Earthquake maximum magnitude models
Mmax considered in probabilistic hazard models are typically larger than those of historically observed earthquakes. This is because the Mmax should be at least as large as the largest observed earthquake and, for areas with short observation periods compared with the large temporal variability in Earth processes, it is prudent to account for earthquakes larger than observed in case we have not observed the largest potential events. One may underestimate the Mmax in regions with a short historical record for various reasons, including: not recognizing or considering faults or fault connections that may seem unimportant at the time; misunderstanding past earthquake sizes, locations, or mechanisms; not recognizing relationships with other nearby earthquakes; or not accounting for other important physics-based inputs that are currently known or unknown (e.g. stress release and interaction mechanisms). Seismic hazard analysts across the globe have recently increased Mmax models to account for the potential for larger events. For example, Mmax was reconsidered following the 2011 Tohoku earthquake, which was much larger than anticipated. For these reasons the USGS has increased the Mmax compared with previous Mmax models in NSHMs for earthquakes across the conterminous US to ∼M8.0+ to account for unknowns in future earthquake occurrences.
Our understanding of large earthquake generation in Hawaii is quite limited due to a relatively short observation period and lack of geologic and physics-based studies that describe earthquake generation. Earthquakes up to at least M7.9 are thought to occur on décollement faults because this is the modeled magnitude of the 1868 Great Ka’u earthquake (Wyss, 1988; Wyss and Koyanagi, 1992a). The 2001 model allowed for earthquakes up to M8.2 on the southern décollement and M7 on the western décollement. The following research topics could help to understand Hawaiian seismic hazard: (1) the earthquake sizes Hawaiian faults can host, (2) whether décollement ruptures can exceed the M7.9 observed size, and (3) whether earthquakes can also rupture on unrecognized faults. Wyss and Koyanagi (1992b) point out that volcanic rocks of the Island of Hawai’i overlie the oceanic sediment layer, a geologic discontinuity that can cause décollement-type ruptures, and must be assumed to be present everywhere at the base of the island and not restricted to the southern coastal region. Wyss and Koyanagi (1992a) proposed two seismic gaps on the western flank and suggested that décollement earthquakes from M6 to M7.5 could fill the region defined between the 1868 and 1951 (M6.9) earthquakes. Our work supports the Klein et al. (2001) and Wyss and Koyanagi (1992a, 1992b) conclusions that flank earthquakes could reach M8.2 since the area of the flanks is large enough to host larger events, and we have observed a M7.9 event on an analogous flank. The seismicity indicates that such décollement faults could underlie other portions of the islands beyond the southern and western flanks. Future studies could potentially rule these possibilities out and reduce these uncertainties; such studies are encouraged.
Besides décollement faults, we also need to assess the sizes of crustal and mantle earthquakes that are closer to the islands northwest of the Island of Hawai’i. In general, we do not have much evidence that oceanic faults in or near Hawaii have hosted large earthquakes. Studies have recognized fracture zones (e.g. Moloka’i and Maui fracture zones), topographic lineaments, and seismicity trends that cross near these islands (e.g. Butler, 2020; Wolfe et al., 2004). New interpretations by Butler (2020) indicate that the 1871 Lāna’i earthquake magnitude was closer to M7.5 than 6.9 as listed in the ComCat catalog, and this event could have occurred on an oceanic fracture zone. The mechanism and location of this earthquake is currently poorly constrained. In addition, we have seen global oceanic faults hosting larger earthquakes than expected. For example, M8+ earthquakes have ruptured on oceanic structures in the Indian and Pacific Oceans that were not well understood beforehand (e.g. strike-slip motion on complex conjugate faults and flexure on the outer rise of subduction zones). While these great earthquakes were not related to hotspot tectonics as in Hawaii, they do illustrate that flexural and tectonic forces within oceanic lithosphere can result in large earthquakes. Since our knowledge of such earthquakes is limited, especially as related to Hawaii, this lack of information should be considered by allowing for maximum magnitudes larger than observed.
For this assessment, we allow potential décollement-type fault ruptures like the 1868 earthquake in areas where we have not recognized such faulting. The large earthquakes in the model typically have low probabilities for occurrence since seismicity rates are much lower than on the southern décollement. While M7.7 and 8.0 earthquakes for Hawaii are not the most likely scenarios, they cannot be ruled out; therefore, these larger magnitudes are given significantly lower weights in the logic tree with lower 0.2 and 0.1 weights, respectively, based on discussions with subject matter experts at our two public workshops. In this hazard assessment we account for variable maximum magnitudes in the seismicity models, caldera collapse, and the décollement models for the west and south flanks. For the seismicity models, we allow three maximum earthquake sizes for the gridded seismicity: M7.5 (weight = 0.7, the recommended Mmax at our 18 November 2020, Hawaii workshop), M7.7 (weight = 0.2), and M8.0 (weight = 0.1). These three Mmax values apply everywhere except for the shallow gridded seismicity sources under the décollement sources where the Mmax is truncated at M7.0 to avoid double-counting. The west flank décollement includes (1) the Klein et al. (2001) model geometry which incorporates two zones for Kona and Hualālai (KON and HUA) that each have two equally weighted branches with maximum magnitudes of M7.0 and M7.5 with additional aleatory uncertainty and (2) the two proposed updated geometries that both allow earthquakes up to M8 with epistemic uncertainty of ±0.2 magnitude units (weights = 0.2, 0.6, 0.2) with no additional aleatory uncertainty on Mmax. The south flank décollement includes two geometries with the same Mmax maximum distribution as in the west flanks up to M8.0 ± 0.2.
Earthquake smoothing models
As in previous NSHMs, the locations of shallow and deep seismicity in the earthquake catalog are used to forecast the locations of future earthquakes with some allowance for spatial uncertainty. The earthquake catalog-derived rate forecasts are applied by using an adaptive smoothing technique that assumes less smoothing in areas where earthquakes occur in close proximity to each other and more smoothing in areas where earthquakes more widely distributed (Helmstetter et al., 2007). A fundamental assumption of this approach is that small earthquakes forecast the location of larger magnitude earthquakes; the spatial rate forecast is preferentially controlled by the locations of smaller-magnitude earthquakes. For this analysis, we base the model on the rates of M3.5+ earthquakes, which is similar to the completeness magnitude across the entire island chain. Consequently, the rate forecast for the Hawaii component of the NSHM reflects the spatial density of earthquakes observed in the earthquake catalog—high rates on the southeast portion of the Island of Hawai’i, with rates tapering to the northwest toward Kaua’i. In areas where no earthquakes have occurred in the catalog since 1960, the forecast rate will depend on the distance to historical earthquakes. For example, near Honolulu, the forecast earthquake rates are controlled by diffuse seismicity surrounding O‘ahu. More distant earthquakes, such as the Lāna’i earthquake sequence near Maui, also contribute to shaking hazard near O’ahu.
The 2001 Hawaii NSHM applied a fixed 10-km smoothing distance algorithm and a ramp-type model to extrapolate earthquake rates to lower seismicity areas. To develop the new hazard model, we generated adaptive smoothing, fixed smoothing, and ramp-type results for comparison. The adaptive model prescribes tight kernels and smoothing distances that can be 10 km or smaller in the southern portion of Hawaii. In areas of sparse seismicity such as northwest of the Island of Hawai’i, smoothing distances are much larger, from tens of kilometers up to 100-km distances. After discussing the various smoothing models and impacts at community workshops and meetings, we determined that the adaptive smoothing model accounts for alternative smoothing distances and decay rates with distance from the hotspot at least as well as the alternative options of fixed smoothing values or ramp-type approaches.
We decided to only apply the adaptive smoothing and consider alternative smoothing distances based on the Nth smallest epicentral distances, which were determined from optimizing likelihood parameters (e.g. Moschetti, 2015). Unlike previous seismicity-based rate models, in which we only used the N-value corresponding to the highest likelihood parameter, we combined smoothed seismicity models from multiple N-values (with equal weights) that produced likelihood values within a few percent of the maximum likelihood. Using the adaptive model allows us to uniformly control smoothing in a way that accounts for alternative spatial variability and provides results that are like alternative fixed smoothing and ramp hazard. Logic trees for the shallow and deep gridded seismicity models are shown in Figure 4. The logic trees show the alternative catalogs, declustering models, rate models, Mmax, nearest-neighbor number, and GMMs applied in the gridded seismicity sources.
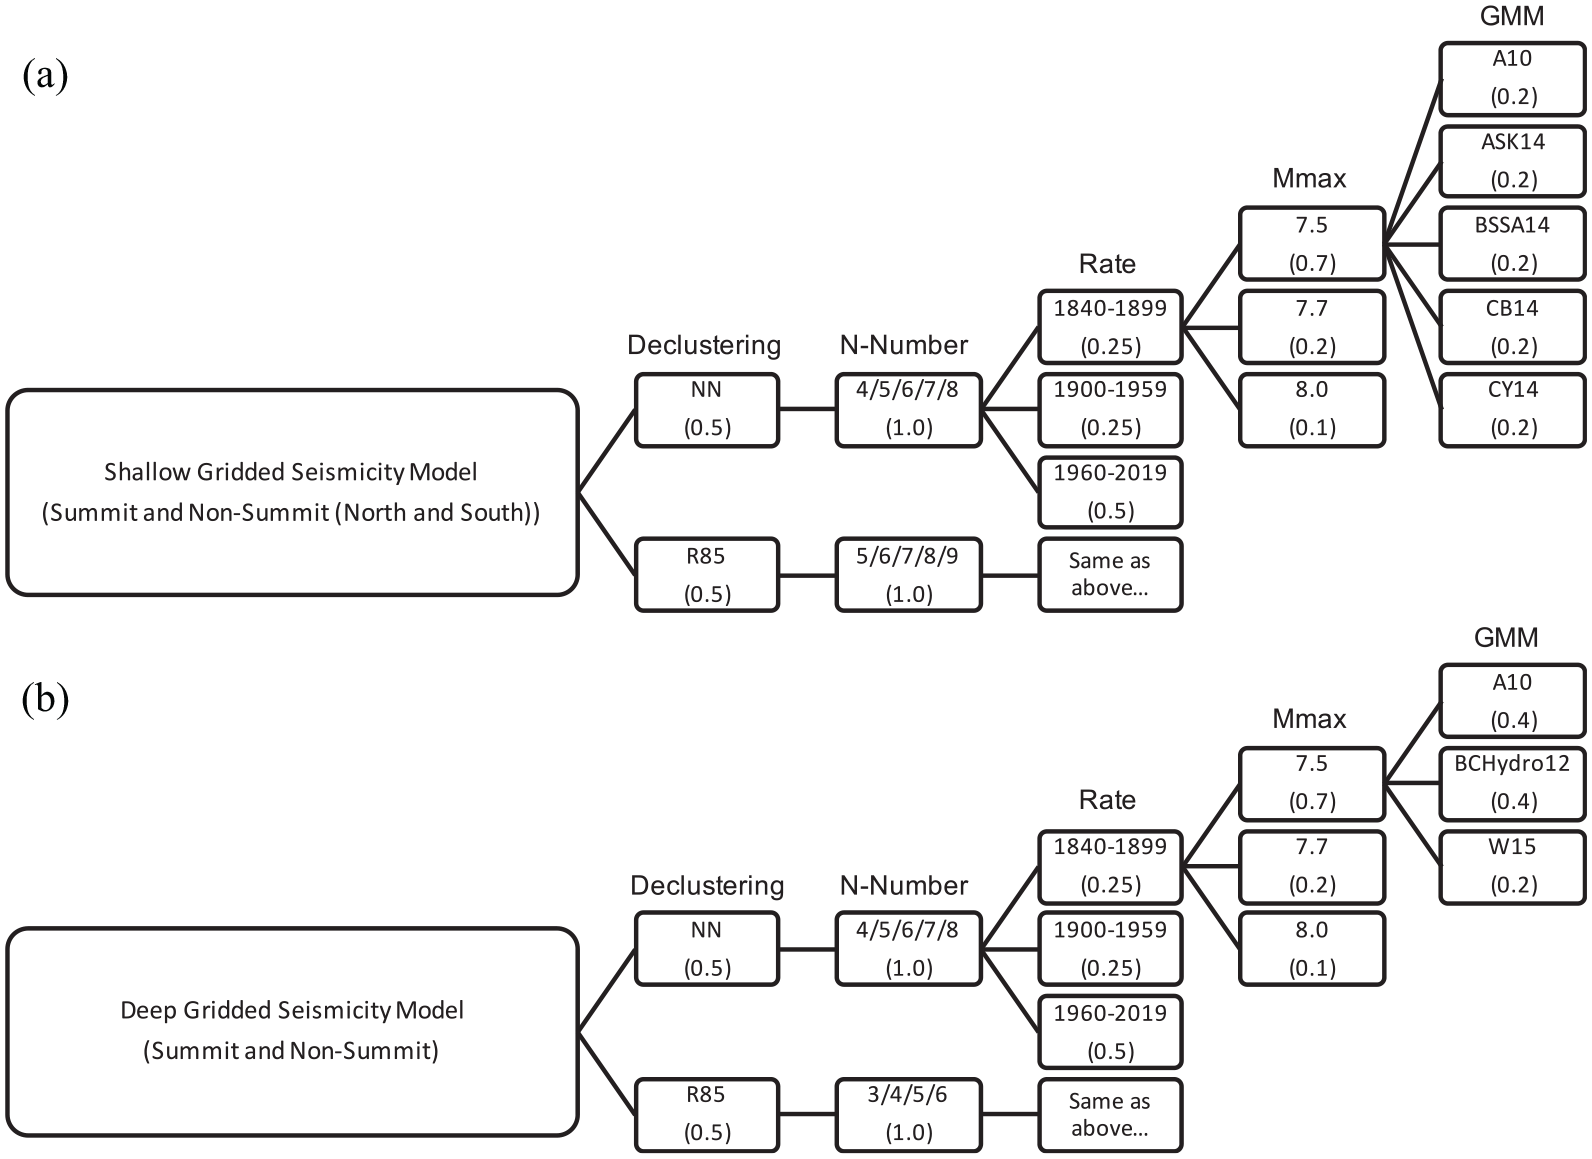
Logic trees for summit and non-summit gridded seismicity sources: (a) shallow and (b) deep.
Caldera collapse model and volcanic-earthquake correlation model
During the 2018 Kīlauea eruption sequence, 62 4.7 ≤ M ≤ 5.4 collapse earthquakes occurred almost daily with significant long-period shaking (Neal et al., 2019). The 0.5-s period spectral accelerations (Rekoske et al., 2019) for 40 M ≥ 5 collapse earthquakes average 0.35 g and were as large as 0.73 g at nearby seismic stations. Seismicity contributed to damage of infrastructure within the Hawai’i Volcanoes National Park, as well as to facilities at HVO. Clearly, these collapse earthquakes are a potential source of seismic hazard in the Kīlauea summit region, but such sequences are rare in the historically observed record (Figure 2). Computing the hazard from caldera collapse event sequences that happen infrequently and are highly clustered and non-Poissonian is a challenge.
We developed a simple way to model the seismic hazard due to Kīlauea caldera collapse events by treating them as a separate seismicity source characterized by (1) a rate of caldera collapses and (2) a distribution for the number of M ≥ 5 earthquakes that occur in a collapse (Llenos and Michael, 2021). For this assessment, we define a caldera collapse as a summit subsidence event that includes brittle deformation within the caldera. The rate of caldera collapses can be modeled as a Poisson random variable based on the six seismogenic subsidence events that have been observed at Kīlauea over the past 114 years (Figure 2; Kauahikaua and Mulliken, 2020). The negative binomial distribution provides a reasonable fit to the counts of M ≥ 5 earthquakes that have occurred during each of these caldera collapses. The combined distribution can be expressed analytically and computed recursively, resulting in a probability distribution for the number of M ≥ 5 collapse earthquakes during the forecast time window of interest (Llenos and Michael, 2021).
We model the caldera collapse region as a source zone of evenly distributed ruptures with a total rate of 0.205 events per year. This rate is spread over a narrow, symmetric maximum magnitude frequency distribution of M5.2, 5.3, and 5.4 earthquakes with weights of 0.13, 0.74, and 0.13, respectively. The weights reflect the relative proportion of M > 5 events observed during the past two caldera collapse events.
Once the collapse earthquake distribution model has been defined, we combine it with an appropriate GMM to assess the seismic hazard due to these events, described in the section below on GMMs. The logic tree used for the caldera collapse model is shown in Figure 5. For the current implementation, we calculate the hazard using a Poisson rate that has the same mean as the collapse earthquake distribution. This is adequate for low probabilities such as 10% in 50 years or lower but slightly overestimates the hazard at higher probabilities (Llenos and Michael, 2021).
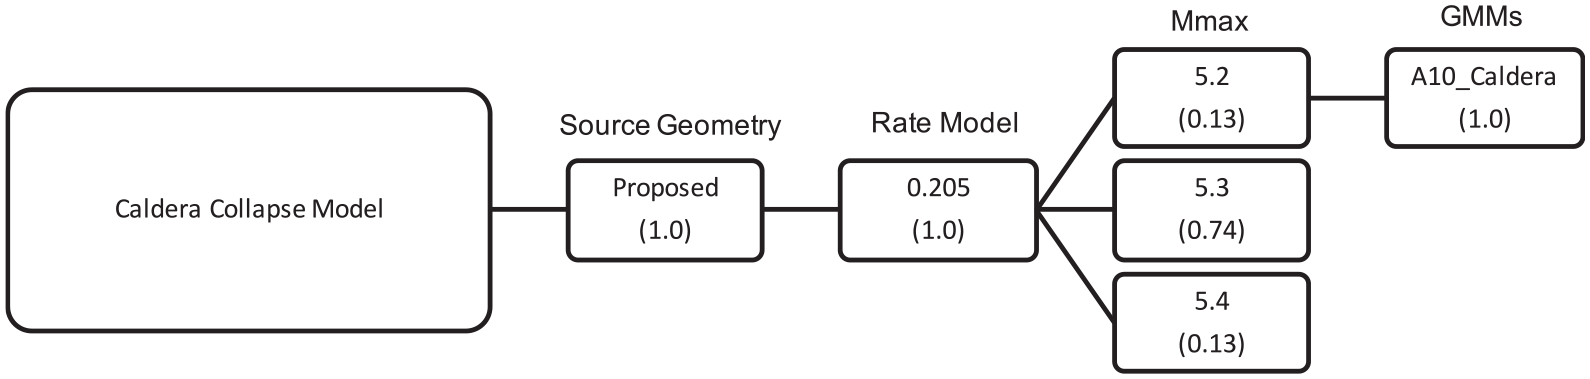
Logic tree for caldera collapse model.
Fault models
The most seismically hazardous structures on the Island of Hawai’i are décollement faults that are driven by gravity and magma intrusion through rifts (Klein et al., 2001). The 2001 Hawaii NSHM geometries for the southern and western décollement rupture sources were based mostly on the seismicity and fracture patterns shown in Figure 6a and b. They applied a kinked magnitude frequency distribution to account for an increased rate of large earthquakes on these décollements, which was necessary because the rates of large earthquakes obtained by extrapolating from the catalog were considerably lower than the rates observed over the past 150 years. In this section, we describe the inferred fault geometry, recurrence rates of décollements, and logic tree models applied in NSHM calculations. Magnitude–frequency distributions are shown in Figure 3.
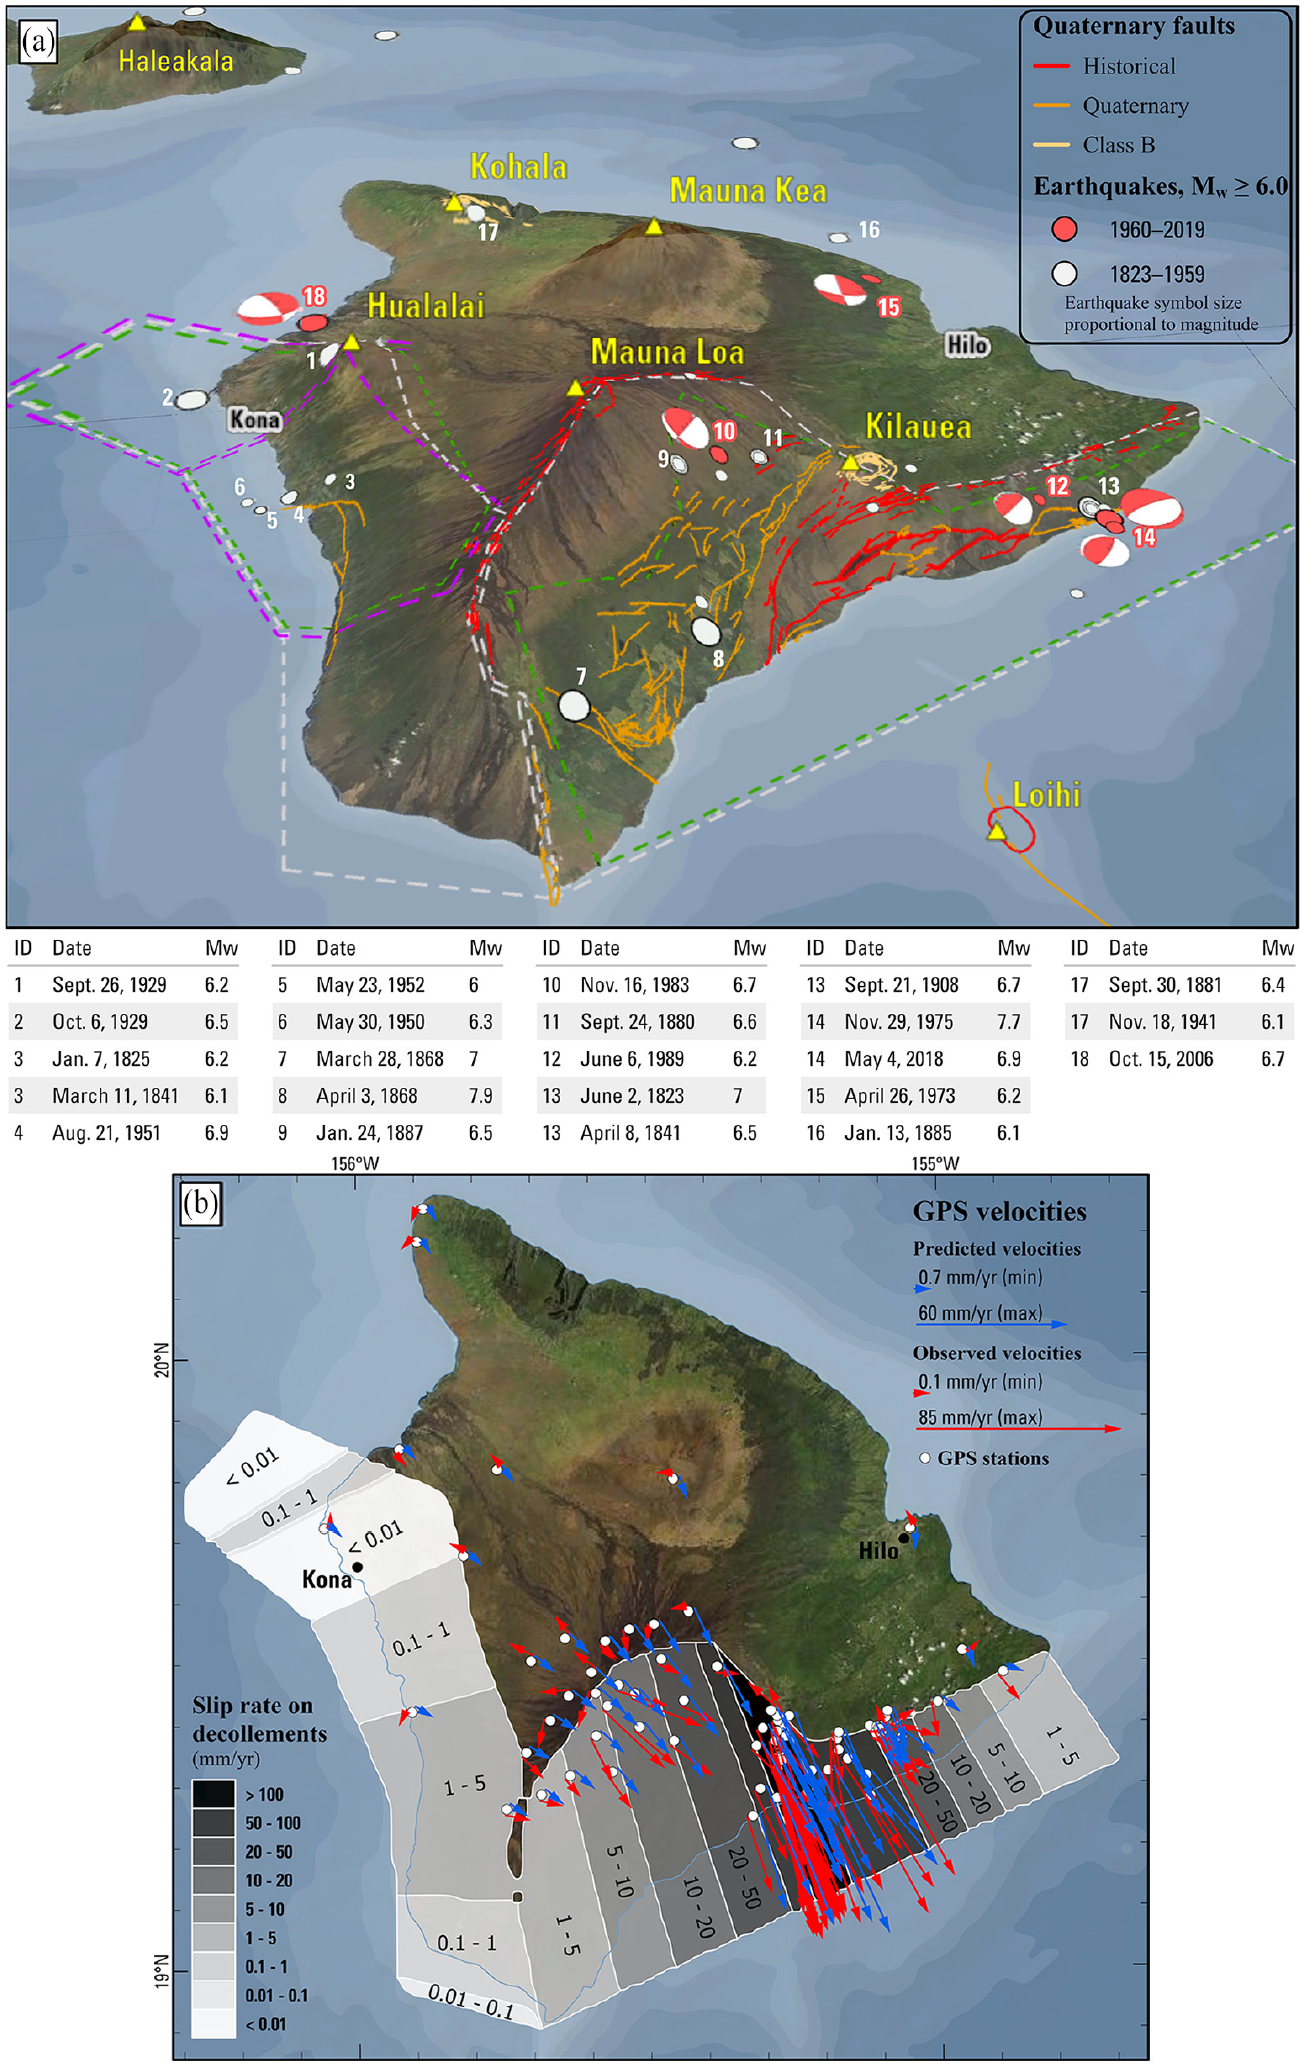
(a) Décollement zones from the 2001 NSHM (Klein et al., 2001; purple dashed lines) that are also used in the 2021 models for the Island of Hawai’i (green dashed lines) and the new geometries that extend farther south (white dashed lines), Quaternary faults, select focal mechanisms (Ando, 1979; Butler, 1982; Dziewonski et al., 1981) and (b) slip rate distribution along the southern and western décollements. The slip rates are color coded by their amplitudes with the color bar to the left. The observed GPS velocities are plotted in red arrows and the predicted GPS velocities are in blue. The average rates for the south and west décollements are 29.7 and 1.1 mm/year, respectively. GPS station locations shown as white circles.
Fault geometry
Evidence is abundant from historical earthquakes, strain rate studies, and reflection imagery for an Island of Hawai’i south flank zone of weakness at about 8–12 km depth (e.g. Montgomery-Brown et al., 2015). The fault geometry was defined by Klein et al. (2001) and Wyss and Koyanagi (1992b) based on seismicity and observed fracture patterns. While evidence is ample from historical earthquakes that the southern décollement is very active, considerable evidence indicates that the west coast of the island also contains décollement faults that can rupture in large damaging earthquakes. For example, these western zones have hosted an Ms6.5 in 1929 near Hualālai and M6.9 in 1951 near Kona. Gillard et al. (1992) calculated focal mechanisms and stress inversions and found that while the data cannot exclusively identify a preferred fault plane, the western décollement fault is highlighted by small earthquakes. These events often occur on a zone of weakness at about 10-km depth similar to the décollement identified on the south flank. Low-angle décollement types of mechanisms with an average slip vector that is almost horizontal are preferentially oriented toward the ocean away from the Mauna Loa south rift zone (e.g. Gillard et al., 1992; Wolfe et al., 2004). Beisser et al. (1994) attempted to identify source parameters of sparsely recorded earthquakes along the west flank using teleseismic waveforms. Their studies also support a tectonic model for the Kona coast that is similar to the south flank structures with a westward slip along a near-horizontal zone of weakness.
We base the 2021 geometries for the south and west flank earthquakes on those defined in Klein et al. (2001). For both the south and west flanks, we modified their geometries slightly based on new seismicity and faulting information (Figure 6a). For the west flank, we also include two new proposed geometries that extend to the southwestern portion of the Island of Hawai’i and account for potential earthquakes in that region that we cannot rule out. The new model is compared with the 2001 model in Figure 6a.
Recurrence rates
For inferring the recurrence rates of large magnitude earthquakes, we consider historical earthquake data and geodetically derived moment rates (Figure 3). As many as three or four large earthquakes (M ≥ 7) occurred over the past 150 years: the 1868 (M7.9), 1868 (M7.0, probably an aftershock of the M7.9 mainshock), 1975 (M7.7), and 2018 (M6.9, ComCat, 2021; Liu et al., 2018 using seismic information; M7.2 calculated by Lay et al. (2018) and Chen et al. (2019) also using geodetic and tsunami information). These are thought to have occurred on various sections of the southern décollement fault, with possible overlap of rupture areas for the 1975 and 2018 events. The inter-event time between the 1868 M7.9 and 1975 M7.7 earthquake is 107 years, and the inter-event time between the 1975 M7.7 and 2018 M6.9/M7.2 (magnitude discrepancy described above) is 43 years. The average annual rate for three M7+ earthquakes in the past 150 years is about 0.02 events/year implying a 50-year inter-event time. These earthquakes indicate relatively short recurrence times for large earthquakes compared with most faults in the United States.
The geodetic network across Hawaii provides new evidence of temporally varying displacements, and we use these data to model slip rates for décollement faults along the southern and western flanks. Currently, 66 telemetered GPS stations are located across the Island of Hawai’i along with others from partner stations (Hawaiian Volcano Observatory (HVO), 2021). For this hazard assessment, we develop a geodetic (GPS)-based strain rate model to assess rate differences between the south flank and west flank décollement sources (Zeng et al., 2018). We divide the décollement sources into two branches, the southern flank and the western flank, and apply the geometries shown in Figure 6a. We apply the secular GPS velocity observations to invert for slip rates along these décollements using a least-squares method. GPS velocities from Ito et al. (2017) (in reference to the station at the northern tip of the Island of Hawai’i) are shown in Figure 6b. We confirmed this velocity field using other GPS velocities from the Plate Boundary Observatory (PBO) (Herring et al., 2016) and Median Interannual Difference Adjusted for Skewness (MIDAS) (Blewitt et al., 2016). Two décollements with observed GPS velocities plotted as red arrows and the predicted GPS velocities as blue arrows are shown in Figure 6b. Our results show that the average rate for the south décollement is ∼29.7 mm/year, which we translate into an earthquake return time for a M7.0+ events of about 50 years based on moment balancing estimates (30 mm/year × 50 years = 1.5-m average displacement similar to an M7 event). The observed velocities above the middle of the west décollement are 1.1 mm/year, in close agreement with the average slip rate amplitude along the entire west décollement segment. For that area, we translate these rates into an earthquake return time for M7+ events of about 1000–1500 years.
These modeled slip rates are consistent with the moment balancing studies described by other publications (e.g. Chen et al., 2019). The Quaternary fault database (USGS, 2021), Zeng et al. (2018) GPS-based model, and GPS data from Ito et al. (2017) indicate slip rates across the southern portion of the Island of Hawai’i as high as ∼30 mm/year. Some of this geodetic moment is probably aseismic and not available for rupture in large tectonic earthquakes. The Chen et al. (2019) geodetic model suggests a slip rate of 15–25 mm/year and infers a recurrence of M7.2 earthquakes from 4 to 7 years if all the moment on the décollement was available for earthquake rupture, or from 12 to 21 years if slip from aftershocks or aseismic slip reduced the tectonic slip rate. They indicate that it would take 20–35 years to accumulate the moment equivalent of an M7.7 earthquake or 60–105 years if smaller earthquakes are removing significant slip from the system. We use these observations and slip rate models to develop earthquake source models for the south and west décollements.
Décollement logic tree models
Logic trees for the south and west décollements are shown in Figure 7. We consider three models to explain the earthquakes on the south décollement. The first model applies the merged geometry proposed by Klein et al. (2001) along with their rates that extend between M7 and M8.2. The second and third models extend the first model geometry and are based on the inter-event timing of historical earthquakes with M > 7. For Model 2, we consider a 50-year recurrence of M7+ (370 years for M7.7+) earthquakes and an incremental a-value of 4.6642 with a b-value of 1.0 for earthquakes between M7 and M8.2. For Model 3, we consider a 150-year recurrence of M7.7+ (20 years for M7+) earthquakes and an incremental a-value of 5.0632 with a b-value of 1.0 for earthquakes between M7 and M8.2. These alternative models are generally consistent with the historical inter-event times and the geodetic moment rates with aftershocks removed.
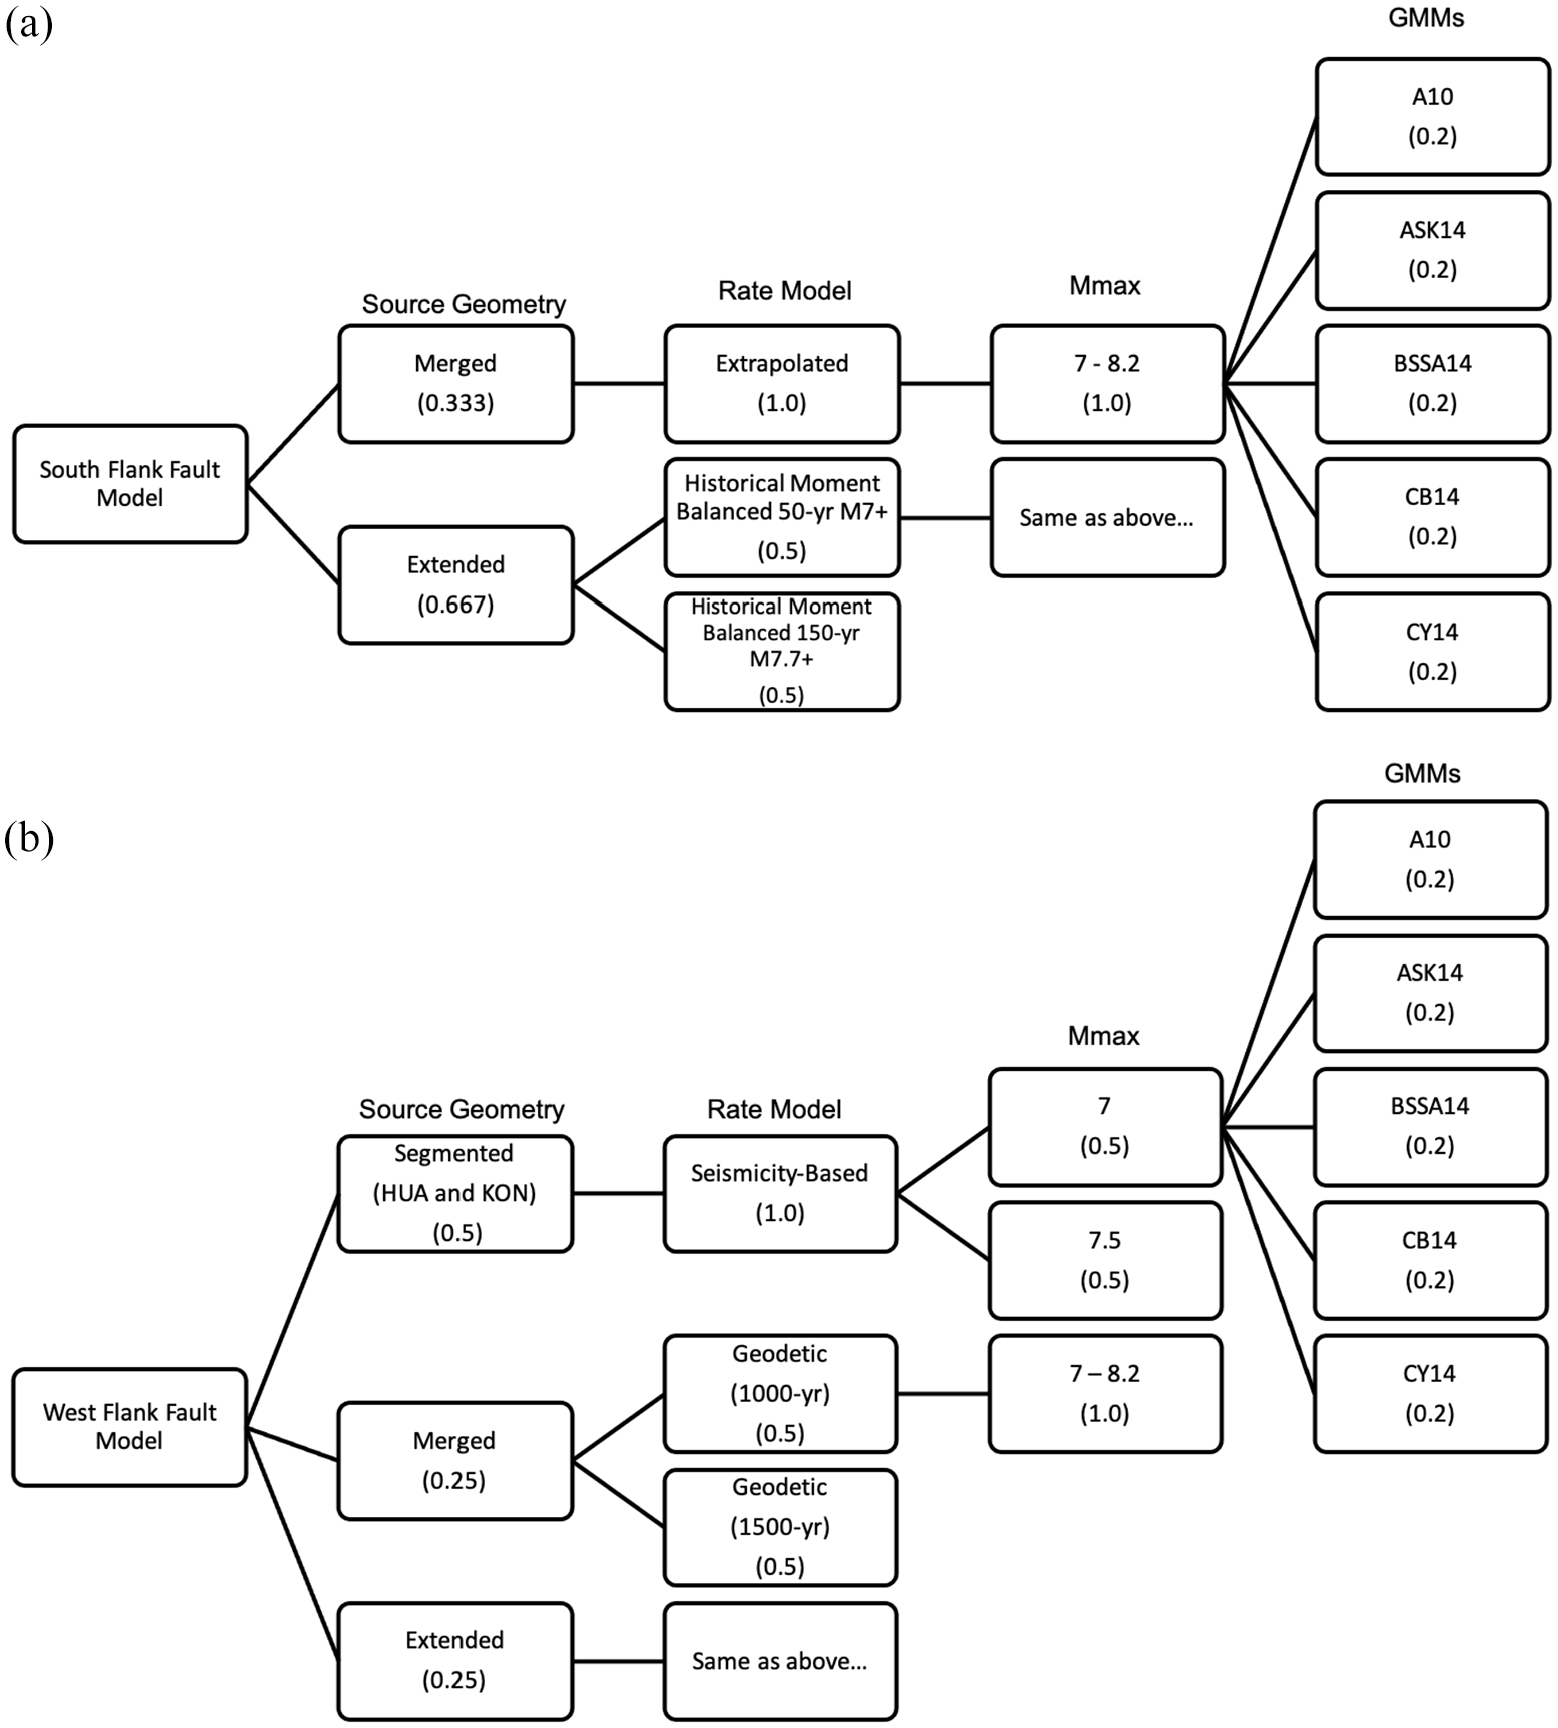
Logic trees for décollement (flank fault) sources: (a) south and (b) west models on the Island of Hawai’i.
For the west décollement, we consider three alternative geometries. The first considers the Klein et al. (2001) HUA and KON source zone geometries, the second considers these two sources merged, and the third extends the merged geometry to the southeast. To estimate recurrence rates of M7 earthquakes for the west décollement, we assume an average fault displacement between 1 and 2 m in an M7 earthquake and a slip rate which we determined here to be about 1.1 mm/year. Zeng et al. (1993) indicate that the Loma Prieta earthquake (M6.9) had an average displacement of about 1 m of strike-slip motion. If we consider that an M7 may rupture with 1-m displacement and the fault slips with 1 mm/year, it would take about 1000 years for the appropriate displacement to accumulate. This geodetic-based model suggests much lower expected earthquake rates on the west décollements compared with the south décollement ruptures. We consider three models to explain the earthquakes on the west décollement. The first model considers a 1000-year recurrence for M7 earthquakes, and the second model considers a 1500-year recurrence for M7 earthquakes, based on estimates from the GPS and slip rates described above. This second model is consistent with occurrence of a component of aseismic slip strain release. The third model is based on the historical rate of earthquakes. We consider earthquakes about M7 based on the historically experienced M6+ earthquakes in the west décollement region shown in Figure 1 in Klein et al. (2001) and Figure 6 (this publication): 1929 M6.2 and M6.5, 1950 M6.3, 1951 M6.9, and 1952 M6.0. Five events (some may be aftershocks) in the past 100 years yield a rate of 0.05/year with M6+. Extrapolating a Gutenberg–Richter magnitude–frequency model with b = 1, we would expect a rate of 0.005/year for M7+ events. We partition the rates in the following way: Kona with three events in 1000 years (0.003/year) and Hualālai with two events in 1000 years (0.002/year) for M7 ± 0.2 events consistent with the historical earthquakes in the KON (Near Kona) and HUA (near Hualālai) zones of Klein et al. (2001). These western décollement models have large rate differences as shown in Figure 3. Future work may be able to better constrain these source models for use in seismic hazard.
Ground motion models
To make reasonable estimates of ground shaking hazard we need GMMs that depict the levels of shaking and uncertainties expected for each of the earthquakes included in the model. Strong ground motions have been recorded for the past several decades from large damaging earthquakes across Hawaii, with records in current ground motion databases dating to 1973 (Atkinson, 2010). Currently, 76 strong motion seismometers have been installed across the islands (HVO, 2021). A dataset of about 200 ground motion recordings were used to develop GMMs for Hawaii (Atkinson, 2010; Wong et al., 2015). We have also processed ground motion records from recent events in Hawaii, using standard strong-motion processing steps (e.g. Rekoske et al., 2020), to expand the set of records from Hawaii for GMM evaluations. These processing steps are in alignment with those used by the Pacific Earthquake Engineering Research Center—Next Generation Ground Motion Attenuation (PEER-NGA) efforts (e.g. Ancheta et al., 2014). Recently developed ground motion databases include the records from the tectonic and volcanic-caldera events associated with the 2018 Kīlauea sequence (Rekoske et al., 2019) and a compilation of records from tectonic earthquakes in Hawaii, 2010–2020 (Rukstales et al., 2021).
McNamara et al. (2020a) identified a set of GMMs for consideration in our Hawaii seismic hazard analysis. The GMM evaluations of McNamara et al. (2020a, 2020b) used two methods: (1) a total residual approach that compares the probability density function (both means and standard deviations) of the observed and predicted ground motions and (2) a log likelihood method that yields a single likelihood measure for each GMM that can be used to weight GMMs in the PSHA logic tree (Scherbaum et al., 2009). We examined a large set of candidate GMMs for application to Hawaii (McNamara et al., 2020a). This study identified the Atkinson (2010) and four NGA-West2 GMMs (Abrahamson et al., 2014; Boore et al., 2014; Campbell and Bozorgnia, 2014; Chiou and Youngs, 2014) for shallow earthquakes, and Atkinson (2010), Wong et al. (2015), and Abrahamson et al. (2016) for deep earthquakes, as being suitable for incorporation into the 2021 Hawaii NSHM.
We computed total residuals for the five shallow and three deep GMMs relative to the combined ground motion database of Atkinson (2010) and Rukstales et al. (2021). All GMMs were evaluated for VS30 = 428 m/s, which was the VS30 of the reference shear-wave velocity profile developed by Wong et al. (2015). Mean residuals as a function of oscillator period are plotted for shallow (Figure 8a) and deep earthquakes (Figure 8b). For shallow earthquakes at all periods, mean residuals from the NGA-West2 GMMs and Atkinson (2010) are within a factor of 2 of the predicted ground motions. For all GMMs below 1-s SA and for most GMMs across all periods, GMMs evaluated at VS30 = 428 m/s overpredict the observations in the databases. The overprediction of recorded ground motions may be due to higher average VS30 values for the sites in the combined dataset or due to differences in the site amplification models of the NGA-West2 and Atkinson (2010) GMMs. For deep earthquakes, residuals depict greater variability with the currently available recorded ground motions from Hawaii. The Atkinson (2010) GMM gives the smallest misfits to the data, though the GMM slightly underpredicts the observations at all periods. Abrahamson et al. (2016) underpredicts the observations for T < 4 s, with significant underpredictions at the shortest periods (T < 0.2 s). The Wong et al. (2015) GMM overpredicts the observations at all periods, with the most significant overpredictions at longer periods (T > 1 s).
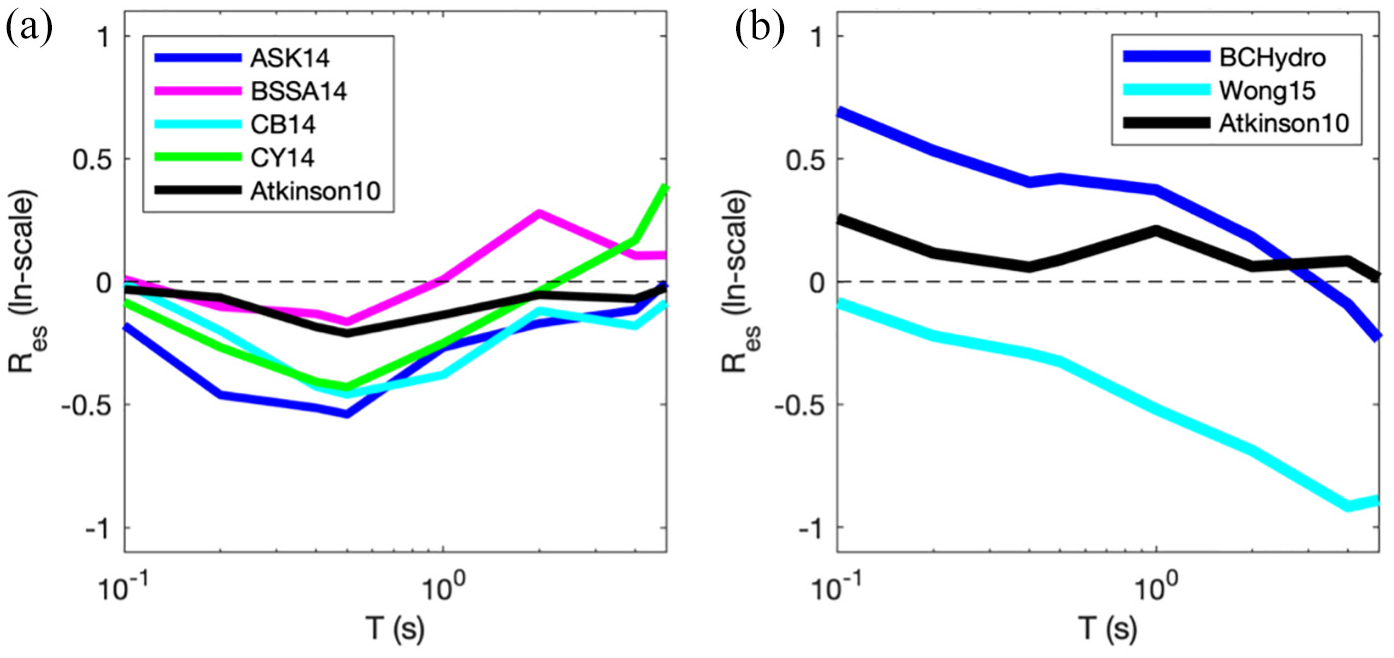
Total ground motion residuals (Res) versus oscillator period (T) for (a) shallow (depth < 20 km) and (b) deep earthquakes (depth > 20 km). Ground motions are taken from the databases of Atkinson (2010) and Rukstales et al. (2021), and ground motion models are evaluated for VS30 = 428 m/s. Total residuals for the shallow earthquakes were computed relative to Atkinson (2010; Atkinson10), Abrahamson et al. (2014; ASK14), Boore et al. (2014; BSSA14), Campbell and Bozorgnia (2014; CB14), and Chiou and Youngs (2014; CY14). Total residuals for the deep earthquakes were computed relative to Atkinson (2010; Atkinson10), Abrahamson et al. (2016; BCHydro), and Wong et al. (2015; Wong15).
Logic tree weights for the 2021 Hawaii GMMs were based on the recommendations of McNamara et al. (2020a) and the ground motion residuals identified in subsequent analysis. The GMM logic-tree weights are summarized in Table 2. For shallow earthquakes, equal weights were applied to the Atkinson (2010) and NGA-West2 GMMs based on their similar data misfits. For deep earthquakes, the Atkinson (2010) and Abrahamson et al. (2016) GMMs have equal weights; we applied a lower weight to the Wong et al. (2015) GMM because it was developed for mean site conditions only (VS30 = 428 m/s) and because of its mean overprediction of recorded ground motions from the Hawaii databases. Recently, Wong and others have updated their GMM (which now includes shallow and deep earthquakes) to account for site conditions at a variety of VS30 values applied in the NSHMs, and we apply the new GMMs here for deep earthquakes using the coefficients in Wong et al. (2021; W21). The GMMs in Table 2 are considered in the 2021 model to better sample the epistemic uncertainty. We recognize that the strong motion dataset from Hawaii is limited and that we need to consider earthquakes in other regions of the world to represent the expected range of uncertainty in future Hawaiian earthquakes (an ergodic assumption).
Recognizing that ground motions from Hawaii earthquakes may attenuate differently with distance and that the strong-motion dataset is relatively sparse, we apply additional epistemic uncertainty to the shallow GMMs. We used the additional epistemic uncertainties values developed by Rezaeian et al. (2015) for the implementation of NGA-West2 GMMs in the 2014 NSHM update for the conterminous US, which allow uncertainties of up to 50% within magnitude-distance bins for which few records exist to constrain the models. Because of the higher epistemic uncertainty in the GMMs used for deep earthquakes, we did not apply additional epistemic uncertainties to this subset of GMMs.
To account for caldera collapses in the 2021 NSHM for Hawaii, we needed a GMM to calculate ground motions for these types of seismogenic events. Short-period ground motions associated with these caldera collapses are very low compared with the NGA-West2 models and the A10 GMM developed with Hawaii data (McNamara et al., 2020a). We therefore scaled the A10 GMM at each spectral period according to the mean residuals derived from the McNamara et al. (2020a) study; see Powers (2017) for smoothed scale factors. We note that the ground motions at a station near HVO on the caldera rim (HV.UWE.HN) recorded high ground shaking from these caldera collapses that could be considered in future updates of the GMMs for shaking at close source-to-site distances.
The GMMs were used to calculate hazard separately and as a group to understand their contributions to the shaking model and the sensitivity of hazard to each GMM. Figure 6 shows comparisons of the weighted average Hawaii GMMs for shallow, deep, and caldera collapse earthquakes. The 2001 models generally contain a mix of seismometer component directionalities that are mostly based on some form of the maximum of the unrotated seismometer component ground shaking levels. On the contrary, the 2021 models are based on various measures that represent the average horizontal component of ground shaking (e.g. RotD50 in NGA-West2 models, which is the median of the rotated components). The current US building design regulations used by the engineering community require maximum-direction ground motions. The 2001 NSHM results for Hawaii were used directly in developing design ground motions. The 2021 NSHM results, however, must be first scaled to the direction of the maximum component before developing design ground motions. GMMs shown in Figure 9 are in their unaltered formulations. As a result, they compare the maximum direction 2001 ground motions to the median direction 2021 ground motions. Maximum direction scaling factors can be found in building design regulations under consideration (e.g. Building Seismic Safety Council (BSSC), 2020) and are factors of 1.2–1.3 depending on the spectral period. With some exceptions and ignoring directionality, the values of the new GMMs applied in the 2021 NSHM are a little lower than those applied in the 2001 NSHM for distances beyond 10 km from the earthquake source (Figure 9). The exception is for earthquakes on parts of the Island of Hawai’i with shorter distances and for deep earthquakes at 0.2 s SA for distances from 10 to 100 km for which the ground motion values from the new models are higher than that from the 2001 models.
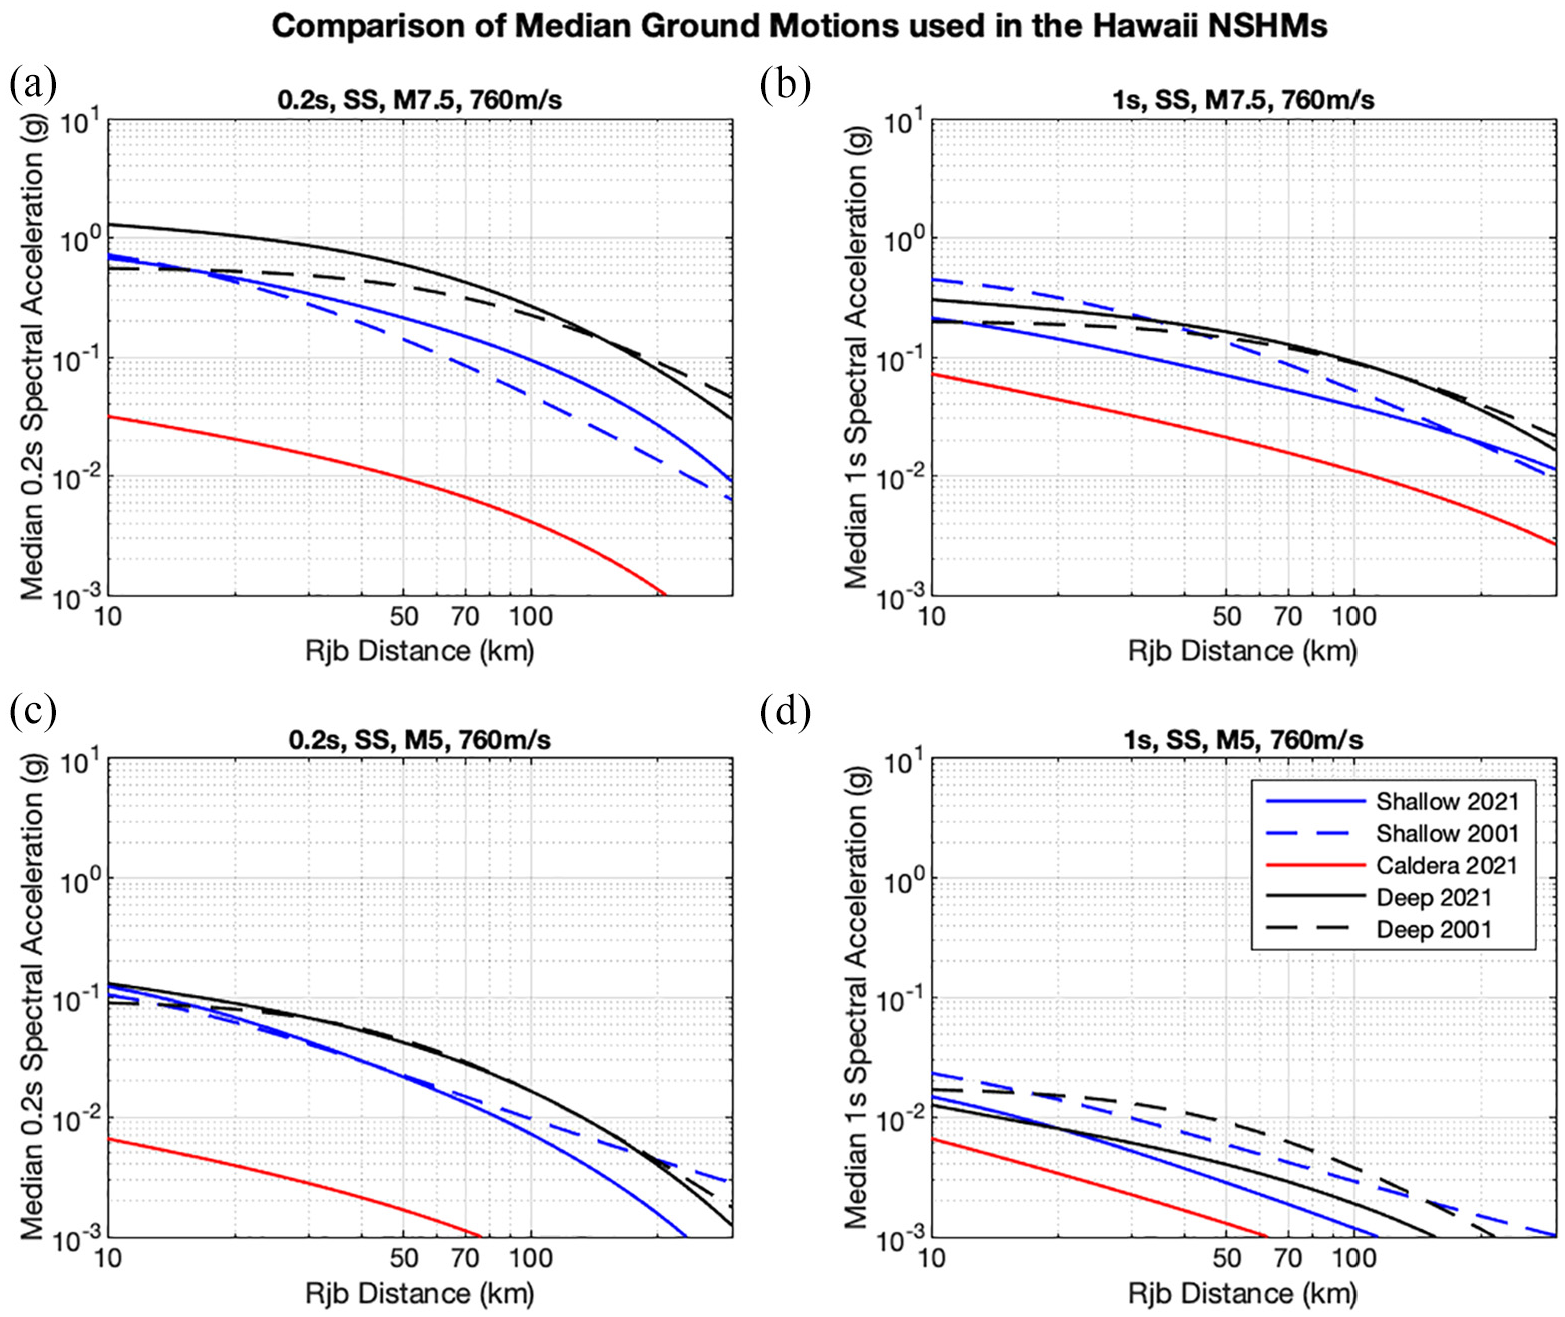
Ground motion versus Joyner–Boore distance (RJB) for an (a, b) M7.5 and an (c, d) M5 event considering the weighted average of GMM medians used in 2001 (dashed lines) and 2021 (solid lines) for 0.2-s (a, c) and 1-s SA (b, d). Earthquakes are modeled at depths of 10 and 40 km for “shallow” and “deep” GMMs, respectively.
To access the impact of changing the GMMs between 2001 and 2021, we performed a sensitivity study where we ran the 2021 NSHM using the 2001 GMMs. A comparison of the 2% in 50-year probability of exceedance ground motions for a reference site condition (VS30 = 760 m/s) between the 2021 GMMs and the 2001 GMMs is presented in Rukstales et al. (2021). At 0.2 and 1 s, areas on the Island of Hawai’i (e.g. Hilo and Kona at 0.2 s SA) show higher hazard with the 2021 GMMs than the 2001 GMMs, but all other areas show lower hazard with the 2021 GMMs. Table 3 indicates that differences between 2001 and 2021 shaking can largely be explained by the GMM differences.
Comparison of changes in ground motion (differences and ratios) between the 2021 and 2001 Hawaii NSHMs for 0.2 and 1 s SA at 2% probability of exceedance in 50 years and a reference site condition (VS30 = 760 m/s) at five sites
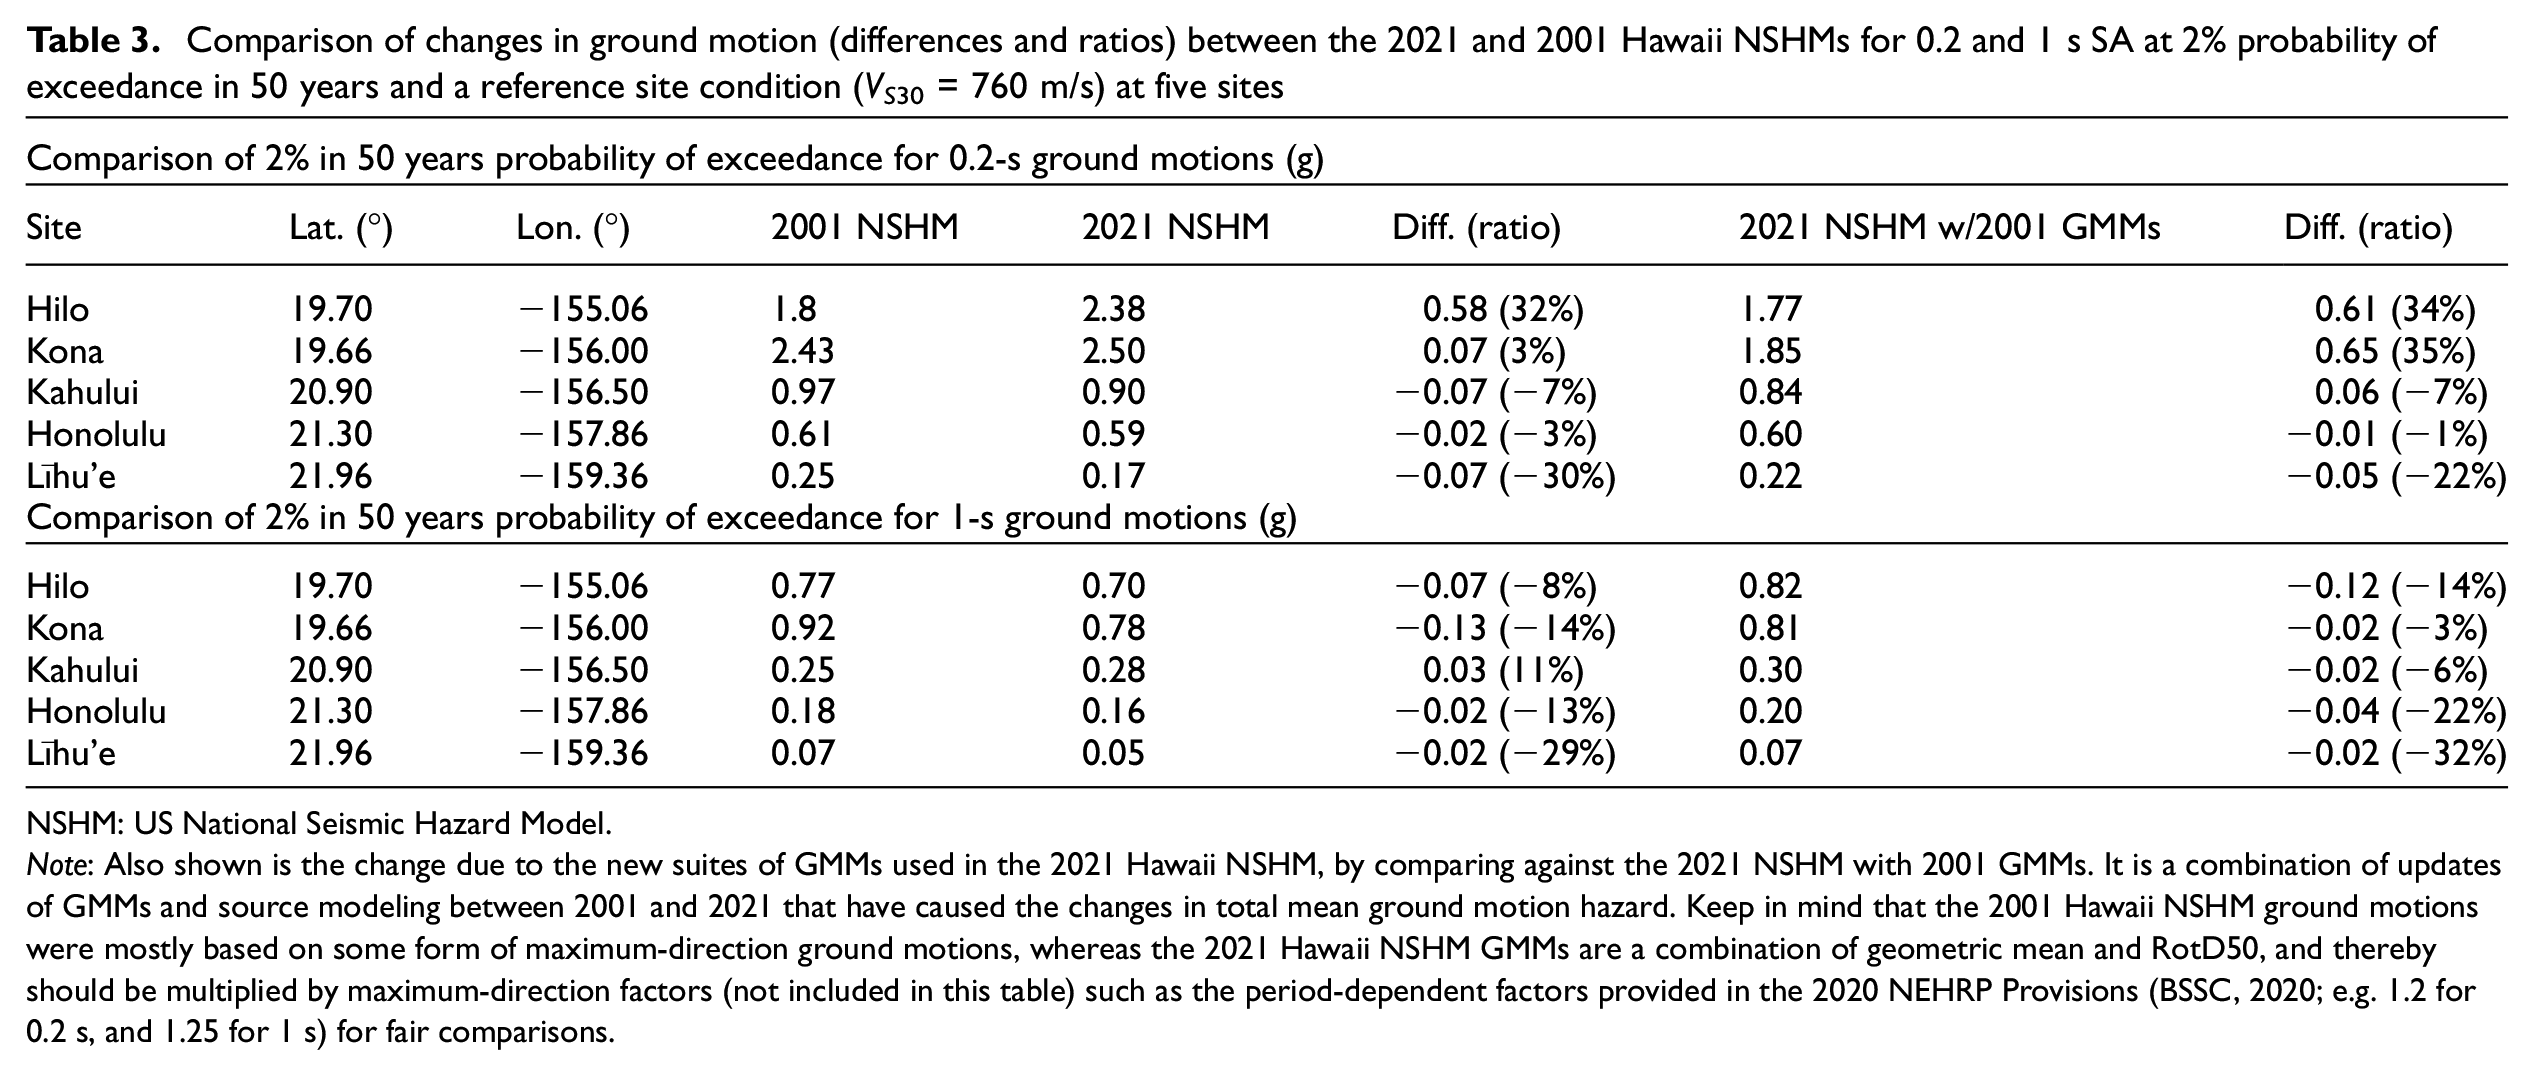
NSHM: US National Seismic Hazard Model.
Note: Also shown is the change due to the new suites of GMMs used in the 2021 Hawaii NSHM, by comparing against the 2021 NSHM with 2001 GMMs. It is a combination of updates of GMMs and source modeling between 2001 and 2021 that have caused the changes in total mean ground motion hazard. Keep in mind that the 2001 Hawaii NSHM ground motions were mostly based on some form of maximum-direction ground motions, whereas the 2021 Hawaii NSHM GMMs are a combination of geometric mean and RotD50, and thereby should be multiplied by maximum-direction factors (not included in this table) such as the period-dependent factors provided in the 2020 NEHRP Provisions (BSSC, 2020; e.g. 1.2 for 0.2 s, and 1.25 for 1 s) for fair comparisons.
The aleatory variability also differs between GMMs. For shallow earthquakes in the new models, the NGA-West2 models vary between 0.69 and 0.72 natural log units, while A10 is lower than the others at 0.6 units. For shallow earthquakes in the 2001 model, aleatory variability was between 0.42 (low at 0.2-s SA) and 0.57 (higher at 1-s SA) natural log units, which is lower than in the current set. For deep earthquakes, the new GMMs have aleatory variability models from 0.6 to 0.8 natural log units for 0.2 and 1-s periods, respectively. The Wong et al. (2015) GMM has an average aleatory variability of ∼0.8 at short periods but increases sharply above 2 s to a value of 1 at 10-s spectral period. In consultation with the model developers, we applied a fixed sigma of 0.8 at all periods. The older model by Youngs et al. (1997) has sigma of 0.7 natural log units, which is lower than two of the three new deep GMM sigmas for 0.2 and 1-s SA.
Site effect models
Site conditions can amplify or deamplify shaking and are typically modeled based on the shallow velocity parameter VS30, which acts as a proxy to capture seismic responses due to deeper sediments and three-dimensional (3D) geologic structure in an average way. Such amplification scales more or less strongly with shallow VS depending on the crustal geometry, lithologic characteristics and depth distribution of velocity contrasts. Therefore, it is critical that NSHMs consider Hawaii-specific site conditions and ground motion data to construct the best science-based hazard models. The 2021 Hawaii NSHM is developed for the same 21 periods (plus PGA) and 8 site classes as in the conterminous US 2018 NSHM (Shumway et al., 2021) and required by the latest building design regulations in all US regions (BSSC, 2020; FEMA, 2020), but we have also now provided peak ground velocity (PGV) data. Most of the GMMs applied in this update include soil amplification terms. However, we felt that we needed to verify whether the amplifications at sites in Hawaii are similar to those observed in the western United States. We analyzed site response data at recording stations on the islands of Hawaii by comparing intensities of recorded ground shaking to model predictions for the seven GMMs considered in the 2021 model. We also reviewed available site characterization data for the Hawaiian Islands, including soils and geology reports and maps, and near-surface seismic velocity data.
The site amplification models for seven GMMs (A10, BCHydro12 Slab, W21 and the four main NGA-West2 models) compare reasonably well but show large epistemic uncertainties, particularly at low values of VS30 (Figure 10). The site amplification model of Seyhan and Stewart (2014), which was the basis for the 2015 National Earthquake Hazards Reduction Program (NEHRP) site coefficients (BSSC, 2015), is implicitly included in this comparison because it was utilized without modification in the BSSA14 GMM. The W21 crustal and deep GMMs do not contain explicit VS30 scaling models because they were developed by fitting model coefficients to ground motion data binned by discrete site classes. As such, nonlinearity cannot readily be separated from linear VS30 scaling (as can be done with most other GMMs). Given that the W21 models have no standalone VS30 scaling model, in order to compare their site response estimates with those of the other considered GMMs, we evaluated the W21 models at a range of magnitudes (4–7) and distances (10–400 km), and then corrected to the reference-rock condition of VS30 = 760 m/s, to isolate the portion of the predicted ground motion due to site response. This resulting dispersion of predicted site response represents a measure of epistemic uncertainty in the model evaluations (vertical error bars in Figure 10). Further, the W21 models exhibit increased dispersion in predicted site response for lower VS30 values due to nonlinearity, an expected phenomenon as the models are magnitude- and distance-dependent. For short-period (0.2 s) site response, the VS30 scaling models of the other considered GMMs do fall within this epistemic range, however for mid-periods (1.0 s) the W21 models exhibit shallower VS30 scaling than predicted by the western North America (WNA) and BC Hydro models. Here, site terms were computed by using mixed-effects regression to partition the residuals derived from ground motion data compared with ASK14 model predictions, which was selected for convenience. Only sites for which VS30 was assigned from site-specific measurements presented by Wong et al. (2011) were investigated in computing residuals, as proxy-based VS30 assignments (such as those from topographic slope, e.g. per Wald and Allen, 2007) carry additional uncertainty (Seyhan et al., 2014). The variability in the linear site response estimated at Hawaii stations as compared with the site amplification models in the employed GMMs is not unexpected given the general differences in site conditions found in Hawaii compared with other western US sites. We find that in general, several localities in Hawaii have soil/rock profiles exhibiting shallow (of the order of a few meters) softer layers of ash and weathered bedrock (also referred to as saprolite) overlying hard basaltic rock—exceptions include environments with slightly deeper alluvial sediments, such as the greater Honolulu or Hilo areas, which are located at the base of one or more volcanoes. The Soil Conservation Service (now the Natural Resources Conservation Service) of the US Department of Agriculture developed soils surveys for the islands of Kaua’i, O’ahu, Maui, Moloka’i, and Lāna’i (Foote et al., 1972) and separately for the Island of Hawai’i (Sato et al., 1973). These surveys provide estimates of depth to bedrock. Table 2 in each report shows that soils are often just a few meters deep overlying both weathered and intact basaltic bedrock (characterizations at many sites show soils >5 ft, and the total depth is ambiguous).
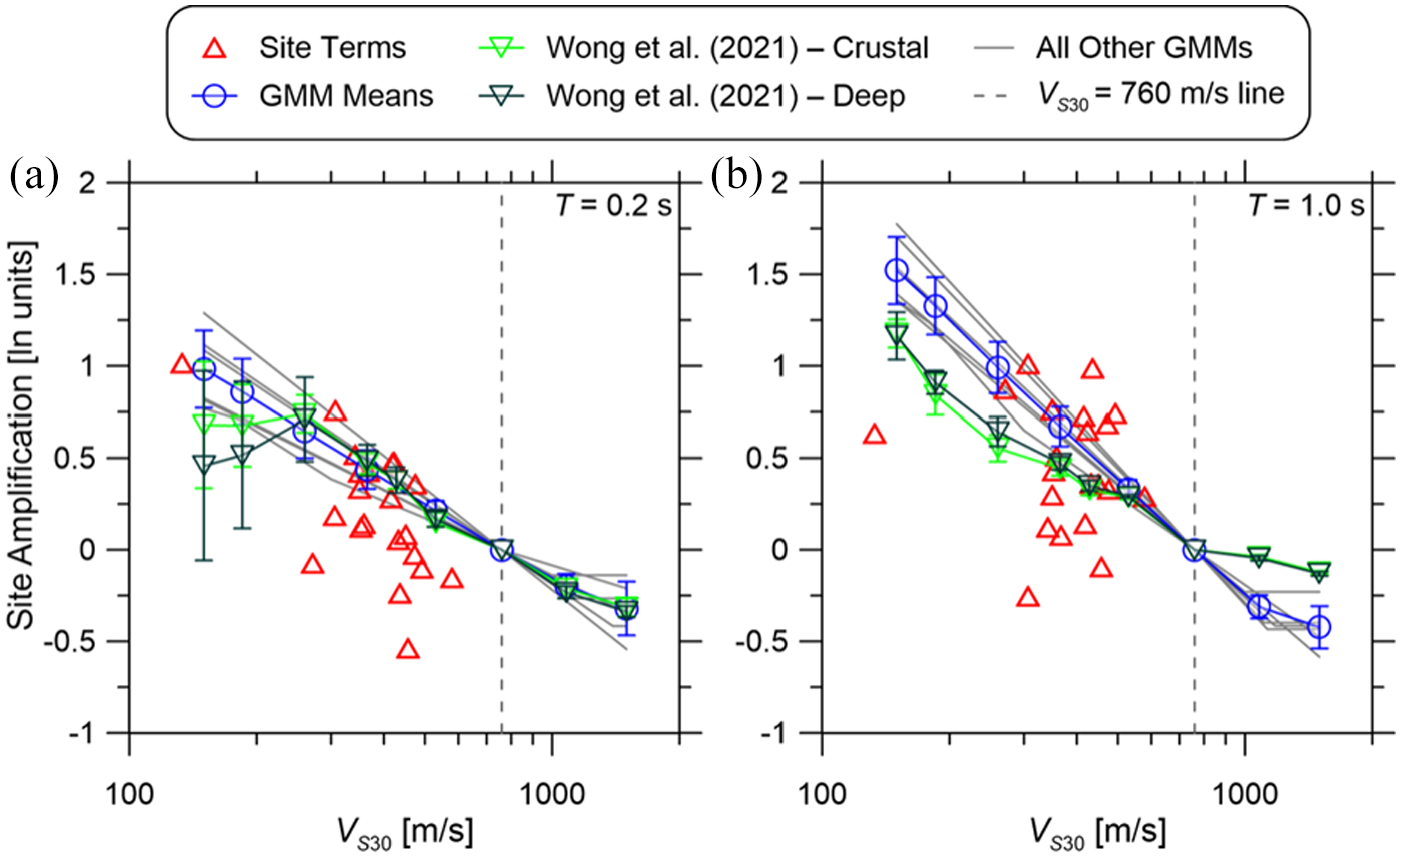
Comparison of station-specific site terms (triangles) to linear site amplification models (gray lines) from six GMMs (those listed in Table 2 except Wong et al., 2015). The crustal and deep models of Wong et al. (2021) are presented (inverted triangles) at discrete VS30 values, with dispersion of ground motion values (vertical error bars) that encompass a range of magnitudes and distances for which the GMMs were evaluated. Binned means (circles) connected by an estimate of a mean model (heavy blue line) of modeled linear site amplification with error bars corresponding to ±1 standard deviation shown at VS30 values corresponding to eight site classes (per BSSC, 2020). Site terms are computed using mixed-effects regression to partition the residuals of ground motion data compared with ASK14 predictions.
Site characterizations using the standard measurement of VS30 or other criteria are quite limited in Hawaii. Wong et al. (2011) derived VS30 from shallow geophysical studies implementing the spectral analysis of surface waves (SASW) method at 21 sites across the Island of Hawai’i. They compared VS profiles based on different mapped surface geology (per the maps of Sherrod et al., 2007) and identified depths to relatively large increases in stiffness that varied from <1.5 ft (<1 m) to over 140 feet (43 m; see their Table 3). A recent study commissioned by the Naval Facilities Engineering Systems Command (NAVFAC) (Liberty and St. Clair, 2018) implemented a P-wave seismic reflection/refraction study to determine seismic velocities from nine profiles in the Pearl Harbor (Red Hill) area of O’ahu. The study indicates that soft soils in this region are typically constrained to the upper 60 ft (18 m) and typically overlie saprolite and basalt layers that extend down hundreds of feet beneath the surface. The remaining 51 stations (71%) in this data set are assigned VS30 based on topographic slope gradient as per the protocols of Wald and Allen (2007) and available in the USGS Global VS30 mosaic map (Heath et al., 2020). Figure 11 shows the distribution of VS30 values assigned to all stations in Hawaii. Only four sites fall within the softest NEHRP site classes of D, DE, and E (VS30 ≤ 305 m/s), while 10 sites fall in the stiffest site classes of BC, B, and A (VS30 ≥ 640 m/s).
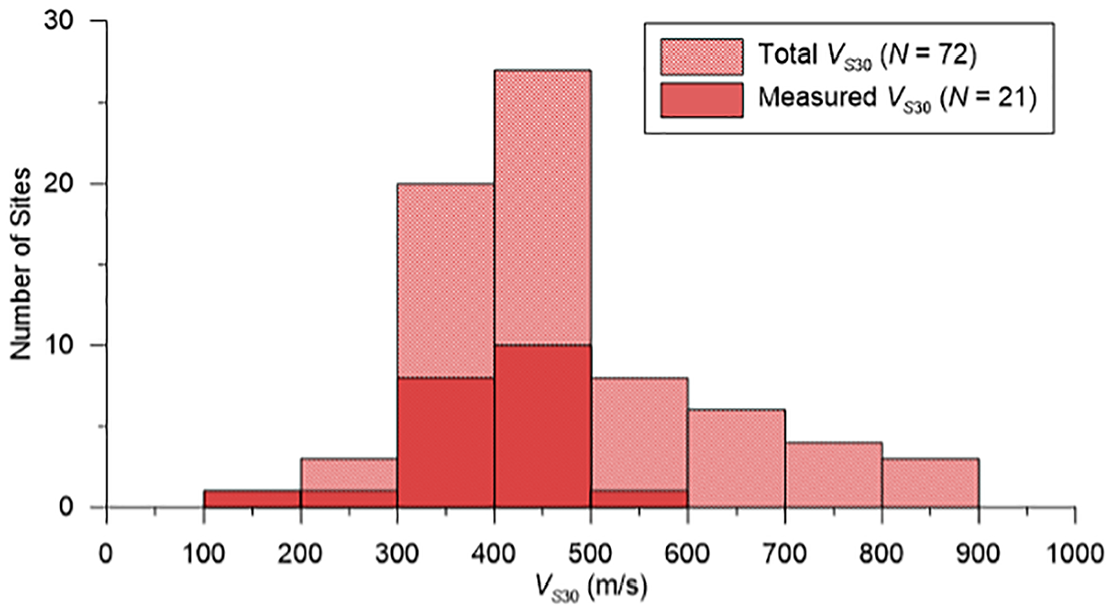
Histogram of VS30 data assigned to stations in the Hawaiian ground motion database.
While additional soil data are needed to better characterize site effects, it seems that many sites across the Hawaiian Islands may either (1) exhibit a gradual velocity gradient from soils and weathered basalt overlying more competent basalt or (2) exhibit sharp stratigraphic boundaries at relatively shallow depths, with relatively thin soils overlying hard basalt rock. A large impedance contrast present in the latter stratigraphic sequence likely would affect seismic wave propagation, potentially causing resonances in the upper softer layers. The VS30 parameter best correlates to deeper velocity structure only in geologic environments where the stiffness increases uniformly with depth, such as in studies in California for which VS30 was first utilized for predicting site amplification (e.g. Borcherdt, 1994) and should be generally used in conjunction with other available site-specific data (Kamai et al., 2016). A comparison performed by Wong et al. (2021) indicates that the average VS profile for Hawai’i (for VS30 = 428 m/s) has a slightly higher gradient in the upper 8 m than an average profile for WNA developed by Kamai et al. (2016), after which it exhibits a faster velocity gradient with depth than the WNA profile. We suspect that because the existing site amplification models in the GMMs applied in this analysis do not reject the data for intermediate values of VS30 (approximately 300 < VS30 < 600 m/s in Figure 10), they can be implemented in the 2021 Hawaii NSHM. Data from additional recordings would help to better constrain the models at the lowest and highest values of VS30.
2021 Hawaii NSHM results
Hazard calculations
The 2021 Hawaii NSHM probabilistic seismic hazard calculations were performed using previous NSHM methodologies (e.g. Algermissen and Perkins, 1976; Frankel et al., 1996, 2002; Petersen et al., 2008, 2014, 2015, 2020) based on the fundamental method of Cornell (1968). Hazard calculations were performed using the software computer code nshmp-haz (Powers, 2017). The version of the software code used for these calculations is publicly available for download and use from GitLab (https://code.usgs.gov/ghsc/nshmp/nshmp-haz/-/releases/2.0.0). Software code nshm-hi-2021 defining the 2021 Hawaii NSHM source models is also publicly available for download and use from GitLab (https://code.usgs.gov/ghsc/nshmp/nshms/nshm-hawaii/-/releases/2.0.0).
For the 2021 update of the Hawaii seismic hazard model, we calculated hazard curves for 23 ground-motion intensity measures, including PGA and PGV, and spectral accelerations at 0.01 to 10 s for a 5% damping ratio, and for 8 different site classes corresponding to VS30 values from 150 to 1500 m/s (i.e. representing site classes A–E as defined by the 2020 NEHRP Recommended Seismic Provisions, BSSC (2020)). Uniform-hazard ground motion data were interpolated for 2%, 5%, and 10% probability of exceedance in 50 years from the hazard curves (corresponding to 0.000404, 0.00103, and 0.0021 annual rates of exceedance, respectively). Due to the large number of maps that would result from this dataset (23 intensity measures × 8 site classes × 3 return periods = 552 maps), we have not produced map figures for all datasets, but simply provide the gridded uniform-hazard ground motion data that can be accessed by users to produce maps. We also provide hazard curves from which ground motions at other return periods can be obtained. The 0.02°-latitude by 0.02°-longitude gridded data for the hazard curves and uniform-hazard ground motions are available for download from Rukstales et al. (2021). In the following section, we present a small subset of these results: (1) PGA, 0.2, 1, and 5-s ground motion maps for a reference site condition (VS30 = 760 m/s) using the 2021 Hawaii NSHM, (2) PGA, 0.2, 1, and 5-s total mean ground motion maps for VS30 = 260 m/s using the 2021 Hawaii NSHM, (3) a comparison of 0.2 and 1-s total mean ground motion maps (difference and ratio) between the 2021 Hawaii NSHM and the 2001 Hawaii NSHM for a reference site condition (VS30 = 760 m/s), (4) a comparison of 0.2 and 1-s total mean hazard curves between the 2021 Hawaii NSHM and the 2001 Hawaii NSHM for a reference site condition (VS30 = 760 m/s) at five select sites, (5) uniform hazard response spectra (UHRS) for five select sites calculated for the 2021 Hawaii NSHM, (6) sensitivity and uncertainty analysis, and (7) 0.2 and 1-s disaggregations for Honolulu and Hilo. We study the Honolulu and Hilo sites to account for sites that are primarily influenced by deep and shallow smoothed seismicity models (non-summit) and sites near a décollement source with high hazard, respectively.
Hazard results
Ground motion maps
Examples of uniform-hazard ground motion maps are shown for a reference site condition (VS30 = 760 m/s) for PGA, 0.2, 1, and 5 s for 2% probability of exceedance in 50 years (Figure 12a to d). Examples of uniform-hazard ground motion maps are also shown for VS30 = 260 m/s for the same spectral periods and same hazard level (Figure 13a to d). Additional maps at these same periods and Vs30 values for 5% and 10% probability of exceedance are available from Rukstales et al. (2021). As expected, the maps show that ground motions are the highest on the Island of Hawai’i and decrease to the northwest across the island chain.
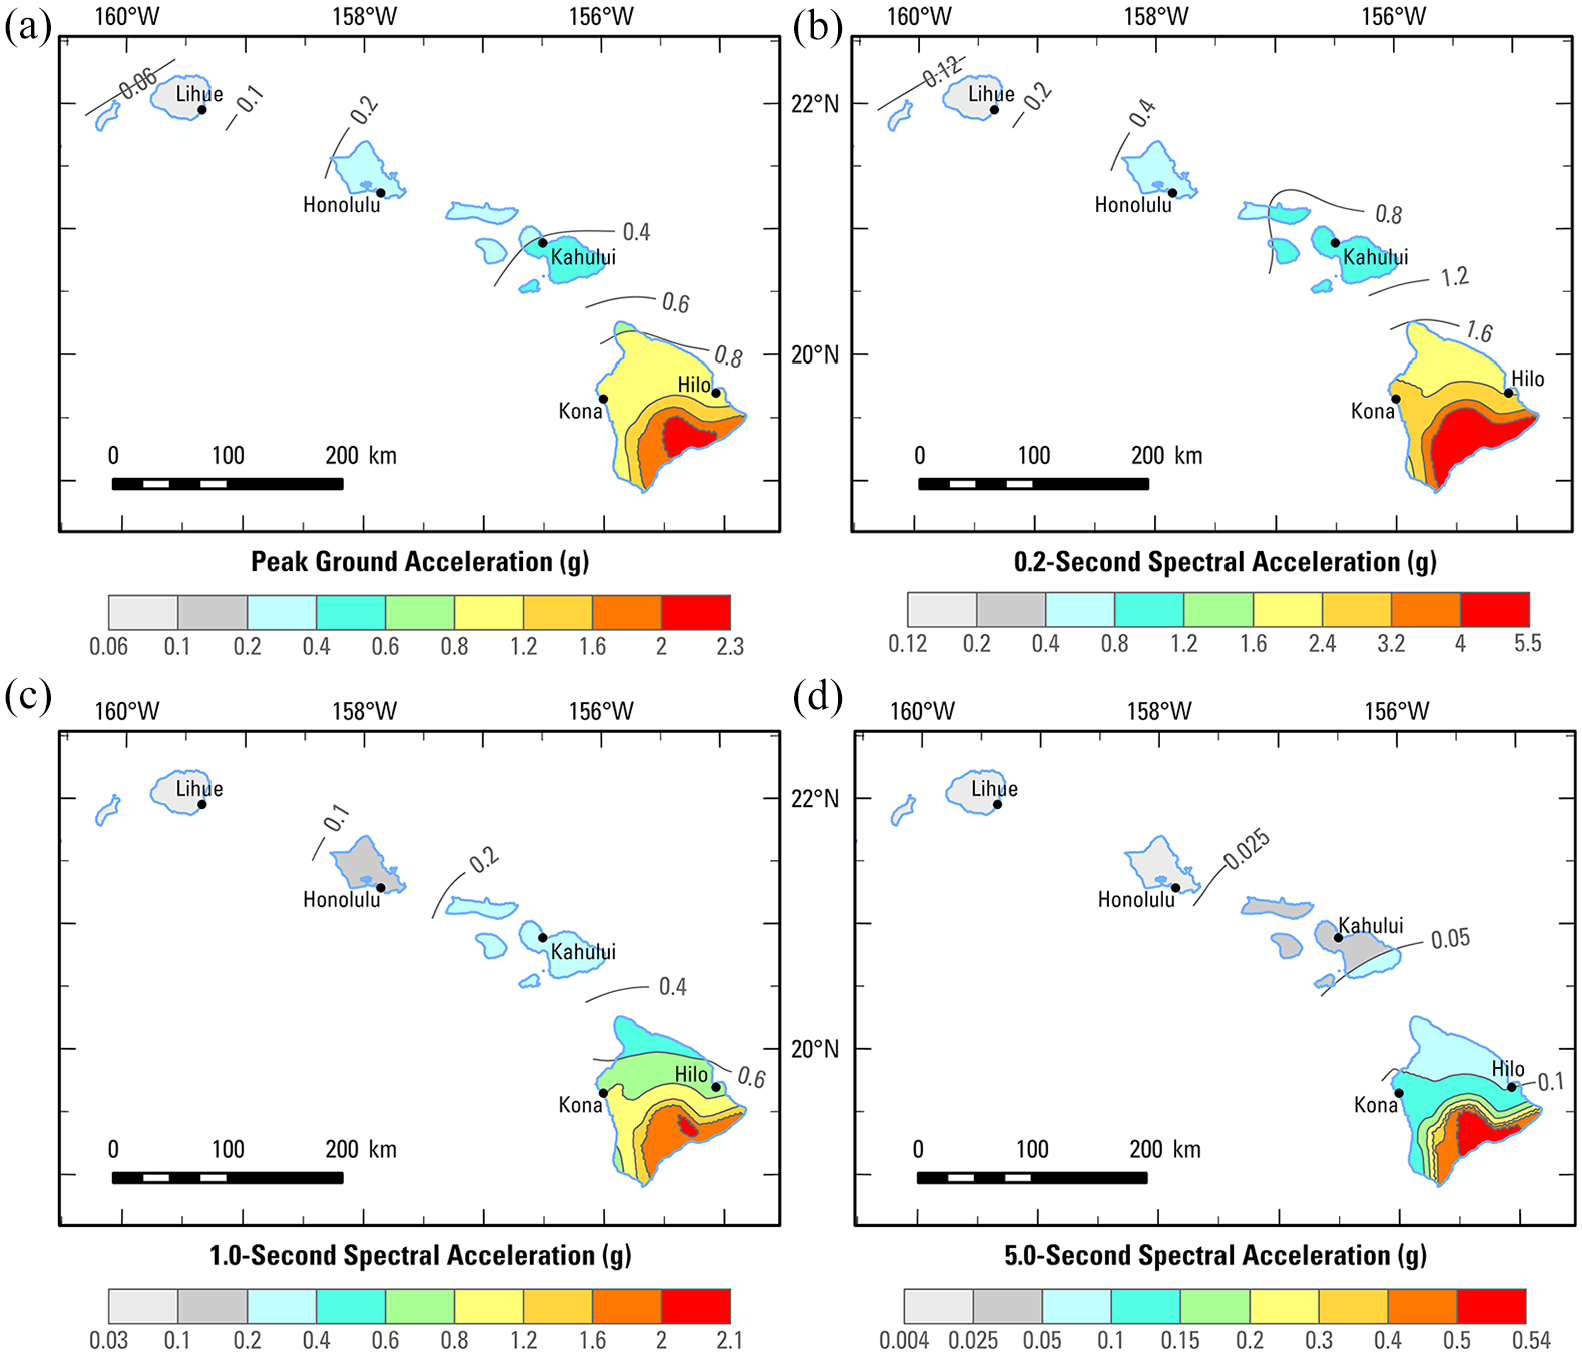
Total mean ground motion hazard for 2% probability of exceedance in 50 years at a reference site condition (VS30 = 760 m/s) for (a) PGA, (b) 0.2, (c) 1, and (d) 5-s spectral accelerations for the 2021 Hawaii NSHM.
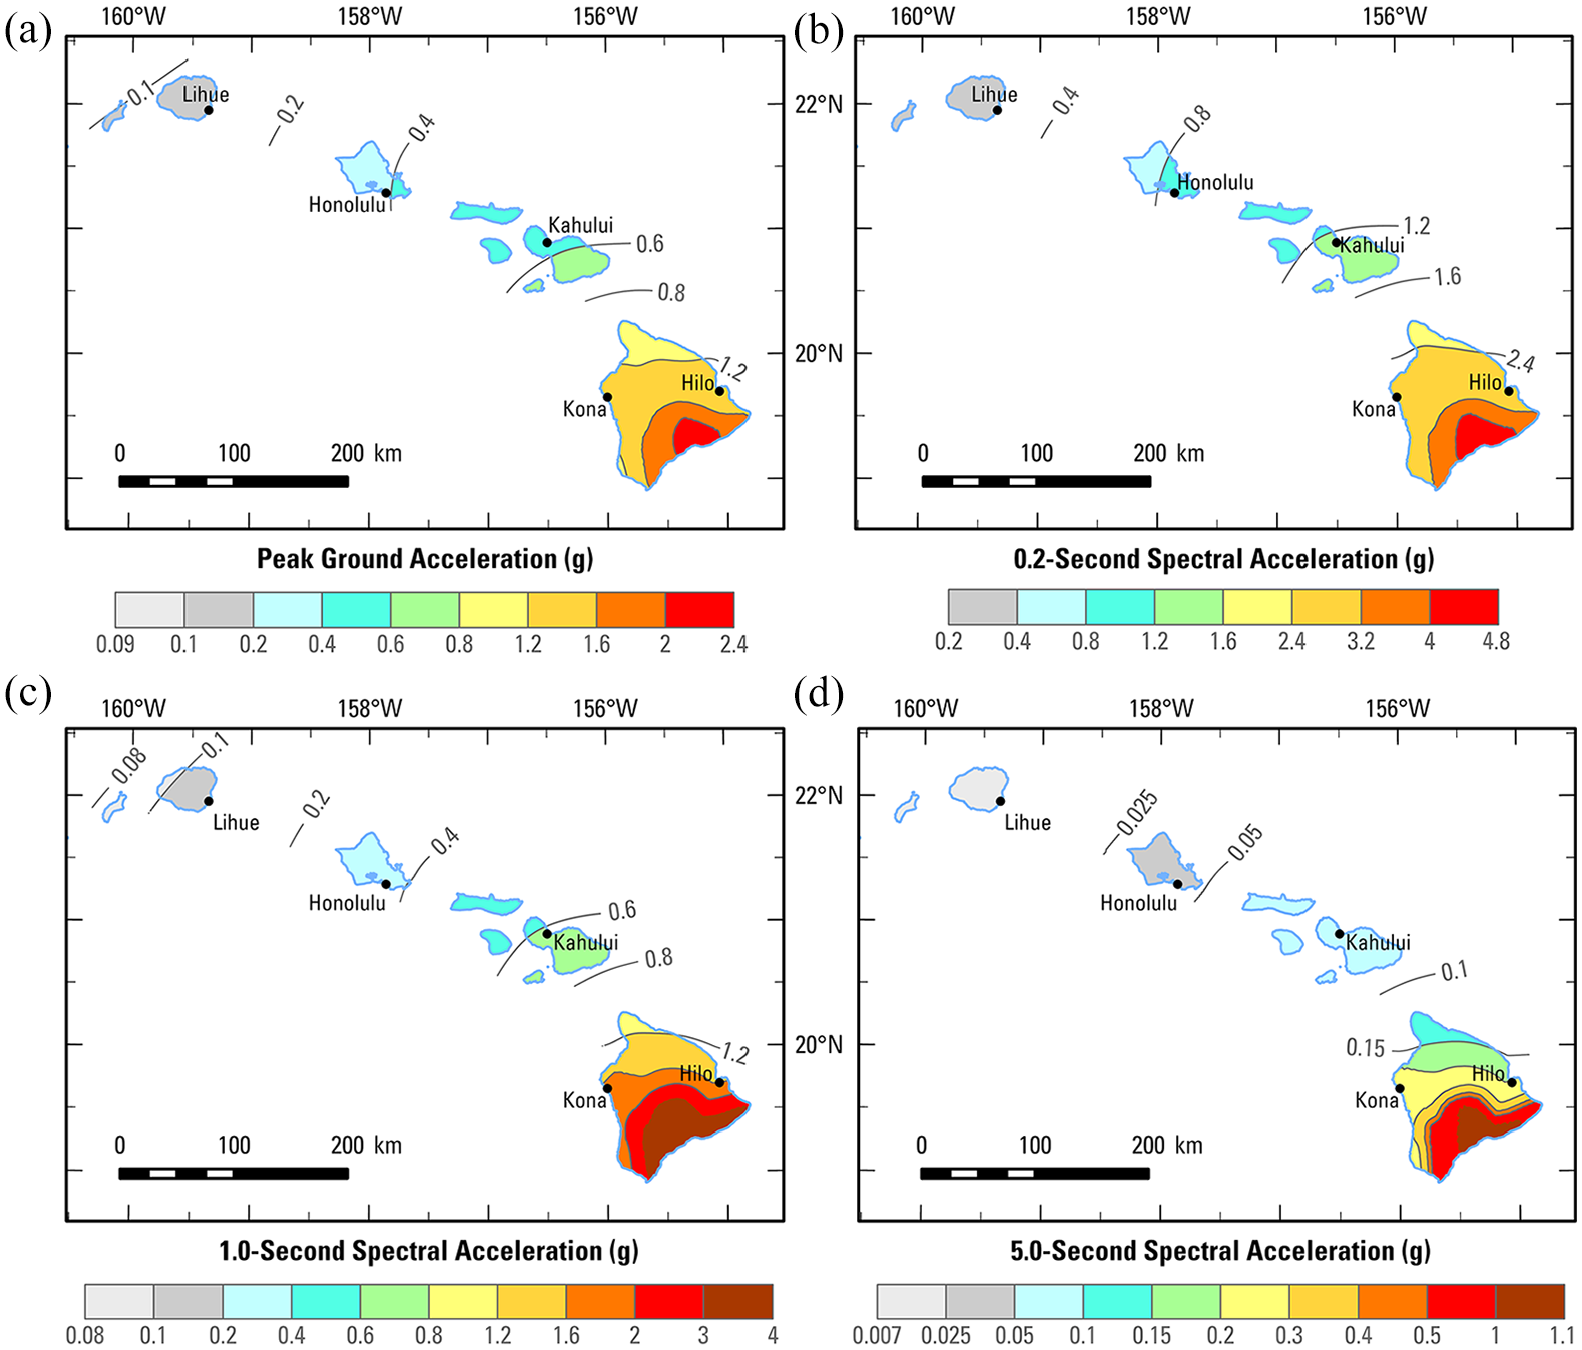
Ground motions for 2% probability of exceedance in 50 years at VS30 = 260 m/s) for (a) PGA, (b) 0.2, (c) 1, and (d) 5-s spectral accelerations for the 2021 Hawaii NSHM.
The 2021 Hawaii NSHM 2% in 50-year probability of exceedance ground motions for a reference site condition (VS30 = 760 m/s) indicate increased shaking in some areas of the Island of Hawai’i (e.g. north–northwest part of the island and areas near Kīlauea Volcano), at both short and long periods compared with ground motions in the 2001 Hawaii NSHM (Figure 14). At 0.2 s, ground motions are higher over most of the Island of Hawai’i, as well as areas on the islands of Maui, Lāna’i, Moloka’i, and O’ahu, but have decreased on the western side of the island of O’ahu and the island of Kaua’i. At 1 s, ground motions are higher in some areas of the Island of Hawai’i, as well as the islands of Maui, Lāna’i, and Moloka’i, but have decreased on the islands of O’ahu and Kaua’i. Table 3 shows a comparison of ground motion changes between the 2021 Hawaii NSHM and the 2001 Hawaii NSHM at five selected sites across the island chain for 0.2 and 1 s SA.
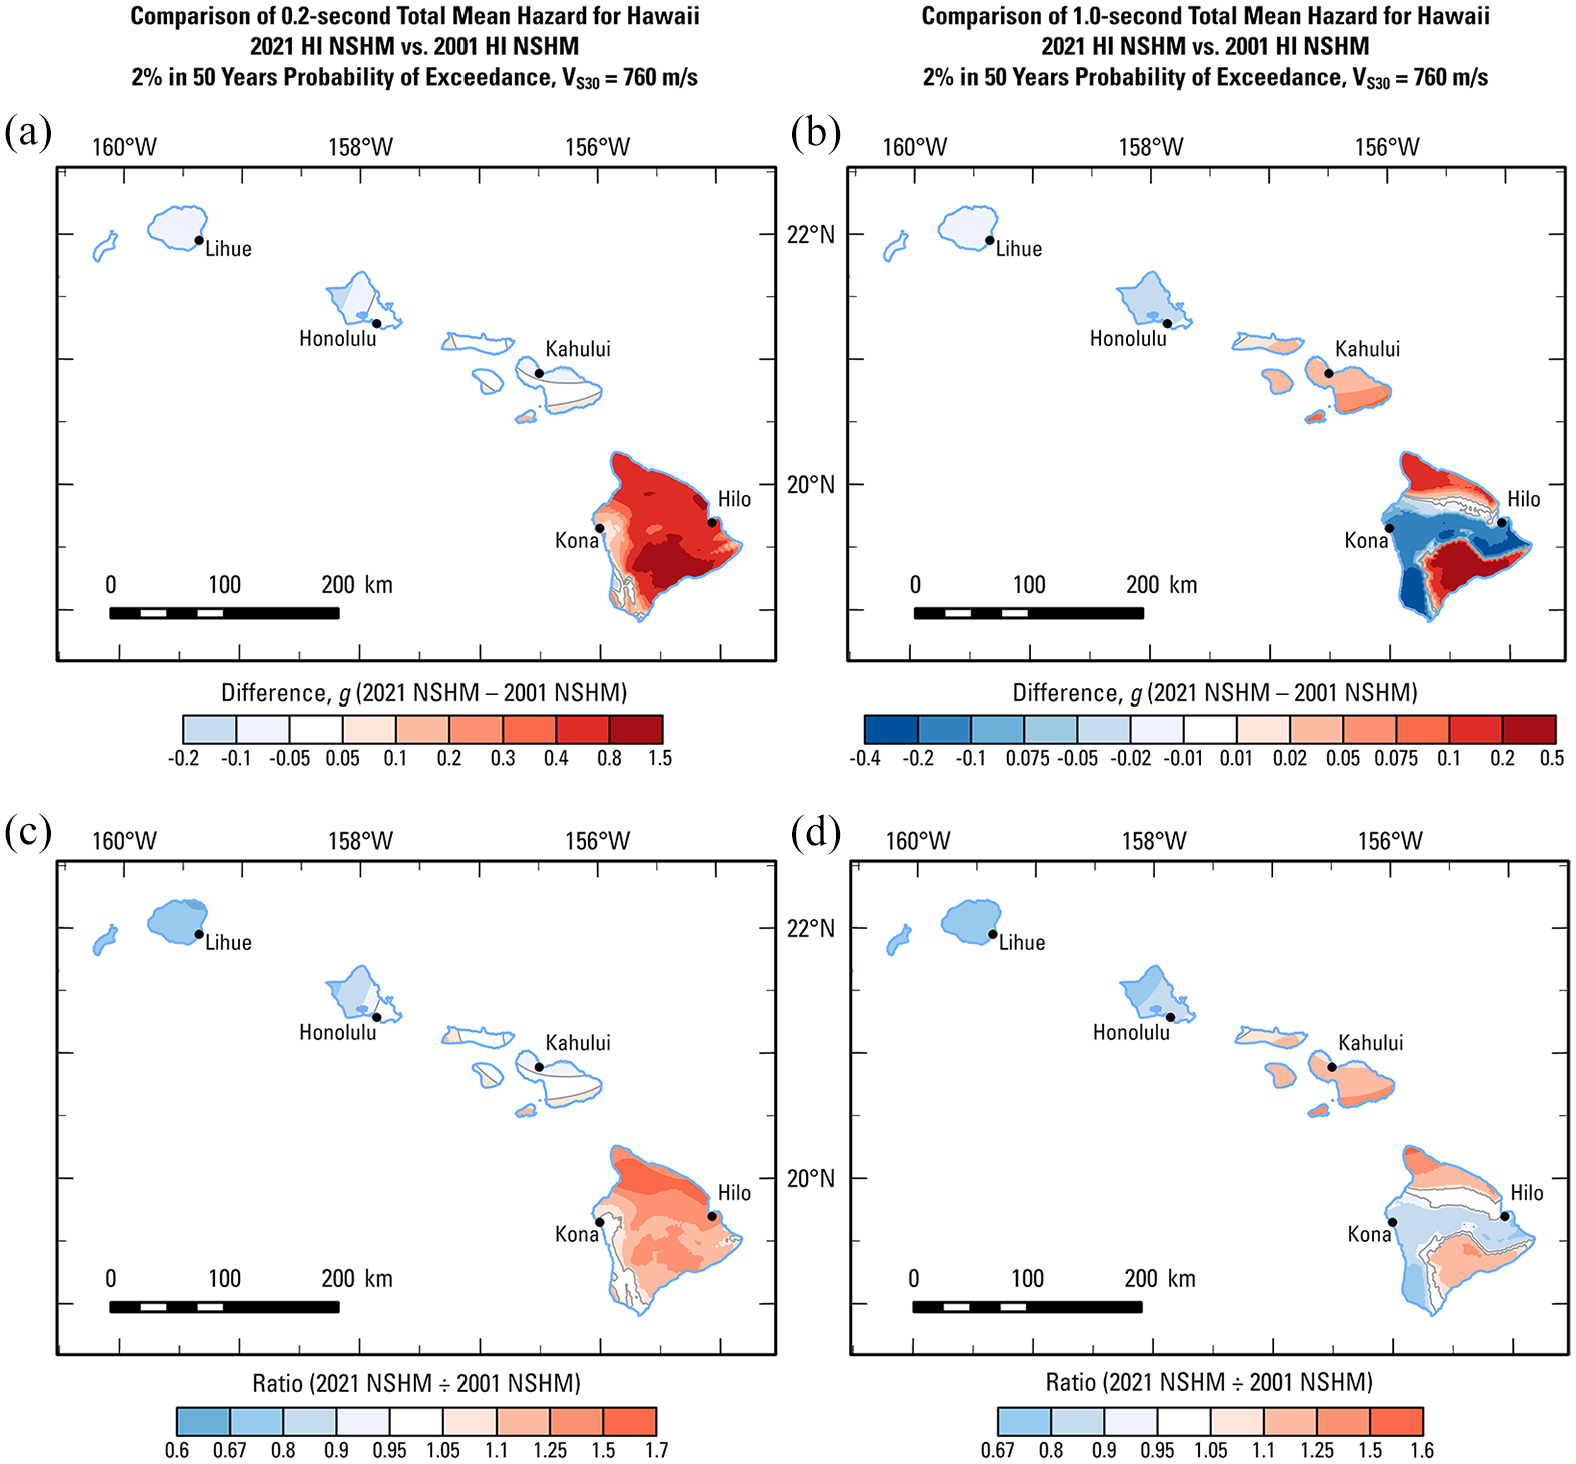
(a, b) Difference and (c, d) ratio maps showing comparisons between ground motion from the 2021 Hawaii NSHM and the 2001 Hawaii NSHM (Klein et al., 2001). Maps are for 0.2-s (a, c) and 1-s SA (b, d), 2% probability of exceedance in 50 years, and a reference site condition (VS30 = 760 m/s).
We also prepared a research hazard model, which incorporates declustered rate grids that are scaled to account for the total number of earthquakes in the full catalog (with no declustering) using factors shown in Table 1 based on Marzocchi and Taroni (2014). We developed 2% probability of exceedance in 50 years of ground motion maps for a reference site condition (VS30 = 760 m/s) at 0.2 and 1-s SA. These maps are not shown here but can be found in Rukstales et al. (2021). The hazard increases when using the Marzocchi and Taroni (2014) method because the scaled model includes more earthquakes than in the declustered catalogs. Difference and ratio maps for 0.2-s SA show increases between 0.05 and 0.2 g on the Island of Hawai’i (up to 10% increases) and less than 0.05 g everywhere else. Maps for 1.0-s SA show about 10% increases across the island chain.
Hazard curves and uniform hazard response spectra
Comparison of 0.2 and 1-s SA hazard curves for a reference site condition (VS30 = 760 m/s) for five selected sites across the island chain for the 2021 Hawaii NSHM (solid lines) and the 2001 Hawaii NSHM (dashed lines) are shown in Figure 15. At 0.2-s SA, the hazard between 2% and 10% probability of exceedance in 50 years has increased at Hilo, stayed approximately the same at Kona, and decreased at Kahului, Honolulu, and Līhu’e. At 1-s SA, Kahului has seen a slight increase in hazard, while all other sites have seen decreases of various amounts. There may be slight differences between the comparisons of ground motion maps and hazard curves due to linear rather than logarithmic interpolation of hazard curves in the 2001 NSHMs for Hawaii.
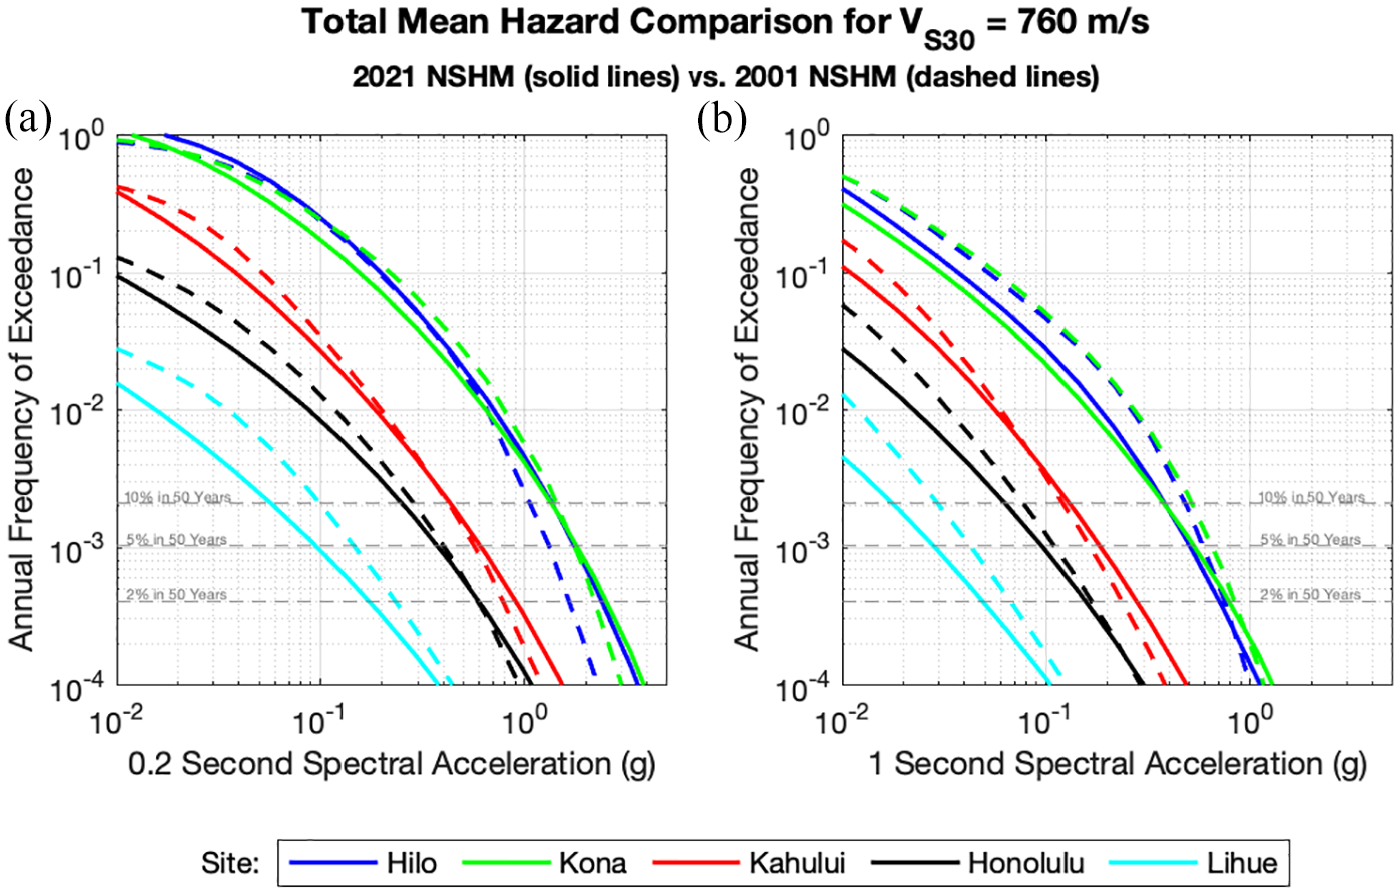
Comparison of total mean hazard curves for five sites across the Hawaiian island chain are shown for the 2021 Hawaii NSHM (solid lines) versus the 2001 Hawaii NSHM (dashed lines). Hazard curves are plotted for (a) 0.2-s and (b) 1-s SA and a reference site condition (VS30 = 760 m/s).
Uniform hazard response spectra (UHRS) are shown in Figure 16 for 21 spectral periods (plus PGA) and 8 site classes for the same 5 selected sites. The UHRS ground motions typically increase as VS30 decreases (softer soils), with the exception of VS30’s of 185 and 150 m/s, which decrease and shift to the right due to nonlinearity or other effects for intermediate periods between 0.1 and 1-s SA.
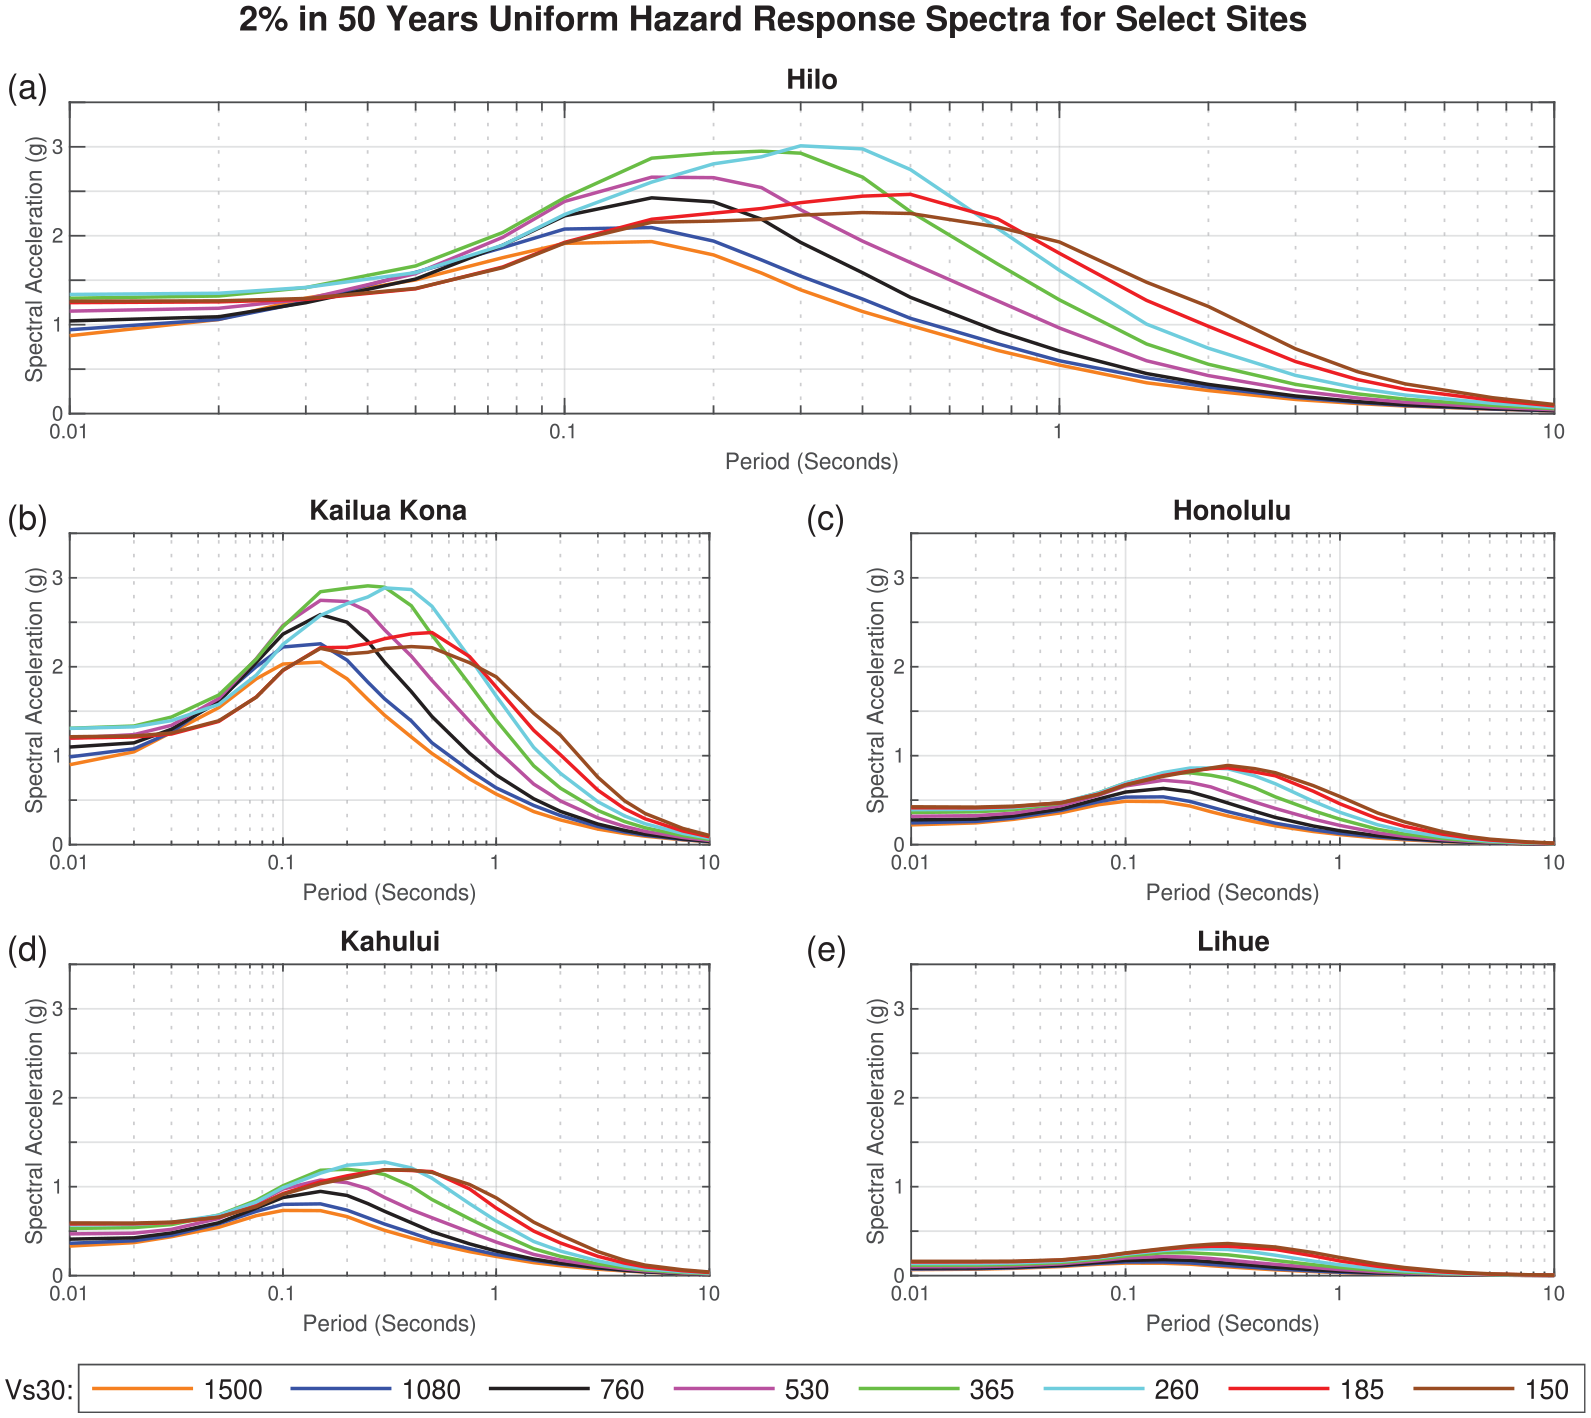
Uniform hazard response spectra are plotted for five sites across the Hawaiian island chain for a 2% probability of exceedance in 50 years: (a) Hilo, (b) Kailua-Kona, (c) Honolulu, (d) Kahului, and (e) Līhu’e. Sites are calculated for 8 different site classes corresponding to VS30 values from 150 to 1500 m/s (i.e. representing site classes A to E as defined by the 2020 NEHRP Recommended Seismic Provisions, BSSC (2020)).
Sensitivity and uncertainty analysis
When reporting hazard results, it is important to report the uncertainties associated with the hazard model. As part of the 2021 Hawaii NSHM, we performed a sensitivity and uncertainty analysis that shows the contribution of hazard from each of the model components by calculating hazard on each logic tree branch. For 2% probability of exceedance in 50 years at a site in Honolulu, we need to analyze only the shallow (northern area) and deep non-summit seismicity components to capture 99% of the total hazard. Similarly, for a site in Hilo, we need to analyze not only the shallow (southern area) and deep non-summit and deep summit seismicity components but also the south flank sources to reach the 99% contribution level.
In Figure 17, the span of 2% in 50-year probability of exceedance 0.2-s SA ground motions for (a) GMMs from the unweighted shallow non-summit north logic tree branches for Honolulu and (c) geometry from the unweighted south flank logic tree branches for Hilo are shown. In Figure 17, 2% and 10% in 50-year probability of exceedance 0.2-s SA total hazard ground motions (as well as select fractiles) at (b) Honolulu and (d) Hilo are shown. The sensitivity study for Honolulu shows that ASK14 is typically contributing to the higher ground motions, and A10 is contributing to the lower ground motions (Figure 17a). The sensitivity study for Hilo shows that the extended geometry branches are typically contributing to the higher ground motions and that the merged geometry contributes to the lower ground motions (Figure 17c). The uncertainty analysis for 2% and 10% probabilities of exceedance in 50-year ground motions span a factor of 3–4 (which could be influenced by correlations) with differences between the 15% and 85% fractiles spanning about a factor of 2 for the Honolulu and Hilo sites (Figure 17b and c).
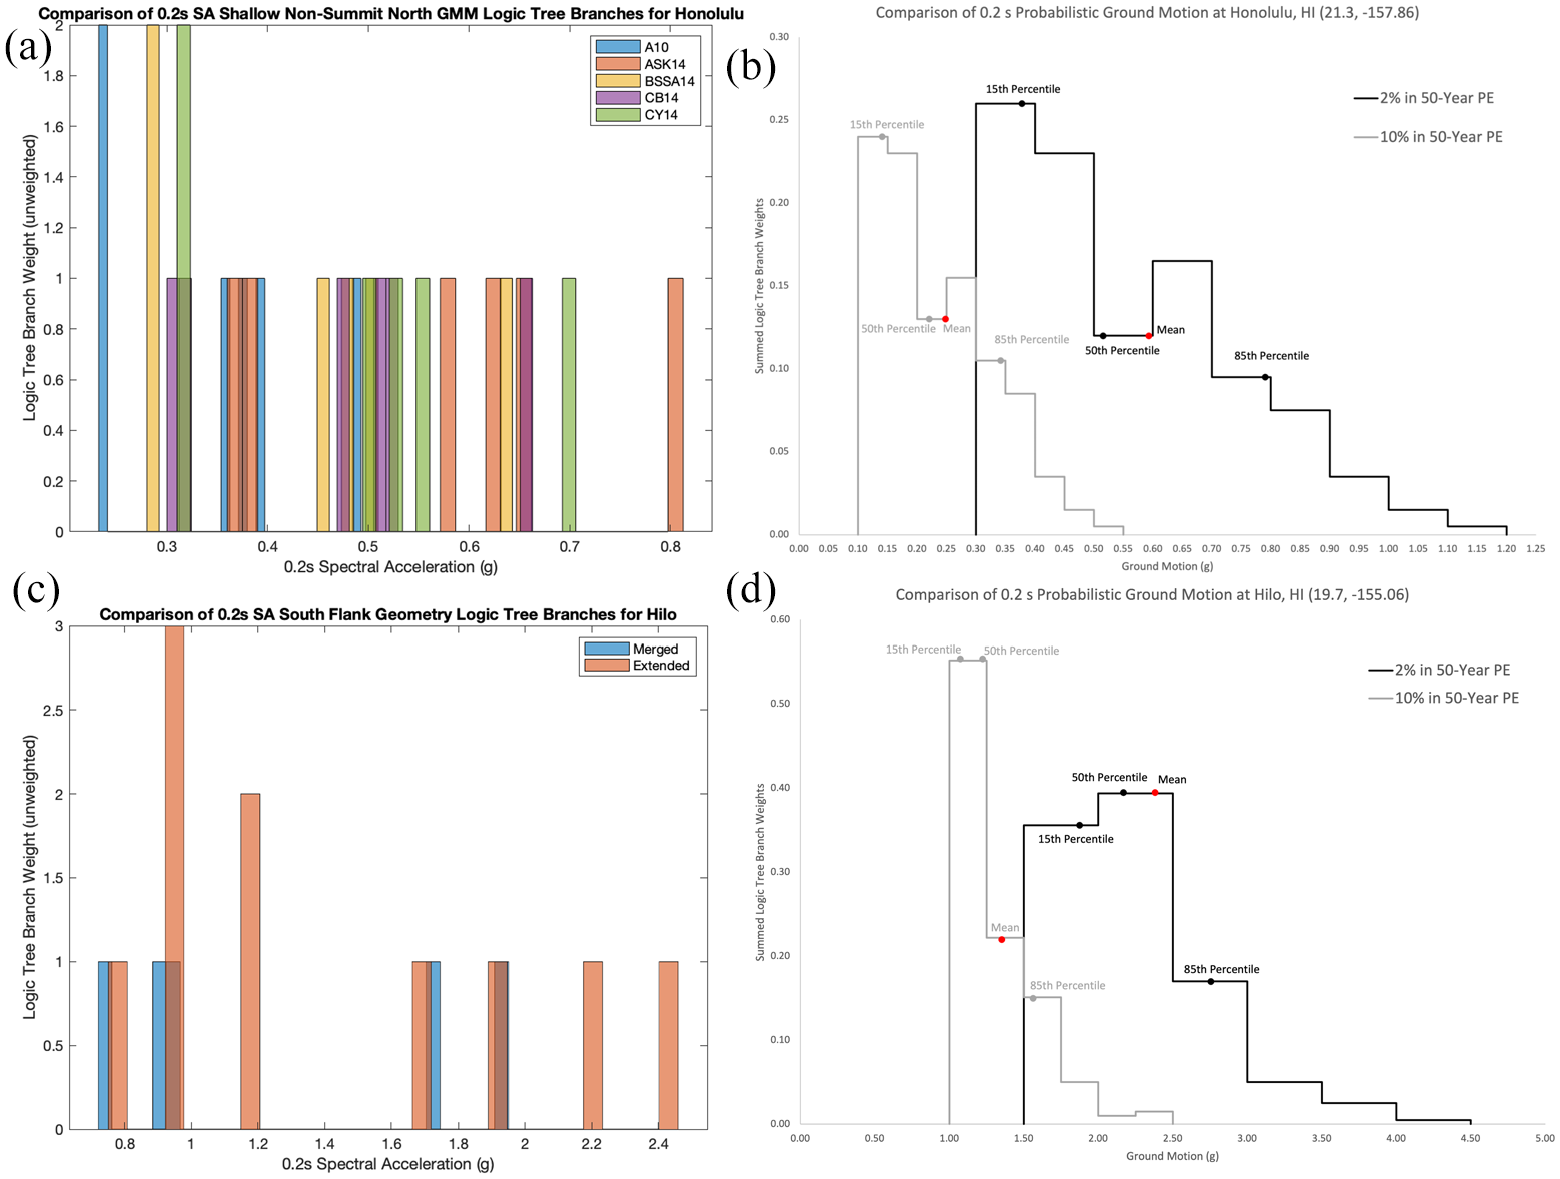
Sensitivity (a, c) and uncertainty (b, d) analysis for (a, b) Honolulu and (c, d) Hilo for 0.2-s SA for a reference site condition (VS30 = 760 m/s).
Disaggregations
Figure 18 shows disaggregations of 0.2-s SA and 1.0-s SA, 2% in 50-year probability of exceedance ground motion hazard at Honolulu and Hilo, respectively, for a reference site condition (VS30 = 760 m/s). At 0.2 and 1-s SA, smoothed gridded seismicity sources (shallow non-summit (northern area) and deep non-summit) are controlling the hazard at Honolulu, while smoothed gridded sources and fault sources (deep non-summit, deep summit, and south flank/décollement) control at Hilo. For Honolulu, seismicity around M7.5 at distances out to 300 km contribute smaller probabilities to the 1-s SA. At 0.2-s SA, the A10, ASK14, and W15 GMMs contribute the most at Honolulu, whereas the W15, BCHydro12, ASK14, A10, and CY14 GMMs contribute the most at Hilo. At 1.0-s SA, the W15 GMM contributes the most at Honolulu and Hilo.
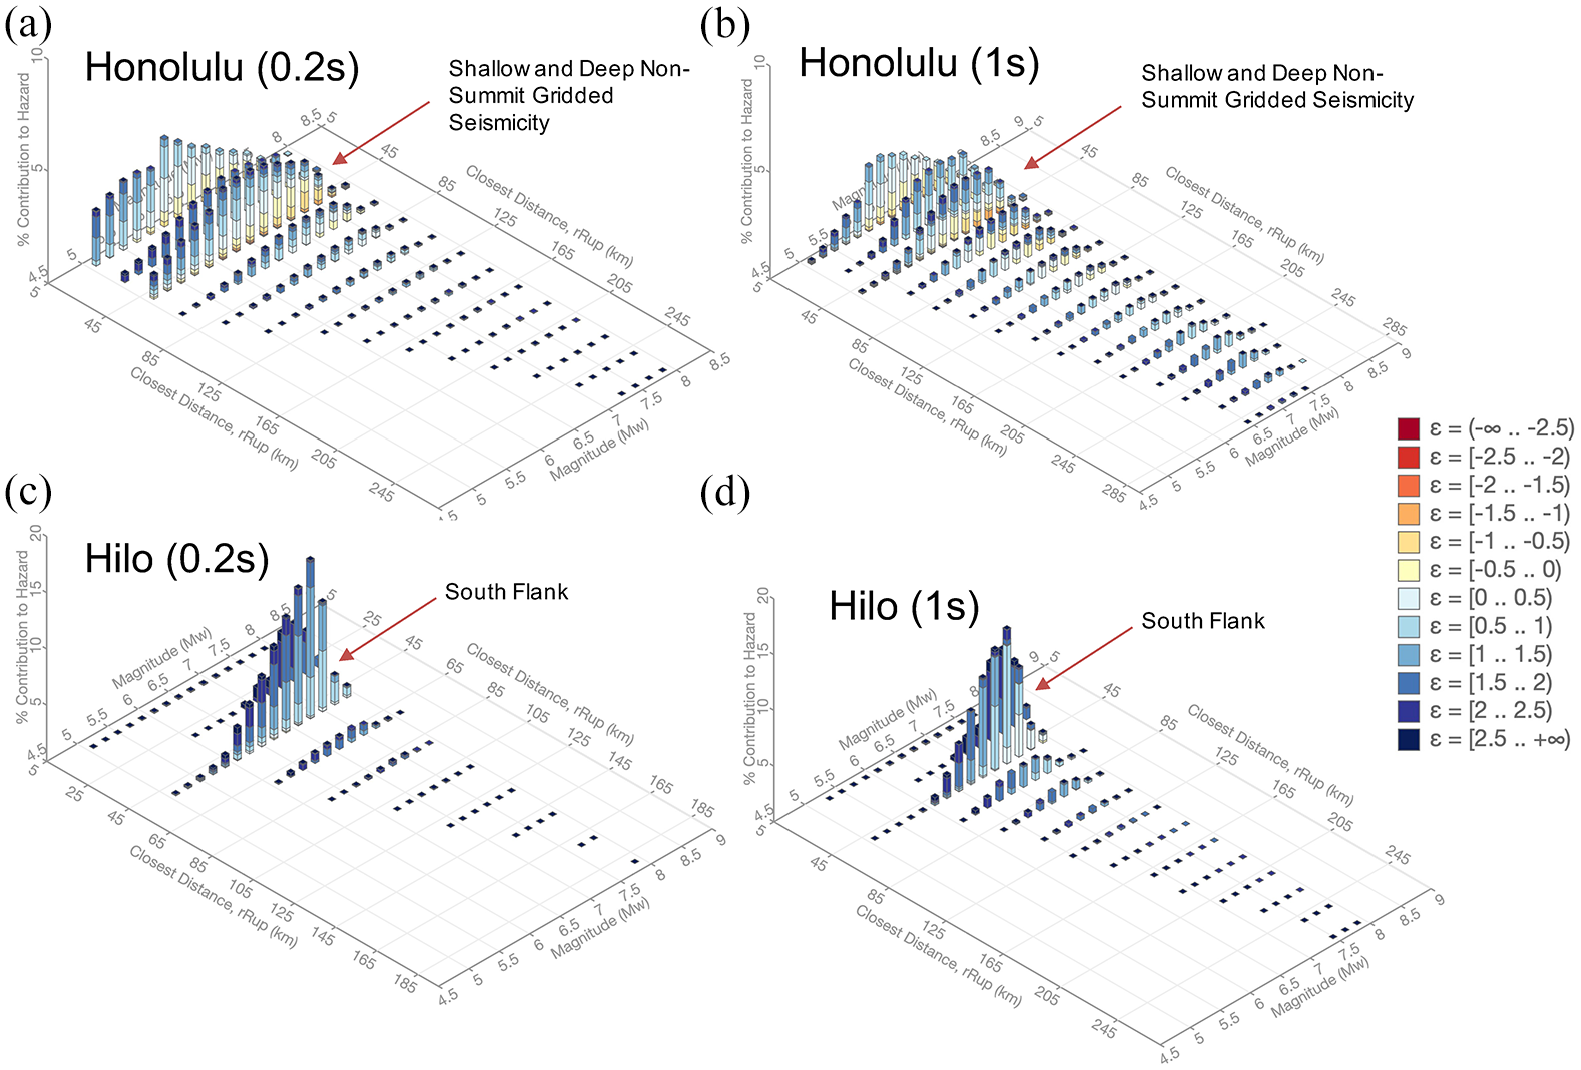
Disaggregation of total mean hazard at (a, b) Honolulu and (c, d) Hilo for 0.2-s (a, c) and 1.0-s SA (b, d).
Historical intensity observations, model forecasts, and population exposure
We compare the past intensity data defined using an MMI scale with the ground motions forecasted at Honolulu in the 2021 NSHM. Table 4 shows potential exceedances of MMI for Honolulu from historical shaking data compiled by Cox (1986, 1987). He indicates that 113 earthquakes were felt between 1859 and 1986 (127 years) and that the highest intensities during this time were from the 1871 Lāna’i earthquake with intensity between MMI VI and VII (6.5 ± 0.7) and the 1948 O’ahu earthquake which commonly experienced intensities of MMI VI and possibly intensities of MM VII in areas near Honolulu; the author indicates that these shaking values may have been amplified by site effects (observed MMIs of 6.0 ± 0.7; Cox, 1986, 1987). We are not aware of any larger intensity observations since 1986. We convert MMI to PGA using equations by Worden et al. (2012) and Wyss and Koyanagi (1992a) for comparison with our PGA map. Table 4 shows one exceedance of MMI VII and no exceedances of MMI VIII during the past 100 years. The ShakeMap conversions (based on Worden et al., 2012) imply PGAs of about 0.12 g (between 0.09 and 0.18 g) for an MMI VI and 0.22 g (between 0.18 and 0.34 g) for MMI VII. Spectral accelerations at 1 s are similar to PGA ground motions (within a couple percent g) for MMI VI and VII conversions.
Honolulu exceedances of MMI and associated PGA from Cox (1986, 1987)
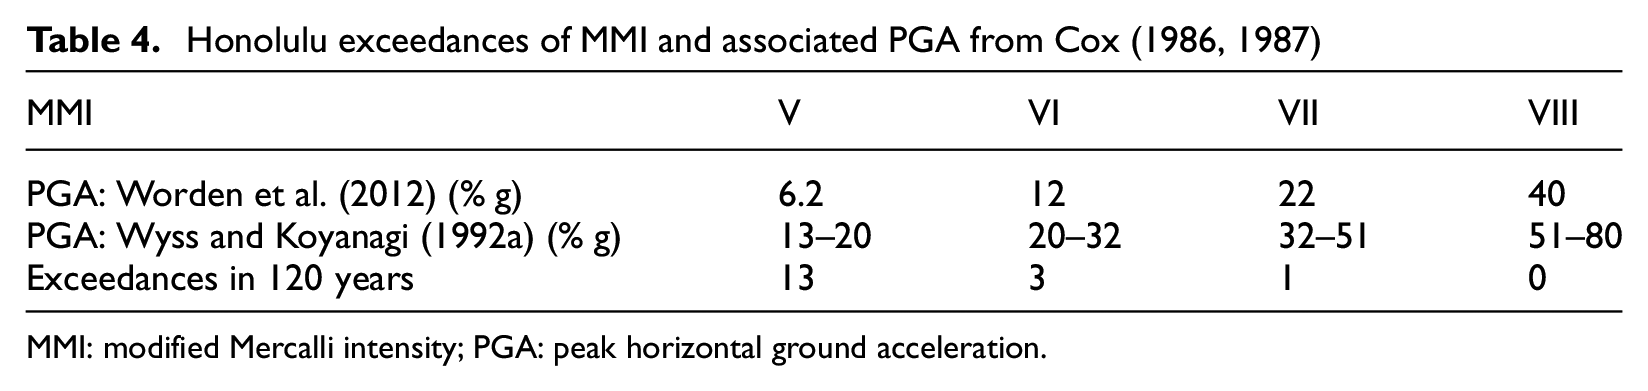
MMI: modified Mercalli intensity; PGA: peak horizontal ground acceleration.
To gain confidence in the 2021 model results, we compare the historical intensities in Honolulu with the 2021 forecasted ground motion hazard curves for PGA and 1-s SA and scenario earthquake ground shaking levels from the suite of GMMs applied in this model for the 1871 Lāna’i and 1948 O’ahu earthquakes. The 2021 Hawaii model forecasts the following PGA values for a reference site condition (VS30 = 760 m/s) hazard: 0.02 g for a 50-year return period, 0.04 g for a 100-year return period, 0.12 g for a 500-year return period, and 0.28 g for a 2500-year return period. The ground motion hazard values in the 2021 NSHMs almost double for softer soils (e.g. 50-, 100-, 500-, and 2500-year values at VS30 = 260 m/s are 0.04, 0.07, 0.19, and 0.39 g). This comparison shows that the 2021 Hawaii model for 2% in 50 years (0.28 g for a rock site and 0.39 g for a soil site) is similar to the historically observed intensities of about MMI VII (0.18–0.34 g) over the past 120 years (Table 4). Another helpful comparison is understanding how the large historical earthquakes near Honolulu have impacted this population center. We calculate the mean scenario-based PGA and 1-s SA of the GMMs for VS30 = 760 m/s for the 1871 M7.5 Lāna’i (110 km from Honolulu) and the 1948 M5.2 O’ahu (12 km from Honolulu) earthquakes. Because we do not know the mechanisms of these earthquakes, we calculate the ground shaking for both deep and shallow earthquakes. Averages for the 1871 earthquake are 0.04 g (shallow) or 0.12 g (deep mechanism) for PGA and 0.03 g (shallow) or 0.08 g (deep) for 1-s SA. Averages for the 1948 earthquake are 0.07 g (shallow and deep) for PGA and 0.02 g (shallow) or 0.01 g (deep) for 1-s SA. These are median values from GMMs, and the maximum values could be a factor of 2 higher when accounting for aleatory variability. The numbers could also double for site effects if the site is on softer soils. These ground motions with uncertainties and potential site effects are generally like the PGA and 1-s SA shaking levels observed in the past century and a half. These values are thought to be capable of causing at least slight damage (Figure 19). Clearly, other earthquakes could also contribute to this damage, as these are only historical values for two historical earthquakes.
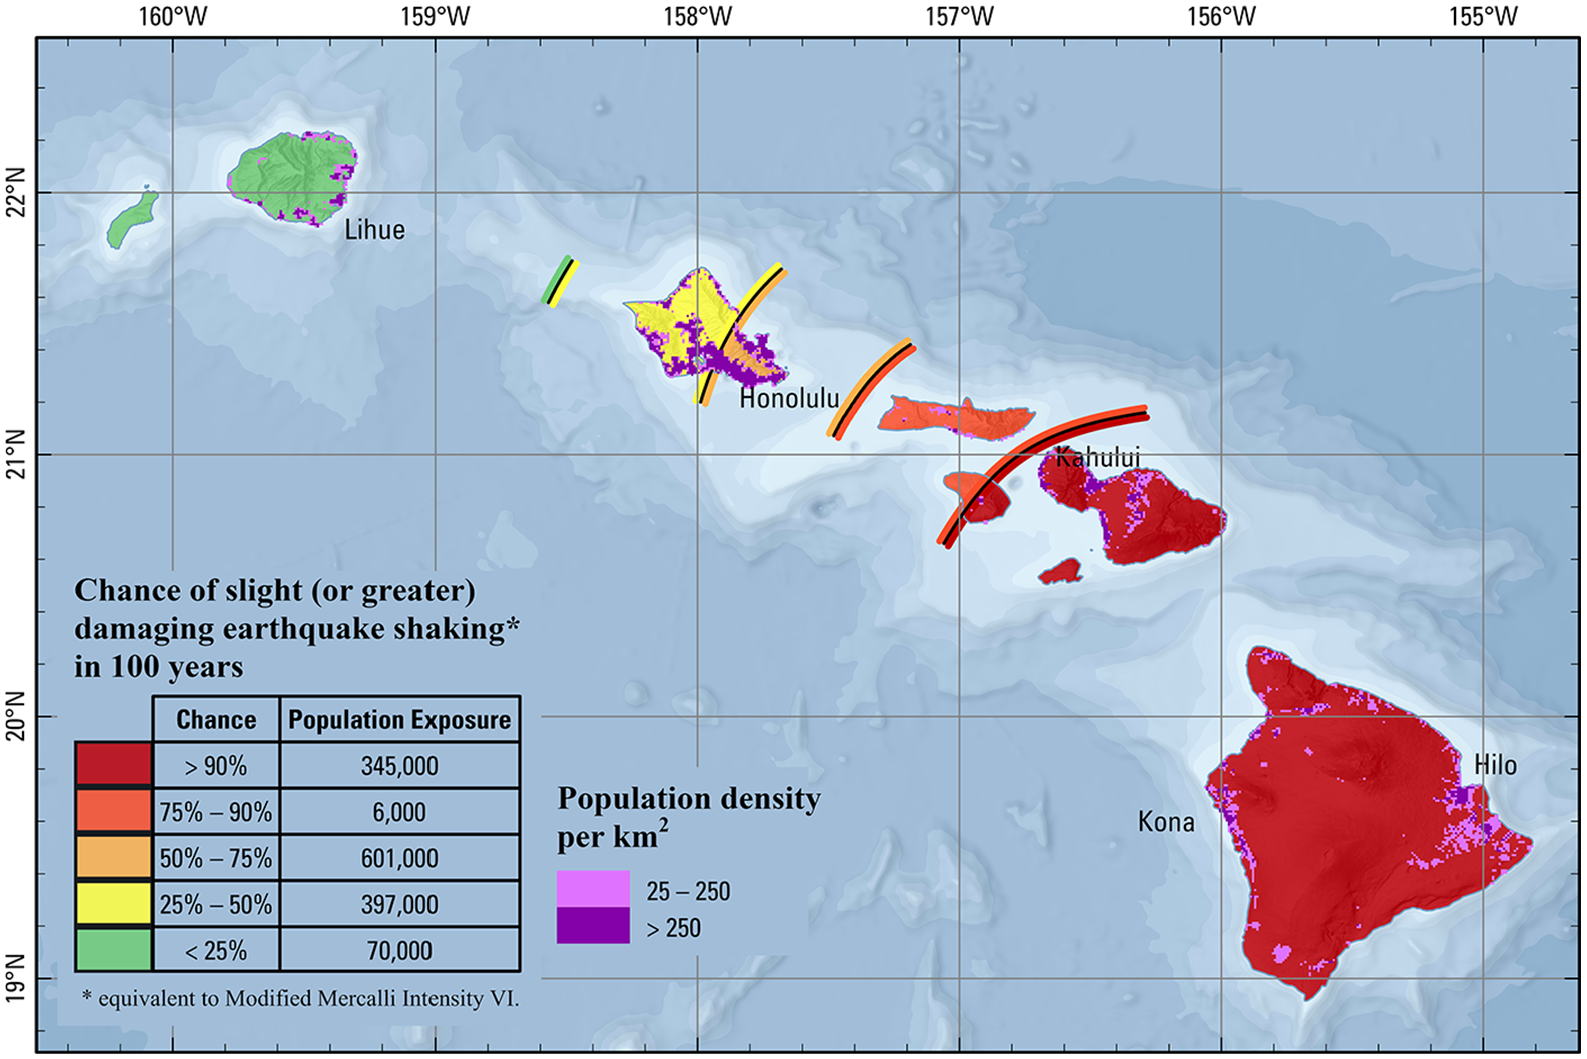
Chance of minor damaging earthquake shaking in 100 years. The shaking is based on an average from PGA and 1-s horizontal spectral response acceleration and VS30 = 260 m/s. Population exposure estimates are rounded to the nearest 1000.
To make the results of the 2021 Hawaii NSHM more relatable to the general public, we produce 100-year probability of damaging shaking maps. We make this map using the hazard results described above for PGA and 1-s SA maps and convert these to intensity (MMI values). The damaging shaking threshold is MMI VI level at which slight damage can be witnessed. We use the MMI value of 5.5 as a numeric threshold to capture the onset of MMI VI damage (slight damage). In terms of ground motions, this threshold represents an equivalent PGA (0.008 g) and a 1-s SA (0.07 g) shaking based on the ground motion-intensity conversion relationships developed by Worden et al. (2012; above, we calculate the threshold for a MMI 6 so these values for MMI 5.5 are slightly lower). Using the 2021 Hawaii NSHM hazard curves for PGA and 1-s SA at each grid point, we estimate the annual frequency of exceedance of MMI equivalent accelerations. These two estimates of annual frequencies are averaged to get a mean rate, which is then converted into equivalent Poisson probability of damaging shaking with 100-year time interval for each grid point. The chance of damaging shaking estimates obtained using this procedure are consistent with historical intensity data at Honolulu and the scenario median ground shaking estimates from historical earthquakes as discussed above. High-resolution, gridded population data from the LandScan population database (LandScanTM Database, 2018) were overlaid and aggregated by probability categories to determine population exposure as shown in Figure 19, which helps to represent a proxy for the built environment susceptible to damaging shaking. The analysis shows that a quarter of Hawaiians have a 90% chance, and more than half have a 50% chance of experiencing slightly damaging or greater earthquake shaking during the next 100 years. Populations located in Honolulu are exposed to high hazard; most of the islands to the southeast are exposed to very high hazard. These populations could experience the damaging shaking levels multiple times in their lives.
Discussion and conclusion
For the 2021 NSHM of Hawaii, we have produced a primary model that is discussed in detail in this article and is consistent with past NSHMs and a research model that allows an alternative decluster treatment for which the number of declustered earthquakes is scaled to match the full earthquake catalog rate (Marzocchi and Taroni, 2014). This research model may be useful in the future depending on how the resulting ground motions impact the design and risk assessments as well as how they are treated in other areas of the country in the 2023 NSHM. The research model may be considered as an alternative to the primary model by end users once these studies have been completed. Our assessments of the primary and research models described here show that at a 2% in 50-year hazard level, ground motions at 0.2-s SA have differences with respect to the primary model that are up to 0.2 g and ratios up to 10% increases; for 1 s, differences are less than 0.05 g and ratios are also up to 10% (see Rukstales et al., 2021 for details). It remains to be seen whether these new hazard values will have an important impact or not.
The 2021 NSHM for Hawaii is based on a probabilistic seismic hazard analysis that considers newly processed catalogs, updated geologic and geodetic-based faulting information, and recent data and formulations of Hawaii ground shaking. With help from HVO, we have constructed a new Hawaii earthquake catalog that includes the best earthquake information available at this time. Portions of this catalog could still be improved. Our seismicity assessment suggests that earthquake rates across the region are nonstationary with higher rates recorded from 1840 to 1959 and significantly lower rates recorded since 1960. We assume that these higher rates may occur in the future since they have occurred in the recent past. We weight the older rate models lower, however, because the most recent data are more accurate due to the superior recording networks that define the locations and magnitudes. Including these alternative older rates raises the hazard and is consistent with the kinked b-value applied in the 2001 model, which implicitly accounted for higher rates of larger earthquakes observed in the past. We developed and incorporated a new caldera collapse model, which contributes to the strong shaking hazard near the Kīlauea caldera. The impact of these collapses was recognized during the 2018 Kīlauea eruption but has also been observed in earlier eruptive sequences. Most of the damage from collapses is quite local because magnitudes of these events only range up to about M5.5 and the collapse events are depleted in short-period shaking energy. Therefore, these collapse events would not generally be expected to cause the widespread damage observed in larger tectonic earthquakes. Future models would benefit from additional statistical analysis of the catalog and development of new time-varying methods of assessing the earthquake rates.
In developing this hazard model, we have collected new data and accounted for new scientific studies that are used to better constrain locations and rates of décollement faults and associated ruptures. These ruptures control the hazard on the Island of Hawai’i. Along the southern and western coasts of the island, 10-km deep décollements are known to have ruptured in large earthquakes. In our models we analyze seismic, geologic, and geodetic data to define strain rates across these faults. Such data are quite sparse but show that the rates on the western portion of the island are significantly lower than along the southern coastal region. Where else these décollements may be located is not clear nor is how best to account for future earthquakes on such structures. In this assessment, we have increased the maximum magnitudes to allow M7.5–M8+ earthquakes (with small weight on the highest values) and to account for the potential of large earthquakes on unknown structures. We increase the magnitudes on the fault as well as the gridded seismicity models to account for these rupture sources. The increase of Mmax is partly justified by a new assessment of the 1871 Lāna’i earthquake (Butler, 2020), which indicates an M7.5 rather than M6.9 as previously determined. Recently, larger than expected earthquakes have been observed globally, and we need to make sure we do not neglect this important component of potential hazard. We have accounted for a broader range of earthquake ruptures than in the previous model, and these models could be better constrained with additional fault and seismicity studies.
For this assessment, we calculate hazard for many additional oscillator periods and site classes which requires additional scrutiny of the GMMs and site effects models. Observations from the 2006 Kīholo Bay earthquake and 2018 Kalapana earthquakes provide new shaking data that are used to assess these equations and better constrain the models presented here. However, additional data are still needed. Ground motion hazard values forecasted in this assessment are generally similar to the shaking values in the previous 2001 Hawaii NSHM, with the exception of Hilo (+32%) and Lihue (−30%). Changes between 2001 and 2021 are well within the factor of 2 (±1 standard deviation) uncertainties observed at the two example sites shown in Figure 18. Ground shaking levels at these two sites may have changed due to the GMMs that were modified based on addition of new strong motion data, better assessments of aleatory variability and epistemic uncertainty, and differences in the GMM prediction output variables that were previously based on various types of maximum shaking and are now based on median rotated (RotD50) values of shaking. Nevertheless, the new assessments of ground shaking near Honolulu are remarkably similar to levels anticipated in the 2001 NSHM. Results indicate a broad range of annual frequencies of ground motion exceedances across the island chain, decreasing by over a factor of 100 from the southeast to the northwest. Several new lines of research will better constrain the GMMs and shaking. For example, Hawaii-specific site amplification models could investigate the viability of site signatures in addition to VS30 to estimate site response, such as the dominant site frequency (as investigated by Hassani and Atkinson (2016), for central and eastern North America). A deeper analysis of existing strong motion and soils data and collection of additional data would be helpful in resolving how ground motions attenuate with distance and amplify when propagating through shallow soils over hard basaltic bedrock. Additional analysis of the close-in distances of caldera collapses may also be important as evidenced by some specific higher ground motions at the station HV.UWE.HN located a couple kilometers north of the caldera.
The epistemic uncertainties in our input models are quite large due to the lack of data to constrain the upper tails of the input parameter distributions and the need for updated models that better account for earthquake sources, ground shaking, and site effects. For this assessment, we calculate epistemic uncertainties, which span over a factor of 3–4, with a factor of about 2 between the 15% and 85% fractiles. Much of this uncertainty seems to be contributed by the GMMs. It is important to keep in mind that the GMMs for Hawaii suffer from limited strong motion data, site effects information, and models to forecast shaking using these inputs. Therefore, we have had to supplement our assessment with western US and subduction GMMs and amplification factors. It seems likely that these western US equations would differ from Hawaii relations due to the significant differences in tectonics (volcanic eruptive processes in Hawaii) and site conditions (mostly shallow sediment layers overlying basalt). We have checked these global GMMs with Hawaii data (McNamara et al., 2020a), and generally, the predictions seem to be centered on the observations and should provide a reasonable first-order estimate of potential shaking. However, better assessments of the potential range of ground shaking for Hawaiian earthquakes, more V s profiles at sites across the island, and improved assessments of aleatory and epistemic uncertainties would be helpful in constraining future assessments.
We include a simple risk analysis to help users consider the impacts of future earthquakes. This assessment shows that many parts of the Hawaiian island chain are susceptible to damaging earthquake shaking. Slight or greater damage is likely across most of the islands, especially for the islands southeast of O’ahu. Application of these data into policy documents can inform policy decision-making and can be used to define best practices for mitigating future damage in Hawaii.
Footnotes
Acknowledgements
The authors thank the US. Geological Survey Earthquake Hazards Program (EHP) for funding the development of the 2021 National Seismic Hazard Model (NSHM) for Hawaii, the NSHM Project Steering Committee for helpful participatory comments and review, participants at the public workshop at the University of Hawai‘i at Mānoa in September 2019 (especially Paul Wessel and Rhett Butler for hosting the Hawaii workshop), participants at the virtual public workshop in November 2020, and the public for their review and insights during the public review period. They also thank Ken Hudnut (EHP), Emily Montgomery-Brown, Alicia Hotovec-Ellis, Kyle Anderson, and Tina Neal (Volcano Program), and Garrett Apuzen-Ito and James Foster at the University of Hawai’i at Mānoa for sharing geodetic data and results. They thank Warner Marzocchi for insights on the scaling factors for declustered catalogs; Dina Hunt, Melanie Walling, and Nick Gregor for important discussions on Hawaii hazard models; and Nilesh Shome for advice on uncertainty analysis. Several government and state agencies provided information including the Commission on Water Resource Management and the Naval Facilities Engineering Systems Command (NAVFAC Hawaii). They thank Ivan Wong, Robert Darragh, Qimin Wu, and Sarah Smith for providing alternative VS30 versions of the ![]() GMM, as well as Gail Atkinson and Norm Abrahamson for answering questions about their ground motion models. They thank the members of the Hawaii Earthquake and Tsunami Advisory Committee (HETAC) for helpful discussions on the modeling. Rhett Butler provided important insights and data on historical seismicity and geophysical instrumentation. They thank Earthquake Spectra editors and reviewers Ivan Wong and Emel Seyhan, and USGS reviewers Ned Field, Nico Luco, David Wilson, Ryan Gold, and Janet Slate for editing and providing helpful feedback on the manuscript. Any use of trade, firm, or product names is for descriptive purposes only and does not imply endorsement by the US Government.
GMM, as well as Gail Atkinson and Norm Abrahamson for answering questions about their ground motion models. They thank the members of the Hawaii Earthquake and Tsunami Advisory Committee (HETAC) for helpful discussions on the modeling. Rhett Butler provided important insights and data on historical seismicity and geophysical instrumentation. They thank Earthquake Spectra editors and reviewers Ivan Wong and Emel Seyhan, and USGS reviewers Ned Field, Nico Luco, David Wilson, Ryan Gold, and Janet Slate for editing and providing helpful feedback on the manuscript. Any use of trade, firm, or product names is for descriptive purposes only and does not imply endorsement by the US Government.
Declaration of conflicting interests
The author(s) declared no potential conflicts of interest with respect to the research, authorship, and/or publication of this article.
Funding
The author(s) received no financial support for the research, authorship, and/or publication of this article.