
Abstract
US Geological Survey (USGS) National Seismic Hazard Models (NSHMs) are used extensively for seismic design regulations in the United States and earthquake scenario development, as well as risk assessment and mitigation for both buildings and infrastructure. This 2023 update of the long-term, time-independent Alaska NSHM includes substantial changes to both the earthquake rupture forecast (ERF) and ground motion models (GMMs). The ERF includes numerous additions to the finite-fault model, considers two deformation models, and introduces updated declustering and smoothing algorithms in the gridded background seismicity model. For the Alaska–Aleutian subduction zone, megathrust earthquakes occur on an updated structural and segmentation model, and the moment magnitude (M) 8+ rupture and rate model include a logic tree branch that considers slip rates derived from geodetic models of interface coupling. The megathrust model considers multiple models of down-dip width, and magnitudes are computed using newly developed scaling relations. For subduction intraslab events and subduction interface events with M < 7, the 2023 update uses a smoothed seismicity model with rupture depths derived from Slab2. The 2023 model updates GMMs in all tectonic settings using the recently published Next Generation Attenuation Subduction (NGA-Sub) GMMs for subduction interface and intraslab events, and the NGA-West2 GMMs for active crustal settings. Collectively, additions and updates to the Alaska NSHM result in hazard increases across most of south-central Alaska relative to the previous model, published in 2007. These changes are primarily due to the adoption of updated rate models for the large-magnitude interface events and the NGA-Sub GMMs that have much higher aleatory variability (sigma), consistent with global observations, and that include models of epistemic uncertainty.
Introduction
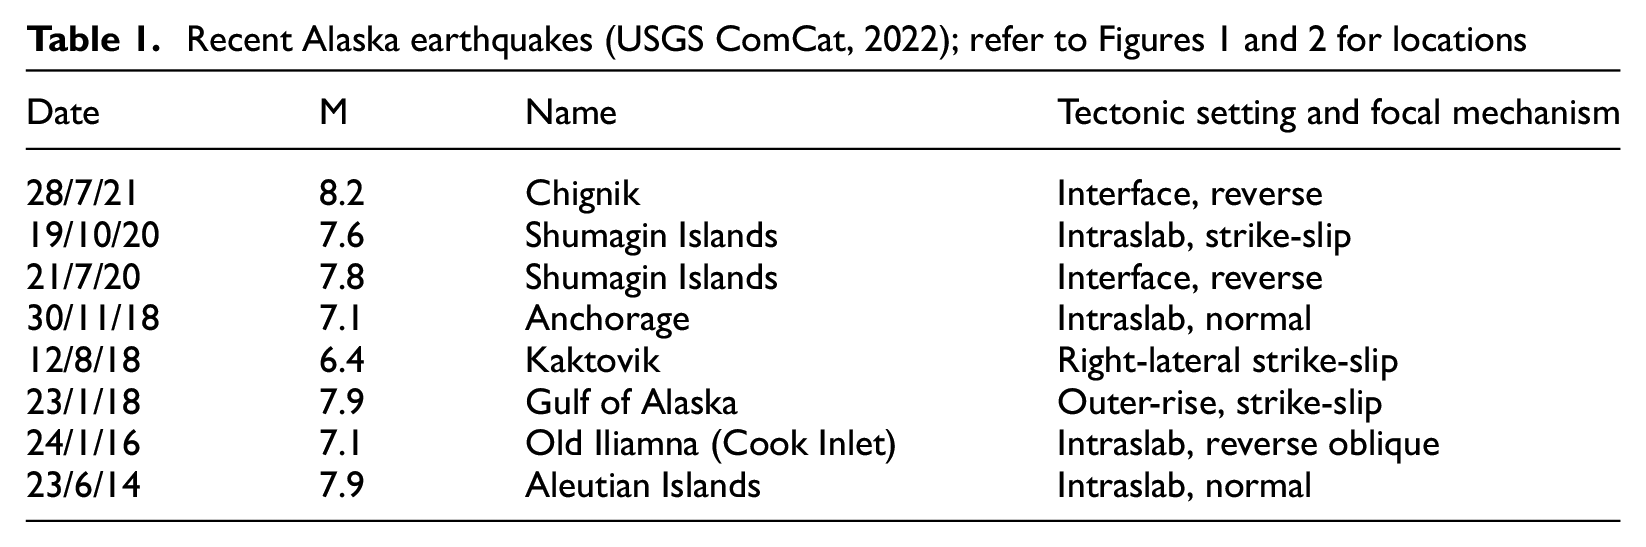
Over the past century, the State of Alaska has experienced many damaging crustal and subduction interface and intraslab earthquakes (Table 1; Figures 1 and 2). These have occurred on the 3440-km long Aleutian megathrust, the 1570-km long Denali crustal transform fault, the 1100-km long Queen Charlotte–Fairweather plate-boundary transform fault, and in areas of lower seismicity across northern Alaska (Figures 1 and 2). Recent slip on the subduction zone interface in Alaska has accommodated eight moment magnitude (M) 8+ earthquakes since 1900 as well as one of the largest earthquakes on record, the 27 March 1964 M9.2 Great Alaska earthquake. Important historical crustal earthquakes include the 2002 M7.9 Denali earthquake that occurred on the branching strike-slip structures of the Denali–Totshunda fault system and the five M7+ earthquakes on the Queen Charlotte–Fairweather system that have occurred since 1900 (Alaska Earthquake Center, 1987). The 2018 M7.1 Anchorage earthquake (West et al., 2020) highlighted the hazard potential of deep intraslab earthquakes near Anchorage. The moderate 2018 M6.4 Kaktovik strike-slip crustal earthquake within the North Slope region brought attention to the hazard potential in northern Alaska, where seismicity rates are typically much lower. The new 50-state National Seismic Hazard Model (NSHM), which includes the model described herein, shows that Anchorage has one of the highest hazard levels in the United States (U.S.) (Petersen et al., 2023). A recent U.S. Geological Survey (USGS)-Federal Emergency Management Agency (FEMA) risk assessment based on the 2007 NSHM for Alaska indicates an expected earthquake loss of US$121 million per year for Alaska buildings, with most losses centered in the Anchorage region (Jaiswal et al., 2023).
Recent Alaska earthquakes (USGS ComCat, 2022); refer to Figures 1 and 2 for locations
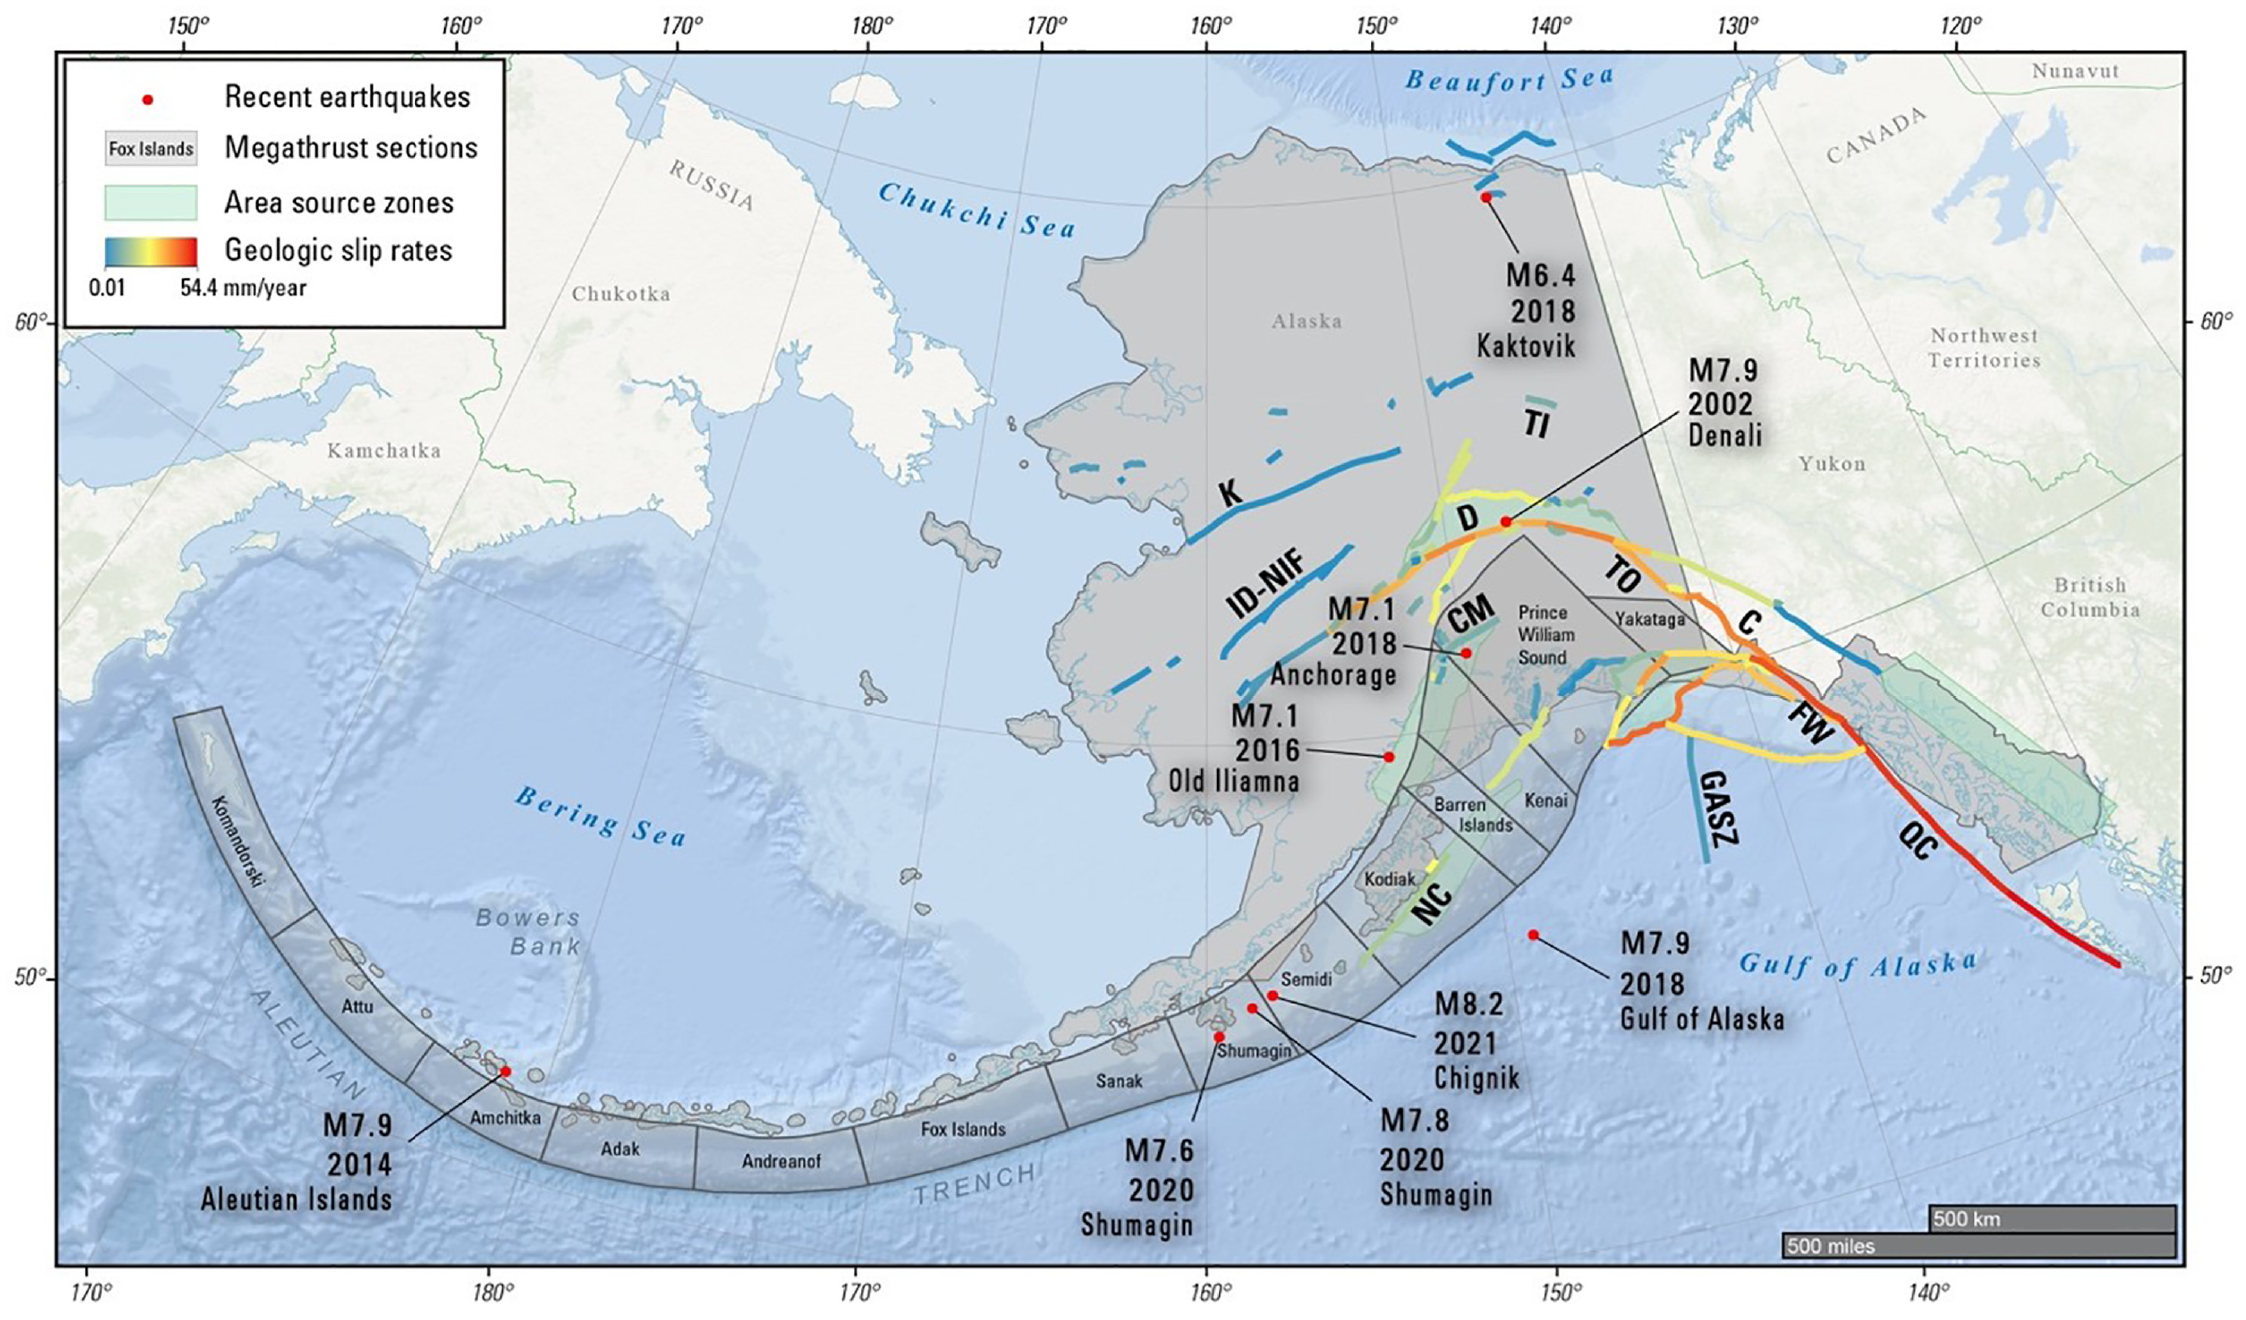
Map of Alaska showing the fault and interface sections used in the 2023 Alaska National Seismic Hazard Model. Epicenters (red dots) of recent large earthquakes with moment magnitude (M) are included for reference (Table 1). Lines are faults from Bender et al. (2021) colored by slip rate. Gray, transparent polygons are the subduction interface sections (showing down-dip and up-dip extent) in the model. Selected faults are labeled as follows: Castle Mountain [CM], Connector [C], Denali [D], Fairweather [FW], Gulf of Alaska Shear Zone [GASZ], Iditarod–Nixon Fork [ID-NIF], Kaltag [K], Narrow Cape [N], Queen Charlotte [QC], Tintina [TI], and Totschunda [TO]. Map projection: Alaska Albers equal area, WGS 84 datum; bathymetry: GEBCO (GEBCO Compilation Group, 2023).
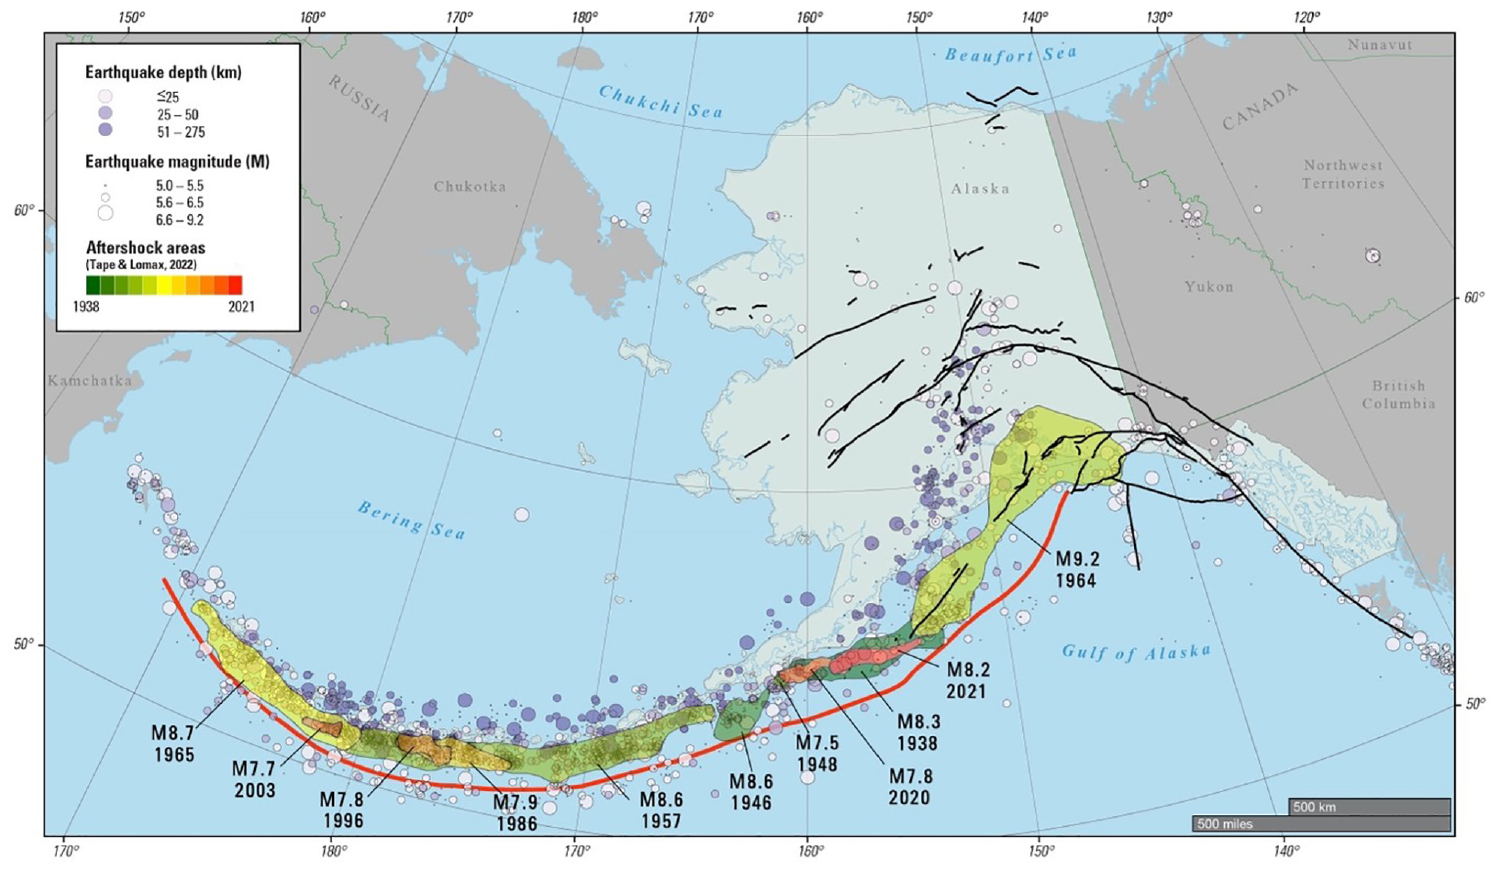
Map of Alaska showing the trench axis that marks the southern edge of the Aleutian megathrust (red line), faults included in the 2023 National Seismic Hazard Model (black), moment magnitude (M) ≥ 5 events in the catalog used for the gridded seismicity model declustered using the Reasenberg (1985) method, and aftershock regions (colored polygons) of historical megathrust earthquakes after Tape and Lomax (2022). Refer to Figure ES1-1 (in electronic supplement ES1) for an illustration of the full catalog, which better highlights structural features and areas of high historical earthquake rate. Map projection: Alaska Albers equal area, WGS 84 datum; bathymetry: GEBCO (GEBCO Compilation Group, 2023).
The USGS develops NSHMs for the U.S. and its territories to forecast the locations, sizes, and ground motions of potential earthquakes. The NSHMs have long been a scientific foundation of seismic design regulations in the U.S.: National Earthquake Hazard Reduction Program (NEHRP) Recommended Seismic Provisions for New Buildings and Other Structures (NEHRP Provisions, e.g. Building Seismic Safety Council [BSSC], 2020). In addition, the models are applied in earthquake risk assessments, seismic safety plans, mortgage lending, the setting of insurance premiums, and other important public policy decision-making. Following an early assessment of Alaska earthquake hazards by Sykes (1971), the first Alaska NSHM was produced by Thenhaus et al. (1985). This was followed by a model in 1999 (Wesson et al., 1999), with an update in 2007 (Wesson et al., 2007) that for the first time considered crustal faults in interior Alaska, including those that ruptured in the 2002 Denali earthquake. Boyd et al. (2008) then published a time-dependent version of the 2007 update. This article describes the long-term, time-independent 2023 NSHM for Alaska.
Since publication of the 2007 Alaska NSHM, numerous important geologic, tectonic, and geodetic data, models, and methods have been collected and assessed that permit an improved description of fault geometry and deformation rates across the state. Although Alaska sits squarely at the complex transition from transform to subduction motion between the Pacific and North American plates, the tectonics and structural geology of the region is better understood than ever due to abundant new EarthScope Consortium (2023) and other data, and the development of new geodetic slip-rate models for both crustal faults (Elliott and Freymueller, 2020) and the Alaska–Aleutian subduction zone (Briggs et al., 2024). The Aleutian arc accommodates from 60 (eastern end) to 73 mm/year (western end) of northwest motion of the Pacific Plate relative to stable North America, with plate motion becoming more right-lateral oblique in the western portion of the arc. This plate interface accounts for most of the large-magnitude seismicity in Alaska.
Recent work also includes analysis of new seismic reflection and refraction profiles and the rich earthquake catalog yielding an improved model of the plate interface geometry (Slab2, Hayes et al., 2018). These data show the flattening of the plate interface at depths of 20–40 km beneath the Prince William Sound, Kenai, and Kodiak subduction interface sections and a steeper interface to the west (Figure 1). Recent research has also better defined paleoearthquake and paleotsunami recurrence on the Aleutian megathrust (e.g. Briggs et al., 2014; Nelson et al., 2015; Witter et al., 2014, 2016, 2019). Prior to 2007, details of the Queen Charlotte–Fairweather fault system were not well understood. Over the past 15 years, however, analysis of onshore and offshore data collected by ocean-bottom seismometers has delineated details of the fault geometry and partitioning of slip between strike-slip and reverse-slip fault sections, as well as informed estimates of slip rate across the system. Brothers et al. (2020) show that the Queen Charlotte fault marks the singular transform boundary that accommodates the entire Pacific-North America relative plate rate (53 mm/year). To the north, the Queen Charlotte fault comes onshore as the strike-slip Fairweather fault with a reduction in slip rate, and Elliott and Freymueller (2020) demonstrate that the strike-slip Connector fault channels that strike-slip motion up onto the interior Denali and Totschunda faults (Figure 1). To the west of the Fairweather fault, other onshore and offshore reverse faults take up the residual slip in the transition to the Alaska–Aleutian subduction zone. This complex zone of deformation spans south-central Alaska and arose from Miocene collision and ongoing subduction of the buoyant Yakutat terrane, or oceanic plateau (Bruns, 1985; Eberhart-Phillips et al., 2006). Numerous other studies, detailed in Haeussler et al. (2024), have also contributed to a much-improved characterization of the network of crustal faults in south and central Alaska.
This update of the Alaska NSHM incorporates new ground motion models (GMMs) for subduction interface and intraslab earthquakes and adopts the Next Generation Attenuation GMMs for crustal earthquakes (NGA-West2 hereafter). The NGA-Subduction (NGA-Sub hereafter) GMMs for interface and intraslab earthquakes were developed using a global dataset with 214,020 records from 1880 earthquakes as well as an Alaska-specific dataset with 3026 records (Mazzoni et al., 2022). The NGA-Sub GMMs are documented in Bozorgnia et al. (2022), Abrahamson and Gülerce (2022), Kuehn et al. (2023), and Parker et al. (2022). The GMMs were developed for the RotD50 (50th-percentile ground motion over all rotation angles) component of horizontal ground motions over oscillator periods between 0.01 and 10 s. They apply site effects for VS30 (time-averaged shear-wave velocity (VS) in the upper 30 m) and depths to VS velocities of 1.0 and 2.5 km/s (Z1 and Z2.5), with 311 of the 6502 sites applied in the analysis coming from Alaska (Ahdi et al., 2022). The NGA-Sub models update several older models, as described below. The 2023 Alaska NSHM is used to compute statewide probabilistic seismic hazard curves for 21 response spectral periods, peak ground acceleration and velocity, and eight VS30 values that are required for recent seismic design regulations. The hazard curves record the annual rates of exceeding a range of ground motions and are in turn used to create maps of ground motion at various return periods. The models do not consider sedimentary basin effects; such site effects could be considered for future versions of the Alaska NSHM.
The purpose of this article is to describe the probabilistic time-independent assessment of seismic hazard calculated from the 2023 Alaska NSHM, show sensitivities and changes of the new model compared with the prior 2007 model, and describe ways the model may be improved in the future. The two fundamental components of an NSHM that are inputs to a probabilistic seismic hazard analysis (PSHA) are (1) an earthquake rupture forecast (ERF; also known as a seismic source model) that gives the probabilities of all possible damaging (M ≥ 5) earthquakes in a region over a specified timespan, and (2) GMMs, which provide probabilistic estimates of the ground shaking for a given seismic event considering local site conditions. Both components organize alternative models into logic trees that represent epistemic uncertainty in the model (Figure 3). This article presents an overview of each component and describes the updated elements of each, along with implementation details and logic tree weights, followed by a discussion of the implications for seismic hazard.
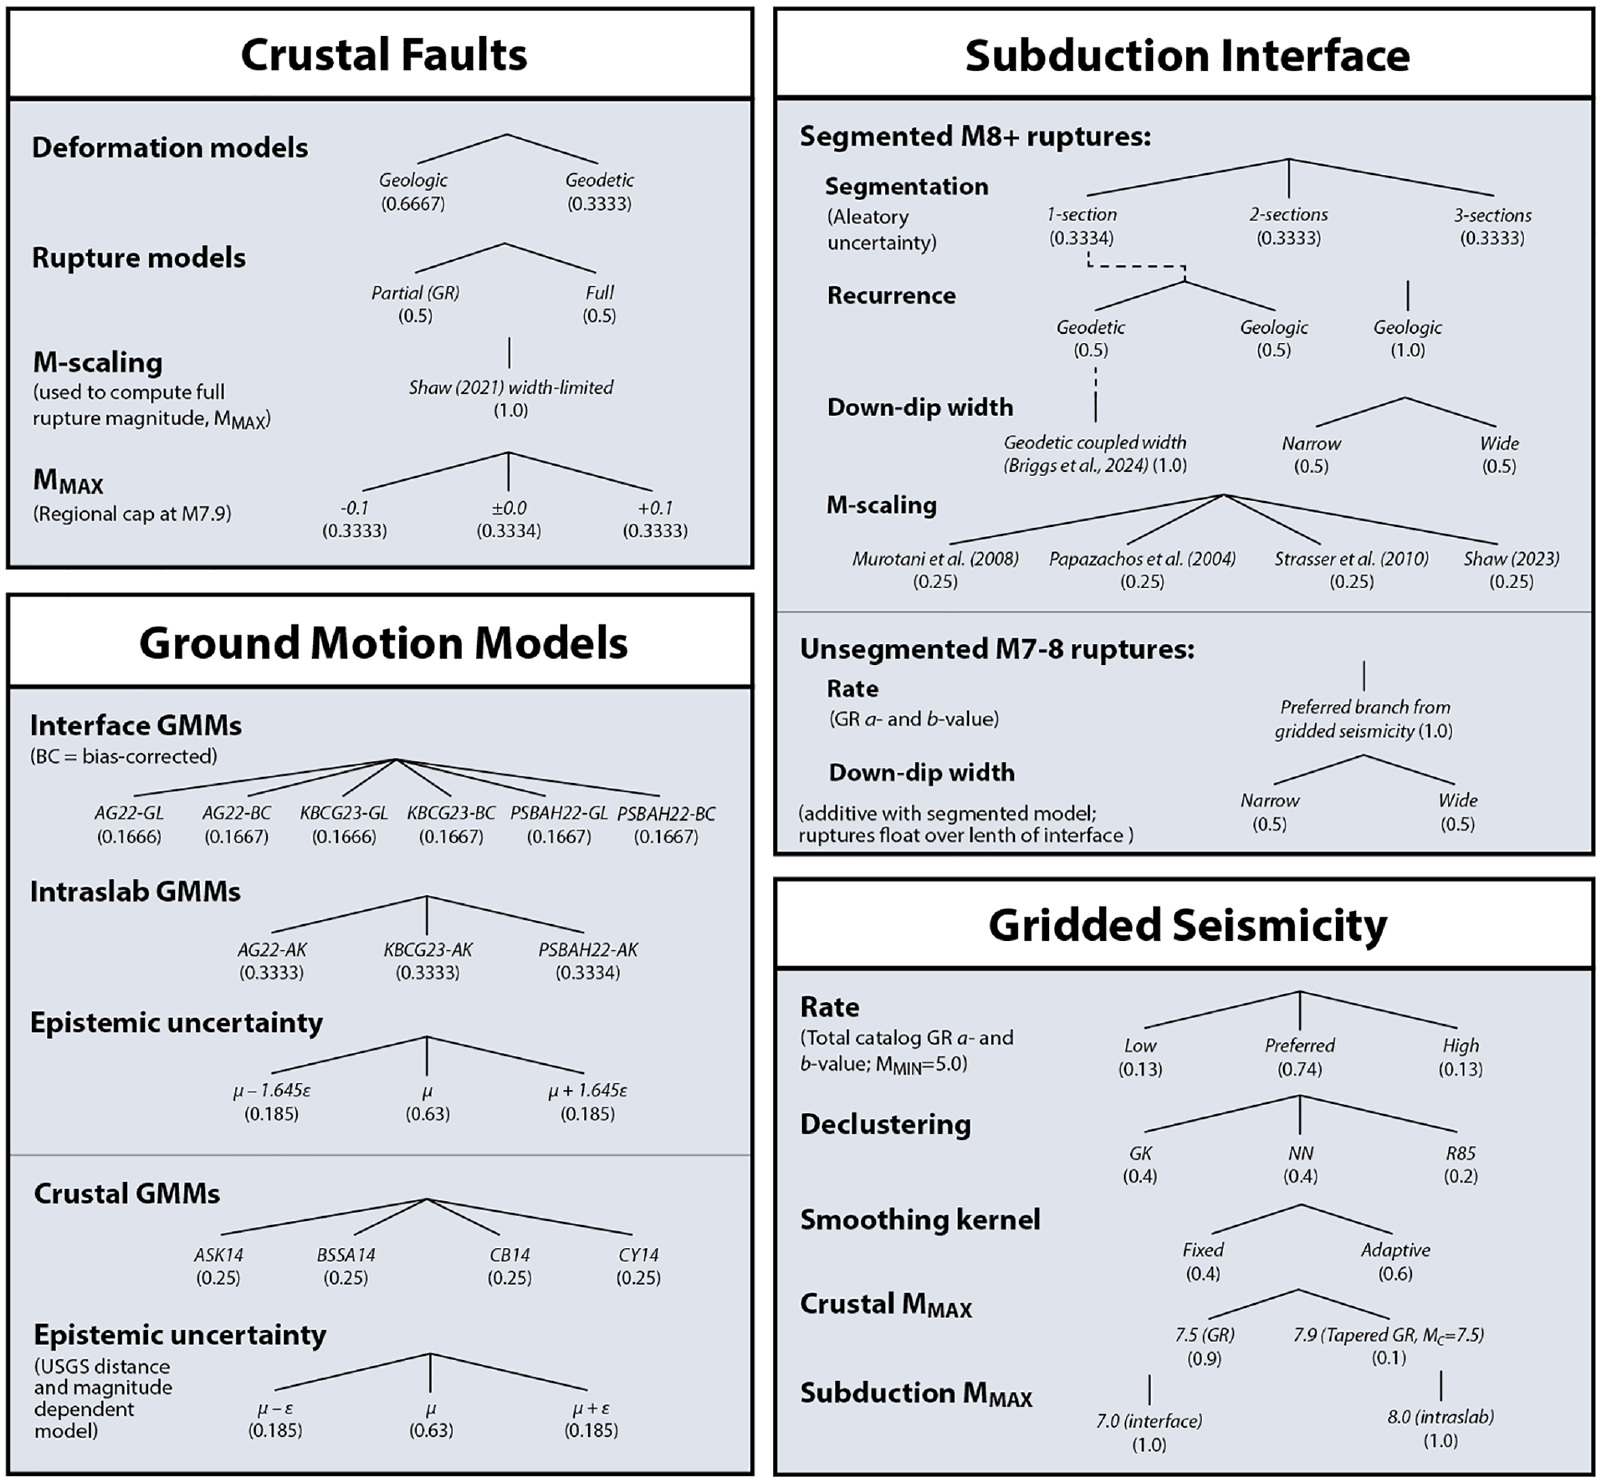
Logic trees for the earthquake rupture forecast (ERF) and ground motion model (GMM) components of the 2023 Alaska National Seismic Hazard Model. Refer to Table 2 for GMM identifiers and references. GR: Gutenberg-Richter; GK: Gardner and Knopoff (1974); NN: nearest-neighbor (Zaliapin and Ben-Zion, 2020); R85: Reasenberg (1985).
Model components and methodology
In this update, we build on established modeling methodologies. In all aspects of the model, we have considered new or updated datasets and models, and this article serves as an overview of the integrated components of the Alaska NSHM. Where substantial new work has been undertaken to update a model component, supplementary papers are available. For updates to the crustal fault model update, refer to Haeussler et al. (2024). For details on new methodologies used in developing the gridded seismicity model, refer to Llenos et al. (2024). For the updated subduction zone segmentation and recurrence models, refer to Briggs et al. (2024). For work on new magnitude-area scaling equations developed for subduction and active crustal regions using physics-based constraints, refer to Shaw (2023).
Since the last update of the NSHM for Alaska in 2007, in addition to the incorporation of much new data and improved methods of analysis, the calculation of hazard from the 2023 model uses computer codes that have been completely revamped, thoroughly tested, and applied elsewhere in the U.S. in the intervening and current 2023 updates. In the following comparisons between the 2023 results and those from 2007, we are comparing our new results with the hazard curves for the various source types and periods that were calculated at grid points on a 0.2° by 0.2° grid throughout Alaska in 2007 and have been available as an electronic resource since that time (Shumway, 2019).
From an implementation standpoint, we organize the NSHMs by tectonic setting, as the earthquakes associated with each are, for the most part, independent. The tectonic settings in the Alaska NSHM are “active crust,”“subduction interface,” and “subduction intraslab.” Within each tectonic setting, different source types are represented: finite-fault sources, gridded seismicity sources, or zone sources. When describing a hazard model, it is helpful to use the established terminology of different model-component development groups. Here we list, for reference, terms used throughout this article when describing implementation details of the Alaska NSHM:
All magnitude values throughout article are moment magnitude, denoted as “M,” unless otherwise noted;
Throughout the article, “2007 update” refers to Wesson et al. (2007);
RRUP: the site-to-source distance (to the closest point of the source rupture);
MFD: magnitude–frequency distributions:
• Gutenberg-Richter, “partial” rupture, doubly truncated, abbreviated GR
• Single, “full” rupture (also known as “characteristic”);
Point source—a source keyed to a location but that allows finite-fault ruptures, or approximations thereof;
CONUS: conterminous United States.
Model review
In the final year of development of the 2023 Alaska NSHM, a six-member review panel was formed to help advise the USGS and ensure the model represents best-available science. Given that the prior update of the Alaska NSHM was in 2007 and almost every component of the model was likely to change substantially, it was imperative that the USGS invite the comment of model-component developers, those with prior experience developing hazard models for Alaska, and a few key stakeholders. Regular meetings with the panel and their review of early drafts of the model contributed greatly to its successful completion. A supplemental eight-member team of GMM developers was also assembled in the very last stage of model development to advise the USGS on issues related to adoption of the NGA-Sub GMMs for Alaska. The comments and suggestions of the review panel and GMM advisory team are summarized in the electronic supplement ES3.
ERF
An ERF gives the probabilities of all possible damaging earthquakes in a region over a specified timespan. For Alaska, the ERF consists of crustal fault sources, a crustal gridded seismicity source model that accounts for earthquakes where there are no mapped faults, and subduction interface and intraslab earthquake sources, each of which is described below. The 2023 ERF includes improvements over the 2007 model, especially in the representation of epistemic uncertainty in earthquake rate and subduction source modeling (Figure 3). In addition to including an expanded inventory of crustal faults and updated segmentation and recurrence models for the subduction interface, both components consider geologic and geodetic deformation models. The 2023 gridded seismicity models for all tectonic environments include multiple logic tree branches for declustering, smoothing, and rate models, and all subduction components of the ERF use rupture geometries and depths derived from the Slab2 model (Hayes et al., 2018). In addition, crustal and interface ERF components include models of uncertainty on maximum magnitude. It is important to note that the 2023 Alaska NSHM ERF is a time-independent, or long-term, model and it does not account for potentially reduced hazard following the relatively recent 2002 M7.9 Denali and 1964 M9.2 Great Alaska earthquakes. Nor does it account for the possibly increased hazard due to recent earthquakes on the subduction interface pushing adjacent sections closer to failure, as suggested by Elliott et al. (2022). Rupture rates in all ERF components are per year (annual rate).
Crustal fault model
The crustal fault model for the 2007 NSHM consisted of the Denali and Totchunda faults, the Queen Charlotte–Fairweather fault system, the offshore Transition fault, the Castle Mountain fault, and the offshore Kodiak and Narrow Cape faults. Inclusion of these faults in the model was an improvement over the 1999 model and was a start to improved modeling of slip partitioning from the Queen Charlotte fault onto the subduction zone and reverse and strike-slip faults of south-central Alaska. For the 2023 model, Haeussler et al. (2024) updated the fault inventory following the methods of Hatem et al. (2022) for the 2023 CONUS NSHM (Figure 1 and Supplemental Figure ES1-2). In building the inventory, Haeussler et al. (2024) first updated the Quaternary fault and fold (QFF) map of Koehler et al. (2012, 2018) and Koehler (2013) with more recent fault mapping and published research. They then considered all possible Quaternary faults for inclusion in the model. Those faults with traces <5 km long were removed (effectively removing fault sources for M<∼5.5 that are accounted for in the gridded seismicity model), and the remaining faults traces were simplified and smoothed to reduce unnecessary detail but still preserve changes in strike. For faults with published slip rates, the “geologic” slip rate for the fault was assigned the published rate. For those without published rates, the lower limit of the categorical rate in the QFF is used. For faults in the lowest (slowest) category, nominal slip rates of 0.01–0.1 mm/year were assigned as the “geologic” rate. The inclusion of faults with nominal slip rates is a change in practice for USGS NSHMs that aims to provide more potential for connectivity in a fault system, ultimately allowing for more multi-fault ruptures in current and future models (e.g. Field et al., 2014, 2024); Given their low slip rate and the limited connectivity allowed for in the 2023 Alaska model, these faults do not substantially influence hazard. Finally, Haeussler et al. (2024) removed faults within identified area source zones, discussed below.
This update results in an inventory of 105 faults, up from nine in 2007, and is published as a USGS data release in Bender et al. (2021). Notable improvements to the crustal fault model include (1) a slip rate of ∼53 mm/year on the Queen Charlotte fault system, indicating it accommodates all of the plate boundary motion; (2) long-term slip rates on megathrust splay faults in the southern Prince William Sound region and near Kodiak Island; (3) improved details of structures in the Chugach-St. Elias orogen; (4) revision of the Castle Mountain fault from right-slip to a predominantly reverse fault; (5) interior Alaska tectonic models that clarify relationships between the Denali fault, Totschunda fault, and thrust faults on both sides of the Alaska Range; (6) large earthquake sources in the eastern Brooks Range; and (7) removal of the Chatham Strait section of the Denali fault. Figure ES1-2 (in electronic supplement E1) provides a detailed map of all fault sections and area source zones proposed by Haeussler et al. (2024). For the 2023 NSHM, we remove from the Haeussler et al. (2024) inventory several offshore fault sections and those defined by seismicity lineaments. The offshore sections are very short and outboard of the Queen Charlotte fault, far enough south that they would contribute little to hazard in southeast Alaska. The fault sections defined by seismicity are likely related to large-scale block rotation between the Denali and Tintina faults (Page et al., 1995). The lineaments are areas of high earthquake rate and are represented by elevated earthquake rates in the gridded seismicity part of the model, so we remove these sections to avoid double-counting earthquake rate.
Modifications to the Haeussler et al. (2024) fault inventory also include merging the Northern Foothills, Donnelly Dome, Granite Mountain (west and east), Canteen, and Dot “T” Johnson fault sections into one trace named the Northern Alaska Range fault to represent this band of south-dipping thrust faults along the northern margin of the Alaska Range. The traces of these faults share common endpoints, which do not likely represent barriers to rupture. The Northern Foothills section makes up most of the length of the combined trace, and we assign the Northern Alaska Range structure the 3 mm/year slip rate of that section. Combining these traces facilitates modeling floating ruptures along the entire Alaska Range basal thrust.
Deformation models
Deformation models provide slip rate estimates for explicitly modeled faults and are a primary source of epistemic uncertainty in a PSHA. PSHAs typically include, at a minimum, a geologic deformation model and recent NSHM updates now consider additional geodetic deformation models (Field et al., 2014, 2024; Petersen et al., 2015, 2020). These are developed using finite-fault or block models onto which strain computed from a global positioning system (GPS) velocity field is projected. These models typically allow for some off-fault strain as well, consistent with the fact that not all deformation at a plate boundary is accommodated by brittle failure in the upper crust. Although deformation models are under development for the state of Alaska using the updated crustal fault model, only the Elliott and Freymueller (2020) model was available for consideration in this NSHM update.
To build their block model, Elliott and Freymueller (2020) first developed a GPS velocity field that accounted for complexities in the GPS signal. These include vertical corrections for ongoing glacial isostatic rebound (up to 35 mm/year) and horizontal corrections for post-seismic relaxation after the Denali earthquake. They acknowledge that more work needs to be done to improve these corrections and address others such as volcanic signals in western Aleutians, seasonal variations, and aperiodic slow slip events. Elliott and Freymueller (2020) then compute fault-parallel and fault-normal slip rates on the boundaries of a block model that spans interior Alaska as well as the subduction zone. In the 2023 Alaska ERF, those faults that coincide with block boundaries include a logic tree branch with the Elliott and Freymueller (2020) geodetic rates. For those fault sections not coincident with block boundaries, we maintain the geodetic branch but assign the geologic rate (effectively giving 100% weight to the geologic branch) to maintain symmetry in the logic tree.
Haeussler et al. (2024) note inconsistencies between geodetic and geologic slip rates. In both the central Denali fault and along the Queen Charlotte system, geodetic slip rates are notably lower than the geologic rates. However, geodetic rates are higher at the east and west ends of the Denali fault where the geologic rates fall to near zero. Parallel to the Queen Charlotte system, the Elliott and Freymueller (2020) model includes the Coast Shear Zone block boundary along which they compute a slip rate of 2.8 mm/year. Although there is an obvious strain gradient across southeast Alaska implied by the GPS velocity field (Supplemental Figure ES1-3), there is little historical seismicity inboard of the Queen Charlotte fault and no late Quaternary geologic evidence of ongoing deformation on faults sub-parallel to the Queen Charlotte (hence the removal of the Chatham Strait section of the Denali fault from the 2007 fault model; Haeussler et al., 2024). However, slip on the Coast Shear Zone makes up for some of the geodetic slip rate reduction on the Queen Charlotte relative to the geologic rate (46 mm/year geodetic vs 54 mm/year geologic). To address this discrepancy, we include an additional zone source for the Coast Shear Zone, as described below. Considering the above inconsistencies with the geologic deformation model, we give the geologic and geodetic deformation models weights of 2/3 and 1/3, respectively.
Implementation
The crustal fault model implementation for the 2023 NSHM largely follows the methodology used in the 2007 Alaska NSHM and the active crust region of the 2018 CONUS NSHM (Petersen et al., 2020) that was developed in the 1996 update of the CONUS NSHM (Frankel et al., 2000, 1996, 2002). For each fault,
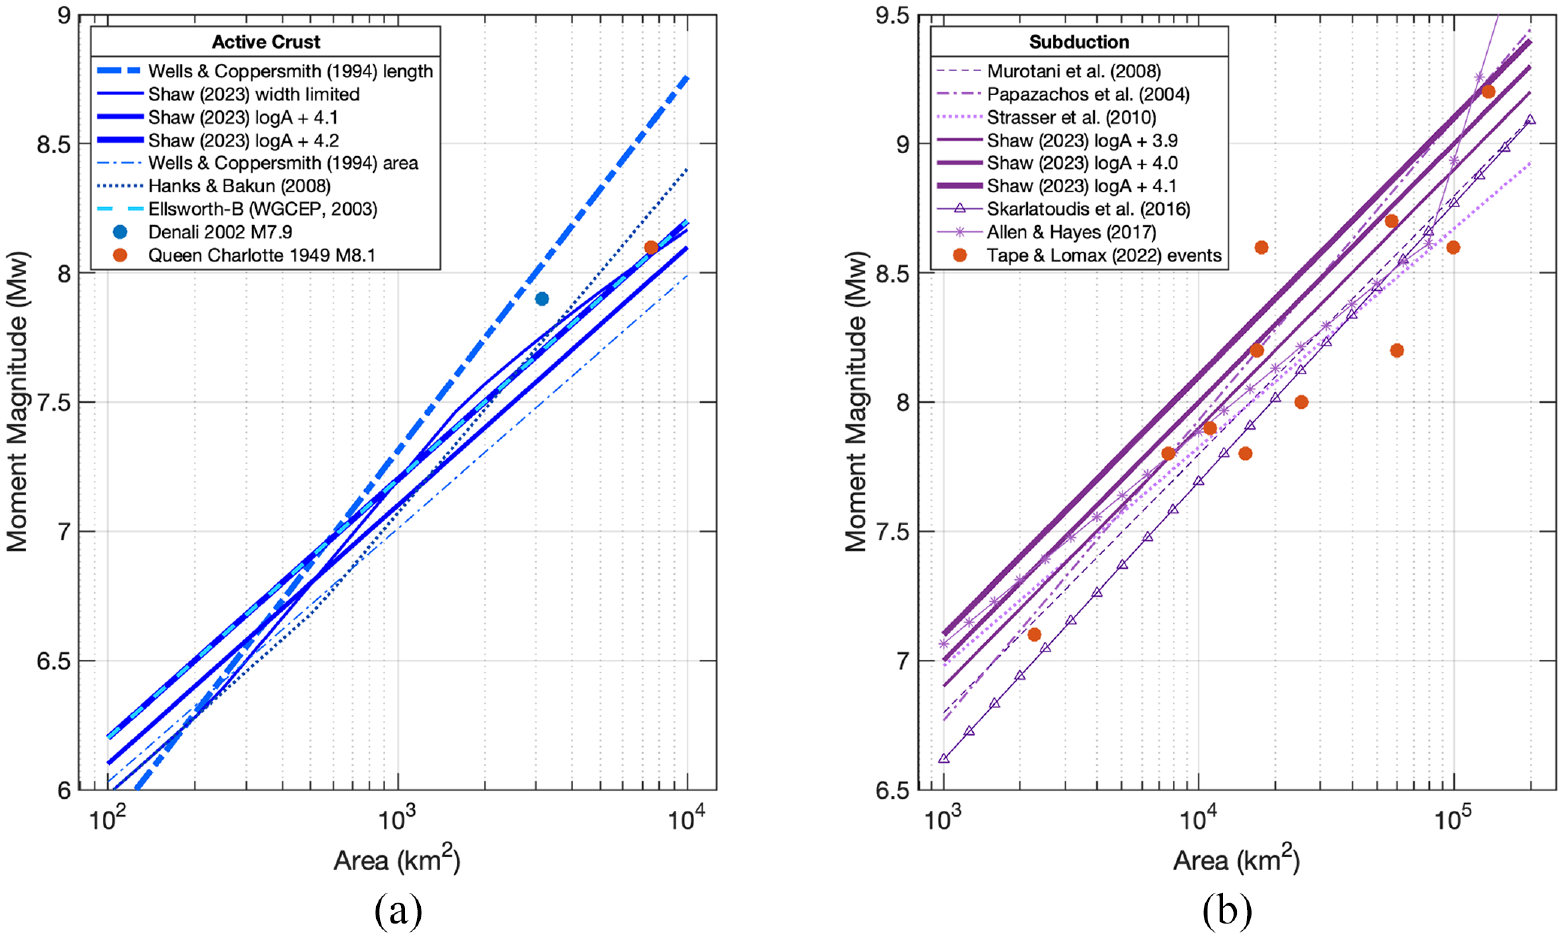
Magnitude scaling relations considered for (a) active crust and (b) subduction interface tectonic settings. Lines in (a) are computed using a 15-km crustal fault width. Note that in (a) the much steeper scaling of magnitude with area for the Wells and Coppersmith (1994) length relation, which was replaced in the 2023 Alaska National Seismic Hazard Model with the Shaw (2023) width limited relation.
For the 2023 updates of both the CONUS and Alaska NSHMs, Shaw (2023) reviewed magnitude-area and magnitude-slip scaling relations for different tectonic environments (Figure 4). The long-used Wells and Coppersmith (1994) magnitude-length relation (when assuming a down-dip width of 15 km for a fault) was found to be inconsistent with the range of models used in the Uniform California Earthquake Rupture Forecast, version 3 (Field et al., 2014) and those recommended by Shaw (2023), especially with increasing fault area. For several of the long faults in the updated crustal fault model, the Wells and Coppersmith (1994) length relation implies maximum magnitudes well in excess of the M7.9 observed for the 2002 Denali earthquake. Shaw (2023) argues that models with scaling breakpoints, such as the “width limited” model, are generally preferred, so we adopt this model for use with crustal faults in the 2023 NSHM. We also impose an upper limit of
Slip-varying faults
One innovation in the 2007 Alaska ERF was the modeling of ruptures on the connected Denali and Totschunda faults that honored along-strike changes in and partitioning of slip rate (Eberhart-Phillips et al., 2003). The 2023 model carries this approach forward with an expanded network of high-slip-rate, strike-slip faults (Figure 5). For this fault system, the slip rates of the participating sections are held fixed at the tips of the system and at the ends of fault sections that are branching points. For all other sections that do not connect to a branch point, the slip rate is held fixed in the middle of the section (black dots in Figure 5). The connected faults are then subdivided into 4-km long subsections, and each is assigned a slip rate derived by linearly interpolating between the slip-rate anchor points. From this system, we model the “full-rupture” and “partial-rupture” MFDs as done for the other crustal faults in the model, and we cap
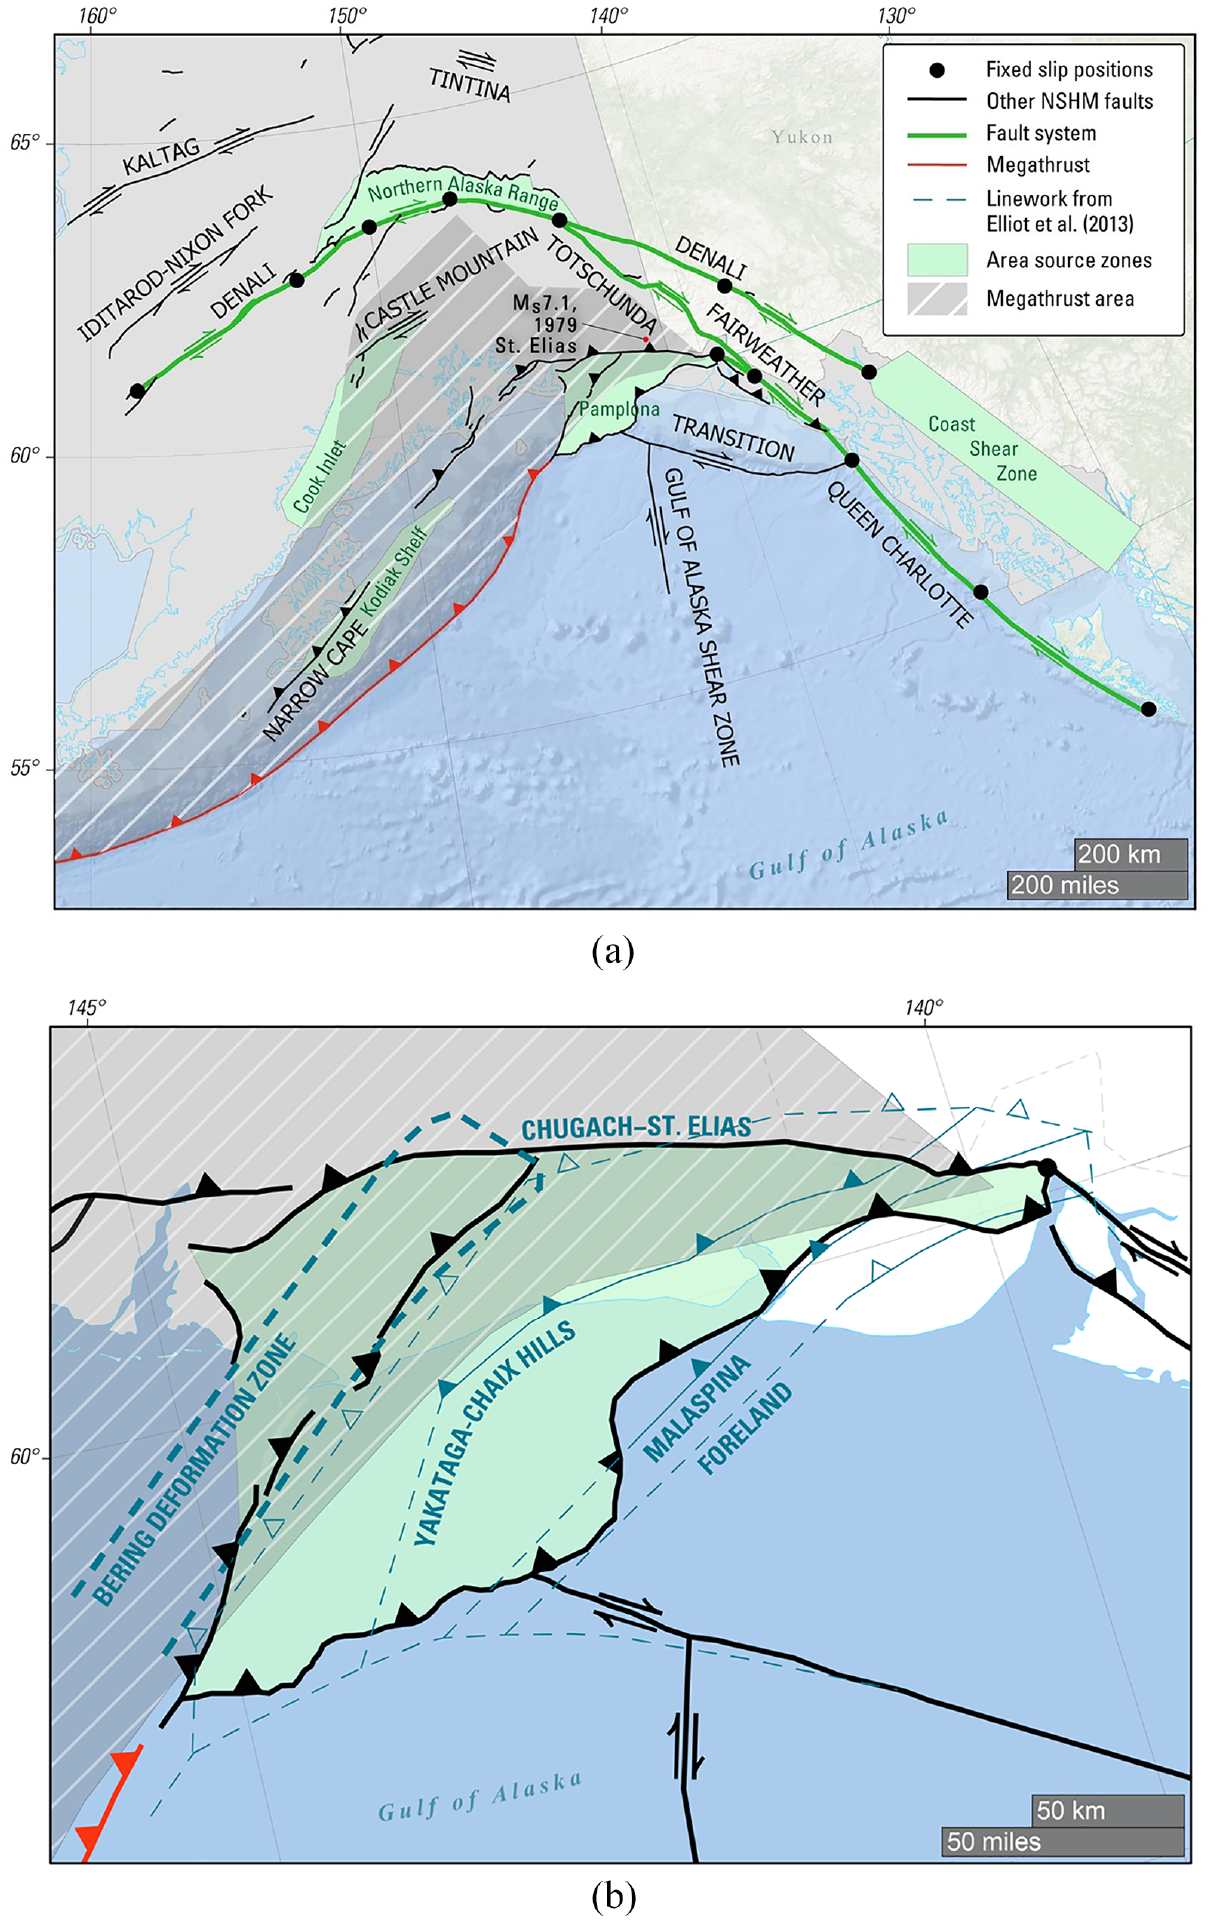
(a) Map of south-central Alaska showing the fault system that accommodates along-strike changes in slip rate (dark green) and area source zones (light green). Black dots mark positions where slip rate is held fixed and between which slip rate is computed via linear interpolation. (b) Zoomed-in area of the Pamplona zone showing NSHM faults in black and block boundaries from Elliott et al. (2013) and Elliott and Freymueller (2020) in blue. Open triangles mark the hanging wall of buried reverse-fault block boundaries. Map projection: Alaska Albers equal area, WGS 84 datum; bathymetry: GEBCO (GEBCO Compilation Group 2023).
Zone sources
Haeussler et al. (2024) identify four areas characterized by diffuse deformation and active but slow-slipping and undated faults: Cook Inlet, Kodiak Shelf, Northern Alaska Range, and Pamplona (Figure 5 and Supplemental Figure ES1-2). For each zone, they remove the unconstrained faults from the inventory and define bounding polygons for use as area source zones in the NSHM. We also include a fifth zone, the Coast Shear Zone, that is centered on a block boundary in the Elliott and Freymueller (2020) model that accommodates ∼3 mm/year slip in southeast Alaska inboard of the Queen Charlotte–Fairweather fault system. This rectangular zone is elongated parallel to the Elliott and Freymueller (2020) block boundary and extends ±50 km to either side (Figure 6), the approximate width of the interseismic area of deformation associated with strike-slip faults at active crustal plate boundaries (e.g. Vernant, 2015). Geologic evidence of offset in the region is sparse, but we include this zone because geodetic slip rates on the Queen Charlotte are markedly lower than well-documented geologic rates, and including the zone source makes up for this slip deficit.
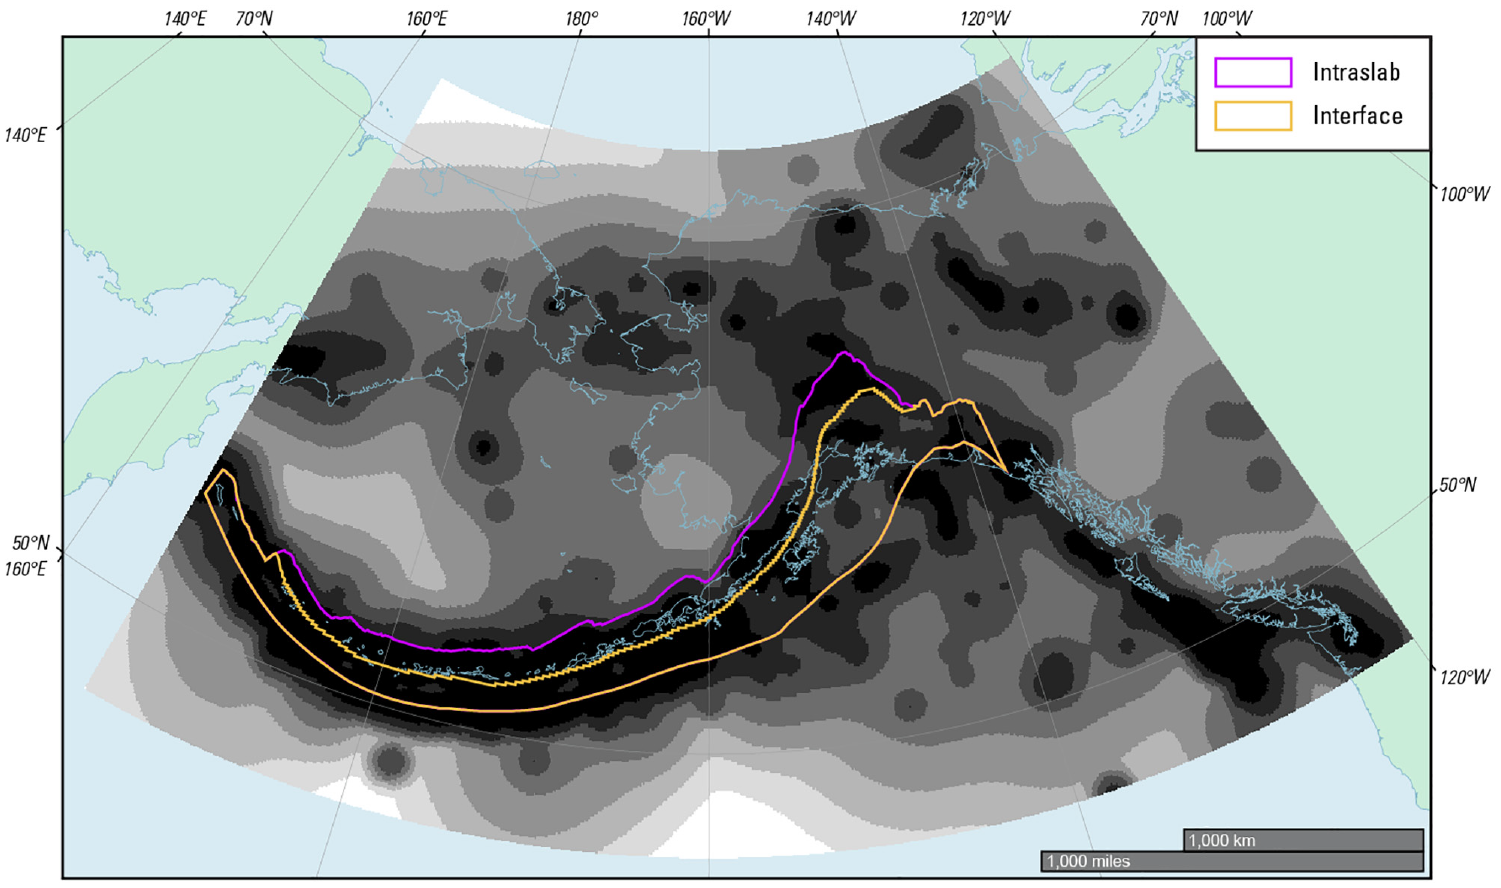
Normalized probability density function (PDF) grid of seismicity rates considered in the crustal earthquake rupture forecast (ERF). Grid values for this figure are an average of individual PDFs weighted 0.4/0.4/0.2 across the three declustering methods (nearest neighbor [NN, Zaliapin et al., 2020]/ Gardner and Knopoff, 1974 [GK]/Reasenberg, 1985 [R85] and 0.4/0.6 for the fixed/adaptive smoothing kernels. Outlines show the spatial extent (limit) of instraslab (purple) and interface (orange) gridded seismicity PDFs (refer to Figure ES1-5 in electronic supplement ES1 for PDFs). Note that much of the crustal earthquake rate shown is more than 300 km from the Alaska state border and therefore does not contribute to hazard. Map projection: Alaska Albers equal area, WGS 84 datum.
To estimate seismic moment and earthquake rates over each zone, we first develop a strain rate map from the Elliott and Freymueller (2020) GPS velocity field using the method of Shen et al. (2015). We then convert strain rate to moment rate based on equation (22) of Savage and Simpson (1997), assuming a seismogenic thickness H = 13 km (15 km depth–2 km surface nonseismogenic layer thickness) and an elastic shear modulus m = 3*10^10N/m2 (Supplemental Figure ES1-3). Ruptures within each zone are modeled as uniformly spaced finite surfaces (0.1° spacing) with a fixed-strike sub-parallel to the mapped faults within the zone and following the mean (middle) rate branch of the MFDs used for crustal gridded seismicity, but with
In the case of the Cook Inlet and Kodiak Shelf zones (Figure 5), which are wholesale replacements for poorly constrained faults, the zones are used on both the geologic and geodetic deformation model branches with full weight. The Coast Shear Zone complements the geodetic fault slip rates in southeast Alaska and therefore gets 1/3 weight, consistent with weighting in the finite-fault model. Although the Northern Alaska Range and Pamplona zones span numerous unconstrained faults that were removed from the model, the faults that bound and are contained by these two zones accommodate the full north–south shortening in each region. In the case of Pamplona, geodetic block boundaries in the zone do not coincide with mapped geologic features (Figure 5b). We therefore use the Northern Alaska Range and Pamplona zone sources as a geodetic alternative to the geologic fault modeling in each region. Each zone gets 1/3 weight, and the fault slip rates on the geodetic branch of the fault model are set to zero.
In developing the ERF in and around the Pamplona zone, the question arose of whether there is any double-counting of earthquake rate given inclusion of the Yakataga section in the subduction interface model as well as crustal fault sources with high slip rates that take up much of the Pacific–North America plate rate. For example, the Foreland Thrust fault zone (the leading edge of the Pamplona area source zone) has a geologic slip rate of 32–34 mm/year. The thrust faults in and around the Pamplona zone are splay faults that likely root in a low-angle detachment at depth; however, it is unknown what secondary deformation occurs in the upper plate during the largest megathrust events. Earthquakes associated with upper plate deformation, for example, the 1979 surface-wave magnitude MS 7.1 St. Elias earthquake (Figure 5), occur independently of slip on the interface itself. In discussions with the authors of Briggs et al. (2024), we decided to treat the subduction interface as effectively decoupled from activity in the hanging wall of the subduction interface and to revisit the topic in future model updates.
Gridded seismicity models
Spatially varying earthquake rates estimated from the historical earthquake catalog are an integral part of a PSHA. Even in parts of the world where earthquake hazard is dominated by crustal faults or subduction zones, the gridded and smoothed seismicity component of the ERF often greatly contributes to the hazard, especially in applications concerned with high-frequency ground motion and short return periods where more frequent smaller magnitude events are important. These models perform three roles in the Alaska ERF. First, they account for earthquakes in areas of low seismicity (the probability of an earthquake anywhere is always greater than zero). Second, they account for earthquakes in areas of high seismicity that are not defined in the finite-fault component of the model. Third, they represent the smaller magnitude events that are below the minimum magnitudes supported by finite models, M < 6.5 for crustal faults and M < 7 for subduction zone interface events in the 2023 Alaska ERF.
Earthquake catalog development
For this update, we assembled a catalog from the USGS ComCat (1802–2000; USGS Comcat, 2022 and sourced from the Alaska Earthquake Center, 1987) and Earthquakes Canada (1903–2000; NRCan, 2021) online databases (Supplemental Figures ES1-1 and ES1-4). The catalogs in earlier NSHMs were often improved by considering multiple additional, smaller catalogs. For Alaska, all secondary catalogs previously used have now been included in USGS ComCat (2022). After removing duplicates, we use three models to decluster the catalog: Gardner and Knopoff (1974; GK), Reasenberg (1985; R85), and nearest neighbor (Zaliapin et al., 2020; NN). Declustering a catalog removes dependent foreshocks and aftershocks to derive stationary Poissonian rates of independent earthquakes (e.g. Petersen et al., 2020). These three models, detailed and reviewed in Llenos et al. (2024), are used in recent updates of the NSHMs for the conterminous U.S. (Field et al., 2024; Petersen et al., 2023) and Hawaii (Petersen et al., 2022). Unlike the 2007 model, we did not remove space-time windows of aftershocks for the largest historical subduction zone earthquakes from the 2023 catalog. Such spatial windows were hand-drawn, anisotropic, and elongated parallel to the strike of the subduction zone and served to better remove dependent events missed by the radial search of the GK declustering method, the only declustering model considered in the 2007 update. When using catalogs restricted to the relatively narrow elongated subduction zone, which results in a certain degree of strike-parallel anisotropy in the declustering, the 2023 models are found to do an adequate job of removing the aftershocks of the largest subduction interface events (Llenos et al., 2024). One issue that arises when analyzing a catalog for a subduction environment (as opposed to one limited to the shallow continental crust) is understanding how the various declustering methods behave considering the large depth uncertainty in the catalog. The epicenter of an earthquake may be well constrained, but its depth is often highly uncertain, particularly along coasts and on islands adjacent to large oceanic areas absent seismic network coverage. However, the R85 model considers earthquake depth, and results from the NN and GK models were found to not be highly sensitive to large depth uncertainties (Llenos et al., 2024). Once declustered, the catalog is separated into sub-catalogs associated with different tectonic settings.
Catalog segregation
The Alaska earthquake catalog highlights the range of tectonic settings present in the state, with the shallow-to-deep subduction zone environment standing out (Supplemental Figure ES1-1). The events that highlight the Aleutian arc are a mix of shallow crust in the upper plate, subduction interface, and subduction intraslab events. In a PSHA, it is standard practice to compute ground motion for the earthquake sources of a particular tectonic setting using GMMs developed for that setting. It is therefore necessary to segregate the catalog prior to developing gridded seismicity sources that maintain that association. In the 2007 update, horizontal depth slices (between 50–80 km and 80–120 km) were used to isolate intraslab earthquakes. Earthquakes in the top 50 km of the crust were then separated into interface and shallow crustal events by isolating those events within polygons defined by the fault sections used in the large-magnitude interface part of the model. For this update, we take a new approach to catalog segregation and use a probabilistic earthquake classifier, based on methods used in the USGS ShakeMap near-real-time product (Worden et al., 2020), to separate the catalog into sub-catalogs of crustal, intraslab, and interface events. The classifier considers the Slab2 Alaska–Aleutian subduction zone geometry model (Hayes et al., 2018), Mohorovičić discontinuity depth from CRUST1.0 (Laske et al., 2013), and centroid moment tensors from the USGS ComCat (2022) when available. The classifier returns the probability that an event is shallow crust, subduction interface, or subduction intraslab. We then designate the tectonic-setting sub-catalog using the maximum probability. Although some classifications are ambiguous (e.g. assigned equal probabilities), which could be accounted for in future work, the overall catalog earthquake rate is preserved across the different gridded seismicity ERF components.
Catalog smoothing
Following development of the declustered and segregated sub-catalogs for each tectonic setting, we smooth each using methods consistent with other recent NSHM updates (Petersen et al., 2020, 2021, 2023). Catalog smoothing redistributes earthquake rate over a broad area and allows the development of spatial probability density functions (PDFs) that are the basis of gridded seismicity models. The first, “fixed” kernel method uses a two-dimensional Gaussian smoothing function with a correlation distance of 75 km (after Frankel, 1995) and was the only method considered in the 2007 update. The second “adaptive” smoothing method allows for shorter smoothing distances in areas of dense seismicity and longer smoothing distances in areas of more dispersed seismicity (Helmstetter et al., 2007; Moschetti, 2015). The earthquakes of the sub-catalogs are smoothed independent of magnitude over a 0.1°× 0.1° grid, the results of which are renormalized to generate a spatial PDF. For details on catalog declustering and smoothing, refer to Llenos et al. (2024).
The gridded seismicity components of the Alaska 2023 NSHM consists of six spatial PDFs for each tectonic setting, each of which is paired with a logic tree of rate models that together represent epistemic uncertainty in earthquake distribution and rate. The six spatial PDFs are generated from unique combinations of the three declustering and two smoothing algorithms described above. Consistent with the 2023 CONUS NSHM, declustering model weights are NN (0.4), GK (0.4), and R85 (0.2), and the smoothing model weights are “adaptive” (0.6) and “fixed” (0.4). We thereby apply the recommendation of the 2023 CONUS ERF review panel to assign lower weight to the R85 declustering and “fixed” smoothing branches. The R85 model fails to remove some aftershocks, and the “fixed” smoothing model spreads rate too far in some areas (Field et al., 2024). Figure 3 shows a graphic representation of the gridded seismicity logic trees.
Figure 6 shows the weighted average spatial PDF across the three declustering and two smoothing methods for the crustal gridded seismicity sub-catalog. The spatial PDFs for subduction interface and intraslab sub-catalogs are included in Figure ES1-5 of electronic supplement ES1. Grids defined in coordinates of latitude and longitude are not uniform, and this is accounted for in the smoothing codes. The spatial PDF approach simplifies handling of logic trees of earthquake rate in the gridded seismicity components of the ERF; a single PDF can be used with different GR a- and b-values to generate multiple gridded seismicity model logic tree branches (Figure 3). Slab and interface spatial PDFs are restricted to the latitude–longitude bounds of the polygons defining the subduction interface sections in this update (Figure 6 and Supplemental Figure ES1-5). Interface PDFs are further restricted to a maximum depth of 50 km, consistent with the development of some NGA-Sub GMMs (e.g. Abrahamson and Gülerce, 2022). Smoothing of all sub-catalogs was performed independent of depth.
Rate model
USGS NSHMs have historically used declustered catalog rates to set rupture rates in a gridded seismicity model. However, for the 2023 Alaska NSHM, we use the total catalog rates following the work of Marzocchi and Taroni (2014) and consistent with the approach taken in the 2023 CONUS NSHM (Field et al., 2024). Declustered catalog rates underestimate the total shaking potential; however, it is not clear if the declustered events, when present as aftershock sequences, affect the hazard return periods of various building code applications. Moreover, when the rate from aftershock sequences has been redistributed across the entire modeling area, the change in rate at any given grid node is comparably small. For each catalog, Llenos et al. (2024) developed a three-branch rate model of a- and b-value pairs consisting of a mean and 95% confidence bounds. The sub-catalog a-values were computed using catalog time periods appropriate for different magnitudes of completeness (Supplemental Figure ES1-4). The sub-catalog b-values were inferred using the recently developed “b-Positive” technique of van der Elst (2021), and total sub-catalog rates were inferred from a Monte Carlo sampling algorithm that accounts for uncertainties in b-value and individual event magnitudes. The 2023 Alaska NSHM includes each of the rate branches with symmetric weights of 0.13/0.74/0.13 (Figure 3) and is the same distribution applied in the 2023 CONUS NSHM, paired with each of the six spatial PDFs described above.
Crustal implementation
Rates for the gridded seismicity components of the ERF are the incremental a-value in the GR MFD. When generating event sets or performing hazard calculations, point earthquake sources are realized at each node in a spatial PDF. The point sources supply a set of rupture parameterizations in which the magnitudes follow a doubly truncated GR MFD. For each of the three rate models described above, the GR MFD a-value is the product of the total catalog a-value for the rate model branch of interest and the spatial PDF value at a node. The MFD
The actively deforming continental crust of Alaska is clearly capable of generating large earthquakes (e.g. Denali, M7.9) that exceed the M7.3 maximum magnitude for off-fault earthquakes in the 2007 update, as well as the M7.5 maximum magnitude used in the active crust (or western U.S.) part of the 2014 and 2018 CONUS updates (Petersen et al., 2014, 2020). Although it is unlikely that a large moment release like that of the Denali earthquake could occur in the active shallow crust without a preexisting fault, we cannot rule it out. Moreover, although the continental crust of the Alaskan interior is not thick and rigid like the stable craton of the U.S. and Canada, northern and interior Alaska may represent a more transitional structure between stable craton and the crust of south and southeast Alaska, which is composed of recently accreted terranes. This raises the possibility that large events could occur as they do in the stable crust of central and eastern U.S., where glacial isostatic rebound may contribute to reactivation of long buried rift features and the generation of large (up to M8) earthquakes (e.g. New Madrid seismic zone; Petersen et al., 2014).
We therefore model gridded seismicity in Alaska following the approach used for the active crust of the western U.S. in the 2018 CONUS NSHM. The logic tree of MFDs for the 2023 Alaska NSHM consists of a high-weight (90%) truncated GR MFD branch with
Intraslab and interface implementation
In the 2007 update, intraslab point sources were anchored at depths 60 and 90 km, 10 km below the upper limit of the depth slices used to segregate the 2007 catalog (50–80 km and 80–120 km). Small magnitude interface events were modeled as zone sources within polygons defined by the bounds of the subduction interface sections used for large-magnitude finite-fault events. The 2007 interface zone sources use the total earthquake rate in the zone distributed evenly over the zone on a grid of uniformly spaced point sources. For this update, we model each intraslab and interface point source at a depth derived from the Slab2 model. Slab2 depths represent the top of the subducting slab. Ground motions computed using modern subduction GMMs are functions of and highly sensitive to rupture distance, RRUP, and depth-to-top of rupture,
The 2023 update uses a gridded seismicity model for both intraslab and small magnitude interface sources (we drop the 2007 area source zone methodology for interface events). Both models use point sources without any approximations or corrections for finiteness or unknown strike. Historically, USGS NSHMs have not included source finiteness for intraslab events, and including it does not substantially alter hazard relative to improving estimates of the primary distance parameters (
Subduction interface model
The 2007 Alaska NSHM used the best data available at the time to define recurrence rates for seven fault sections along the subduction interface, primarily based on rupture areas of historical subduction earthquakes (Wesson et al., 2007). Maximum magnitudes were assigned to each fault section, and seismicity and limited paleoseismic data were used to estimate rupture recurrence. At the time of the 2007 update, paleoseismic and paleotsunami records only existed as far west as Kodiak Island, and so catalog seismicity rates exclusively were used west of Kodiak to approximate the recurrence of large ruptures. This approach is problematic because earthquake rate on the plate interface is a function of lithology, geochemistry, and structural controls such as asperities. These controls yield widely varying earthquake rates over the length of the subduction zone that may have little to do with the long-term rate of the largest magnitude events. Moreover, approaches to estimating GR MFD parameters vary widely and can produce substantially different results (Llenos et al., 2024). In developing the 2023 Alaska NSHM, we computed and considered catalog-based estimates of megathrust event rate. We computed GR MFD parameters from both full and declustered catalogs but found the possible rate of large (M8+) events to vary so widely that we have more confidence in an approach that only considers a new geodetic and an updated geologic rate model.
The structure of the Aleutian arc, from the syntaxis in the east to Komandorski Island in the west, varies widely along strike. In the east, shallow subduction of the buoyant Yakutat terrane has created a broad zone of crustal thickening and deformation in the upper plate. This deformation since the Miocene overprints the former island arc setting, as evidenced by lingering volcanism in the Wrangell Mountains. In the west, the Aleutians are more similar to oceanic island arcs elsewhere with a narrower and steeper geometry than in the east.
Megathrust structure and segmentation
Briggs et al. (2024) present an earthquake segmentation and recurrence model for the subduction interface of the Alaska–Aleutian subduction zone based on geodetic and paleoseismic data (Figure 7). To capture variations in rupture behavior along strike, they define 14 fault sections based on models of geodetic coupling, prehistoric earthquake and tsunami recurrence, historical rupture patches, and geologic and geophysical structure. From east to west along the subduction zone, several key findings guide construction of the recurrence model. The Yakataga section exhibits a complex interplay of strain accumulation and upper-plate faulting over the Yakutat décollement. In the 1964 M9.2 rupture area, which spans four fault sections, recurrence rates for presumed great M8.5+ events vary from ∼600 years (Prince William Sound section) to ∼380 years (Kodiak section), geodetic character and coupling varies substantially along strike, and geologic evidence indicates rupture patches vary in space and time. Westward along the Semidi section, recurrence of large, tsunamigenic ruptures are far more frequent (∼220 years) than previously assumed, based on geologic and geodetic data. The seismic potential of the Shumagin section, an area of low coupling, remains enigmatic despite a large M7.8 interface rupture in July of 2020 followed by a possibly triggered M7.6 intraslab rupture 3 months later (Herman and Furlong, 2021). The neighboring Sanak section, which is nearly freely slipping, appears to produce large events every ∼1000 years, most recently an M8.6 in 1946 (Figure 1). Prehistoric tsunami data indicate that large rupture recurrence in the Fox Islands is ∼210 years. Paleoseismic data are lacking west of the Fox Islands, so rupture rates along the western 1900 km of the subduction interface to Komandorski rely on geodetic constraints. Simple recurrence estimates from geodetic data indicate that rates for M8+ earthquakes are higher than previously assumed from seismicity alone west of the Fox Islands.
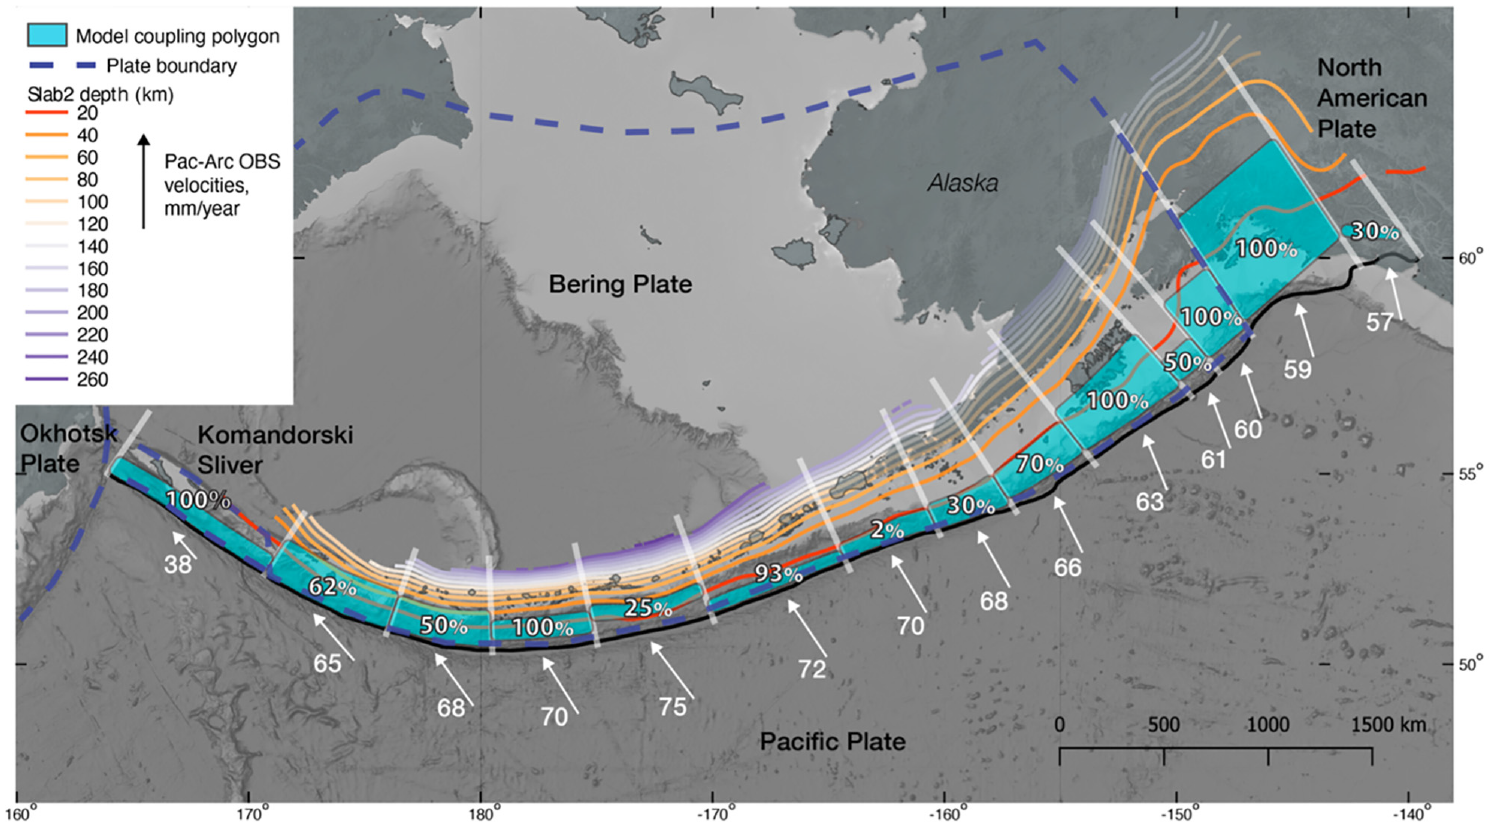
Overview of geodetic coupling model along the Aleutian arc after Briggs et al. (2024). Calculation of relative Pacific-Arc Observed (Pac-Arc OBS) velocities is described in Briggs et al. (2024). Sections are as in Figure 1. Slab2 interface contours are from Hayes et al. (2018). Map projection: Alaska Albers equal area, WGS 84 datum; bathymetry: GEBCO (GEBCO Compilation Group 2023).
Geodetic model
Because aseismic slip is nearly ubiquitous in a subduction setting, fault slip rates are replaced by the concept of slip deficit rates, which represent the long-term plate convergence rate times the coupling coefficient along the subduction interface determined geodetically (Pacheco et al., 1993). The coupling coefficient can range from 0 (or 0%) when the interface is fully decoupled and the interseismic (aseismic) slip rate is equal to the local plate convergence rate, to 1 (or 100%) when the interface is fully locked and the slip deficit rate equals the local plate convergence rate (Pacheco et al., 1993).
Briggs et al. (2024) constrain geodetic recurrence rates across the Alaska–Aleutian subduction zone by compiling, and in some cases averaging, estimates from previously published models. The methodologies of the underlying models varied. For example, models taken from Cross and Freymueller (2008) assumed a small number of rectangular fault plane segments and estimated the slip deficit on each plane, while models for the 1964 rupture zone and Alaska Peninsula (Drooff and Freymueller, 2021; Li et al., 2016; Li and Freymueller, 2018; Suito and Freymueller, 2009) used a dense grid of sub-faults to represent the interface and estimated the spatial distribution of slip deficit based on fit to the data and model smoothing. All models were mapped onto a consistent geometry (Slab2); refer to Briggs et al. (2024) for a summary of along-strike geodetic earthquake rates.
The geodetic rate branch of the Alaska subduction model is paired with a structural (rupture area) model derived from inversions of geodetic data that maps closely to the dislocation surfaces used by individual modelers (Briggs et al., 2024, and references therein). The surfaces are a planar fit to contours in the Slab2 Alaska–Aleutian interface model (Figure 7). These geometries represent a minimum bound on interface rupture area. Although the magnitudes of these ruptures are not as high as the M9.2 1964 earthquake, they allow us to represent the M8+ events that were absent from the 2007 model at the east end of the arc where only paleorecurrence data were used to model singular M8.8 (Kodiak section) and M9.2 (Kodiak + Prince William Sound section) events.
Geologic model
Briggs et al. (2024) present geologic recurrence rates based on paleoseismic and paleotsunami investigations of the past 20 years. For the geologic branch, we consider two structural models termed “narrow” and “wide” (Figure 8). These two branches span a range of possible up-dip and down-dip rupture limits. The “wide” model extends from the trench at an average depth of 8 km down to the 50 km Slab2 contour. The “narrow” model extends from the 14 km contour down to the 40 km Slab2 contour. Collectively, the two models are more consistent with the 2007 model than the geodetic structural model; the 2007 model extended from the trench down to a variable depth of 40–50 km. The “wide” model allows us to represent ruptures that extend from the trench to the physically plausible limits of down-dip rupture (Lay et al., 2012). However, not all megathrust events rupture all the way to the trench (Figure 1) nor as deep as the “wide” model. The “narrow” model is an alternate end member that considers finite fault models of recent subduction interface earthquakes (e.g. the 2021 M8.2 Chignik event; Elliott et al., 2022; USGS ComCat, 2022) and is consistent with the narrower rupture patches of Alaska earthquakes as defined by aftershock zones in Tape and Lomax (2022) and the 40 km down-dip limit of interface earthquakes in the Slab2 catalog segregation algorithm.
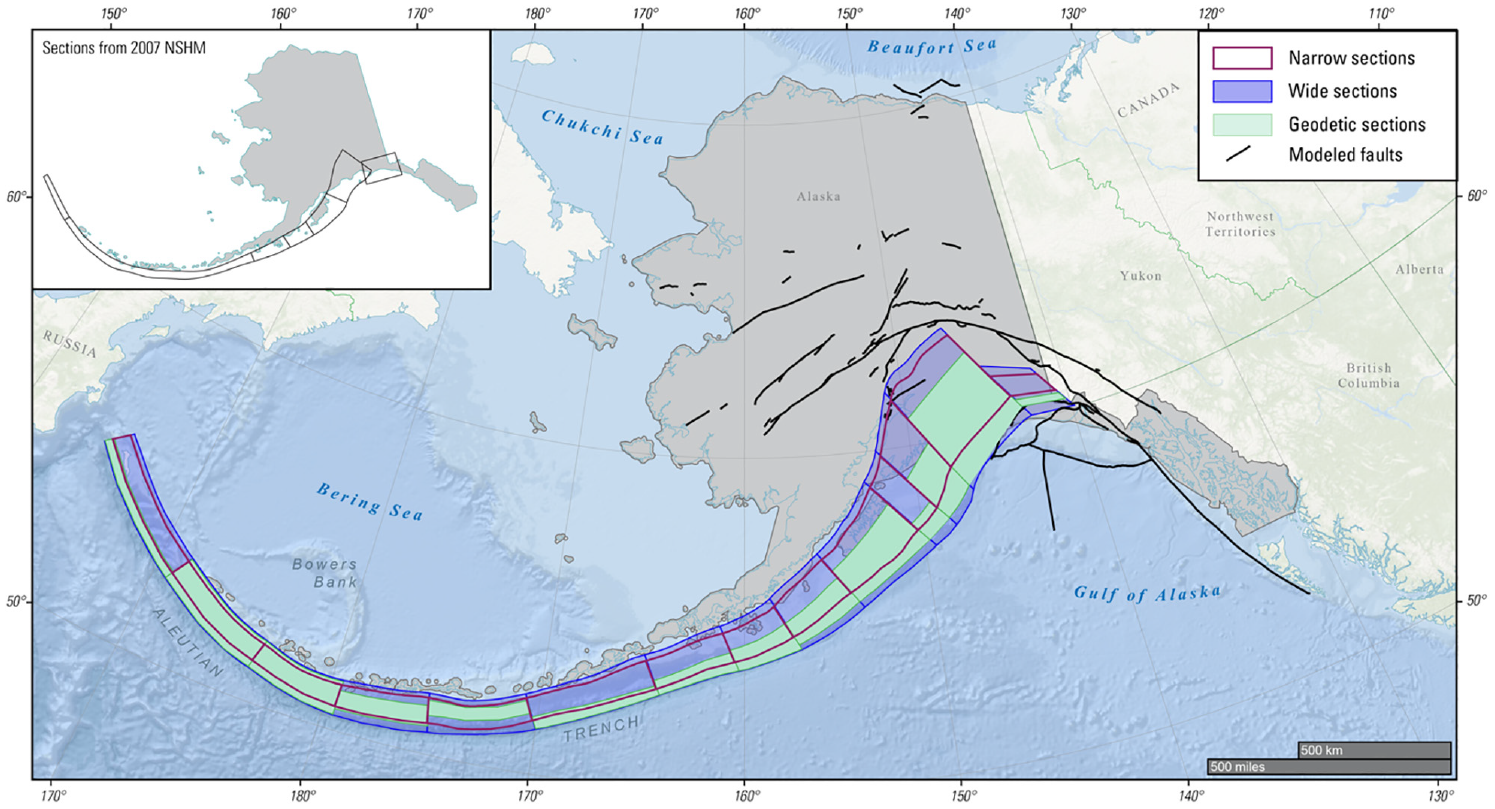
Map of subduction interface fault sections showing the “wide” (purple), “narrow” (red outline), and “geodetic” (green) structural models. Inset: 2007 National Seismic Hazard Model (NSHM) subduction interface sections. The geodetic rupture areas are adapted from the locked patches shown in Figure 7. Map projection: Alaska Albers equal area, WGS 84 datum; bathymetry: GEBCO (GEBCO Compilation Group, 2023).
From a modeling perspective, it is preferable to maintain symmetric logic tree branches across the width of the Aleutian arc. However, no geologic rate constraints exist west of the Fox Islands section. We therefore maintain the geologic rate branch to the west using an inferred geologic recurrence of 200 years. We base this on the similarity of structural style over the western Aleutians, the 210-year geologic recurrence of the Fox Islands section, and the ∼200-year recurrence predicted by the geodetic model for the Amchitka and Adak sections. The coupled width of the Amchitka and Adak sections in the geodetic models is similar to the geologic “wide” sections (Figure 8).
Multi-section ruptures and rates
Although it is unlikely that the entire Alaska–Aleutian arc ruptures in a single event, multiple multi-section earthquakes exist in the historical record, both east and west of the Shumagin “seismic gap.” The subduction interface logic tree (Figure 3) therefore includes alternate branches of multi-section ruptures consisting of variations on two- and three-section long ruptures at the eastern and western ends of the Aleutian arc (Figure 9a). Although these are modeled as independent epistemic branches, the one-, two-, and three-section ruptures constitute a continuous MFD and represent aleatory uncertainty, not epistemic. The question then becomes, how do we apply the geodetic and geologic rate models to the different segmentation models in the logic tree? The geologic recurrence data are a record of large, tsunamigenic ruptures on the megathrust. Although Briggs et al. (2024) supply recurrence estimates on a per-section basis, the records are derived from an earthquake history that includes multi-section ruptures such as the 1964 M9.2 event. It is therefore appropriate to apply the geologic rates as constraints on single- and multi-section ruptures on the interface. The multi-section rupture rates honor the single-section rates, with any leftover in a particular section modeled as a single-section rupture with a rate that makes up the difference. Change in ground motions across the segmentation branches due to larger multi-section magnitudes is relatively minor because the multi-section magnitudes are generally higher than the magnitude scaling breakpoints in the NGA-Sub GMMs (Table ES1-1 in electronic supplement ES1; Rezaeian et al., 2024).
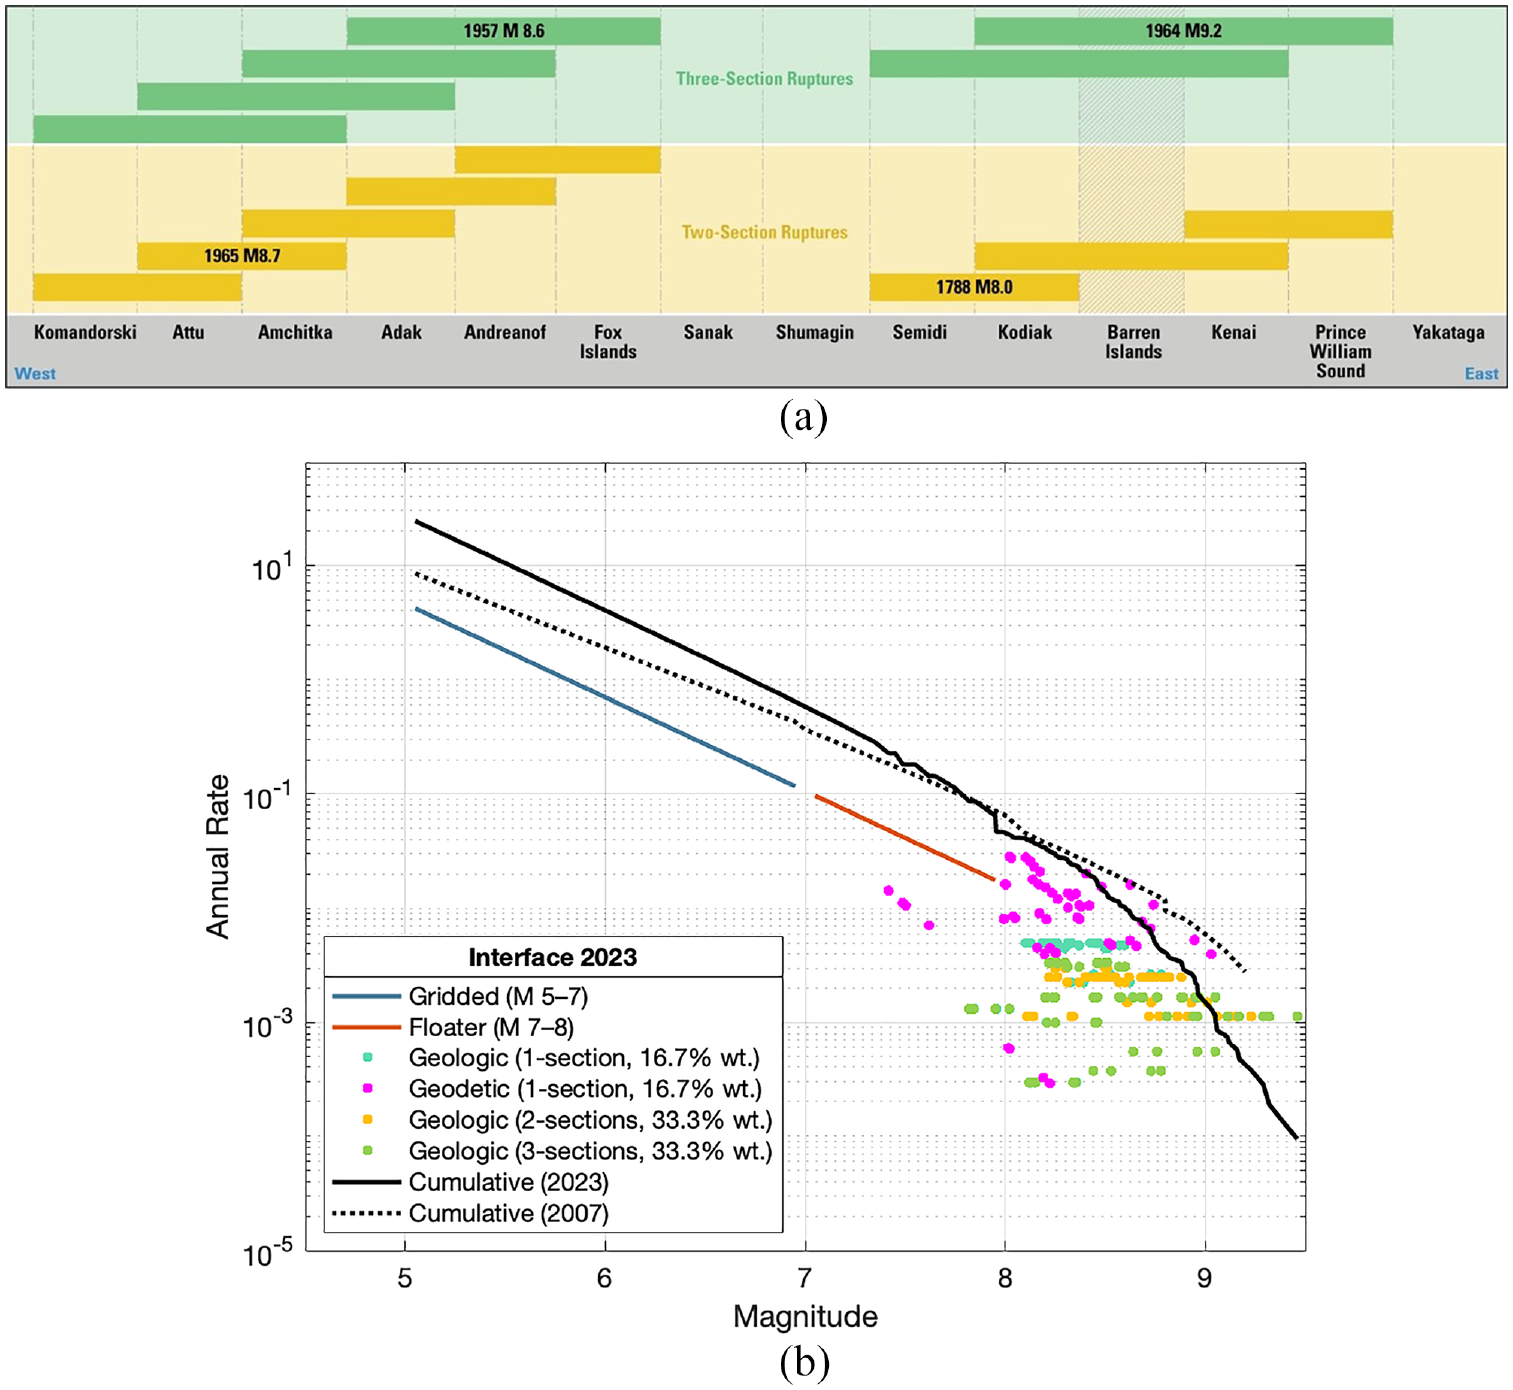
(a) Illustration of two- and three-section ruptures modeled in the moment magnitude (M) > 8 subduction interface logic tree. Note that little is known about the narrow Barren Islands section (hatch pattern) of the interface other than it is a weakly coupled area that ruptured as part of the 1964 Great Alaska earthquake. At this time, we are uncertain whether it ruptures on its own, so for the purpose of the multi-section rupture model we include it when bounded by the more strongly coupled Kenai and Kodiak sections. (b) Cumulative magnitude–frequency distribution (MFD) of the subduction interface component of the Alaska NSHM ERF showing all single and multi-section ruptures. The high-rate geodetic single section ruptures are shown in pink.
Geodetic models of earthquake rate for subduction zones are relatively new and do not yet have wide adoption in large, regional-scale NSHMs. Moment-balanced geodetic rates derived from estimates of slip-deficit for the Alaska–Aleutian subduction zone are quite a bit higher than geologic rates. Given the different scaling relations considered, the range of recurrence rate on the Kodiak section is 50–150 years for M8.4–8.7 events, respectively, with a weighted average recurrence of 100 years. This is roughly four times faster than geologic rates for the Kodiak section (379 years). Geodetic rates are nearly five times faster than geologic rates for the Kenai section to the east, but the historical record is missing frequent, <100-year recurrence, low-to-mid M8 subduction interface events over the length of the arc. Although the recent 2021 M8.2 Chignik earthquake fits this mold, there is no historical record of other such events over the eastern half of the arc. Moreover, geodetic event rates on the interface also exceed event rates recorded in lacustrine paleoseismology records in south-central Alaska (Van Daele et al., 2020). Lacustrine submarine landslides record shaking from all events—crustal, interface, and intraslab—and could potentially be used in the future to constrain total earthquake rate in a region. This discrepancy between the geologic and geodetic rates has been recognized for some time (Briggs et al., 2024) and the structure of the east end of the Aleutian arc is more complex than the single plane currently considered in inversion of geodetic data and this NSHM. Although we could derive logic trees of large-magnitude, moment-balanced two- and three-section ruptures using the single-section geodetic constraints, these would have a much higher rate of recurrence than supported by the geologic and historical record. We therefore apply the geodetic constraints as an upper bound on the rate of single-section ruptures and the geologic constraints as a lower bound, each with equal weight in the segmentation logic tree (Figure 3).
Figure 9b shows the full cumulative MFD for the full length of the Alaska–Aleutian subduction interface for the both the 2007 and 2023 models. The two models have the same rate of M ≥ 7.8 events with a recurrence of once every ∼10 years. The 2023 model forecasts an M ≥ 8 event about once every ∼22 years, a change from the once every ∼15 years represented the 2007 model. The M ≥ 8 rates of both models are in agreement with the historic record of one M8+ event every ∼16 years over the length of the arc (eight M8+ events over the past 125 years).
Magnitude scaling relations
For each rupture in the large-magnitude interface logic tree, we use four magnitude-area scaling relations to compute magnitude. For subduction interface events, the three Shaw (2023) models are all “LogA” models with coefficients differing by 0.1 magnitude units (Figure 4b). Relative to the likely areas of historical interface ruptures (red dots in Figure 7b), the Shaw (2023) models are biased high. We therefore opt to use the middle Shaw (2023)“LogA” model, along with the established NSHM interface scaling relations used for the Cascadia subduction zone in the CONUS model: Murotani et al. (2008), Strasser et al. (2010), and Papazachos et al. (2004), all with equal weight. Murotani et al. (2008) is a “LogA” relation with the same slope as Shaw (2023)“LogA + 4.0,” but with a lower coefficient consistent with lower scaling of Alaska earthquakes. Inclusion of Strasser et al. (2010) with a shallower slope and Papazachos et al. (2004) with a steeper slope increase epistemic uncertainty for larger areas and magnitudes. On the geologic branch, magnitude branches rupture with equal rate. On the geodetic branch, rates are moment balanced with respect to slip rate (Briggs et al., 2024); that is, for a scaling-relation branch that yields a larger magnitude there is a commensurate reduction in rupture rate.
When constructing the multi-section rupture model, we found that magnitudes for the “wide” structural model rose as high as M9.5+ for a repeat of the 1964 Great Alaska earthquake. Although the sampling of rupture area estimates from Tape and Lomax (2022) in Figure 1 span the upper and lower limits of the “wide” model, ruptures do not tend to fill out the full area of a section. Moreover, finite-fault models of historical earthquakes (e.g. the 1964 earthquake in Suito and Freymueller, 2009) and geodetic models of coupled interface width (Figure 8) tend not to span the full rupturable width of the interface. We therefore use estimates of magnitudes derived from the “narrow” model for rupture magnitudes on the “wide” geologic branch, both single- and multi-section. Magnitudes for subduction interface ruptures are additionally capped at M9.4, although in practice only one multi-section rupture required capping.
GMMs
The 2023 Alaska NSHM updates the GMMs for all tectonic settings (Table 2). The 2007 update considered the best available GMMs of the time, but in the ensuing years both GMMs and building codes evolved substantially. The 2007 GMMs lack features that are considered essential today, such as site and basin depth scaling, hanging-wall terms in crustal GMMs, and depth scaling and breakpoints in magnitude scaling in subduction GMMs. Modern seismic design regulations use hazard results for peak ground acceleration (PGA) and 21 spectral periods ranging from 0.01 to 10 s, and eight site classes with VS30 (the time-averaged shear wave velocity in the top 30 m of the soil) ranging from 150 to 1500 m/s. GMMs used in USGS NSHMs must now support these multi-period response spectra (MPRS), as described in more detail in Shumway et al. (2021). In addition, as part of the 2014 CONUS NSHM, the USGS formally introduced a set of 16 GMM selection criteria to vet available published GMMs and select those most appropriate for use in the NSHMs. These criteria were designed to be general and flexible enough to accommodate the continued growth and evolution of GMMs (Petersen et al., 2014; Rezaeian et al., 2015).
Ground motion models (GMMs) in the 2007 and 2023 Alaska National Seismic Hazard Models (NSHMs)
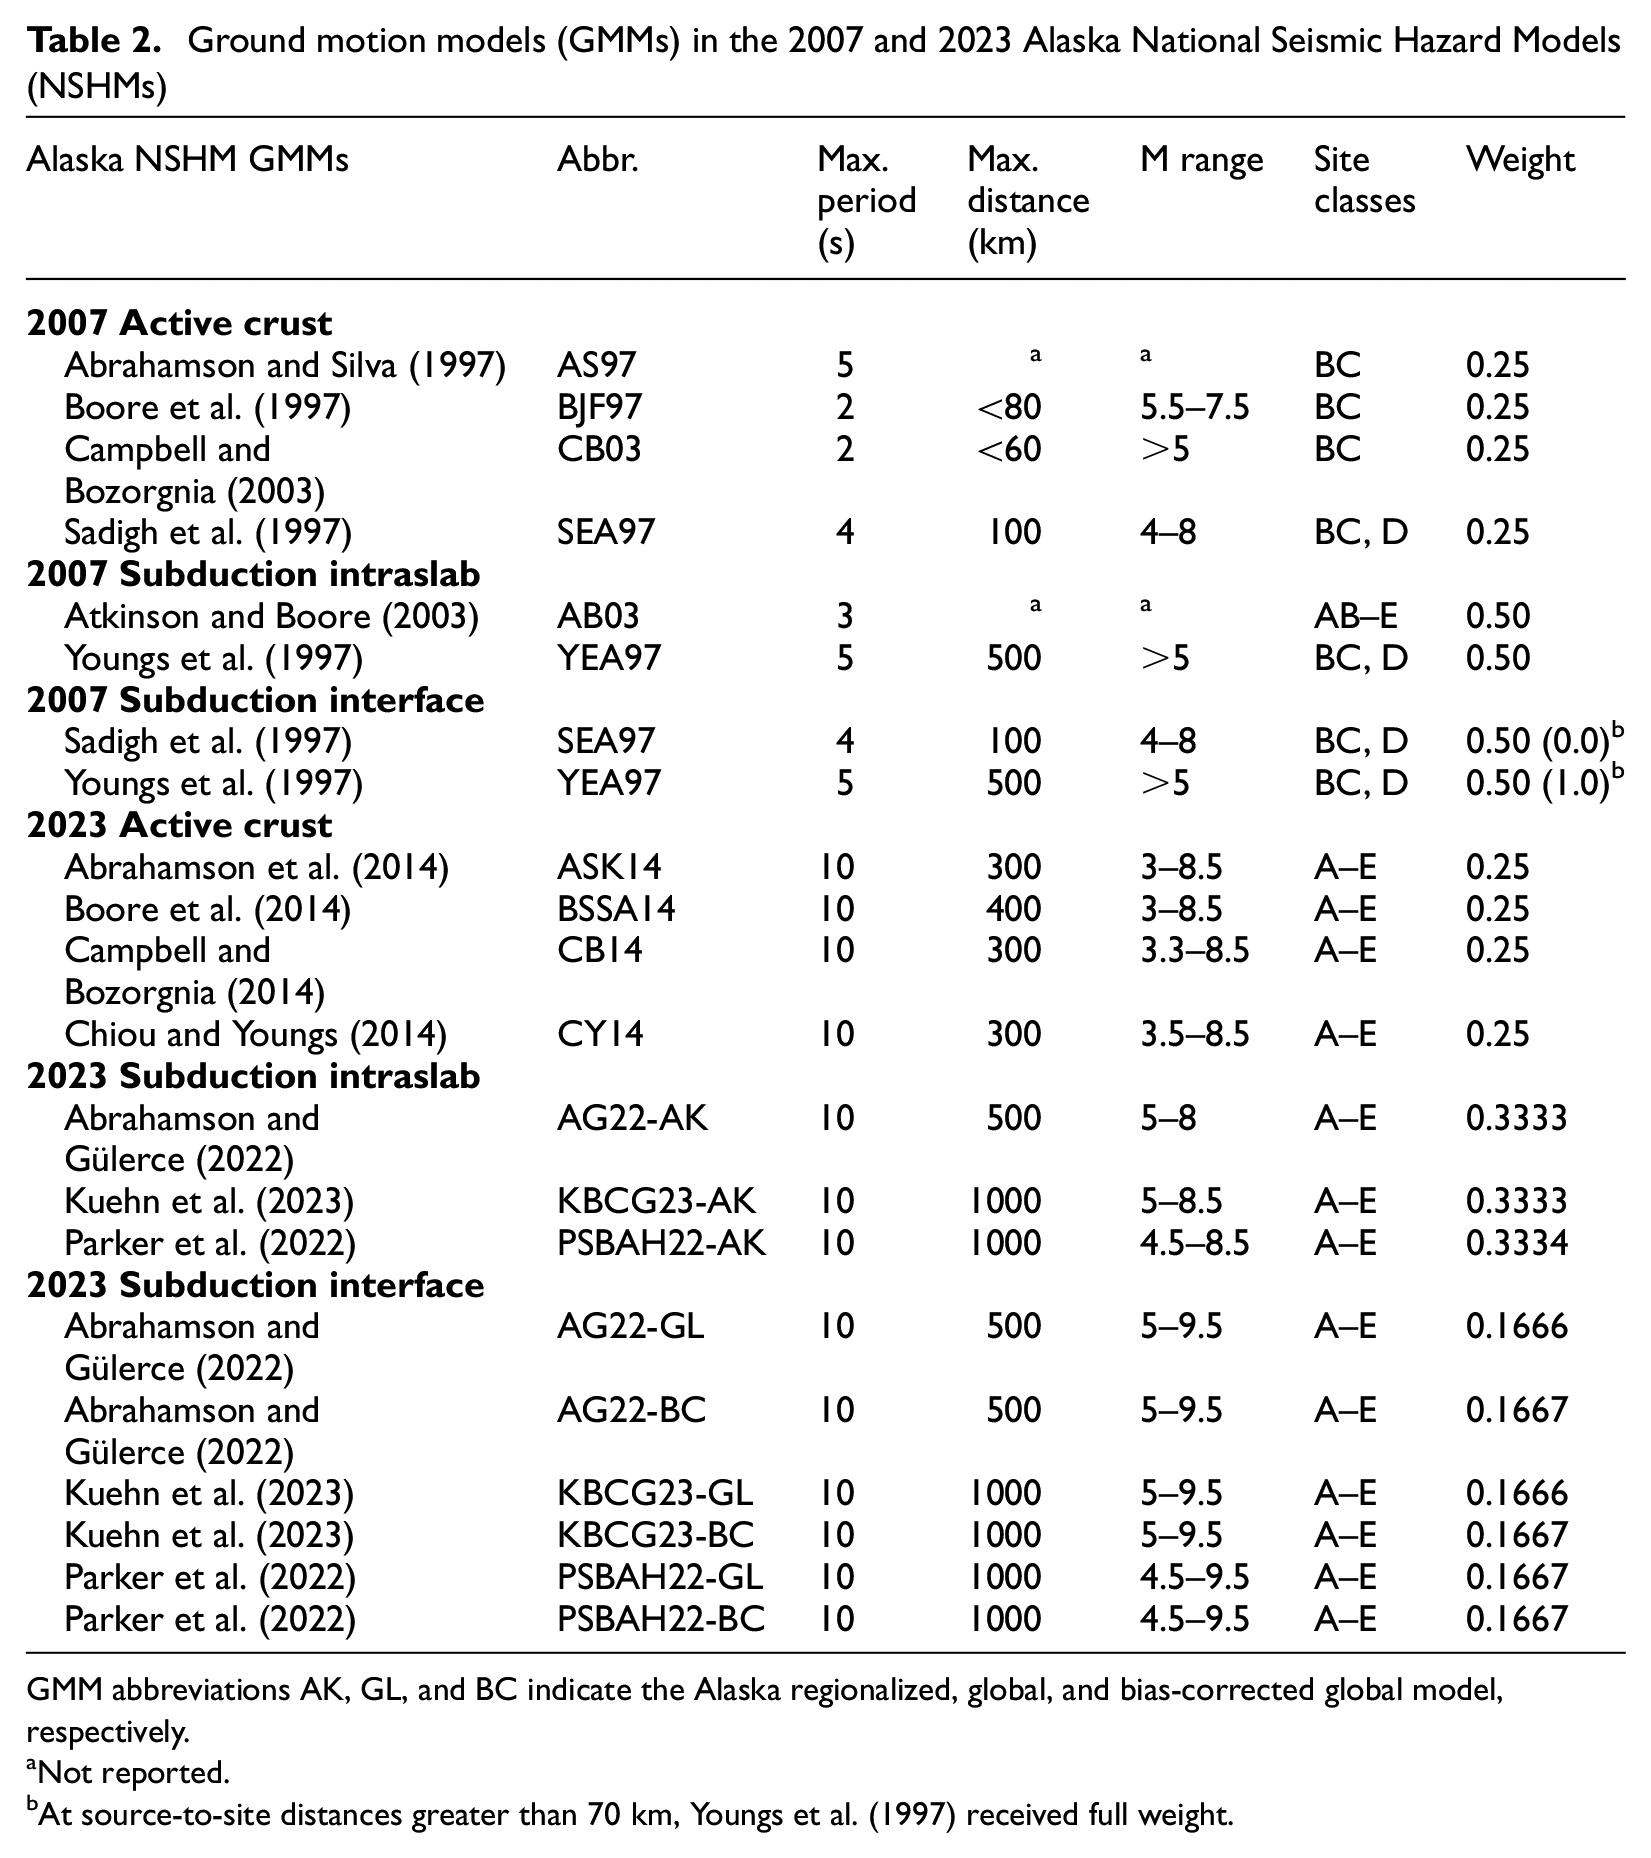
GMM abbreviations AK, GL, and BC indicate the Alaska regionalized, global, and bias-corrected global model, respectively.
Not reported.
At source-to-site distances greater than 70 km, Youngs et al. (1997) received full weight.
Over the past decade, the Pacific Earthquake Engineering Research (PEER) Center, under the masthead of the Next Generation Attenuation (NGA) Project, initiated multiple multi-disciplinary research projects to evaluate and improve ground motion characterization. These efforts led to the development and publication of the NGA-West2 (Bozorgnia et al., 2014), NGA-East (Goulet et al., 2021), and NGA-Sub (Bozorgnia et al., 2022) GMMs. Each project began with the development of a uniformly processed database of ground motion recordings from which multiple groups could independently develop GMMs. For this update, we consider the NGA-West2 GMMs for active crust sources and the NGA-Sub GMMs for use with subduction interface and intraslab earthquakes. The following sections review differences between the 2007 and 2023 GMMs and provide detail on the changes to GMM medians, aleatory variability, epistemic uncertainty, and site-effect models. In this update, we do not consider any basin effects in the Cook Inlet or other basins.
Crustal GMMs
The 2023 Alaska update uses the four NGA-West2 GMMs with equal weight: Abrahamson et al. (2014), Boore et al. (2014), Campbell and Bozorgnia (2014), and Chiou and Youngs (2014), which have been in use in the active continental crust setting of the CONUS NSHM model since the 2014 update (Rezaeian et al., 2015). This update was necessary because the 2007 crustal GMMs are outdated and do not support the MPRS (Table 2) required for current and future engineering and risk projects across the state. The NGA-West2 ground motions across all spectral periods are lower at larger distances and larger magnitudes compared with the GMMs used in 2007 (Figure 10 and Supplemental Figure ES1-6). When computing ground motions using crustal GMMs, we consider all crustal sources within 300 km of a site, consistent with recommendations of the NGA-West2 developers and integration distances applied in the 2023 CONUS NSHM.
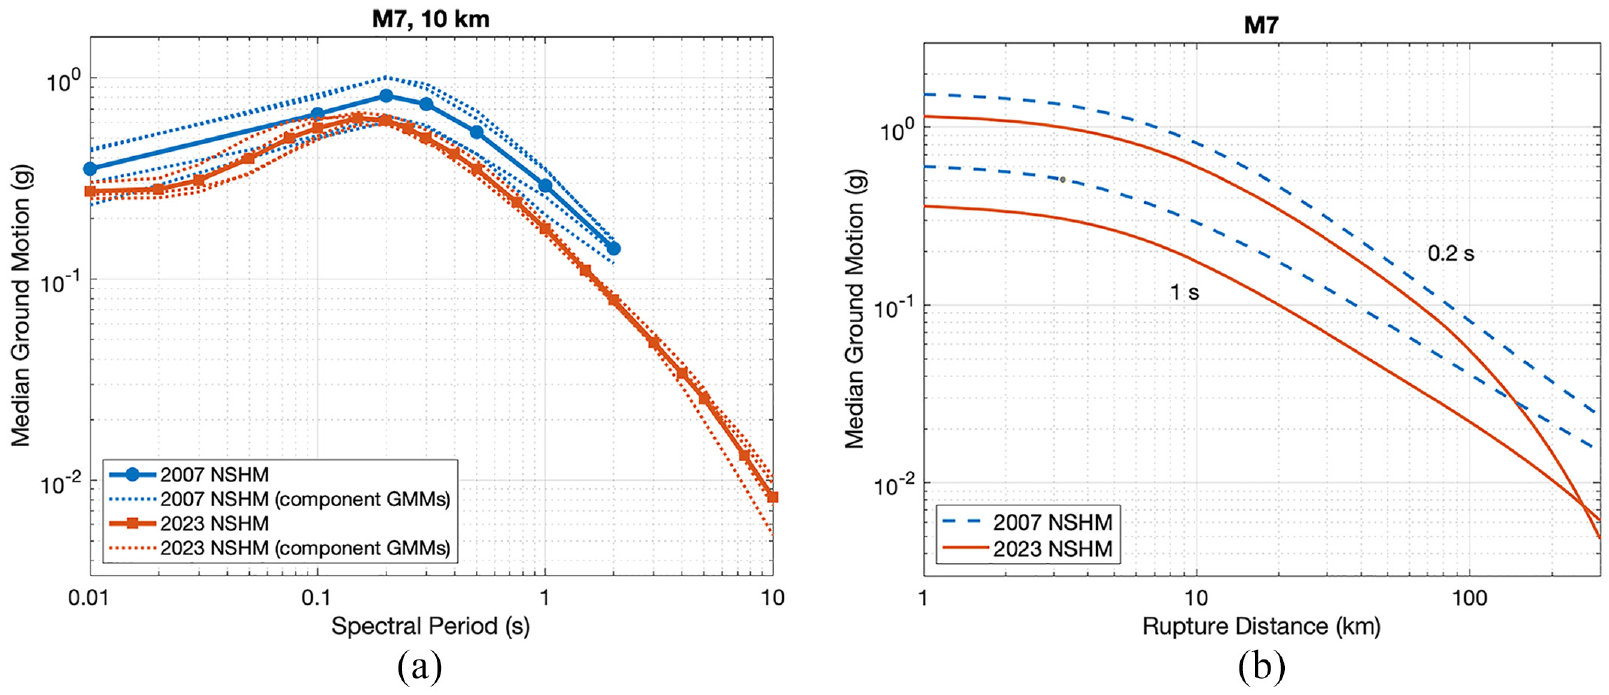
Comparison of the weighted combination of active crust ground motion models (GMMs) used in the 2007 and 2023 Alaska National Seismic Hazard Models (NSHMs) for an M7 event at a site with a time-averaged shear-wave velocity in the upper 30 m (VS30) = 760 m/s. (a) Medians versus period at 10 km and (b) medians versus distance at 0.2 and 1 s spectral period.
Subduction GMMs
The NGA-Sub GMMs, Abrahamson and Gülerce (2022), Kuehn et al. (2023), and Parker et al. (2022), hereafter denoted AG22, KBCG23, and PSBAH22, respectively, are relatively new and not yet in wide use. The models provide regionalized forms for Alaska, and we implemented these along with the base global models. When appended with “-AK,”“-GL”, or “-BC”, the GMM acronyms indicate whether the model is Alaska regionalized, global, or bias-corrected global, respectively. Bias-corrected here means we applied adjustments to the GMM means based on residuals from recent earthquake records not considered during NGA-Sub development, as discussed below. We also verified the NGA-Sub GMMs against published model comparisons (Gregor et al., 2022), published codes (Mazzoni et al., 2022), and implementations in the OpenQuake engine (Pagani et al., 2014).
At the outset of development of the 2023 Alaska NSHM, we used the Alaska regionalized versions of the three NGA-Sub GMMs with equal weight for both interface and intraslab events. These choices for the GMM logic tree, in conjunction with changes to the interface ERF component of the model, implied very large increases in the 2475-year return period ground motions along the Aleutian arc and across south-central Alaska. The NGA-Sub GMMs have not yet been widely adopted in the site-specific PSHAs and regional-scale NSHMs that invite the scrutiny required for community acceptance of such models. Moreover, the Alaska NSHM update will likely have broad impact on numerous end users and downstream products, and it is incumbent on the USGS to provide assurances that adoption of new models is, in fact, “best available science,” a warranted change, and an improvement over prior models. To better understand the NGA-Sub GMMs, we enlisted the assistance of the NGA-Sub and other GMM developers to advise the USGS and make expert recommendations on the use of these new GMMs. We convened an eight-member expert advisory team that met on four occasions to discuss the development, details, and application of the NGA-Sub GMMs in the context of their applicability to the Alaska NSHM. The following paragraphs are heavily informed by the discussions with this team.
Initial evaluations of the Alaska regionalized GMMs for the subduction interface, comparisons with their global counterparts, and consideration of the records in the NGA-Sub database, as well as more recent events, highlighted a few issues. First, ground motions for the KBCG23-AK model are biased high relative to the other two regionalized interface models. At softer sites (lower VS30) KBCG23-AK ground motions are two to three times higher than the other models, indicating an issue with the site term in the regionalized model. Second, the PSBAH22-AK model for the interface is lower than its global counterpart and consistent with the AG22-AK regionalized model. However, the AG22 developers also supply an “adjusted” Alaska regionalized model, citing issues with the NGA-Sub database records that is more closely aligned with their global model. Such variations between the models complicate efforts to make informed decisions about which ones to use and how to weight them in a logic tree. Third, although Alaska has a rich history of earthquakes, there are relatively few recordings in the NGA-Sub database that are relevant for forecasting ground motions for the largest M8+ events in south-central Alaska. The database does not yet include recordings for the 2021 M8.2 Chignik event and most are for moderate to small M < 7 events at very large distances. For these reasons and at the recommendation of the GMM advisory team, we chose not to use the Alaska regionalized interface GMMs and instead focus on the global interface models with possible adjustments.
To this end, we computed residuals relative to the global NGA-Sub interface models using three different datasets. The first dataset was the subset of events in the NGA-Sub database with M > 6 and RRUP < 300 km, the magnitudes and distances relevant for forecasting ground motions in south-central Alaska. These data are exclusively from the central and western part of the Aleutian arc where the structure of the subduction zone differs substantially from that in the east. Here, the Aleutians form a narrow island arc, and colder and older crust of the Pacific plate subducts steeply. To the east, the arc becomes wider as it transitions to a continental arc, the subducting Pacific plate is warmer, and the dip of the subducting plate shallows considerably. The second dataset is for the 2021 M8.2 Chignik event (Figure 1). Although closer to Anchorage and the Kenai Peninsula where the Aleutian arc is wider, the event is still well west of the population centers and built environment of south-central Alaska. The third dataset is the combination of datasets one and two.
Because we are most concerned with ground motions close to south-central Alaska, we focused on datasets two and three, hereafter termed “east” and “west + east,” respectively. Residuals computed using the global NGA-Sub interface GMMs exhibit strong period dependence and are shown in Figure 11. The global NGA-Sub GMMs tend to overpredict ground motions at short spectral periods for both datasets, with a maximum negative residual (overprediction of ground motion by the GMMs) at 0.1 s spectral acceleration. When considering only the west data, this overprediction is even larger and extends to longer spectral periods. When considering the west + east dataset, the models all tend to underpredict at long periods, with a peak in the residuals at 1 s spectral acceleration. The positive offset of the PSBAH-GL model for the west + east dataset is consistent with differences in the magnitude scaling terms between the global models (Parker et al., 2022).
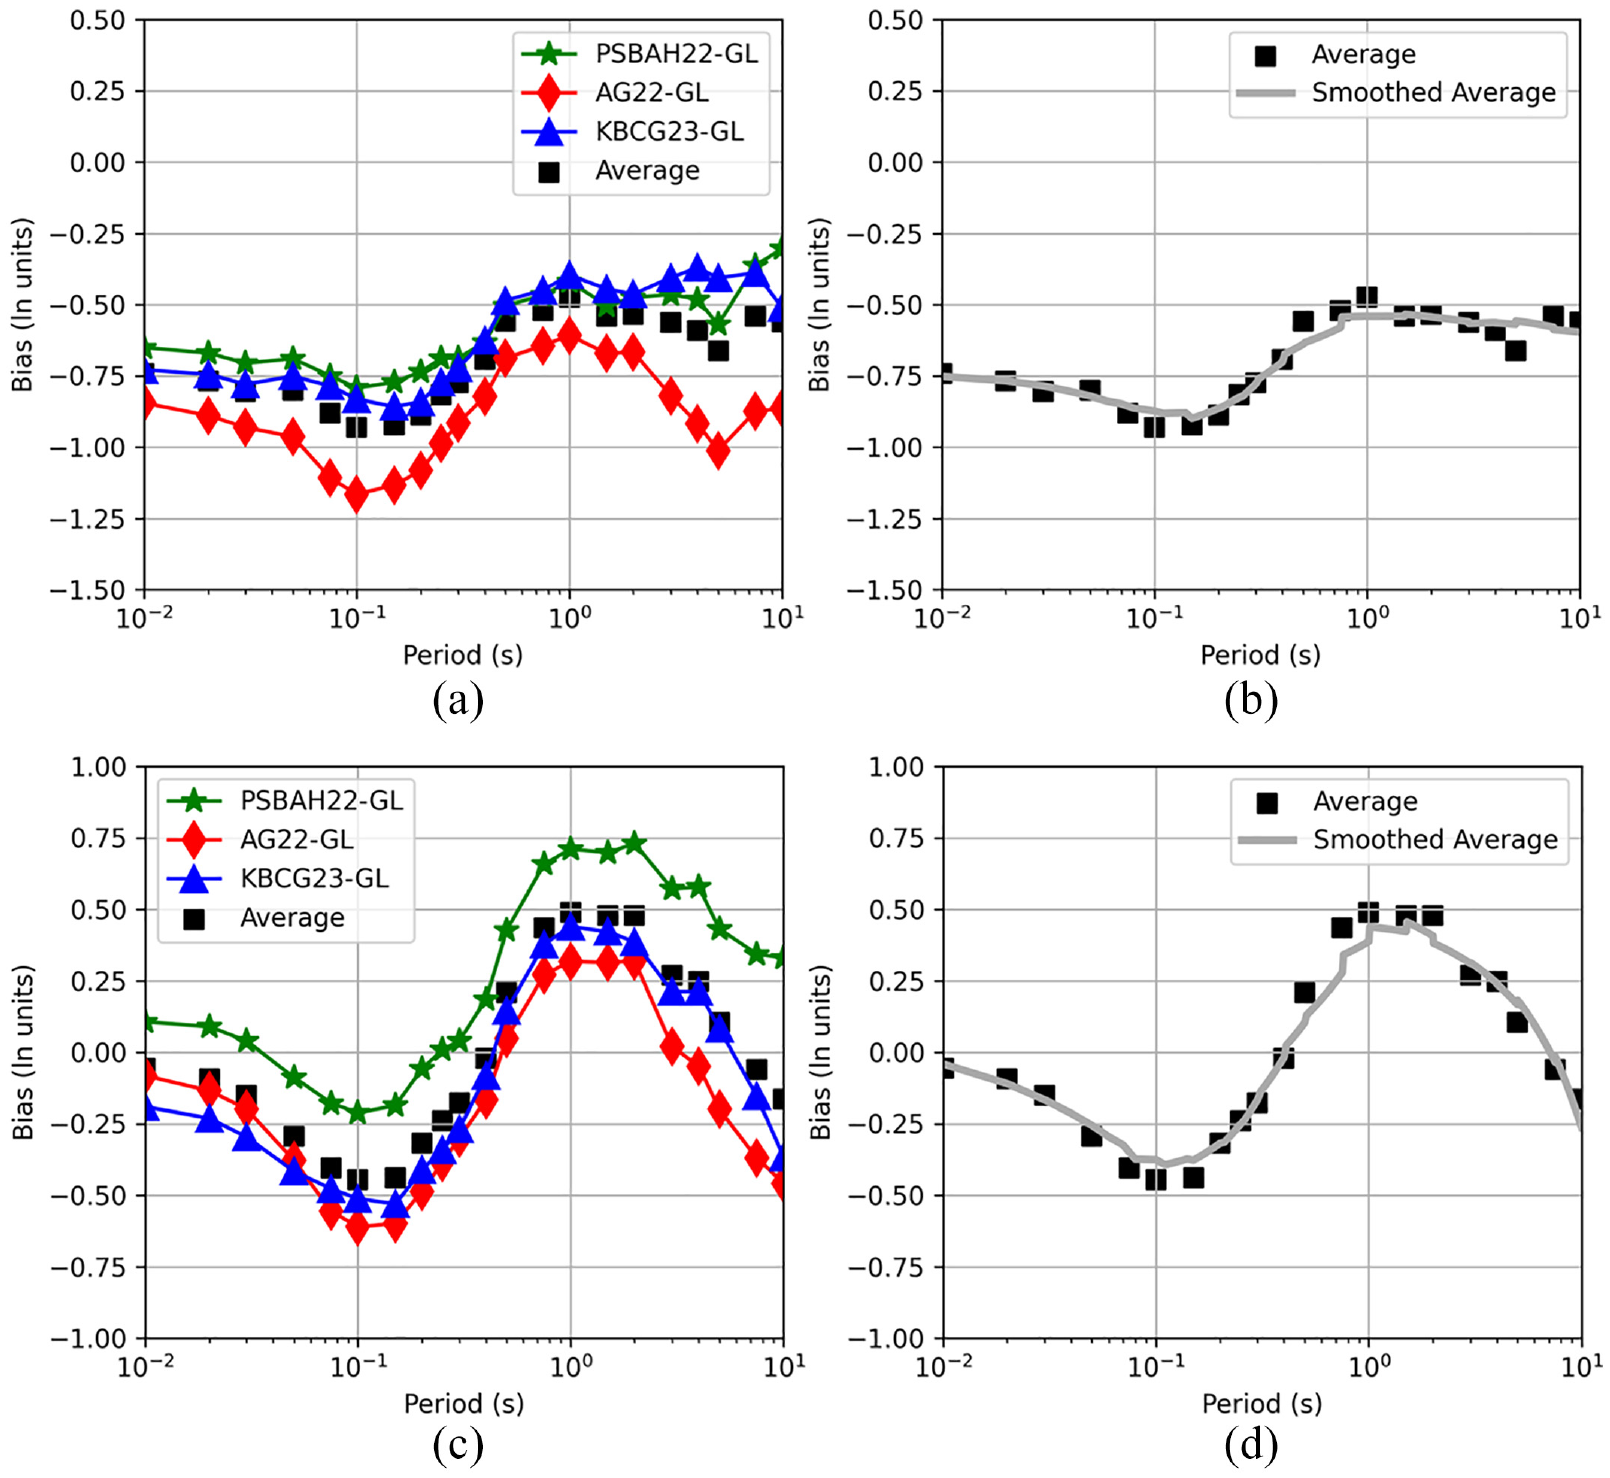
Ground motion residuals for the Next Generation Attenuation (NGA)-Subduction global interface GMMs versus response spectral period. The top row shows (a) ground motion model (GMM)-specific and (b) average residuals considering data from both the western and eastern Aleutian Islands. The bottom row shows (c) GMM-specific and (d) average residuals considering eastern Aleutian Islands data exclusively. Negative values indicate overprediction of ground motion by the GMMs and positive values an underprediction. PSBAH22-GL: global model from Parker et al. (2022); AG22-GL: global model from Abrahamson and Gülerce (2022); KBC23-GL: global model from Kuehn et al. (2023).
At this time, the physical basis for the observed biases is unclear. For example, do differences in the subduction zone geometry, crustal attenuation (Q), or thermal gradient explain the differences in the ground motions? Differences in site conditions in the Aleutian Islands as compared to site conditions in the global GMMs could also be part of the cause of the large negative residuals. Without understanding the cause for the lower ground motions in the Aleutian Islands, the applicability of large negative short-period residuals for Aleutian Island sites to other more populated regions to the east, such as Anchorage, is unknown. The panel ultimately recommended that we use the as-published global interface models with 50% weight and bias-corrected (using just the smoothed “east” dataset residuals) versions of the models with 50% weight (refer to electronic supplement ES3). The basis for this decision is that the “east” dataset is closer to the population centers of south-central Alaska. However, these data are still well to the west of the target region and so should be considered with only equal weight. When implementing the bias-corrected versions of the interface models, we apply the averaged and smoothed period-dependent bias term to each model, thus preserving the inter-model epistemic uncertainty.
A similar analysis using data for large magnitudes and short distances was performed for the Alaska regionalized intraslab models and they exhibited little bias. Although an independent examination of data from recent subduction intraslab earthquakes (Cramer et al., 2021) indicates the NGA-Sub GMMs underpredict at long periods for Anchorage, we attribute this to fore-arc/back-arc differences in ground motion arising from the cold slab acting as a wave guide and channeling energy toward the forearc, as observed in the 2018 M7.1 Anchorage earthquake (Moschetti et al., 2020). The NGA-Sub GMMs do not incorporate flags for the position of a site relative to the arc of a subduction zone, and so ground motion predictions are an average fore-arc/back-arc response and the underprediction is expected. The GMM advisory team believes the NGA-Sub global and regionalized intraslab datasets are better overall and recommended use of the three as-published Alaska regionalized NGA-Sub GMMs for intraslab events, with equal weight (refer to electronic supplement ES3).
The 2023 NGA-Sub interface GMMs exhibit stronger distance scaling than the 2007 GMMs, especially at shorter periods and shorter distances, and across all relevant magnitudes (Figure 12 and Supplemental Figure ES1-7). Above 2–3 s spectral period, ground motions of the 2023 GMMs are higher at large (>100 km) source-to-site distances. The 2023 intraslab GMMs increase short-period median ground motions for larger magnitude events at short distances; long-period ground motions are similar or reduced. For smaller magnitudes and large distances, the 2023 intraslab GMMs lower median ground motions relative to the 2007 models (Figure 13 and Supplemental Figure ES1-8). Site (VS30) scaling in the NGA-Sub GMMs is consistent with other modern GMMs (e.g. NGA-West2). Supplemental Figure ES1-12 shows the expected shift of the peak of the spectrum to longer periods and higher ground motions as VS30 decreases for an Anchorage site where hazard is dominated by subduction earthquakes. Refer to Rezaeian et al. (2024) for further discussion of the NGA-Sub GMMs.
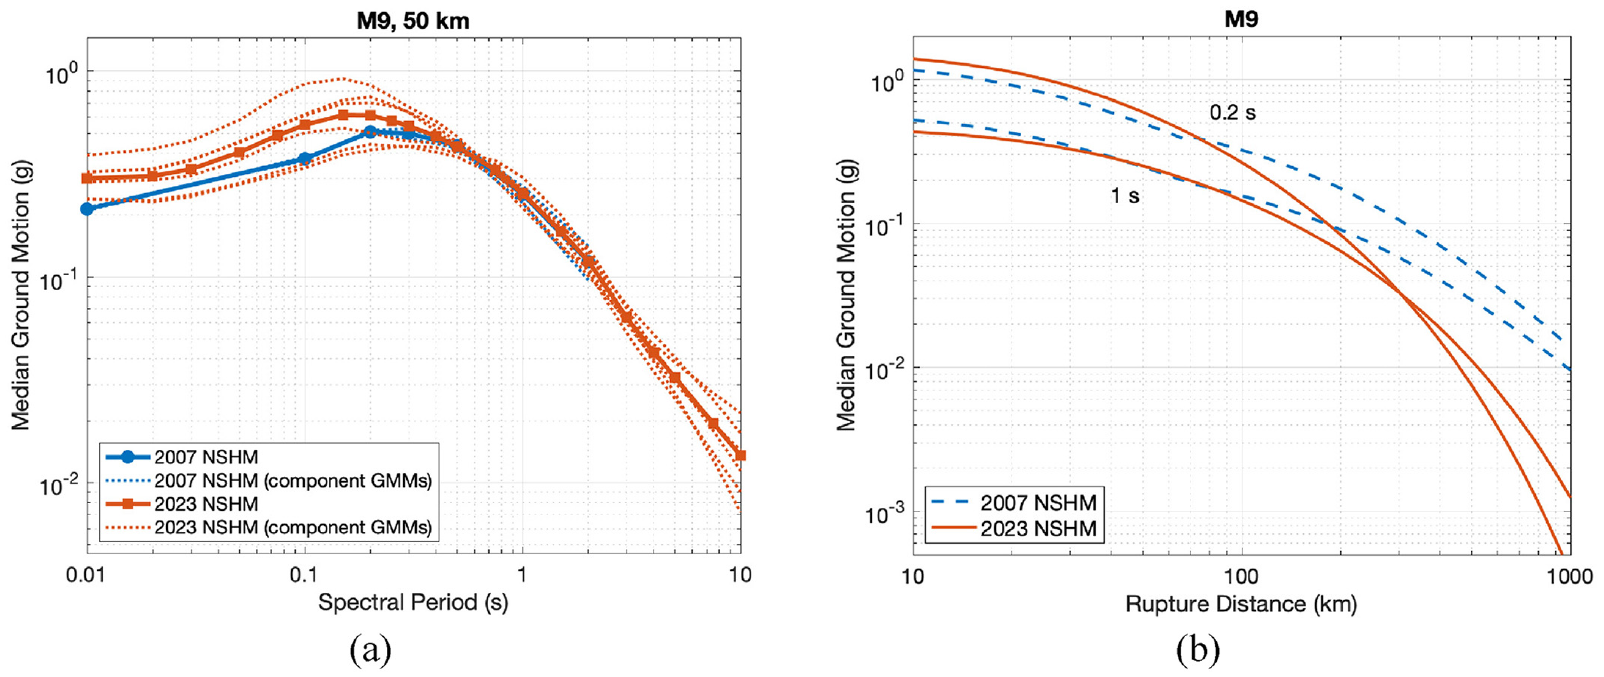
Comparison of the weighted combination of subduction interface ground motion models (GMMs) used in the 2007 and 2023 Alaska National Seismic Hazard Models (NSHMs) for an M9 event at a site with a time-averaged shear-wave velocity in the upper 30 m (VS30) = 760 m/s. (a) Medians versus period at 50 km and (b) medians versus distance at 0.2 and 1 s spectral period. Rupture depth ZTOR = 12 km in both. The step in the 2007 GMMs in (b) is due to a change from using two to one GMM at 70 km distance in the 2007 model.
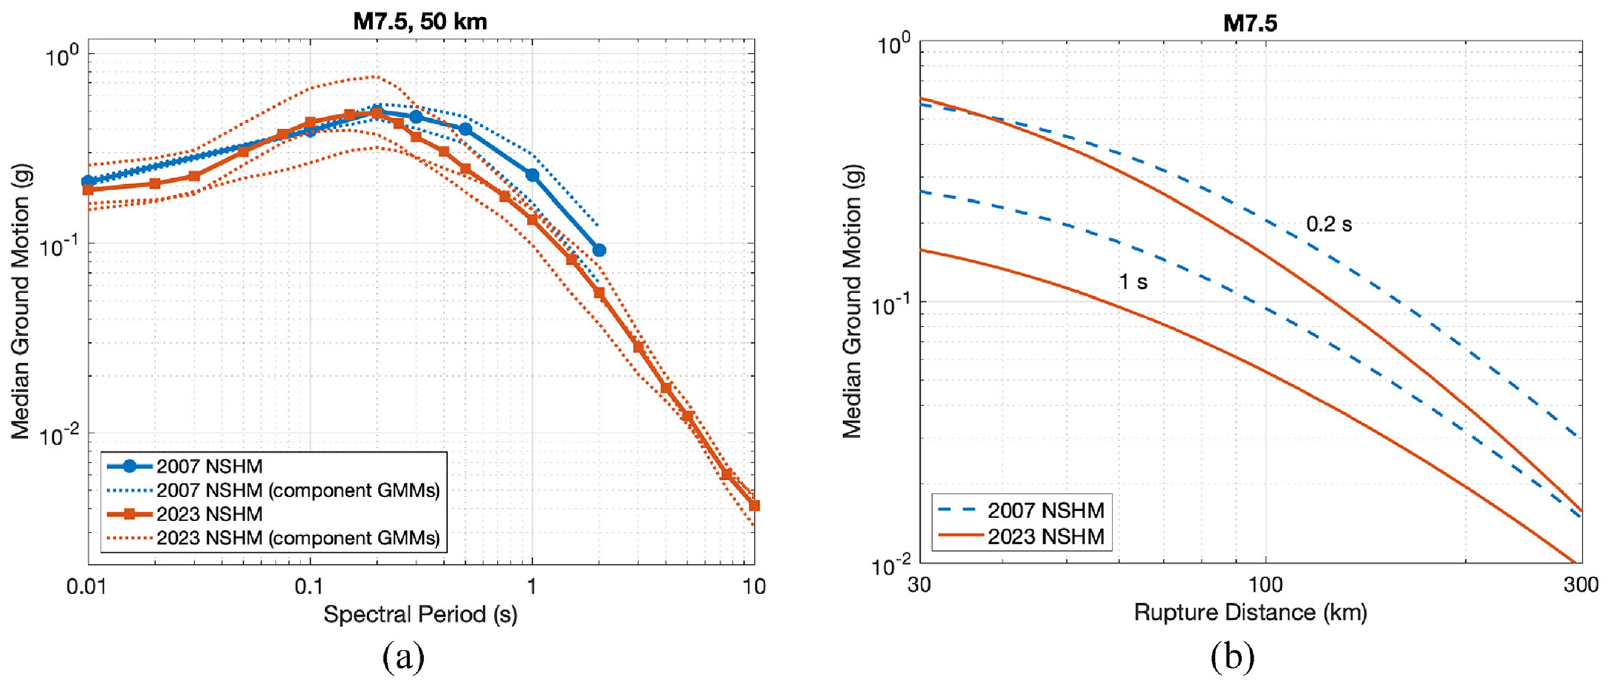
Comparison of the weighted combination of subduction intraslab ground motion models (GMMs) used in the 2007 and 2023 Alaska National Seismic Hazard Models (NSHMs) for an M7.5 event at a site with a time-averaged shear-wave velocity in the upper 30 m (VS30) = 760 m/s. (a) Medians versus period at 50 km and (b) medians versus distance at 0.2 and 1 s spectral period. Rupture depth ZTOR = 30 km in both.
When computing ground motions using the subduction interface GMMs, we consider all sources within 1000 km of a site, largely consistent with recommendations of the NGA-Sub developers and integration distances applied in the 2023 CONUS NSHM for Cascadia. Abrahamson and Gülerce (2022) recommend an applicability distance of 500 km for their GMM, but ground motions are generally quite low at such large distances and we favor consistency with the model application in Cascadia. When computing ground motions using the subduction intraslab GMMs, we consider all sources within 300 km of a site, again consistent with developer recommendations and the 2023 CONUS NSHM.
Aleatory variability
Aleatory variability (GMM standard deviation or “sigma”) accounts for the randomness that is naturally present in ground shaking for a given magnitude event and source-to-site distance on a given site condition. Each of the GMMs considered for this update are models that provide mean and aleatory variability. The aleatory variability models of the four NGA-West2 GMMs used for crustal ruptures are all a function of rupture magnitude and site condition (VS30); the Boore et al. (2014) model additionally considers distance. The NGA-West2 sigma values are higher than those of the crustal GMMs used in the 2007 NSHM (Figure 14a). The NGA-Sub GMM aleatory variability models are not regionalized and are either fixed, period-dependent values (KBCG23) or functions of magnitude and distance (PSBAH22) and additionally VS30 (AG22). PSBAH22 and KBCG23 both consider a broader range of global data when estimating sigma. Regions in other subduction settings with high site-to-site variability result in high sigma values at short spectral periods, T≈0.1 s (Figure 14b). Increases in sigma lead to increased estimates of seismic hazard at longer return periods unless offset by a decrease in event rate or median shaking. When implementing and evaluating the NGA-Sub GMMs, we considered using a fixed value of sigma (0.75), as the superseded BC Hydro GMM (Abrahamson et al., 2016) does. This was out of concern that some NGA-Sub sigma values were possibly higher than warranted. However, discussion with the GMM advisory team led us to conclude that the published models of aleatory variability were reasonable to include in the 2023 Alaska NSHM, as they have been for the 2023 CONUS model. The advisory team also recommended that the KBCG23 sigma model be adjusted to account for non-linear site amplification following that in the CB14 crustal GMM. The implementation introduces a VS30 dependence in KBCG23 and reduces sigma at softer sites. When computing hazard curves from GMM medians and sigmas, the USGS truncates the distribution of ground motions at three standard deviations to avoid extreme ground motions at shorter periods spanning the peak of the response spectrum (Frankel et al., 1996, 2002; Petersen et al., 2008, 2014).
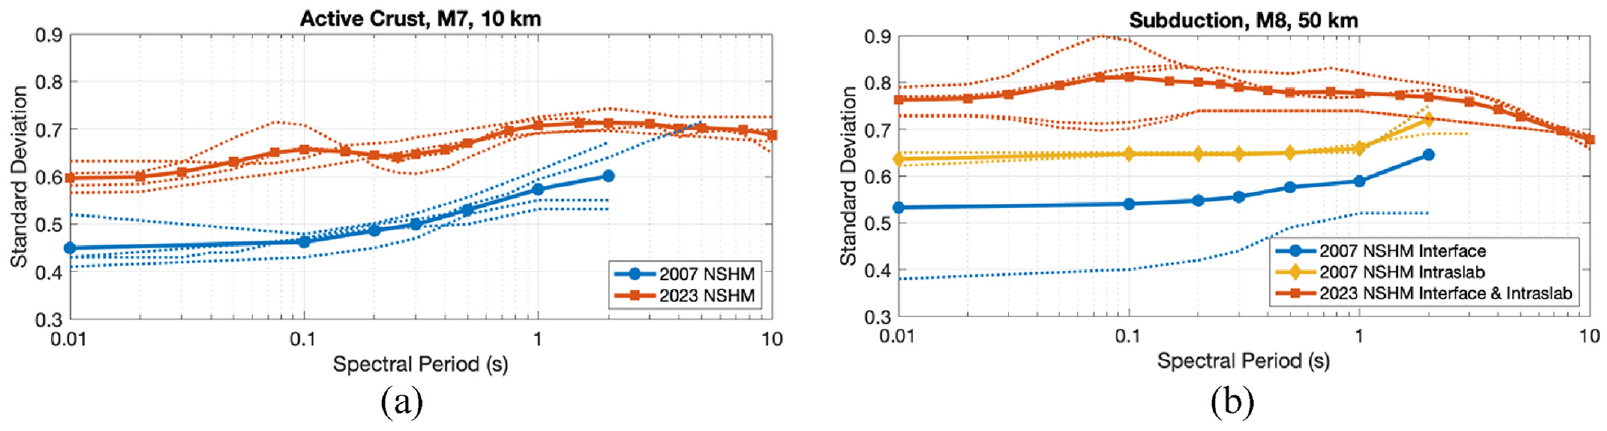
Standard deviations of ground motion models (GMMs) used in the 2007 and 2023 updates of the Alaska National Seismic Hazard Model (NSHM) plotted versus spectral period. (a) Active crust GMMs for an M7 event at 20 km at a site with a time-averaged shear-wave velocity in the upper 30 m (VS30) = 760 m/s. (b) Subduction interface and intraslab GMMs for an M8 event at 50 km depth at a site with VS30 = 760 m/s. Solid lines are the weighted square root sum of squares of the individual component GMMs in each model update. Dotted lines are the component GMMs.
Epistemic uncertainty
Epistemic uncertainty in GMMs accounts for variability in ground motion due to modeling choices and unknowns and is represented in two ways in an NSHM. First, the NSHM includes logic trees of multiple, independently developed GMMs with associated weights. Second, recent GMMs now include models of epistemic uncertainty on the median predicted ground motion. In the case of the NGA-Sub GMMs, each modeling group provided global and region-dependent values of epistemic uncertainty, ε (Supplemental Figures ES1-9 and ES1-10). These are applied in the Alaska NSHM as three logic-tree branches with means: μ–1.645ε, μ, μ+1.645ε, and weights of 0.185, 0.63, 0.185 that approximate the 5th, 50th, and 95th percentiles, respectively (Keefer and Bodily, 1983) of ground motion. The NGA-West2 GMMs have long used a USGS-developed model of epistemic uncertainty that is a function of sparseness in the NGA-West2 database over different magnitude and distance intervals. The model arose from a recommendation to better represent the distribution of ground motion because comparisons of the NGA-West2 models show them to be similar (e.g. Powers et al., 2021). To date, this epistemic uncertainty model has been applied as μ–ε, μ, and μ+ε branches with weights of 0.185, 0.63, 0.185 (Supplemental Figure ES1-11). Al Atik and Youngs (2014) back-calculated what the epistemic uncertainties would be given the USGS ε values used and found them to be in line with their independent analysis of the NGA-West2 GMMs. We therefore continue to use the USGS model of epistemic uncertainty in this update. Relative to the 2007 Alaska NSHM, updates to the GMMs increase the epistemic uncertainty in ground motion substantially.
Modern subduction GMMs commonly include a magnitude-scaling breakpoint above which ground motions saturate. The limited set of records for the largest magnitude events worldwide makes it difficult to constrain the magnitude where the breakpoint occurs and the breakpoint is also strongly region-dependent. Some developers therefore include epistemic uncertainty on magnitude breakpoint (e.g. Abrahamson and Gülerce, 2022; Abrahamson et al., 2016). We considered including breakpoint uncertainty when developing the NSHM, but ultimately decided the range of breakpoints spanned by the existing mix of global and Alaska-regionalized GMMs was adequate (Supplemental Table ES1-1). Refer to Rezaeian et al. (2024) for an evaluation and discussion of the magnitude scaling breakpoints of the NGA-Sub GMMs.
Hazard implications
The combined effects of changes in the ERF and GMMs in the 2023 update of the Alaska NSHM relative to the prior 2007 model are substantial. Figure 15 shows mean uniform-hazard maps (2% probability of exceedance in 50 years) for the 2023 Alaska NSHM at two spectral periods, 0.2 and 5 s. Figure 16 shows the differences and ratios between the 2007 and 2023 model at 0.2 and 1 s spectral period.
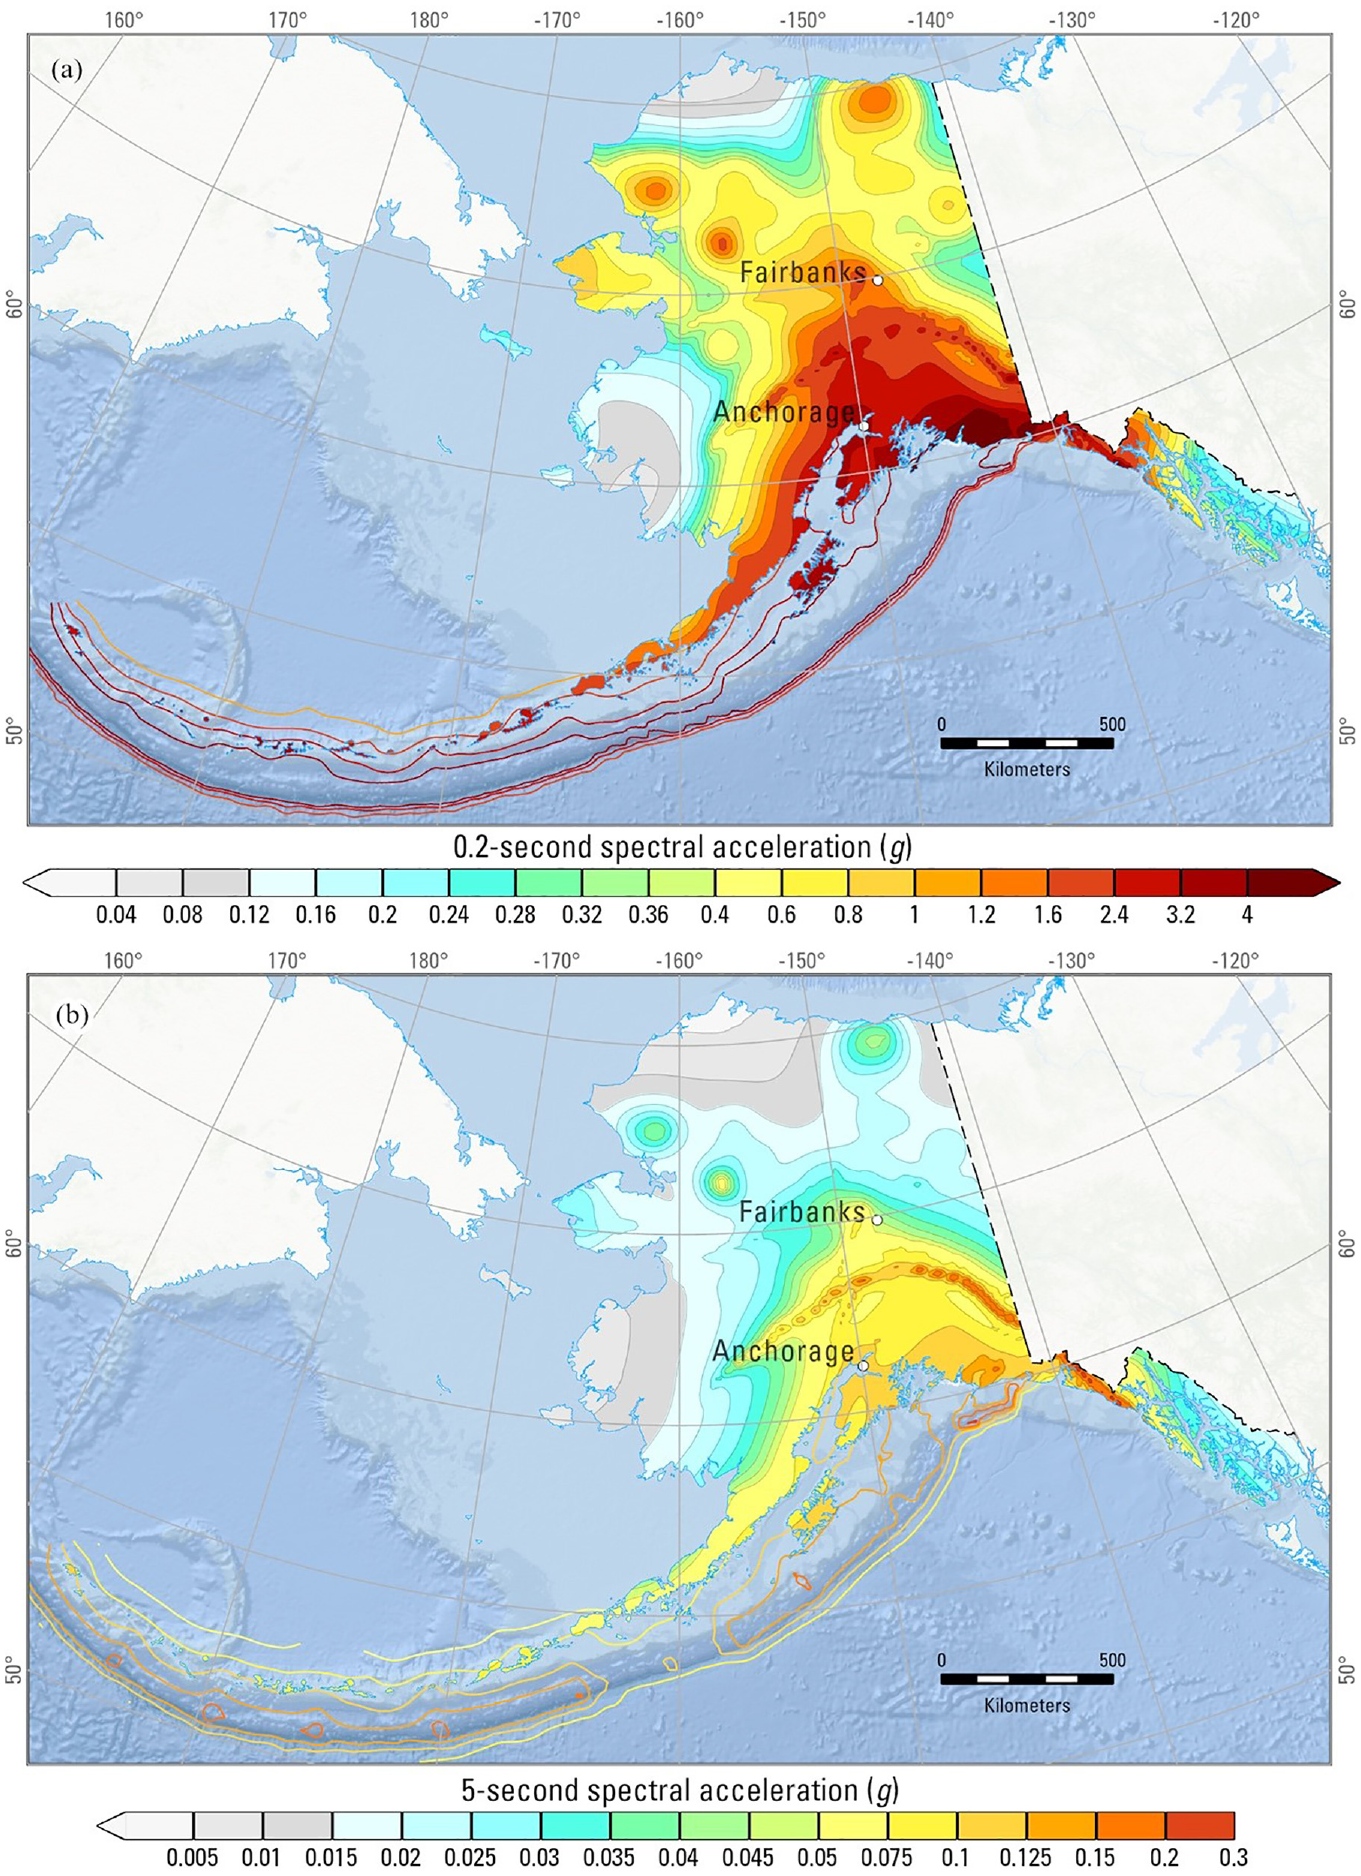
Seismic hazard maps for the state of Alaska based on the 2023 National Seismic Hazard Model (NSHM) for a soft rock site class (time-averaged shear-wave velocity in the upper 30 m (VS30) = 760 m/s). Maps show spectral acceleration with a 2% probability of exceedance in 50 years at periods of (a) 0.2 s and (b) 5 s. Map projection: Alaska Albers equal area, WGS 84 datum; bathymetry: GEBCO (GEBCO Compilation Group, 2023).
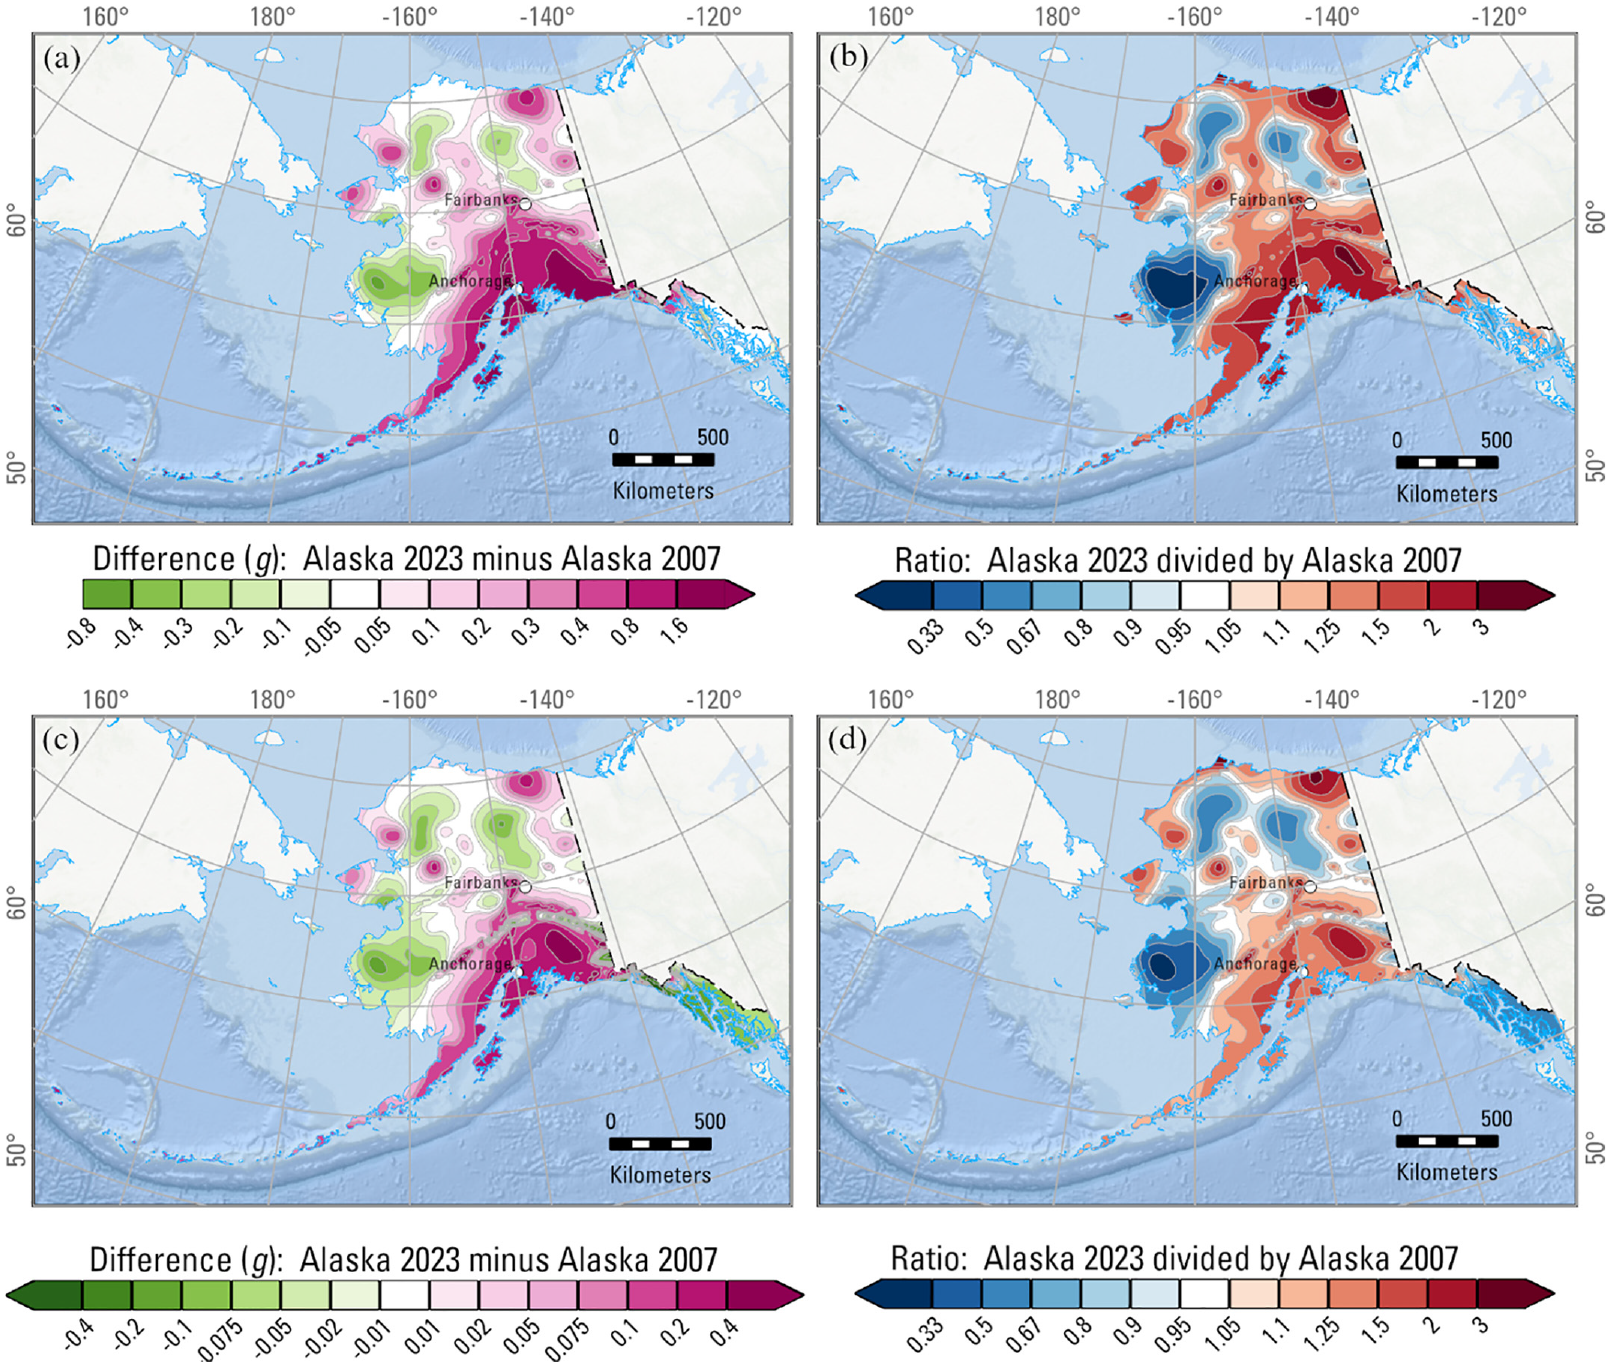
Difference and ratio maps comparing the 2023 and 2007 updates of the Alaska National Seismic Hazard Model (NSHM). Maps compare (a, b) 0.2 s and (c, d) 1 s spectral period ground motions with a 2% in 50-year probability of exceedance, time-averaged shear-wave velocity in the upper 30 m (VS30) = 760 m/s. White dots show the location of Anchorage and Fairbanks. Map projection: Alaska Albers equal area, WGS 84 datum; bathymetry: GEBCO (GEBCO Compilation Group, 2023).
The most striking feature of the 2023 Alaska hazard maps (Figure 15) are the regions of very high (>3 g) 2475-year 0.2 s spectral acceleration (SA) along the Alaska–Aleutian subduction zone that extend well into south-central Alaska and encompass Anchorage, Cook Inlet, and the Kenai Peninsula. Although most of the regions of highest ground motion are offshore, where the subduction interface is at its shallowest depths, these ground motions are a twofold increase over the 2007 model and warrant investigation and explanation. Figure 17 shows comparisons (between the 2007 and 2023 Alaska NSHMs) of the MFDs of different ERF components within a 200 km radius of Anchorage. Although Figure 9b shows that the rates of M8+ events across the arc are about the same in the 2007 and 2023 models, the rates are quite different when computed with respect to distance from a site. Rates of M9+ events in Figure 17 are the same in the two models, consistent with the paleoseismic record, but the 2023 model includes numerous other M8–9 events. The increase in hazard is also due to geometry changes in the 2023 interface model that bring most interface ruptures closer to Anchorage than they were in 2007. The same is true for intraslab sources, for which the MFD has increased considerably over the 2007 model. The 2023 model implies an M8+ event will occur in the vicinity of Anchorage about once every 133 years.
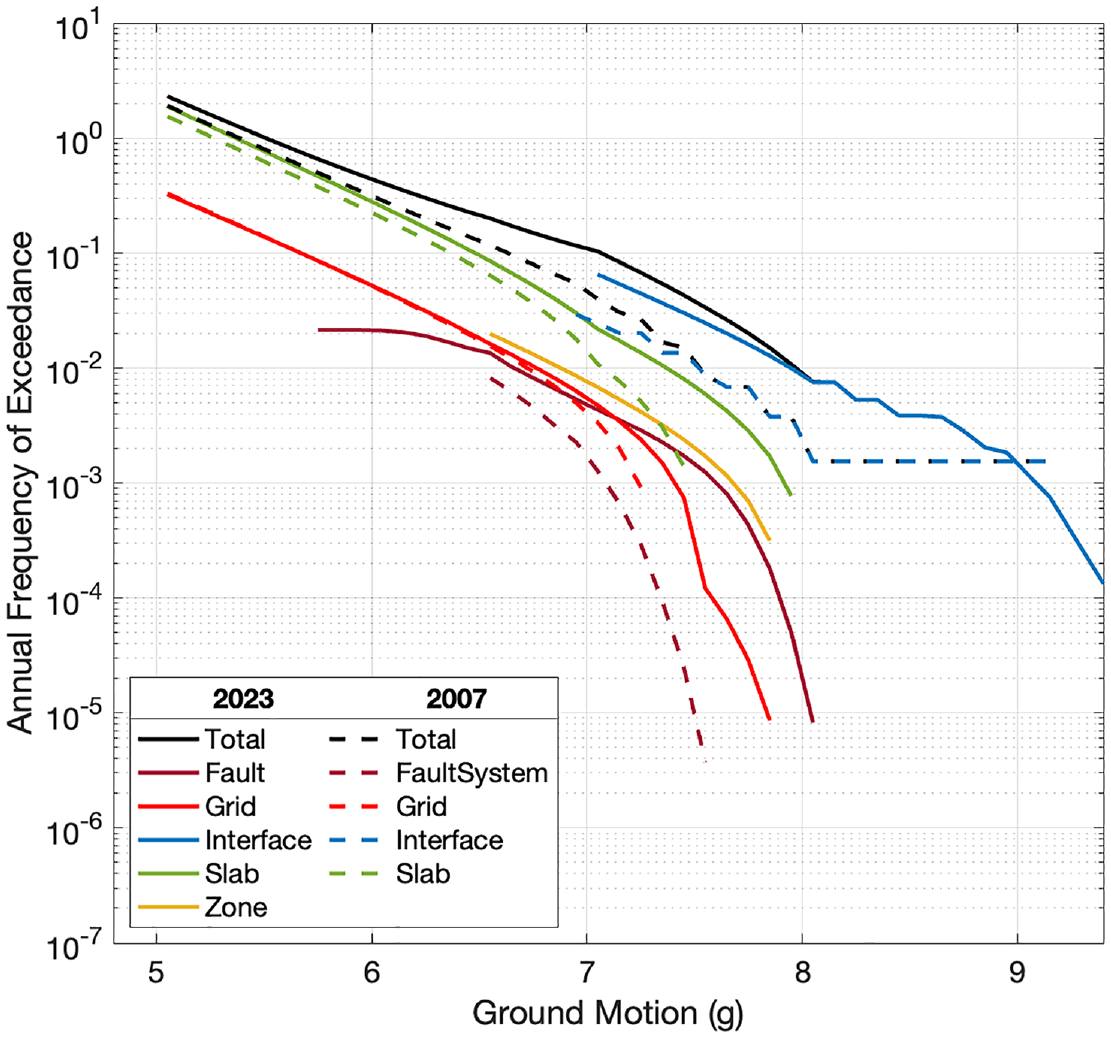
Comparisons of the magnitude–frequency distributions of various earthquake rupture forecast components between the 2007 (dashed) and 2023 (solid) Alaska National Seismic Hazard Models for all ruptures within a 200 km radius of Anchorage.
Consistent with rates shown in Figure 17, disaggregation of 0.2 s SA hazard (Figure 18) shows that the primary contributors to hazard at Anchorage are intraslab and interface earthquakes in both the 2007 and 2023 NSHMs. The newly introduced Cook Inlet source zone also contributes 10% to the 2023 model. As described above, fundamental changes to the representation of gridded seismicity ERF components (crustal, intraslab, and M < 7 interface events) make direct comparisons between the two models difficult. The “Combined” column in the tables of Figure 18 groups ERF components by representation in the model: large-magnitude finite-fault sources of the subduction interface (top row), gridded seismicity source representations of both intraslab and small magnitude interface sources (middle row), and crustal gridded seismicity and zone sources (bottom row). Earthquake rates in the gridded seismicity components of the 2023 ERF have increased due to changes in modeling methodology. The marginally higher catalog rates have been used to set the MFD parameters of the floating M7–8 interface ruptures, and large-magnitude M8+ interface rates have increased in the geologic rate model (Briggs et al., 2024). The geodetic rate model for the interface implies high rates of M8+ events, but only receives 1/6 weight in the subduction interface logic tree.
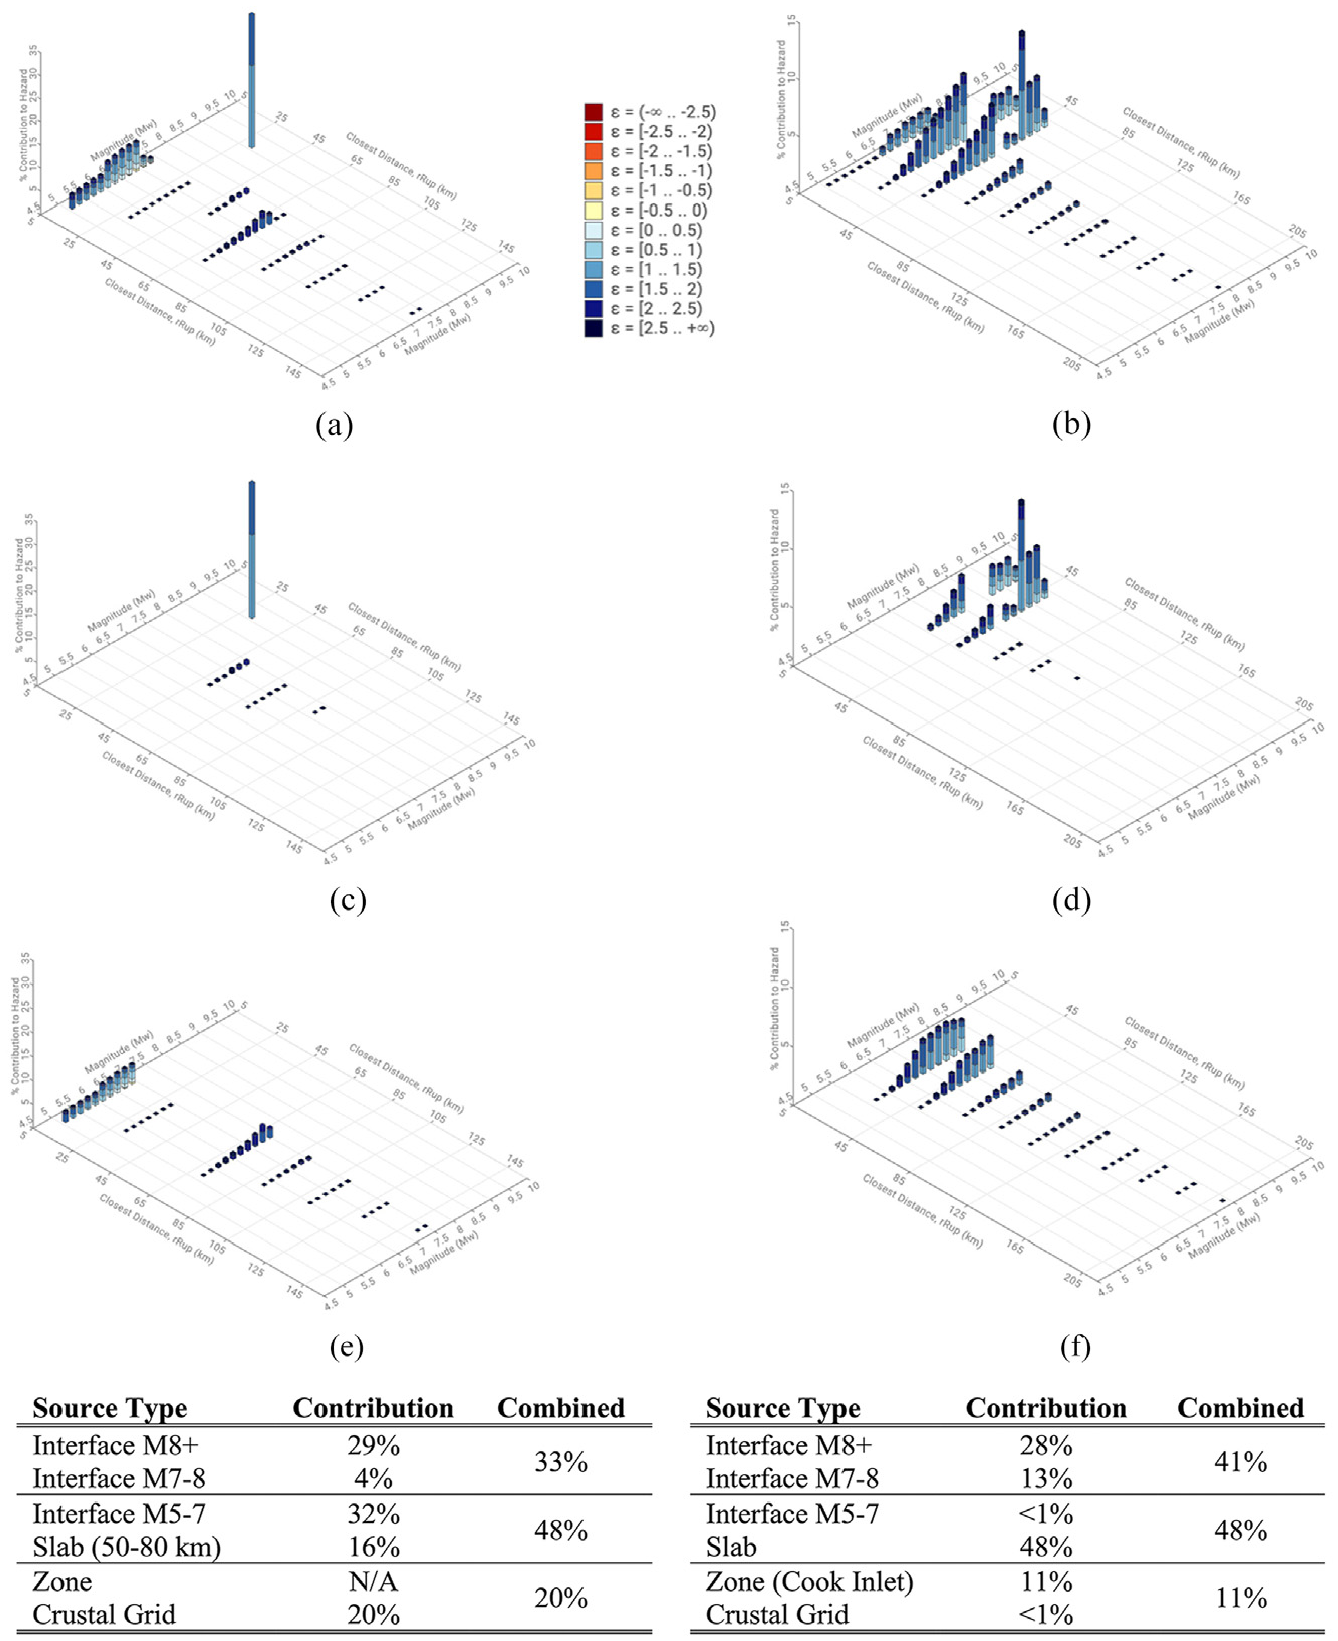
Disaggregation of 2475-year 0.2 s spectral acceleration hazard with time-averaged shear-wave velocity in the upper 30 m (VS30) = 760 m/s at Anchorage for the 2007 (left) and 2023 (right) Alaska National Seismic Hazard Models, with total model, interface, and intraslab disaggregations ordered top to bottom. The tables at the bottom of each column summarize the relative contributions to hazard from different source types, with the “Combined” column showing the summed contributions of similarly modeled source types in the earthquake rupture forecast. Note that the vertical scales in each column are different: (a) 2007 Total Disaggregation; (b) 2023 Total Disaggregation; (c) 2007 Interface (M > 7); (d) 2023 Interface (M > 7); (e) 2007 Interface and Intraslab Gridded Seismicity; (f) 2023 Interface and Intraslab Gridded Seismicity.
Although rate changes are important for understanding the increase in hazard in south-central Alaska, equally important is understanding how that rate is now associated with new GMMs with higher aleatory variability and median models that include logic-tree branches of epistemic uncertainty. Whereas in the 2007 model, the earthquake catalog of events with depths <50 km was used to build the “Interface M5–7” (32% contribution) and “Crustal Grid” (20% contribution) components, in the 2023 model most of that rate is now going into the intraslab model. Moreover, these two source components were both associated with a 2007 logic tree of crustal GMMs, differing only in their source focal mechanism ratios; in the 2023 model this rate is now associated with the NGA-Sub intraslab GMMs. In the 2007 model, intraslab source contributions to hazard were low (16%), due to being based only on catalog events at depths >50 km. Intraslab events at shallower depths are important contributors to hazard and many such events were used to develop the NGA-Sub GMMs, which are applicable down to the
Disaggregation of 2475-year 0.2 s SA hazard at Anchorage also illustrates improvements in the spatial and magnitude distribution of events (Figure 18). In the 2007 NSHM, a singular event represents the total hazard from the subduction interface, with minor contributions from M7–8 floating ruptures. In the 2023 model, the distribution of interface rupture magnitudes is much broader. Although rupture of the Prince William Sound section of the interface still dominates subduction interface hazard, more possible spatial extents and multi-section ruptures are considered. Similarly, the 2023 intraslab source model is consistent with the subducting slab geometry, with the distribution of intraslab events extending to much shallower depths than considered in the 2007 model. This is reflected in the steady decrease in contributions to intraslab hazard with distance. Figure 18, bottom row left, shows the distinct contributions of gridded interface sources at distances of ∼10 km and intraslab sources at distances of ∼70 km for the 2007 model. These contributions to hazard at fixed distances reflects the distinct source depth layers at 10 and 60 km in the 2007 model. In the 2023 disaggregation (Figure 18, bottom row, right), there is a smooth variation and decrease in hazard contribution with distance.
The NGA-Sub models warrant scrutiny as the 2023 Alaska and CONUS NSHMs are among the first large-scale PSHAs to use them. Although the 2007 GMMs are no longer appropriate for use in the Alaska NSHM, we do want to ensure that the switch to new GMMs makes sense in the context of other, more modern GMMs that have received broad adoption in PSHAs for subduction zone settings. We therefore computed 0.2-s hazard for the interface component of the 2007 Alaska ERF at Anchorage using a GMM developed for BC Hydro, the major dam owner in British Colombia (Abrahamson et al., 2016). The BC Hydro GMM for interface sources incorporates features such as site response scaling, large-magnitude scaling breakpoints, and larger standard deviation (0.75 over all spectral periods); it is applied with 1/3 weight in the 2018 CONUS NSHM (Petersen et al., 2020). Figure 19a shows that the 2475-year hazard increases considerably using the older source model with BC Hydro. The larger standard deviation leads to a change in slope of the hazard curve and larger hazard at long return periods. The larger standard deviation in the BC Hydro GMM is well founded based on global datasets (Abrahamson et al., 2016). Of note is that the Sadigh et al. (1997) crustal GMM, which was used with 50% weight at distances of 0–70 km for interface events in the 2007 NSHM, includes magnitude saturation at M8.5, well below the upper limit of rupture magnitudes considered in the 2007 and 2023 Alaska NSHMs.
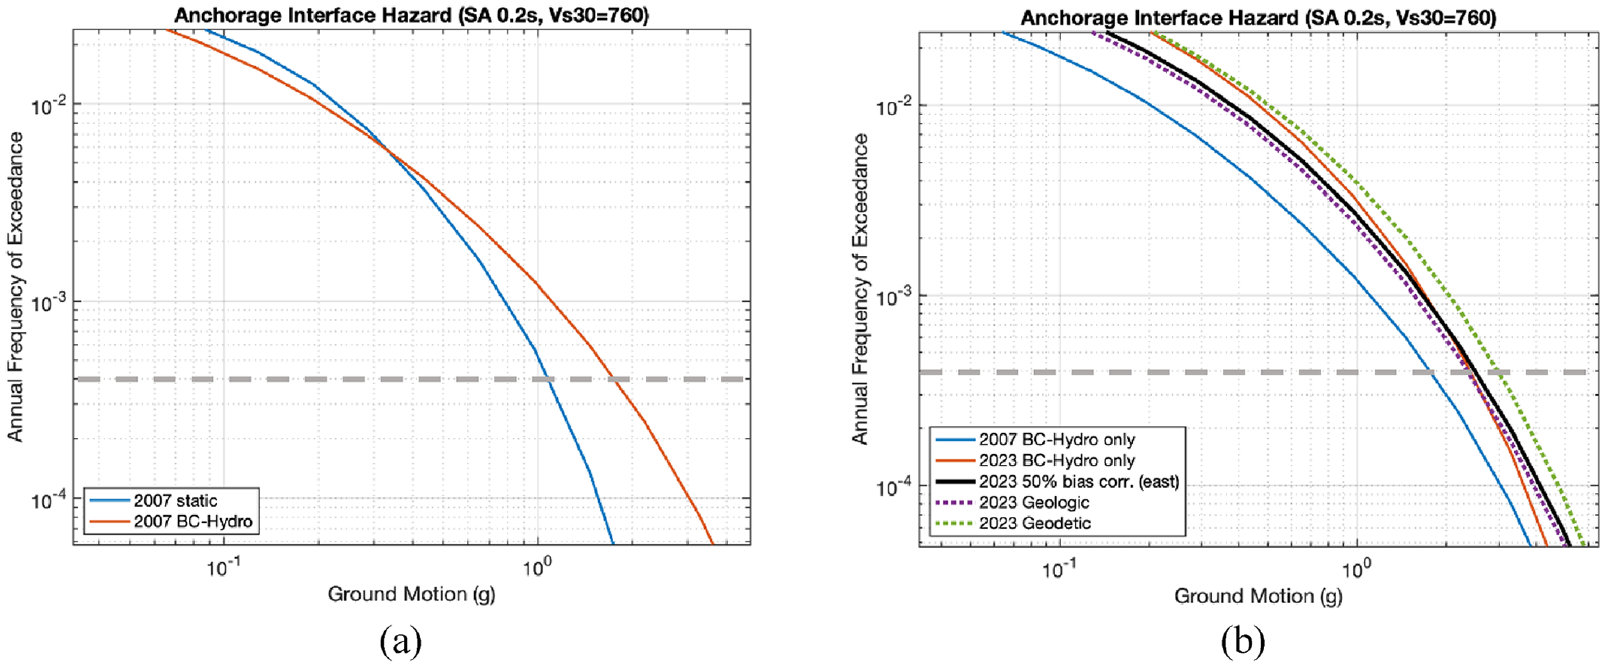
Comparisons of 2007 and 2023 Alaska interface earthquake rupture forecast hazard at 0.2 s spectral acceleration for an Anchorage site. The heavy dashed gray lines mark the 2475-year (2% probability of exceedance in 50 years) return period. (a) Comparison of hazard from the 2007 model using the original ground motion models (GMMs) (blue) to using a GMM developed for BC Hydro (Abrahamson et al., 2016), the major dam owner in British Colombia, with full weight. (b) Comparison of 2007 using BC Hydro (blue) to the 2023 model as implemented. For reference, the 2023 model computed using BC Hydro with full weight is shown in red. The dotted lines show the hazard from the 2023 model if considering only the geologic (purple) or geodetic (green) branch of the interface logic tree.
We also compare the 2007 model using BC Hydro GMM to the 2023 model as implemented (Figure 19b), where the difference (increase) in 2475-year hazard is due to the rate changes in the model discussed previously. For reference, we show the 2023 model interface hazard computed using BC Hydro with full weight (red line in Figure 19b). Note that this 2475-year ground motion is almost identical to that implied by the 2023 GMM logic tree, giving us confidence in the adoption of the NGA-Sub global GMMs for interface sources with and without bias corrections, as recommended by the GMM advisory panel. For reference, we also show the hazard implied by using the geologic (purple) or geodetic (green) branches of the interface ERF logic tree exclusively (dotted lines in Figure 19b). The black line reflects the 80/20 weighting of those two branches.
Probabilistic hazard models are a complex mix of data ingredients, component models, and implementation details and choices that try to faithfully represent a scientifically defensible estimate of the long-term rate of earthquakes and expected shaking therefrom. When single elements of a hazard model change, it is straightforward enough to demonstrate the impact of that change with maps of earthquake hazard at various spectral and return periods. When multiple elements change, however, it is difficult to decompose and describe the cumulative changes observed, and every component of the Alaska hazard model has been updated for 2023. To describe the changes in hazard resulting from this 2023 update, we lay out a series of maps and associated commentary that step through changes to the GMMs followed by changes to the ERF and associated implementation details. The maps are too numerous to be included here and are available as part of electronic supplement ES2 (Supplemental Figures ES2-1 to ES2-8). They accompany the summary of stepwise changes below that guide the reader from the 2007 model up through the 2023 update.
GMM updates
The switch to the NGA-West2 GMMs for crustal sources results in minor increases and decreases relative to the total hazard in the model (Supplemental Figure ES2-1). Increases in short-period ground motion across much of southeast and central Alaska are focused along the Denali and Queen Charlotte–Fairweather systems. Although 2023 GMM medians (Figure 10) are slightly lower, this decrease is offset by higher aleatory variability (Figure 14a). At longer periods, ground motions are consistently lower.
Updates to the subduction intraslab GMMs yield higher near-field ground motions at short periods and minor decreases at long periods (Supplemental Figure ES2-2). Near Anchorage and Cook Inlet, probabilistic ground motions increase by up to 1 g. Although 2007 and 2023 intraslab GMM medians are similar at short periods (Figure 13), the higher ground motions result from higher aleatory variability (Figure 14b) and a broader distribution of epistemic uncertainty (Supplemental Figure ES1-10). At longer periods, higher 2007 medians offset these features of the 2023 GMMs.
The pattern of increases in ground motion over the length of the Alaska–Aleutian arc is similar from updates to the subduction interface GMMs (Supplemental Figure ES2-3), although with substantially higher increases of >3 g. The largest increases are localized offshore at the leading, up-dip edge of the subduction interface where source-to-site distances, RRUP, are very short. Nevertheless, increases in short-period probabilistic hazard of 1–2 g across much of south-central Alaska result from the update of the subduction interface GMMs. At longer spectral periods, lower medians of the 2023 subduction interface GMMs offset the increases in epistemic uncertainty (Supplemental Figure ES1-9) and aleatory variability (Figure 14b). Supplemental Figure ES2-4 shows the total change in hazard due to all the updates of GMM components. As expected, updates to the subduction interface and intraslab GMMs drive the significant increases in hazard across south-central Alaska.
ERF updates
Gridded seismicity
Like the figures for updates to the GMMs, ERF ratio and difference maps show changes relative to the total hazard in the model. In Supplemental Figure ES2-5, there is very little change in hazard along much of the Alaska–Aleutian megathrust because the large-magnitude interface model dominates the hazard at all response-spectral and return periods. For the gridded seismicity models, which include shallow crustal earthquakes, subduction intraslab events (M5–8), and small magnitude earthquakes (M5–7) on the subduction interface, changes in ground motion arise from the new declustering and smoothing methods. The adaptive smoothing method tends to concentrate earthquake rate in areas of high seismicity more so than the fixed kernel smoothing method used exclusively in the 2007 model. This leads to bullseyes of hazard increase and decrease, for example, across the North Slope of Alaska, albeit with low absolute change. Changes in hazard arising from updates to the earthquake catalog and an improved gridded seismicity modeling methodology overwhelm any statewide increase one might expect from the change to using full-catalog rates instead of declustered catalog rates.
The largest increases in hazard at 0.2 s SA from updates to the gridded seismicity models are >1 g at the southwest margin of Cook Inlet. These increases in ground motion arise from the updates to the intraslab model, which include using point-source depths derived from the Slab2 subduction interface model instead of two horizontal depth slices at 60 and 90 km. The NGA-Sub intraslab GMMs are highly sensitive to the depth parameter,
Crustal faults and zone sources
The 2023 Alaska NSHM includes many new crustal fault and area source zones, all of which are marked by increases in ground motion across all response-spectral and return periods (Supplemental Figure ES2-6). At 0.2 s SA, most of the changes are less than 1.5 g and restricted to sites at short distances from or within the hanging wall of the newly introduced faults. New faults in central and northern Alaska with nominal slip rates <<1 mm/year are not slipping fast enough to contribute to hazard over and above that contributed by the gridded seismicity model. Decreased ground motions arise from the removal of the Chatham Strait fault in southeast Alaska. Decreases also exist along the southern Denali, Castle Mountain, and Queen Charlotte faults, whose geologic rates are reduced in the 2023 model. Changes in ground motion along the Queen Charlotte system are also due to the realignment of the fault trace in the 2023 model. Overall, the addition of area source zones with earthquake rates derived from the Elliott and Freymueller (2020) GPS velocity field introduces slight increases in ground motions over the areas spanned by the zones. Note that in the case of the Northern Alaska Range and Pamplona area source zones, geodetic slip rates on the faults bounding and interior to each zone have been reduced to zero to avoid double-counting.
Subduction interface
The rate model for M7–8 floating ruptures on the Aleutian arc increased slightly from 2007 to 2023 (Figure 17), resulting in higher hazard. Also, updated and alternative structural models for the interface increase the footprint of the 2023 floating ruptures on the interface. For instance, much of the increase in hazard south of the up-dip limit of the 2007 interface model and at the east end of the Prince William Sound section is due to the 2023 model having a larger areal extent than the 2007 model (Supplemental Figure ES2-7).
The M8+ subduction interface model produces highly variable changes in ground motion along the strike of the Aleutian arc relative to the 2007 model (Supplemental Figure ES2-7). In the east, where the 2007 Yakataga flat-lying detachment source and the transition fault have been removed/replaced, ground motions are substantially lower. At the western end of the arc, rupture rates of the sections are lower than in the 2007 model, also resulting in decreased ground motions there. Like the M7–8 floating model, the sections of the M8+ interface model extend farther south than the sections of the 2007 model, resulting in the consistent along-strike increase south of the up-dip limit of the 2007 model. The mapping of the 2023 interface sections to depth contours of the Slab2 model result in the interface depth and extent being fairly similar to the 2007 model, and so geometric changes do not contribute much to observed changes in ground motion.
Figure 16 and Supplemental Figure ES2-8 show the total change in hazard between the 2007 and 2023 Alaska NSHMs. Changes to the large-magnitude subduction interface rate and interface GMMs contribute the most to hazard increases across south-central Alaska. These are further increased by additions to the crustal fault model and updates to the intraslab gridded seismicity model and intraslab GMMs in the 2023 NSHM. Notable decreases in hazard in south-central Alaska at all response-spectral and return periods result from removal of the flat-lying Yakataga source and reconfiguration of the offshore transition fault, which was formerly modeled as a large northeast dipping detachment, as a strike-slip fault in shallow oceanic crust. Increases and decreases in interior Alaska arise predominantly from updates to the crustal gridded seismicity model catalog and grid source development methodology.
Case studies
The following paragraphs list those elements of the 2023 model that are driving changes in hazard at the six select sites. For each site, representative hazard curves from both the 2007 and 2023 models are shown in Figure 20. Figure 21 shows the 2% in 50-year uniform-hazard response spectra for a range of site classes at each of the six locations. Table 3 provides a summary of changes at a broad range of sites across the state. For context and comparison, Figure 22 shows the uniform-hazard response spectra at several other high hazard locations from the 2023 50-state update of the NSHM. Although Anchorage, which sits on the hanging wall of the fast-slipping Alaska–Aleutian subduction zone interface, exhibits marginally higher levels of ground shaking across all spectral periods than sites in the western U.S., those levels are much lower than ground motions forecast for the New Madrid, Missouri, site in the stable crust of the central U.S.
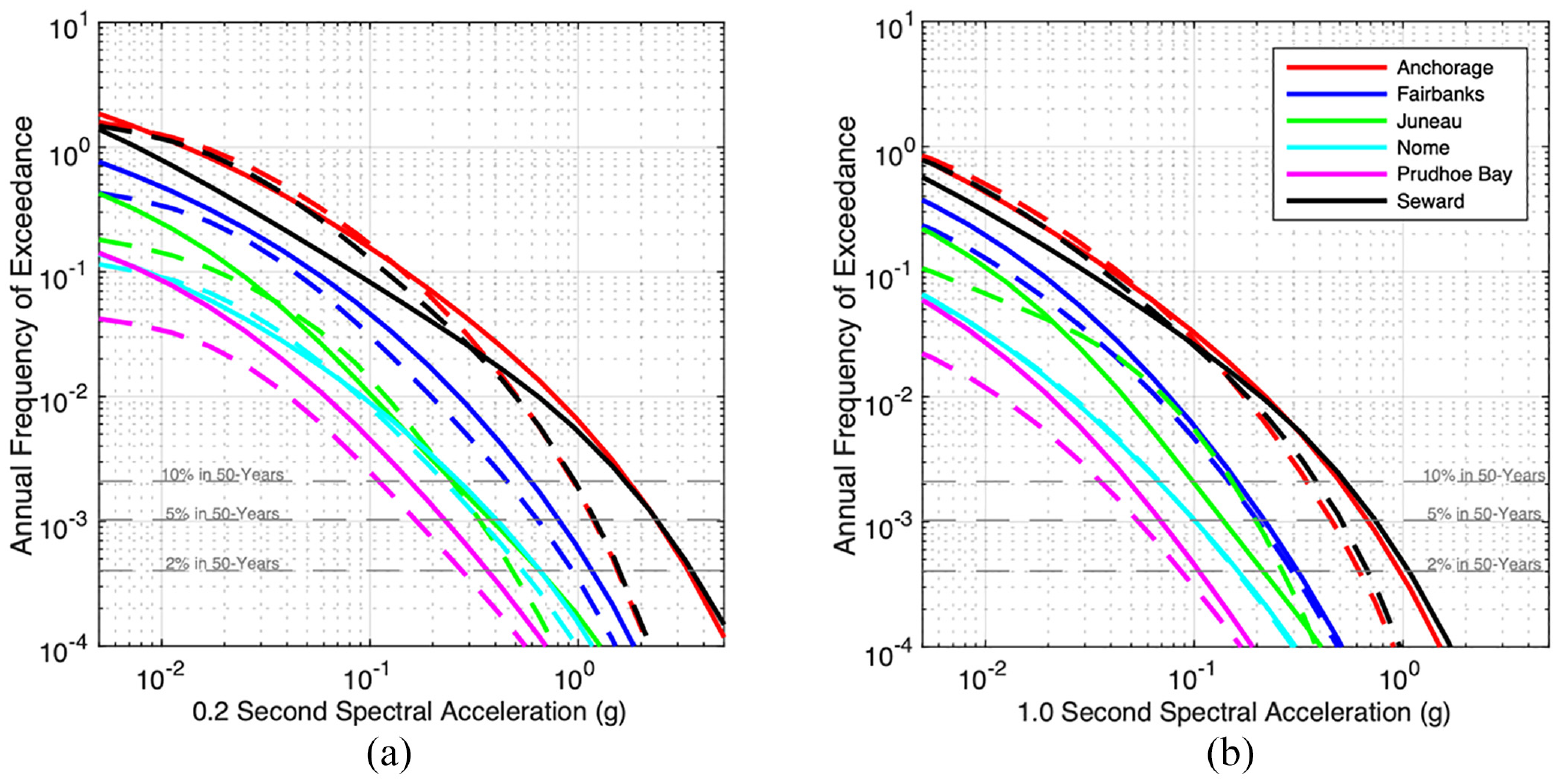
Comparison of (a) 0.2 s and (b) 1 s spectral period total mean hazard between the 2023 (solid lines) and 2007 (dashed lines) Alaska National Seismic Hazard Model at six sites for National Earthquake Hazard Reduction Program Site Class BC (time-averaged shear-wave velocity in the upper 30 m (VS30) = 760 m/s).
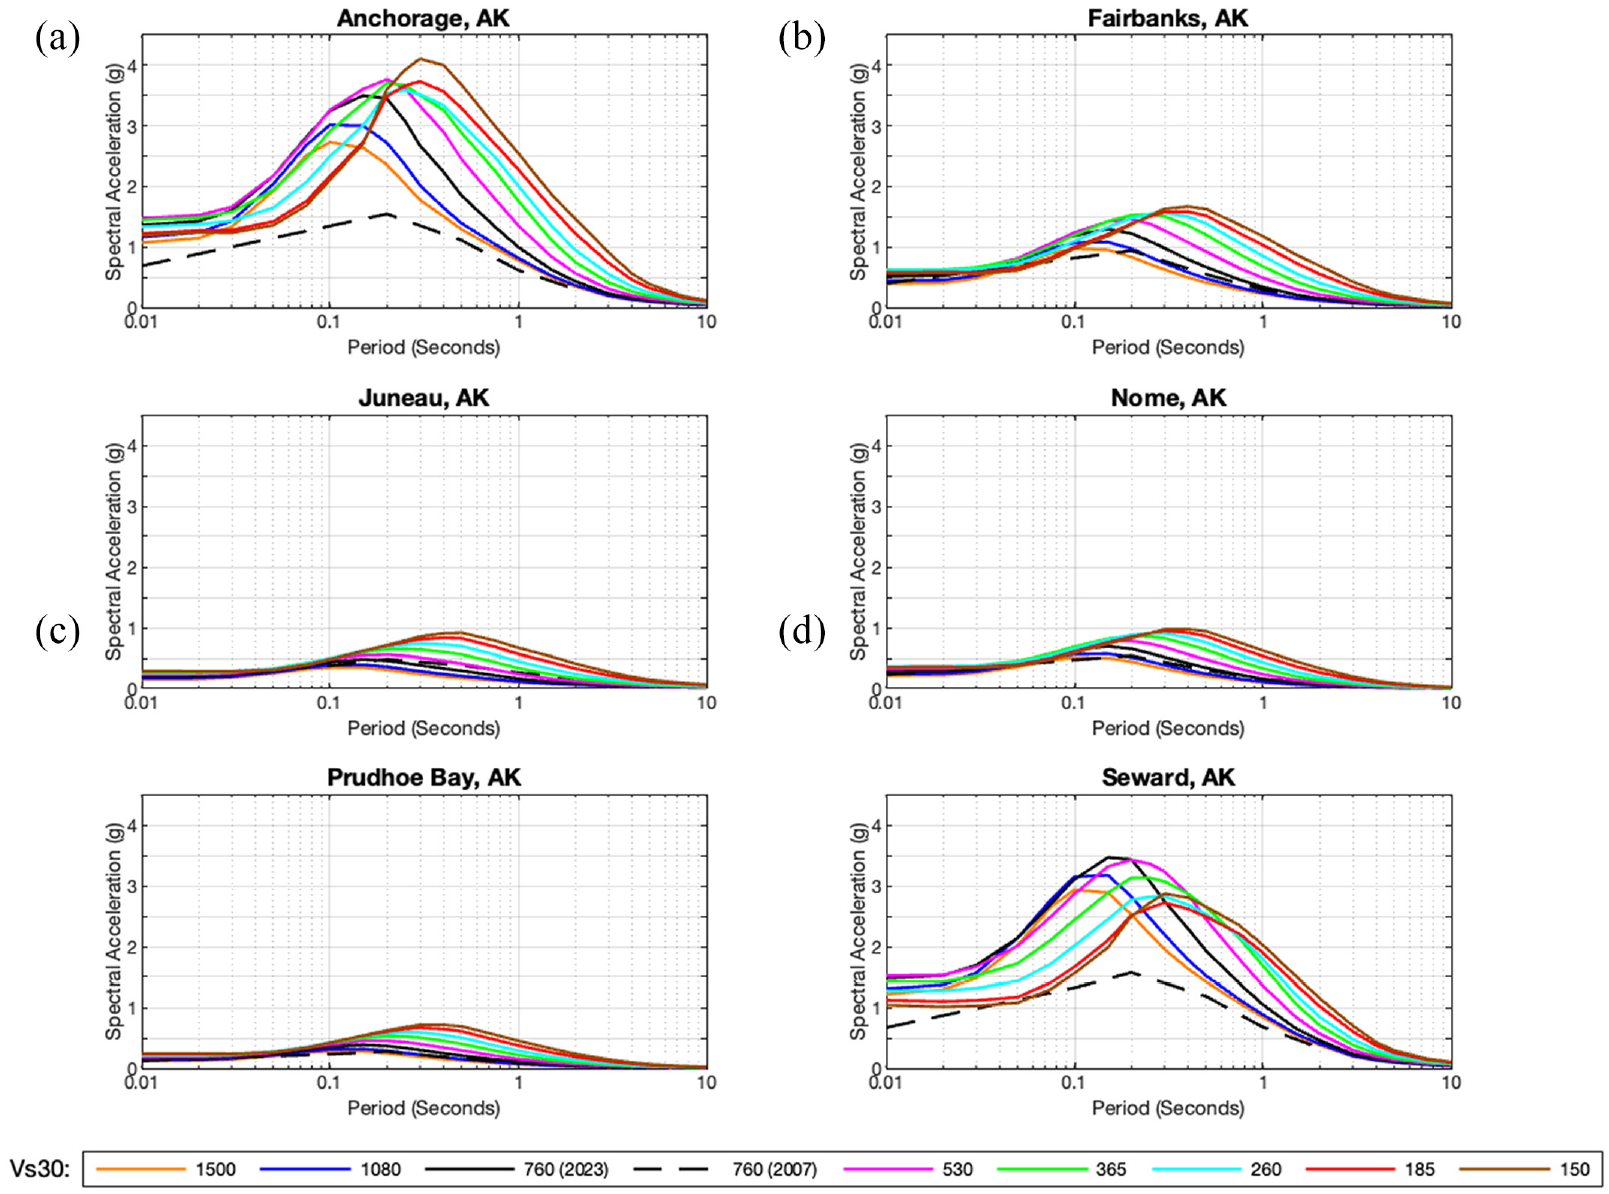
Comparison of uniform-hazard response spectra for six sites in Alaska for a 2% probability of exceedance in 50 years. Values are calculated for National Earthquake Hazard Reduction Program Site Classes B (time-averaged shear-wave velocity in the upper 30 m (VS30) = 1080 m/s), BC (VS30 = 760 m/s), C (VS30 = 530 m/s), CD (VS30 = 365 m/s), D (VS30 = 260 m/s), D/E (VS30 = 185 m/s), and E (VS30 = 150 m/s), as well as site class boundary A/B (VS30 = 1500 m/s). Site Class BC (VS30 = 760 m/s) is shown for the 2023 NSHM (solid black line) and 2007 NSHM (dashed black line).
Changes in hazard at the U.S. Geological survey National Seismic Hazard Model (2023 compared to 2007) test sites for Alaska, for National Earthquake Hazard Reduction Program Site Class BC (time-averaged shear-wave velocity in the upper 30 m (VS30) = 760 m/s)
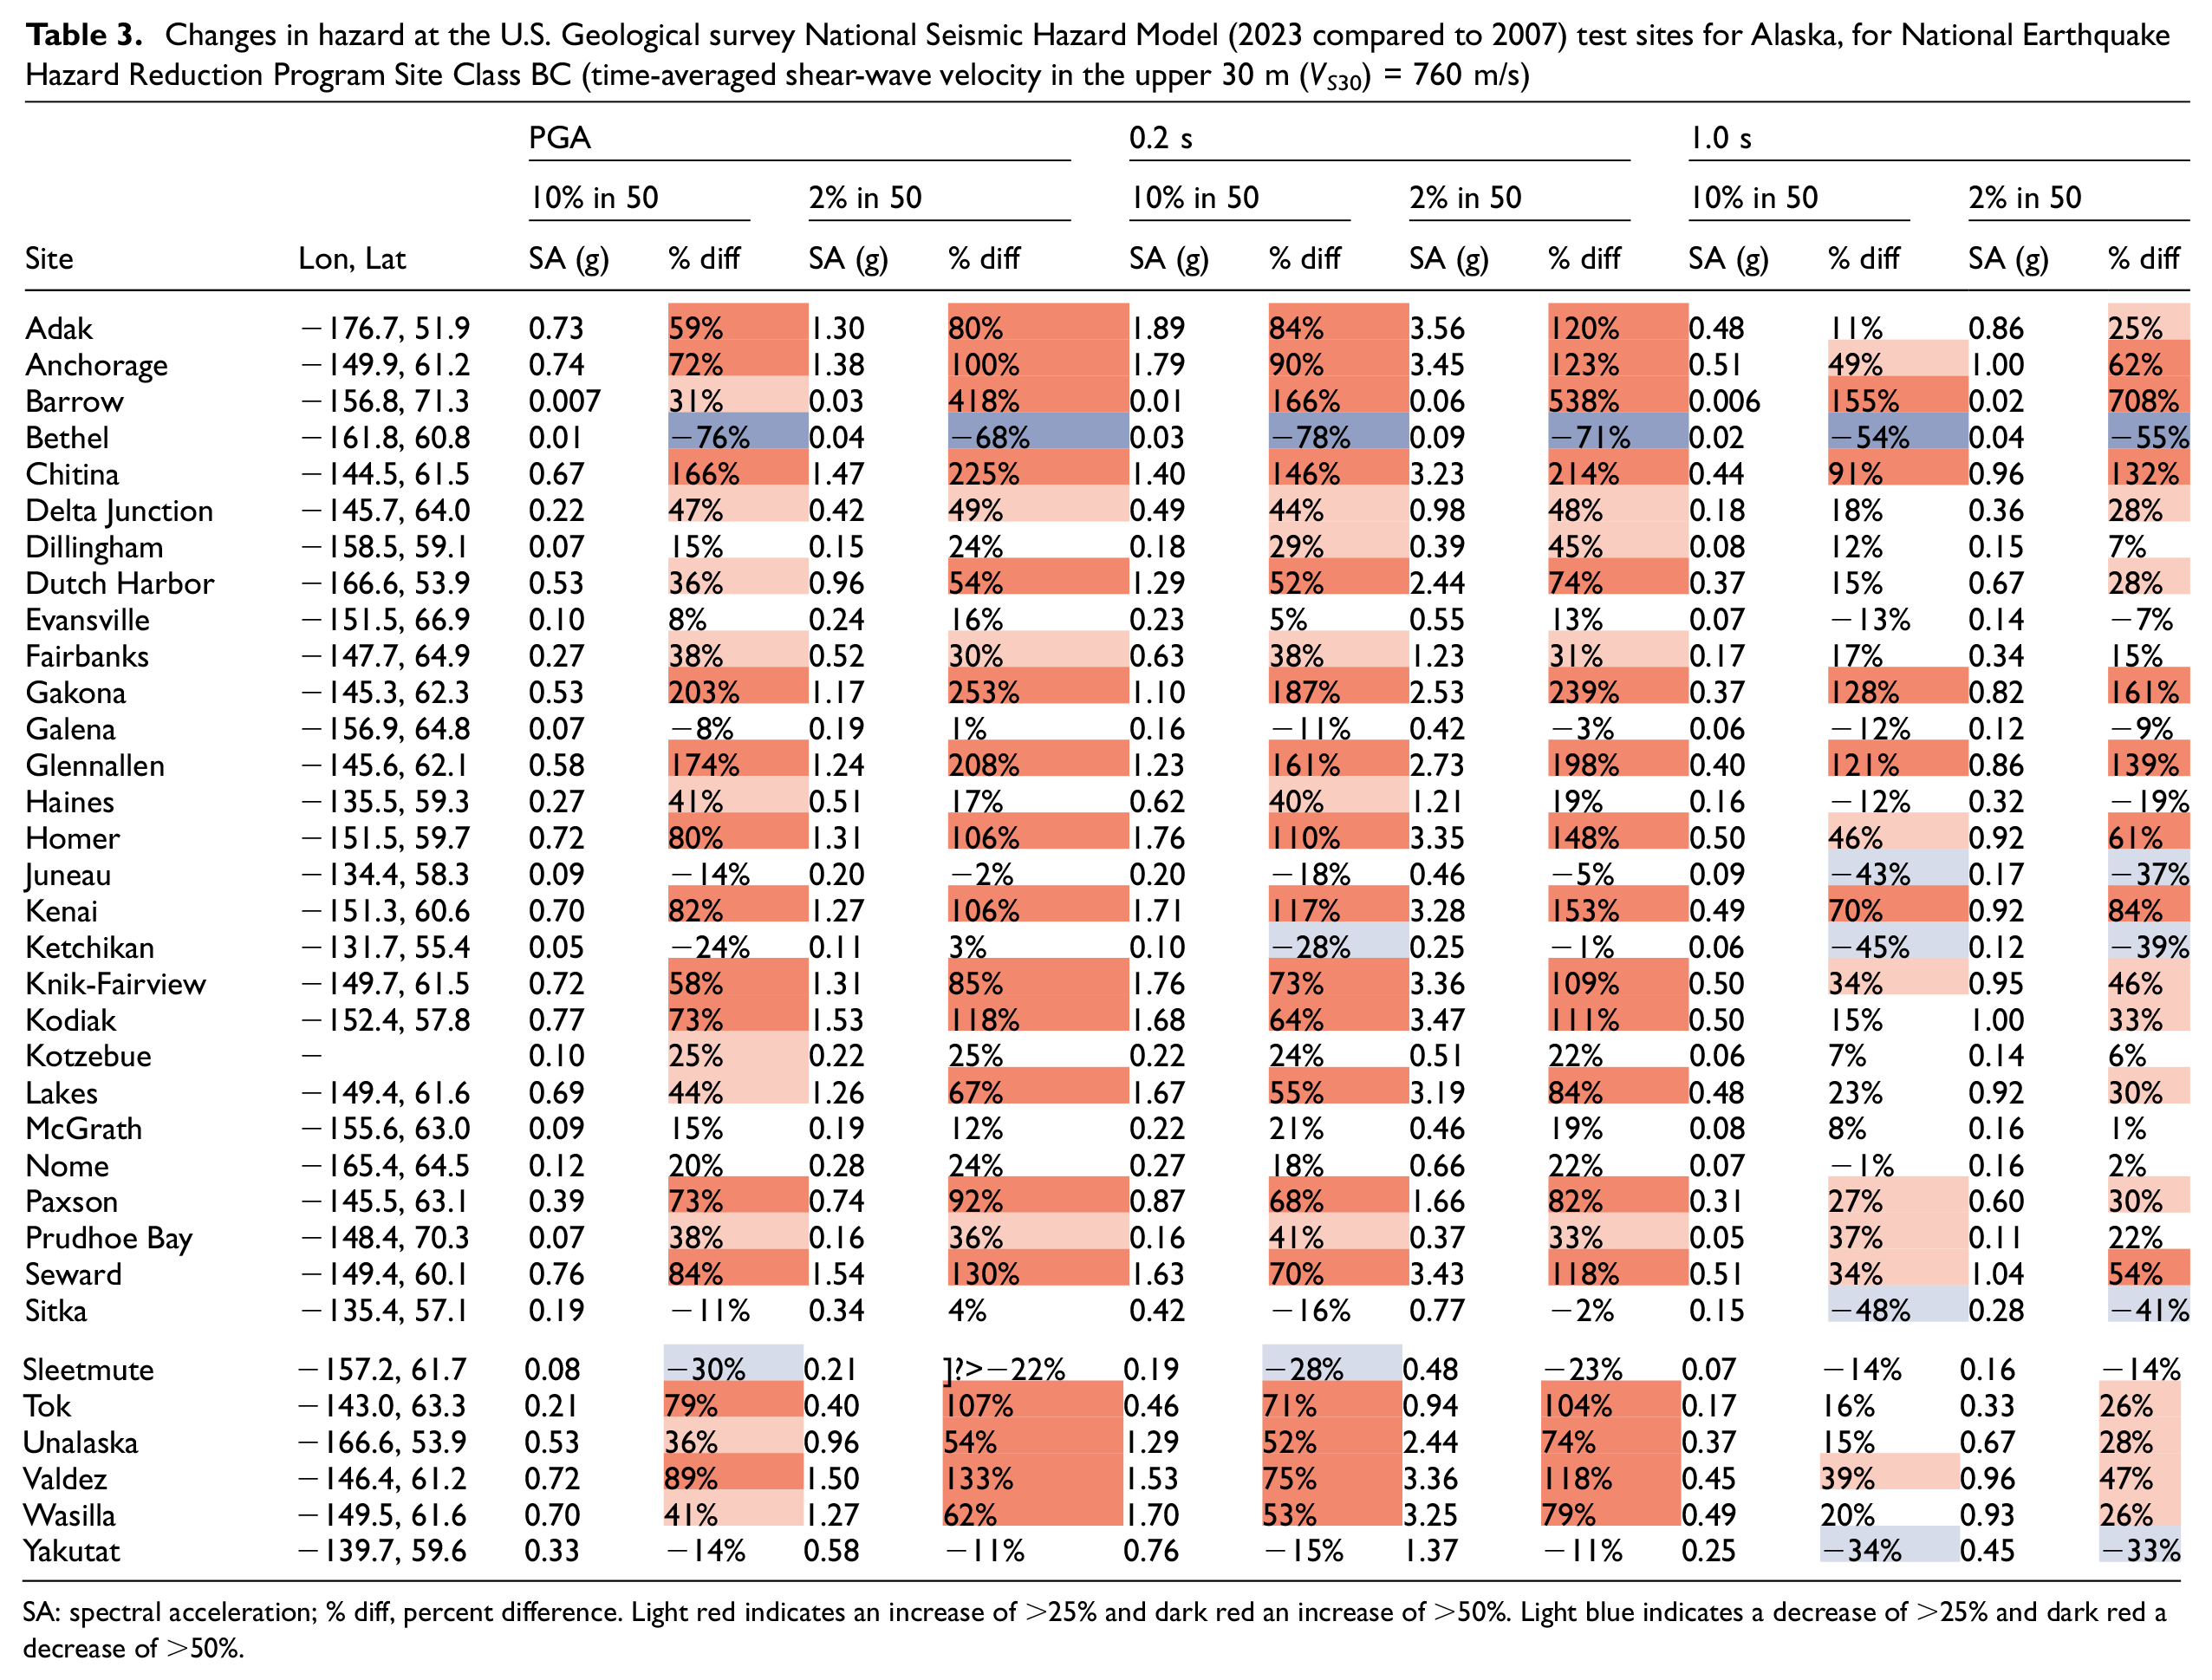
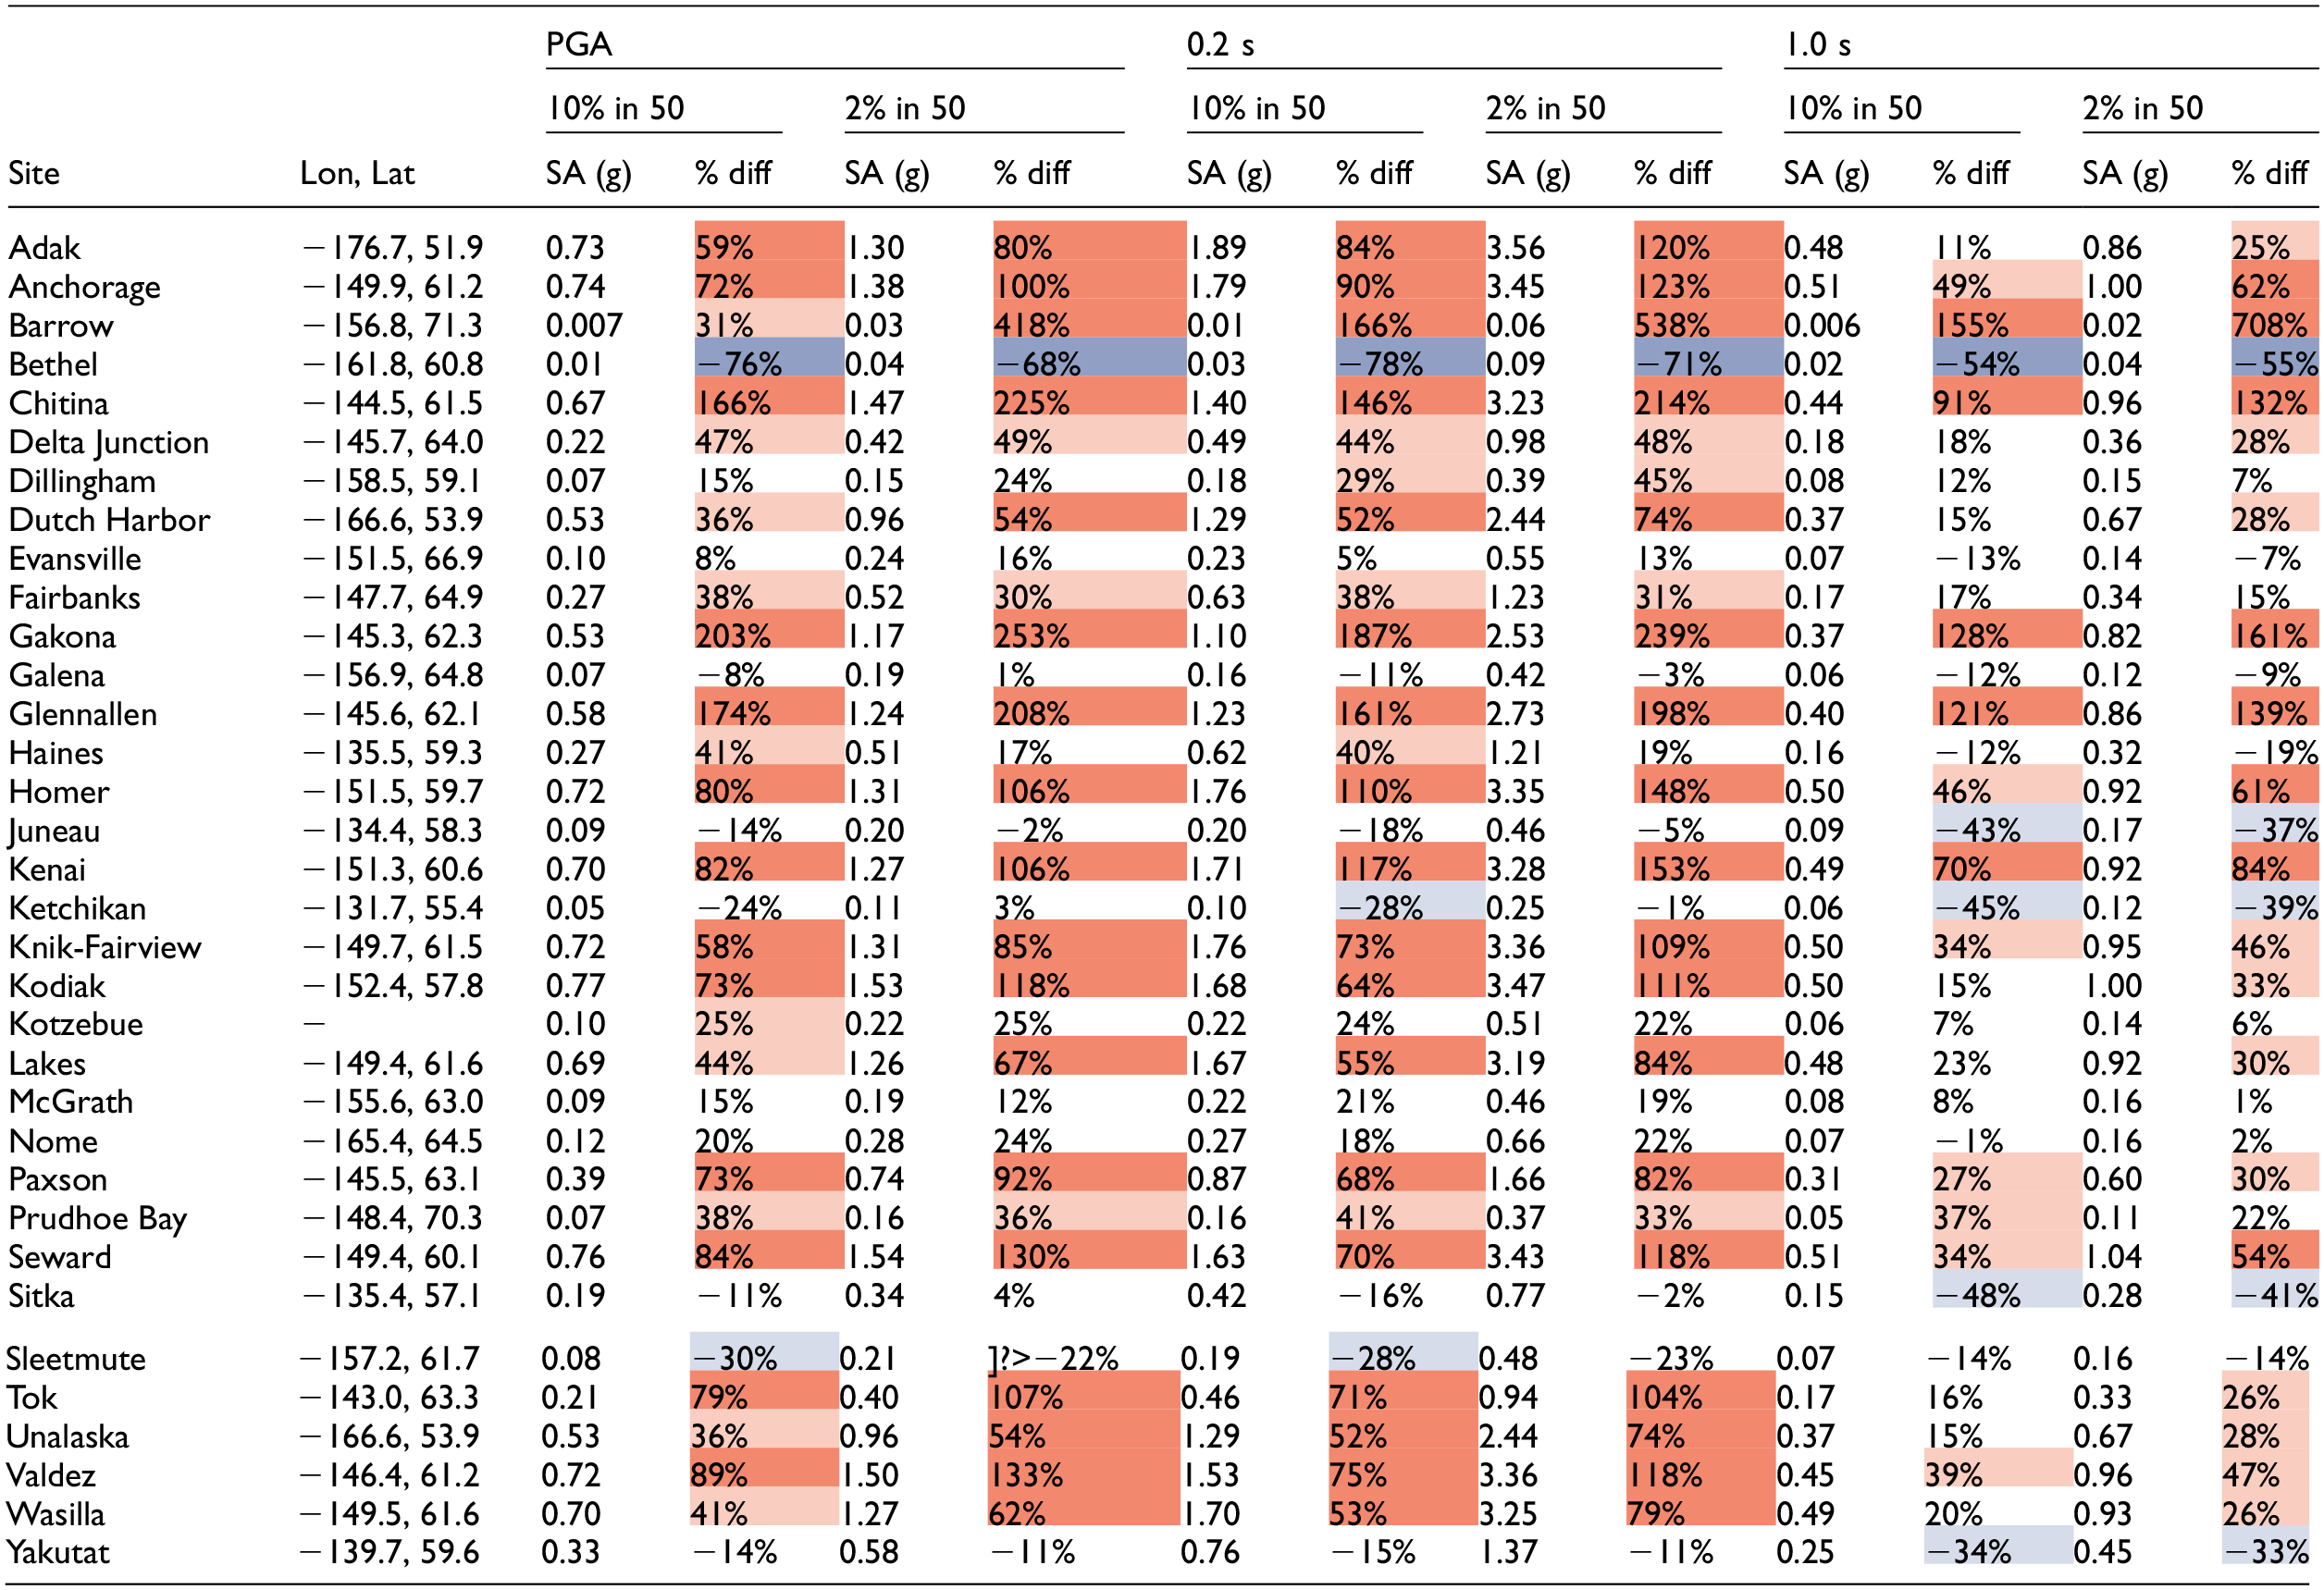
SA: spectral acceleration; % diff, percent difference. Light red indicates an increase of >25% and dark red an increase of >50%. Light blue indicates a decrease of >25% and dark red a decrease of >50%.
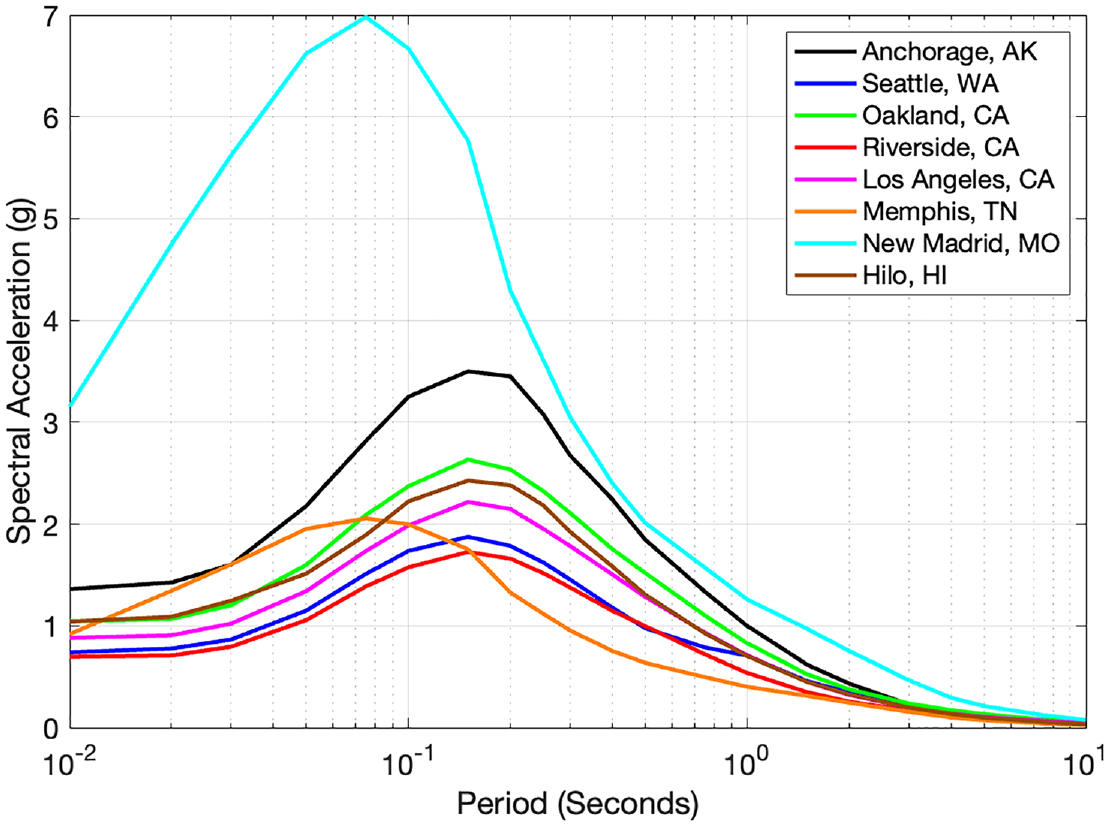
Comparison of uniform-hazard response spectra for Anchorage and five other high hazard sites in the 2023 50-state National Seismic Hazard Model for National Earthquake Hazard Reduction Program Site Class BC (VS30 = 760 m/s). Although the expected accelerations at short spectral periods in Anchorage are high, they are not out of line with other sites in the 2023 model.
Anchorage—Hazard changes (increases) are driven primarily by updates to the subduction interface and intraslab models. These increases are only slightly offset by decreased rate on the nearby Castle Mountain fault. Uniform-hazard response spectra at additional return periods are shown in Supplemental Figure ES1-12. Supplemental Figure ES1-13 shows the comparison of hazard between 2007 and 2023 decomposed by contributing source type.
Fairbanks—Well north of the Denali fault, hazard in Fairbanks is governed largely by the gridded seismicity model and associated changes to the crustal GMMs.
Juneau—The shape of the Juneau hazard curve changed substantially between 2007 and 2003 (Figure 20) that is driven by changes to crustal GMMs on top of source model changes. Although the Chatham Strait fault was removed from the model, it was replaced by the Coast Shear Zone.
Nome—Historically in a low hazard area, any change is Nome are driven by updates to the gridded seismicity model and associated crustal GMMs.
Prudhoe Bay—As a representative example of the North Slope of Alaska where development of critical infrastructure is on the rise, hazard in the region has historically been controlled by the gridded seismicity model. Although addition of the March Creek, Camden Bay, and Kaktovik faults would be expected to increase hazard in northeastern-most Alaska, these faults all have nominal (low) slip rates and, in fact, gridded seismicity rate increases are driving the change in hazard here.
Seward—As in Anchorage, ground motion at Seward increased substantially with adoption of the 2023 Alaska NSHM. Here increases in hazard are driven by updates to the subduction interface and intraslab models and associated GMMs.
Potential future work
Development of the 2023 Alaska NSHM highlighted several areas that warrant further investigation and effort to improve subsequent updates to the model. We have introduced many new earthquake sources represented as gridded seismicity and faults. However, additional sources warrant consideration, such as area source zones in north-central Alaska where there appears to be interseismic strain accumulation (e.g. Canning deformation zone). In addition, developing physics-based fault rupture models for both crustal faults and the subduction interface that allow for multi-fault ruptures would be helpful. We have also introduced new megathrust source models that consider additional recurrence information on large earthquake ruptures. However, it would be beneficial to work toward a better understanding of the strain partitioning of the transform and subduction motions in the Alaskan syntaxis (Figure 5) to better define these models. Although the 2023 model is a time-independent model, a time-dependent version of the model that considers the recent Denali, Great Alaska, and Chignik earthquakes, among others, would be useful. Gridded seismicity modeling could also be improved via refinements to the declustering and smoothing algorithms that more carefully consider the depth distribution of earthquake hypocenters and associated uncertainties, and gridded seismicity rates could be reconsidered for use as a branch in the large-magnitude subduction interface logic tree.
For ground motion modeling, it would be beneficial to have a better understanding of the median and associated aleatory variability and epistemic uncertainties for the NGA-Sub interface and intraslab GMMs, with a focus on developing models specific to south-central Alaska. Such work could include the use of three-dimensional simulations and examining ground motions of smaller magnitude events to better understand site effects. Slab-guided waves and gradients between fore-arc and back-arc shaking appear important in the region (Cramer et al., 2021; Moschetti et al., 2020). Perhaps the most glaring deficiency of the current effort is the relatively sparse amount of actual ground motion data collected near large earthquakes along the megathrust in southern Alaska and the Aleutians. The data for the relevant GMMs could be obtained through long-term monitoring with the installation and maintenance of additional instrumentation.
In addition, we recognize that we have not accounted for local deep sedimentary basin site amplification models in this 2023 update, which could influence long-period shaking levels in the vicinity of the Anchorage and Cook Inlet basins. Available amplification models apply a proxy VS horizon to assess the amplification level (e.g. Z1.0 for the depth to the 1.0 km/s shear-wave velocity horizon). Another topic that arose during discussions with the GMM expert advisory team was the physical basis for the use of
Summary
The 2023 Alaska NSHM aggregates new data on crustal faults, the Alaska–Aleutian interface, earthquake catalogs, and new GMMs in a time-independent (or long-term) model of probabilistic seismic hazard. New, previously unaccounted-for fault sources increase hazard relative to the 2007 NSHM. An updated subduction interface segmentation and rate model, with notably increased rates of large M8+ events, contributes to broad increases in hazard across and north of the Aleutian arc into central Alaska, except where there are reductions along the fast-slipping Denali–Totschunda–Fairweather–Queen Charlotte strike-slip fault system. The GMMs adopted in the 2023 Alaska NSHM for subduction and active-crustal tectonic settings imply higher ground motions at short periods. For subduction GMMs, the effects of higher median ground motions are bolstered by substantially increased values of aleatory variability (sigma) relative to the 2007 subduction GMMs. At long periods and large distances, all GMMs are lower than their 2007 counterparts, giving rise to broad areas of decreased hazard in the far field of the high-rate earthquake sources in Alaska.
Supplemental Material
sj-pdf-1-eqs-10.1177_87552930241266741 – Supplemental material for The 2023 Alaska National Seismic Hazard Model
Supplemental material, sj-pdf-1-eqs-10.1177_87552930241266741 for The 2023 Alaska National Seismic Hazard Model by Peter M Powers, Jason M Altekruse, Andrea L Llenos, Andy J Michael, Kirstie L Haynie, Peter J Haeussler, Adrian M Bender, Sanaz Rezaeian, Morgan P Moschetti, James A Smith, Richard W Briggs, Robert C Witter, Charles S Mueller, Yuehua Zeng, Demi L Girot, Julie A Herrick, Allison M Shumway and Mark D Petersen in Earthquake Spectra
Supplemental Material
sj-pdf-2-eqs-10.1177_87552930241266741 – Supplemental material for The 2023 Alaska National Seismic Hazard Model
Supplemental material, sj-pdf-2-eqs-10.1177_87552930241266741 for The 2023 Alaska National Seismic Hazard Model by Peter M Powers, Jason M Altekruse, Andrea L Llenos, Andy J Michael, Kirstie L Haynie, Peter J Haeussler, Adrian M Bender, Sanaz Rezaeian, Morgan P Moschetti, James A Smith, Richard W Briggs, Robert C Witter, Charles S Mueller, Yuehua Zeng, Demi L Girot, Julie A Herrick, Allison M Shumway and Mark D Petersen in Earthquake Spectra
Supplemental Material
sj-pdf-3-eqs-10.1177_87552930241266741 – Supplemental material for The 2023 Alaska National Seismic Hazard Model
Supplemental material, sj-pdf-3-eqs-10.1177_87552930241266741 for The 2023 Alaska National Seismic Hazard Model by Peter M Powers, Jason M Altekruse, Andrea L Llenos, Andy J Michael, Kirstie L Haynie, Peter J Haeussler, Adrian M Bender, Sanaz Rezaeian, Morgan P Moschetti, James A Smith, Richard W Briggs, Robert C Witter, Charles S Mueller, Yuehua Zeng, Demi L Girot, Julie A Herrick, Allison M Shumway and Mark D Petersen in Earthquake Spectra
Footnotes
Acknowledgements
The authors thank the USGS Earthquake Hazards Program for funding the development of the 2023 Alaska NSHM (and recognize the additional congressional direction and funding that made this effort possible), the NSHM Steering Committee for providing helpful input in developing the 2023 NSHM, and the numerous ERF and GMM developers with whom we communicated during the development, including (but not limited to) Jeff Freymueller, Rick Koehler, Danny Brothers, and Bruce Shaw. Special thanks are due to the expert review panel: Mike West (chair), Norm Abrahamson, John Adams, John Thorley, Rob Wesson, and Ivan Wong, who were instrumental in reviewing the model and guiding it though its final stages of development. They also thank the members of the GMM advisory team, who provided guidance to the USGS on challenging issues related to use of the NGA-Sub GMMs: Norm Abrahamson (chair), Jon Stewart, Grace Parker, Ken Campbell, Yousef Bozorgnia, Nick Gregor, Mike West, and Ivan Wong. The model and manuscript also benefited from the thoughtful review that Marco Pagani provided for Earthquake Spectra. Any use of trade, firm, or product names is for descriptive purposes only and does not imply endorsement by the U.S. Government.
Declaration of conflicting interests
The author(s) declared no potential conflicts of interest with respect to the research, authorship, and/or publication of this article.
Funding
The author(s) disclosed receipt of the following financial support for the research, authorship, and/or publication of this article: The authors wish to thank the USGS Earthquake Hazards Program for funding the development of the 2023 50-State NSHM.
ORCID iDs
Data and Resources
Three electronic supplements are provided with this manuscript: (ES1) contains additional figures and one table referenced in this article; (ES2) is a collection of ratio and difference maps (Supplemental Figures ES2-1 to ES2-8) that document all the changes in hazard implied by the 2023 Alaska NSHM and that is also referenced in this article; and (ES3) contains the timeline of model review and publication, the 2023 Alaska NSHM review panel summary statement, the summary of GMM advisory team recommendations, and the NSHM Steering Committee review statement. The code used to perform PSHA, including GMM calculations that are used to develop many of the figures in this article, is available as part of the nshmp-haz software and associated web services and applications (Powers et al., 2022; https://doi.org/10.5066/P9STF5GK). The version of the model used to develop figures for this paper and initial hazard datasets is available as tag “3.b.7” in the nshm-alaska model repository (Powers and Altekruse, 2024; https://doi.org/10.5066/P961IMZX). Hazard maps and data are available in an accompanying data release (Altekruse et al., 2024; ![]() ).
).
Supplemental material
Supplemental material for this article is available online.
References
Supplementary Material
Please find the following supplemental material available below.
For Open Access articles published under a Creative Commons License, all supplemental material carries the same license as the article it is associated with.
For non-Open Access articles published, all supplemental material carries a non-exclusive license, and permission requests for re-use of supplemental material or any part of supplemental material shall be sent directly to the copyright owner as specified in the copyright notice associated with the article.