
Abstract
Site characterization is a crucial component in assessing seismic hazard, typically involving in situ shear-wave velocity (VS) depth profiling, and measurement of site amplification including site period. Noninvasive methods are ideal for soil sites and become challenging in terms of field logistics and interpretation in more complex geologic settings including rock sites. Multiple noninvasive active- and passive-seismic techniques are applied at 25 seismograph stations across Eastern Canada. It is typically assumed that these stations are installed on hard rock. We investigate which site characterization methods are suitable at rock sites as well as confirm the hard rock assumption by providing VS profiles. Active-source compression-wave refraction and surface wave array techniques consistently provide velocity measurements at rock sites; passive-source array testing is less consistent but it is our most suitable method in constraining the rock VS. Bayesian inversion of Rayleigh wave dispersion curves provides quantitative uncertainty in the rock VS. We succeed in estimating rock VS at 16 stations, with constrained rock VS estimates at 7 stations that are consistent with previous estimates for Precambrian and Paleozoic rock types. The National Building Code of Canada uses solely the time-averaged shear-wave velocity of the upper 30 m (VS30) to classify rock sites. We determine a mean VS30 of ∼ 1600 m/s for 16 Eastern Canada stations; the hard rock assumption is correct (>1500 m/s) but not as hard as often assumed (∼2000 m/s). Mean variability in VS30 is ∼400 m/s and can lead to softer rock classifications, in particular, for Paleozoic rock types with lower average rock VS near the hard/soft rock boundary. Microtremor and earthquake horizontal-to-vertical spectral ratios are obtained and provide site period classifications as an alternative to VS30.
Keywords
Introduction
Measurement of site conditions at seismograph stations is crucial for development of ground motion models (GMMs) and accounting for seismic hazard at local to regional scales. Seismograph stations in Eastern Canada are typically installed without detailed geotechnical or geophysical measurements. Therefore, the in situ shear-wave velocity (VS) depth profile and the time-averaged VS of the upper 30 m (VS30) are not determined. VS30 has been used for decades as a simplified metric to differentiate between site conditions and their associated site amplification (Borcherdt, 1994) and is applied to ergodic models to estimate site-to-reference amplification in developed GMMs. VS30 is calculated using Equation 1
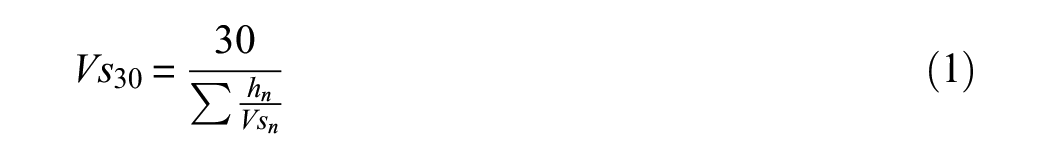
using layer subsurface properties of VS and layer thickness (h) for each layer (n). VS30 was proposed by Borcherdt (1994) for the 1994 National Earthquake Hazard Reduction Program (NEHRP) seismic design guidelines and was adopted for earthquake site classification in the National Building Code of Canada (NBCC) in 2005. More recently, VS30 was adopted by the Canadian Highway and Bridge and Design Code (CHBDC) in 2015. VS30 is used as an indicator of site-to-reference amplification using six Site Classes A–F (Table 1), with the highest Site Class (A) pertaining to the stiffest material (e.g. hard rock) and the lowest classes (E–F) corresponding to the softest material. The sole site classification measure for rock sites is VS30, whereas other stiffness measures such as soil undrained shear strength (Su) or average penetration resistance (N60) are suitable to classify soil sites (Table 1). The 2020 NBCC is including VS30 directly in seismic hazard assessment (Kolaj et al., 2020). The mean VS30 value used to calculate ground motions for Site Classes A and B in the 2020 NBCC is 1600 and 1100 m/s, respectively. The importance of VS30 and its in situ measurement is therefore highly relevant, in particular, for rock sites and Canadian seismic design practice.
Seismic site classification for average properties of the upper 30 m as per 2015 NBCC and 2015 CHBDC
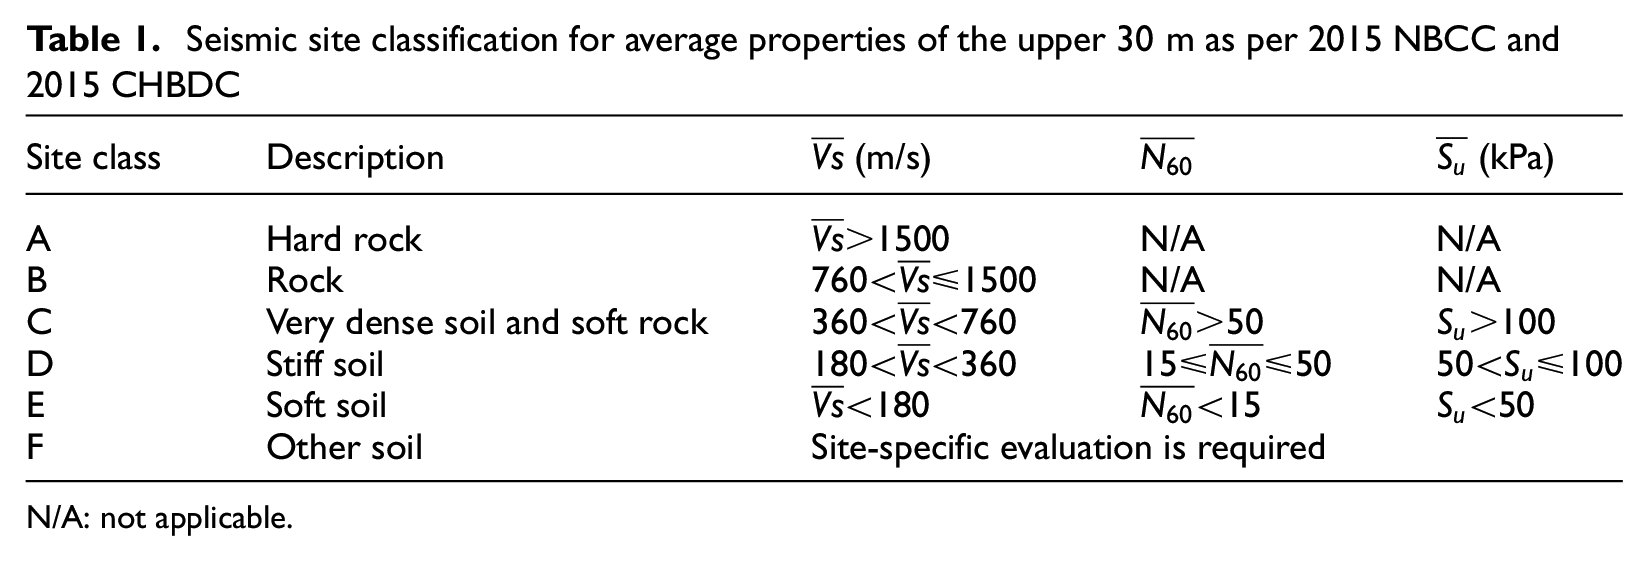
N/A: not applicable.
Earthquake site effects are typically simplified to one-dimensional (1D) site response focused on site de/amplification caused by soil layers over rock (elastic halfspace). However, in reality surface rock sites are known to exhibit site amplification. Weathering and fracturing occur at rock surfaces where the sturdiness and VS of the rock can be overestimated (e.g. Boore and Joyner, 1997; Steidl et al., 1996; Tucker et al., 1984). Increased weathering and fracturing leads to VS reduction of the rock site, which will manifest as broadband or high-frequency site amplification with the shortening of shear wavelengths. In situ testing verifies the VS of the rock site (e.g. hard rock compared with soft rock) through earthquake site characterization. Site characterization can be performed by invasive or noninvasive techniques. Noninvasive seismic methods offer an affordable alternative to acquire a VS profile using body or surface wave techniques at the surface of the measurement location contrary to invasive methods that require rod penetration or drilling of a borehole (e.g. Foti et al., 2017). Noninvasive methods are further differentiated into active-source array methods (e.g. refraction, multichannel analysis of surface waves (MASW)) and passive-source array methods (e.g. ambient vibration array (AVA)). For rock sites, relatively high (30%–40%) variability in VS is expected (i.e. hundreds of meters per second) regardless of the VS profiling method (Garofalo et al., 2016a). Earthquake site characterization of soil sites dominates the scientific literature; there are few studies of earthquake site characterization of rock sites (discussed in the following section) which predominantly are younger and/or softer rock sites compared with older and/or harder rock sites as found throughout Eastern Canada. Our Canadian Shield is the geologic core of North America (Laurentia) and hosts the oldest rocks on Earth. As a gross generalization in the context of Eastern Canada, “soft rock” includes younger (Phanerozoic) and/or sedimentary rock compared with older (Precambrian) and/or crystalline or highly metamorphosed “hard rock.”
Seismograph stations in Eastern Canada are typically placed on outcropping rock in areas of clustered seismicity or around high-consequence infrastructure (e.g. nuclear power plants and hydro-electric dams) to provide clean P- and S-wave arrivals for earthquake detection and location purposes. In situ site characterization is typically not accomplished prior to installation. Seismograph stations in Eastern Canada are assumed to be placed on hard rock within NBCC Site Class A (VS30 > 1500 m/s) and are usually assumed to have a VS30 of ∼2000 m/s (Beresnev and Atkinson, 1997); this VS30∼ 2000 m/s assumption is heavily propagated into the NGA-East station database (Parker et al., 2017). Rock sites pose a challenge in acquiring the proper site characterization in that drilling through rock with invasive methods is not ideal; a 30-m deep hole would cost approximately US$6000 (US$200/m). Noninvasive methods are a less-expensive alternative but have their own challenges including sufficient testing space at surface which often needs to occur away from the station outcrop. We visited 25 seismograph stations in summer and fall 2017 to perform in situ noninvasive site characterization measurements (Ladak et al., 2019) to verify the hard rock assumption (VS30∼ 2000 m/s). A parallel study is also performed in determining seismic kappa at the same stations (Palmer and Atkinson, 2020; supersedes Atkinson, 1996).
The motivation for this study is to improve earthquake site characterization of Canadian National Seismograph Network (CNSN) seismograph stations placed on rock in Eastern Canada and more broadly stations situated in Central Eastern North America (CENA). Having in situ rock VS measurements is crucial for site-specific (non-ergodic) seismic hazard analysis for the safety of high-consequence infrastructure (e.g. hydroelectric dams). In our site characterization, we attempt to determine a VS profile and thereby VS30 site class, a site amplification function using microtremor and earthquake horizontal-to-vertical spectral ratios (MHVSR and EHVSR, respectively), and additional information such as compressional wave velocity (VP), Poisson’s ratio, and geology of the rock the seismograph station is placed on. We also test the effectiveness of noninvasive seismic techniques for site characterization on some of the oldest rocks on Earth and determine improvements that can be made for future studies.
Previous site characterization at rock sites
Few rock sites have been explored for the purpose of earthquake site characterization due to the complexities they impose. Weathering and fracturing of rock occurs in the near-surface and lateral variability is to be expected. This lateral variability is challenging for in situ field surveys, where measurements at some distance from the installed seismometer may not be fully representative of the station’s site conditions. Additional steps need to be taken during the field survey to calibrate measurements as representative of the station. Also, slight variation in the wavenumber is a difficult problem in high-velocity rock because it can lead to significant fluctuation in the measured velocity (Garofalo et al., 2016b). Surface wave generation is also a challenge at rock sites, where a large velocity contrast is needed to generate surface waves at a detectable amplitude (Pileggi et al., 2011). Theoretically, homogeneous competent (hard) rock sites should not produce surface wave dispersion.
Seismograph stations provide an opportunity to validate site characterization methods compared with the observed site response. In Europe, a variety of in situ measures are recommended to characterize seismograph stations including surficial geology, topography/morphology, VS30, seismic κ, and f0 (Seismology and Earthquake Engineering Research Infrastructure Alliance of Europe (SERA), 2019). There have been notable attempts at evaluating site characterization methodologies at rock sites of the French (Hollender et al., 2018), Greek (Stewart et al., 2014), Italian (Felicetta et al., 2017; Foti et al., 2011), and Swiss (Poggi et al., 2017) seismic networks. Surface wave methods to characterize rock sites have had mixed success where some authors have been able to acquire station rock velocities and therefore station VS30 (e.g. Garofalo et al., 2016a; Hollender et al., 2018; Poggi et al., 2017). Some authors have exhibited less success due to two-dimensional (2D) variation (e.g. Michel et al., 2014) and in the use of passive methods at rock sites (e.g. Pileggi et al., 2011). Poggi et al. (2017) used both Love and Rayleigh wave AVA dispersion estimates in a joint inversion with their MHVSRs to determine VS profiles. Hollender et al. (2018) successfully generate Rayleigh and Love wave dispersion curves from AVA and MASW testing, which were jointly inverted with MHVSRs taken at the station. The majority of studies discussed above have measured a VS30 < 1000 m/s corresponding to soft rock conditions (Site Class B) compared with hard rock (Site Class A). Overall, these studies reinforce the use of a multi-method approach (e.g. Martin et al., 2017) incorporating body waves (e.g. refraction) and Love waves (e.g. MASLW) to best characterize rock sites.
The NGA East project (Goulet et al., 2014; Parker et al., 2017) highlighted that only 84 of 1379 (6%) seismograph stations in CENA have a directly measured VS30. The situation is even more dire specific to rock sites, only 18 (1.3%) and 6 (0.4%) stations in the NGA-East database have in situ measured VS30 above 760 m/s (Class B) and 1500 m/s (Class A), respectively. Site characterization at rock sites has been accomplished previously at particular seismograph stations in Canada. Beresnev and Atkinson (1997) performed VS refraction at 11 seismograph stations in southern Ontario to compute theoretical site response; 4 out of 11 stations were situated on rock and the average rock VS of all 11 stations is 2600 m/s. Siddiqqi and Atkinson (2002) determined EHVSR site amplification for a variety of rock stations in Eastern and Western Canada and determined low amplification of 1.1 at 1 Hz, which increased to only 1.2 at 10 Hz (0.1 SD) with instances of regional variability. Similarly, for rock stations in southern Ontario, the average MHVSR (or EHVSR) amplification slightly increases from 1.2 (1.6) at 1 Hz to 1.5 (2.0) at 5 Hz (Murphy and Eaton, 2005; Read et al., 2008). Stations on Precambrian rock (n = 6) have MHVSR (EHVSR) amplification at 5 Hz of 1.5 (1.7), which increases to 1.9 (2.5) at stations on Paleozoic rock (n = 3; Read et al., 2008). One rock station in Alberta was analyzed by Farrugia et al. (2017, 2018) using in situ MHVSR and EHVSR to determine a rock amplification model and concluded that there is some amplification (∼2) above 10 Hz, but the average amplification is ∼1. Braganza et al. (2016) also examined EHVSR amplification for 15 seismograph stations residing on rock in Southern Ontario and Western Quebec. The Braganza et al. (2016) rock amplification model for Ontario is flat (<2) and includes low amplification (∼2) at higher frequencies. Rock VS in Eastern Canada has been compiled as a part of VS30 studies for urban seismic microzonation (e.g. Motazedian et al., 2011; Rosset et al., 2015). Nastev et al. (2016) compiled geophysical and geotechnical data of the St. Lawrence Lowlands to develop a three-dimensional (3D) geologic model. They determined the mean VS30 ± 1 SD of Paleozoic rock to be 1500 ± 500 m/s and Precambrian rock to be 2500 ± 700 m/s (∼700 samples for both units).
Multi-method site characterization approach
A multi-method site characterization approach was employed during two field campaigns in 2017 at 25 CNSN stations across Eastern Canada. The stations were located across multiple provinces in Eastern Canada including Ontario, Quebec, New Brunswick, and Nova Scotia with a focus on stations in Ottawa, Ontario, and the Charlevoix seismic zone (Figure 1), Quebec. These 25 stations have recorded at least 10 magnitude >1.5 earthquakes within 50 km of the station and were therefore selected for site characterization (this study) to update their seismic kappa estimates (Palmer and Atkinson, 2020). A priori information of each station included its geographic coordinates and elevation (Supplemental Table A1) provided by personnel of the Canadian Hazards and Information Service (CHIS) which manages the CNSN stations. Bedrock and surficial geology were determined from available maps. We also include bedrock geologic age to compare with Nastev et al. (2016).
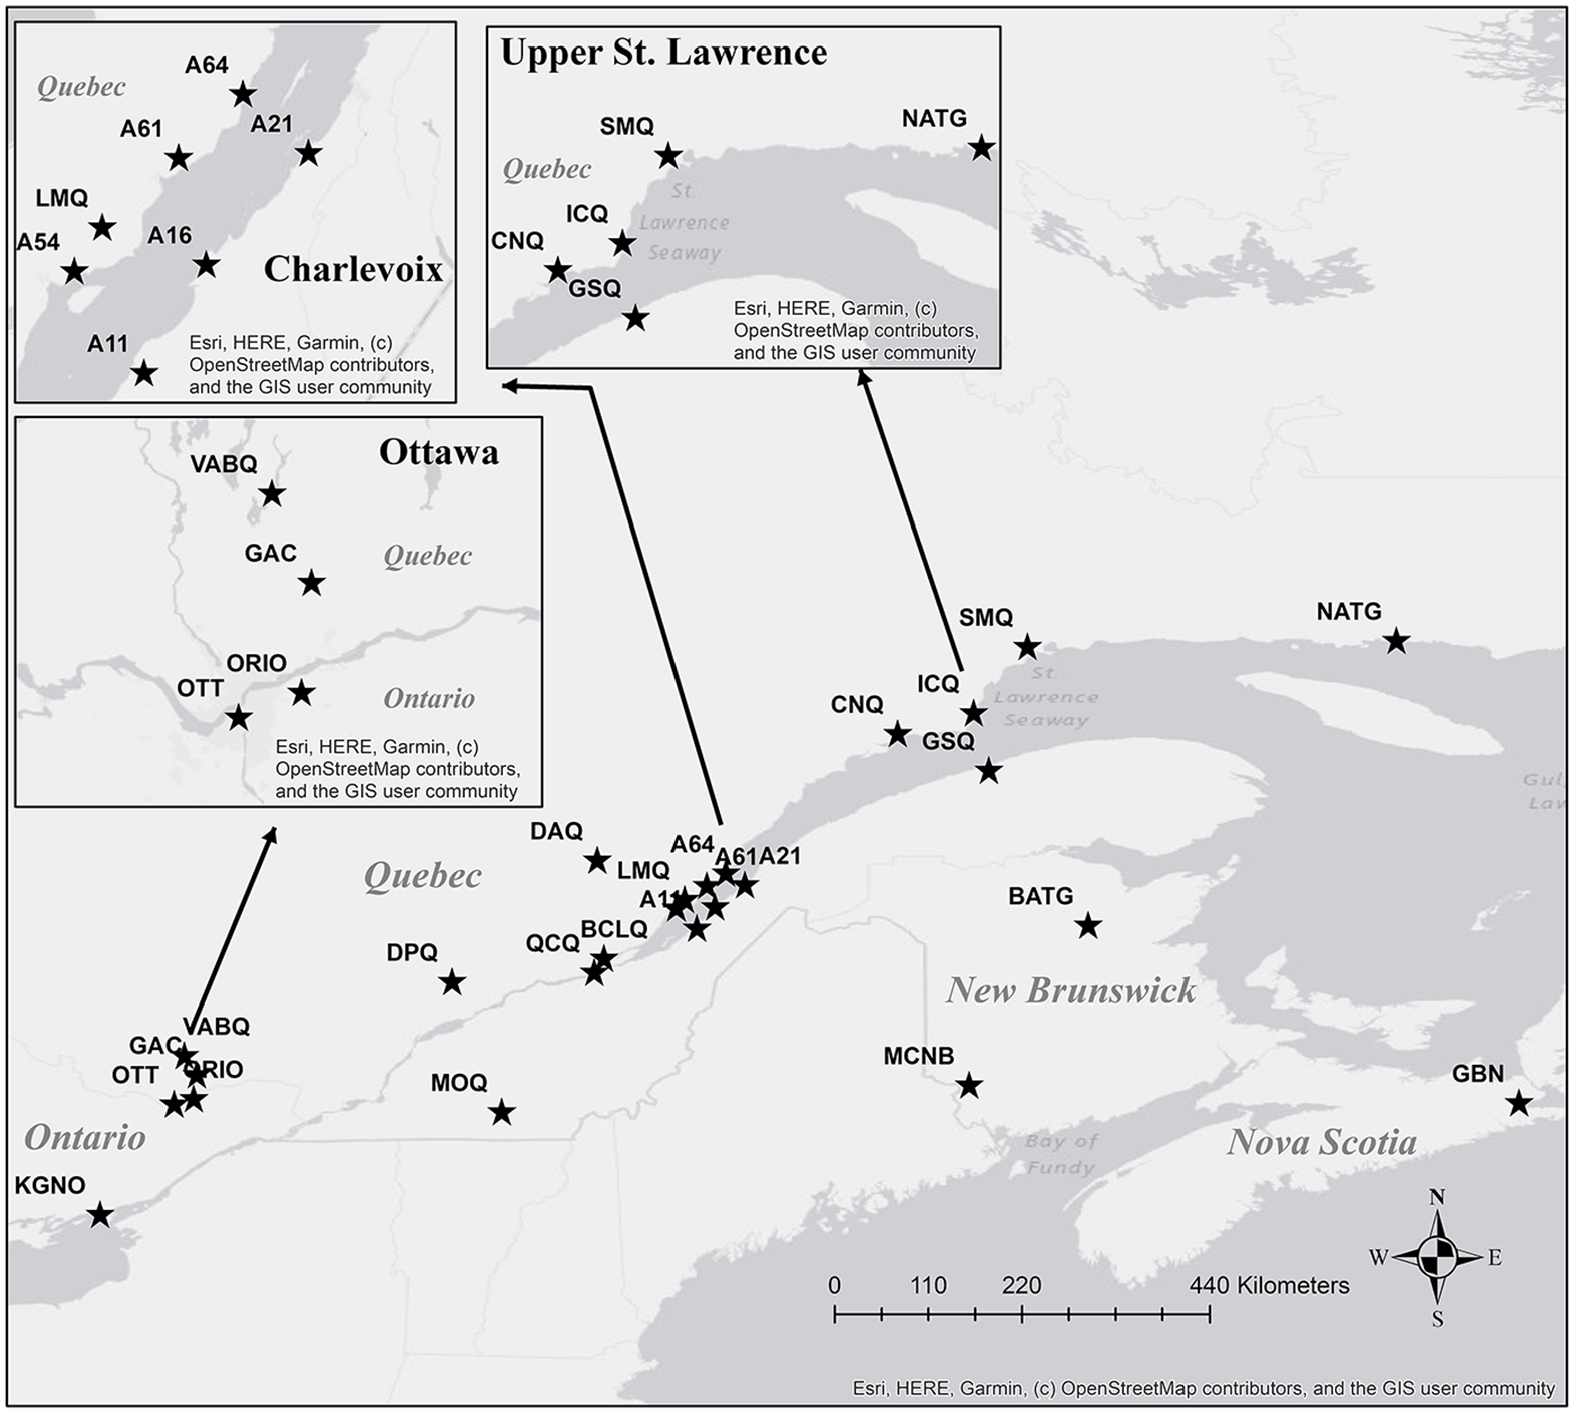
Locations of 25 investigated seismograph stations in Eastern Canada shown by stars; labels identify the station code.
Our multi-method site characterization approach includes determining the HVSR amplification spectrum, VS profile, VP of lithological units, and Poisson’s ratio of the subsurface beneath the station. Surface wave array methods used include active-source MASW and passive-source AVA to obtain dispersion estimates at lower and higher frequencies, respectively; the site dispersion curve is built from combined AVA and MASW testing. We focus on obtaining fundamental-mode Rayleigh surface wave dispersion curves because our MASW testing equipment only includes vertical-component geophones. The site dispersion curve is then inverted for 1D VS profiles to provide estimates of the rock VS. VP refraction was used to acquire rock VP and to constrain dispersion inversions. The availability of having both VS and VP of lithological units enabled the calculation of Poisson’s ratio. Microtremor measurements were performed at each station to calculate the station MHVSR. Earthquake recordings were compiled using the online AutoDRM service of Natural Resources Canada to calculate EHVSRs.
Surface wave inversion is the process of producing theoretical dispersion curves from layered earth models, represented by elastic parameters VP, VS, density, and h, which best represent (fit) the measured dispersion data. This study focuses on the inversion of dispersion curves using two global-search methods. Dinver uses a modified neighborhood algorithm, first developed by Sambridge (1999) and modified by Wathelet (2008). The neighborhood algorithm makes use of Voronoi cells to model the misfit function across the parameter space. Previously generated samples guide the search for improved models through the direct search method to optimize the misfit. The Probabilistic Shear-Wave Velocity Profiling (PSWP) inversion program developed by Molnar et al. (2010) uses a Bayesian inversion scheme that describes the inverse problem in terms of the posterior probability density (PPD) of a defined model’s parameterization (Dosso, 2002; Tarantola, 1987). The most appropriate parameterization is determined by the Bayesian information criterion (BIC) based on misfit, but also applies a penalty for the number of parameters. The PPD is defined for a given parameterization as the likelihood multiplied by prior knowledge divided by the evidence. Markov chain Monte Carlo (MCMC) methods are used with an implementation of Metropolis–Hastings sampling to provide an unbiased sample from the PPD to compute parameter uncertainties and interrelationships. PSWP is used to obtain the mean VS profile with quantitative uncertainty computed as 66% and 95% highest probability density (HPD) credibility intervals.
Our aim is to acquire reliable velocity measurements of the shallow rock beneath the station using multiple noninvasive active and passive seismic techniques to test the hard rock assumption (VS30∼ 2000 m/s) of the seismograph station. Most seismographs are installed on outcropping rock; some are installed on the rock surface in the basement of buildings or seismic vaults (Supplemental Table A1). Seismic arrays for dispersion and refraction measurements require an open area for testing. Hence, in most cases, our survey locations could not coincide with the installed seismograph. We typically performed the seismic arrays in open areas within tens of meters on soil or rock (the same underlying rock as the station), or hundreds of meters away (in a few cases) to ensure that the underlying rock is representative of the rock below the seismograph. In contrast, single-station MHVSR measurements were suitable at, on the same concrete pad, or beside the seismograph. Due to varying seismograph station conditions and environmental surroundings, in situ field methods were adapted for optimal data acquisition. Table 2 summarizes the field tests performed and their details for each seismograph station. Ladak (2020) contains maps of field test locations relative to station locations.
List of seismograph stations and details of in situ noninvasive testing accomplished at each station
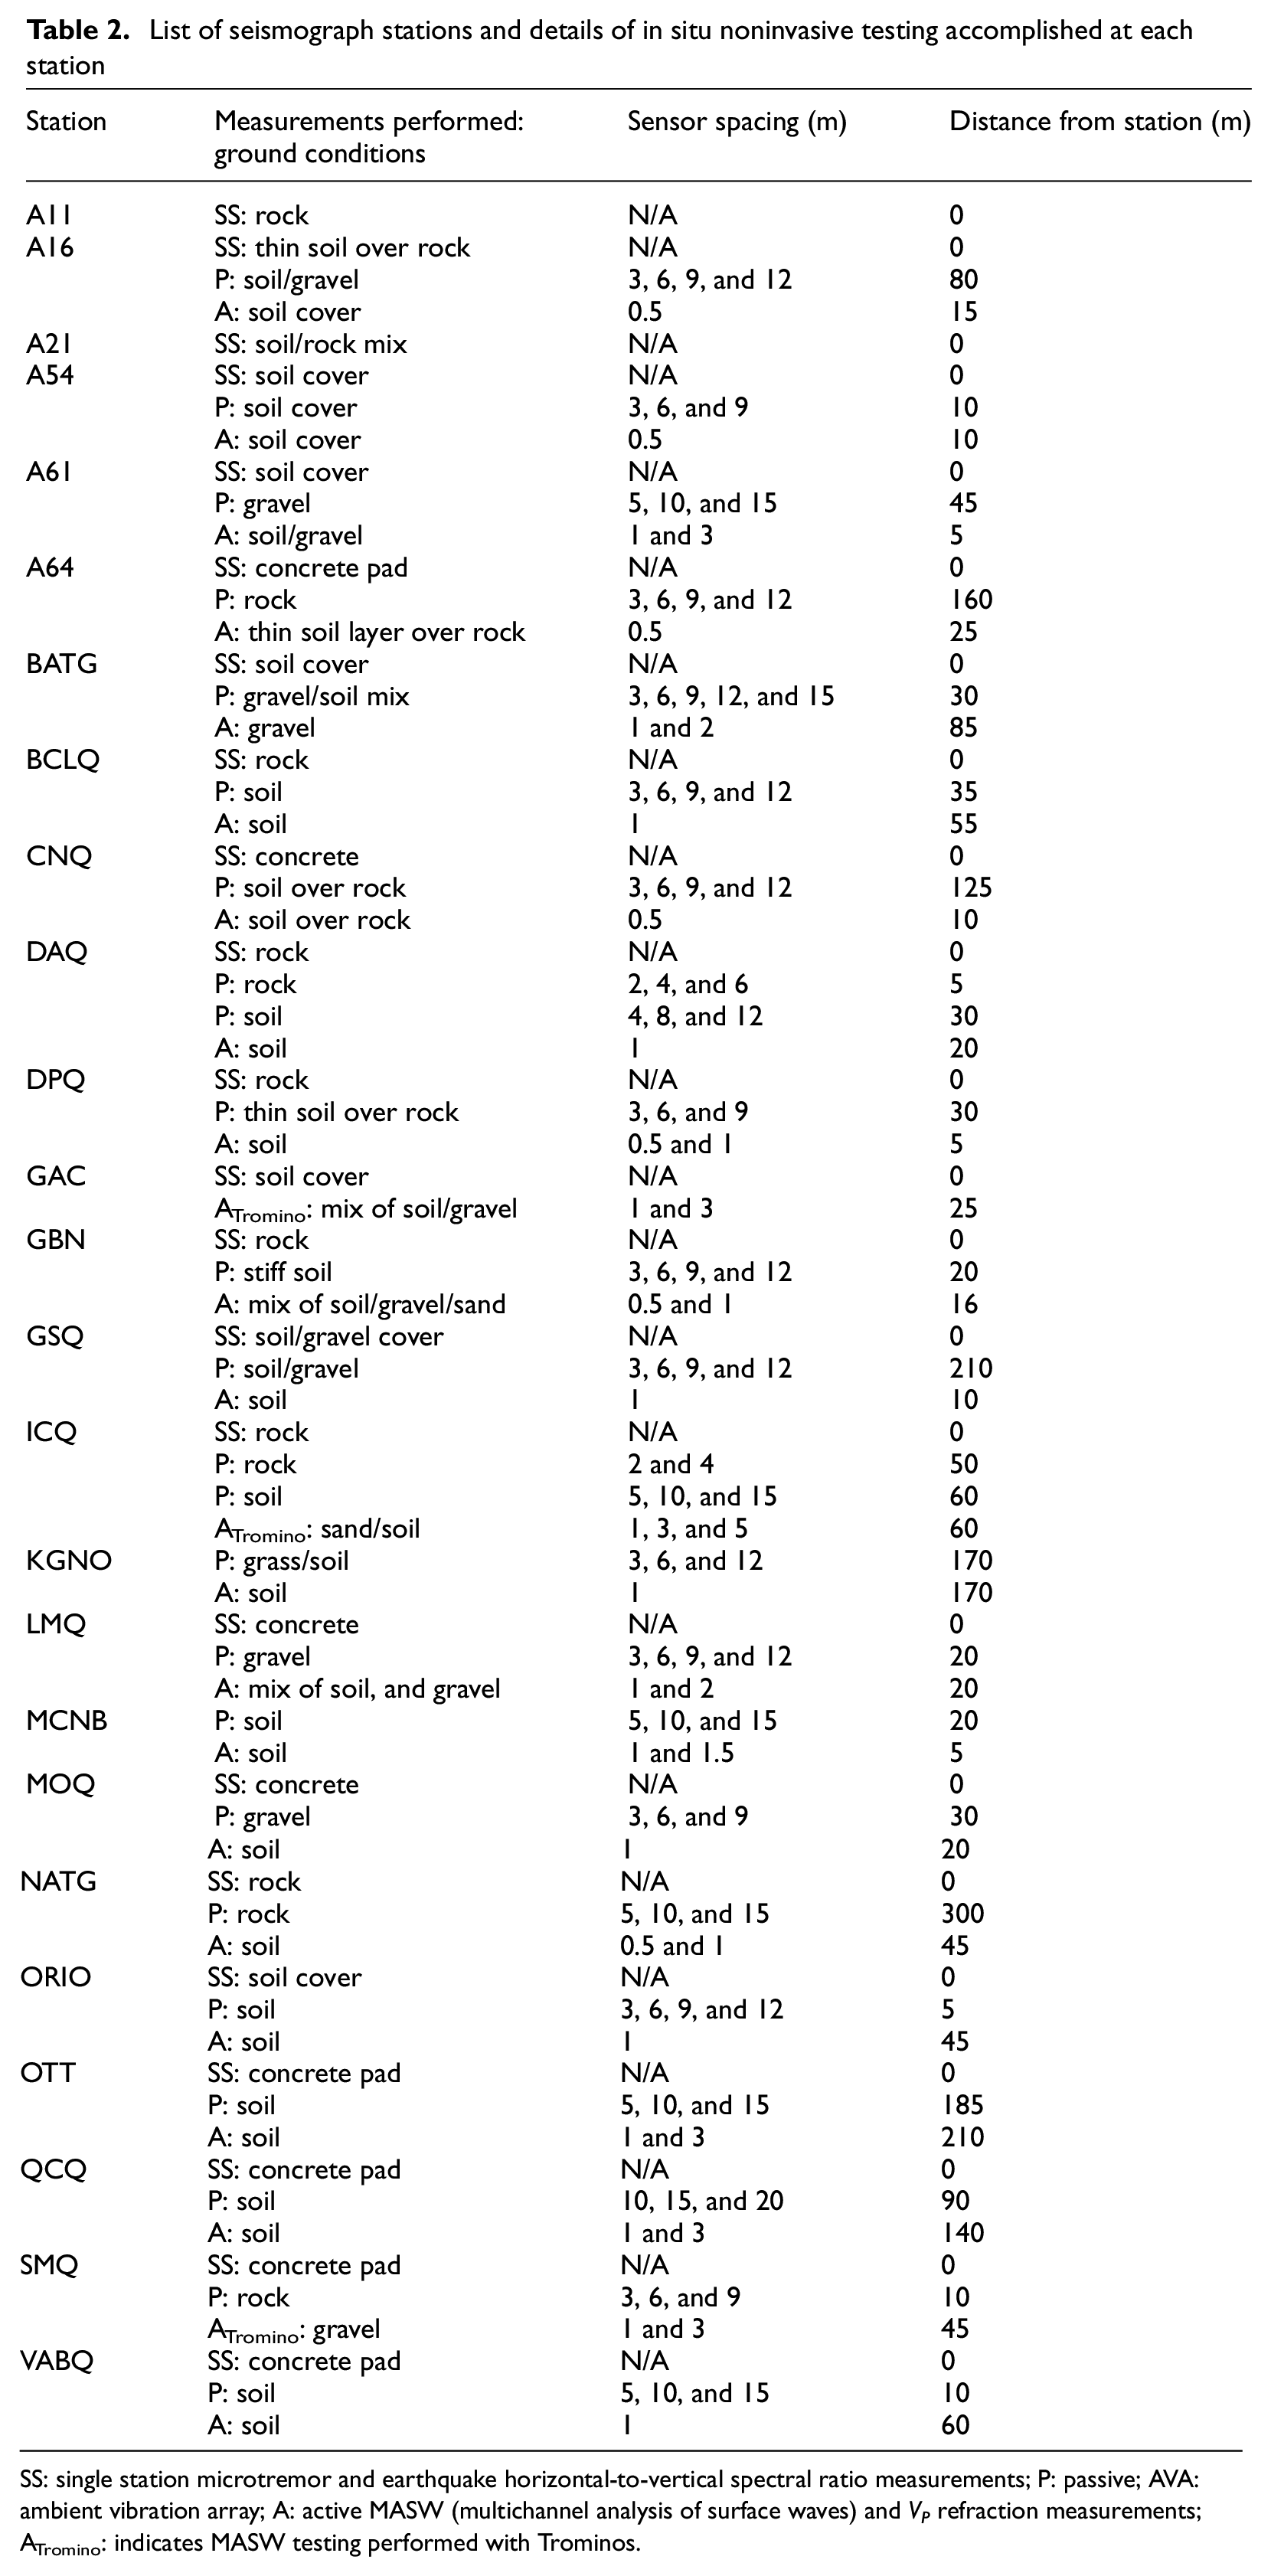
SS: single station microtremor and earthquake horizontal-to-vertical spectral ratio measurements; P: passive; AVA: ambient vibration array; A: active MASW (multichannel analysis of surface waves) and VP refraction measurements; ATromino: indicates MASW testing performed with Trominos.
Comparison of site MHVSR and EHVSR
To calculate HVSR, a single three-component (triaxial) seismometer is needed. The ratio between the averaged horizontal Fourier spectrum and vertical Fourier spectrum is calculated using either a microtremor (MHVSR) or earthquake (EHVSR) recording. The use of MHVSRs (Nakamura, 1989; Nogoshi and Igarashi, 1971) predates EHVSRs (Field and Jacob, 1993), but both provide a site amplification spectrum, relative to the vertical component recording. More on application and studies on the HVSR can be found in Molnar et al. (2018). For a rock site, theoretically there should be no broadband or resonance amplification and the MHVSR and EHVSR should be a uniform amplification spectrum of 1. In this study, each station’s MHVSR (SS in Table 2) was calculated using in situ microtremor recordings accomplished at the CNSN seismograph, either on the same concrete pad, residing rock, or on a nearby surface. Effort was made to conduct microtremor recordings on the same recording surface as the CNSN seismograph for direct comparison. However, this can be difficult in practice because CNSN seismographs are permanent installations (on concrete pads, buried, basement of buildings, etc.) compared with surface microtremor recordings. At two stations (MCNB and KGNO), the CNSN seismograph is inside a building or an insulated underground vault and single Tromino recordings beside the CNSN seismometer could not be performed. We also calculate MHVSRs from AVA measurements accomplished around the station site but not on the same recording surface as the CNSN seismograph.
Microtremor recordings were collected using a single triaxial MoHo Tromino® sensor for approximately 30 min to calculate the MHVSR. These sensors measure velocity in three orthogonal directions over frequencies from 0.1 to 1024 Hz at a selected 128 Hz sampling rate. An internal or external global positioning system (GPS) is used for accurate timing via satellite. A time-averaged MHVSR from each Tromino’s microtremor recording was calculated using 30-s time windows overlapped by 50% and smoothed using the Konno and Ohmachi (1998) filter. Inconsistent MHVSRs were removed, often related to particular time windows caused by nonnatural noise or anomalous activity noted in the field notes. If AVA recordings were used, then a site average MHVSR was calculated using the edited time-averaged MHVSRs from each of the five sensors for all array apertures at a station. Figure 2 shows the time-averaged station MHVSR on the same recording surface as the CNSN seismograph compared with the site average MHVSR from AVA recordings for 20 CNSN stations. Agreement between the two types of MHVSRs confirms that ground conditions of the AVA testing are similar to ground conditions at the CNSN seismograph. Consistent low amplification (≤2) is observed at five stations as expected for rock, for example, A64, DPQ, and GBN. Several station MHVSRs (e.g. MOQ, OTT, and QCQ) exhibit narrow peak frequencies (fpeak) related to CNSN seismograph installation, which is not observed in the site average MHVSR. Overall, site average MHVSRs have similar amplification spectra to station MHVSRs with acceptable variation in amplification level (within a factor of 2). There are few cases (A54, NATG) where the site MHVSR suggests that the ground conditions are different from the station. Array MHVSRs are generally flat (<2) and display lateral variability not to be included in inversions.
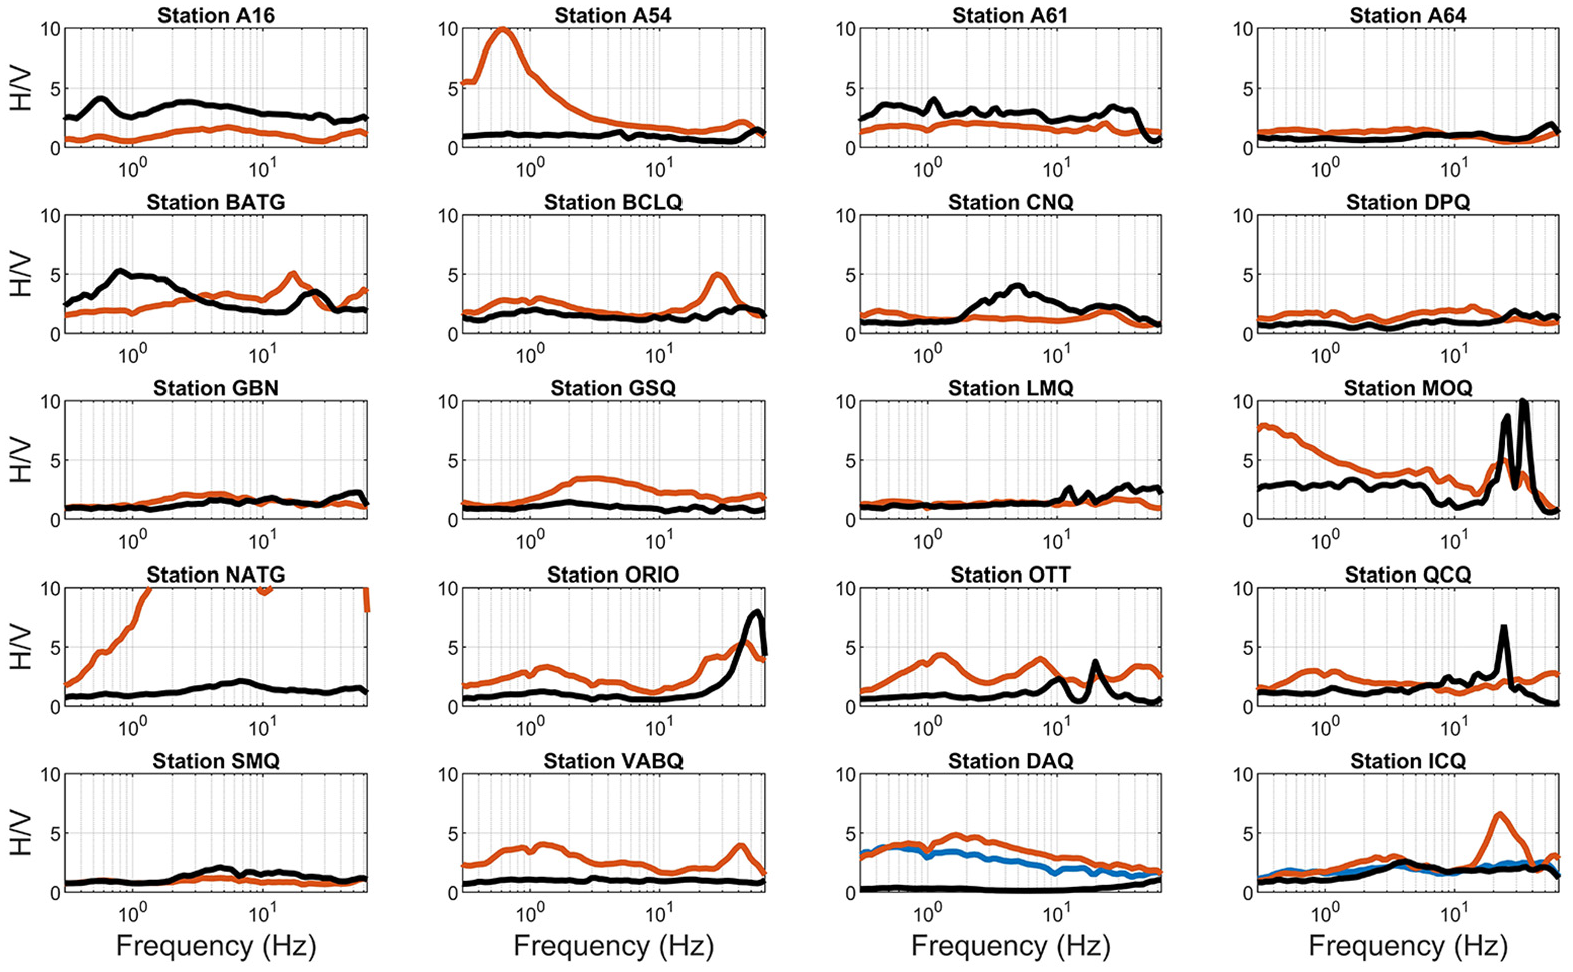
Comparison of in situ single station MHVSR (black line) and site average MHVSR (orange line) for 18 stations. Station DAQ and ICQ include two array average MHVSRs from measurements performed on soil and rock symbolized with an orange and blue line, respectively.
EHVSRs were generated for 10 stations using earthquake recordings from events with magnitude greater than 3.5 within 150 km of the station. The sampling rate of the CNSN seismographs for the stations analyzed is 100 Hz, which results in a theoretical maximum EHVSR frequency of 50 Hz. Due to instrument response and corrections, we only report EHVSRs up to 40 Hz. Figure 3 shows the station’s event-averaged EHVSR for 10 stations compared with the station’s MHVSR if measured. There is greater similarity between EHVSRs and station MHVSRs as expected (same recording location and surface conditions) than between the station and site average MHVSRs shown previously in Figure 2. Figure 3 demonstrates that station MHVSRs are a reliable measure of linear earthquake amplification at Eastern Canada seismograph stations, as previously shown for seismograph stations on rock in Ontario (Braganza et al., 2016; Murphy and Eaton, 2005) and Alberta (Farrugia et al., 2018). Hence, the station MHVSR is shown for an additional 8 stations and we expect the event-averaged EHVSR to be similar although not yet determined. Overall, HVSR amplification for Eastern Canada rock sites is near unity (≤2), as expected. Station MHVSRs for A11 and A21 were contaminated due to external (wind) effects and were discarded; however, EHVSRs were generated. Station A61 shows moderate (∼3) amplification over the entire frequency bandwidth of interest. Broadband amplification (>3) and a low-frequency peak below 10 Hz is observed at stations CNQ and BATG, respectively. For stations OTT and LMQ, double-peak EHVSR amplification at ≥10 Hz is observed. Both CNSN seismographs are installed in underground vaults; the LMQ station MHVSR recorded at surface has a less significant double-peak amplification, whereas the OTT station MHVSR recorded in the vault does include this double-peak amplification. These observed double peaks result from a sharp increase in the vertical spectrum amplitude at 15 Hz (OTT) and 20 Hz (LMQ). Hence, amplification is steadily increasing with frequency at these two stations, but is disrupted or “contaminated” by a potential vault effect (ratio minimum or trough) at high frequency. Peak amplification at >20 Hz is shown in station MHVSRs recorded at surface at station BATG, GAC, and ORIO and likely result from a thin veneer of sediment.
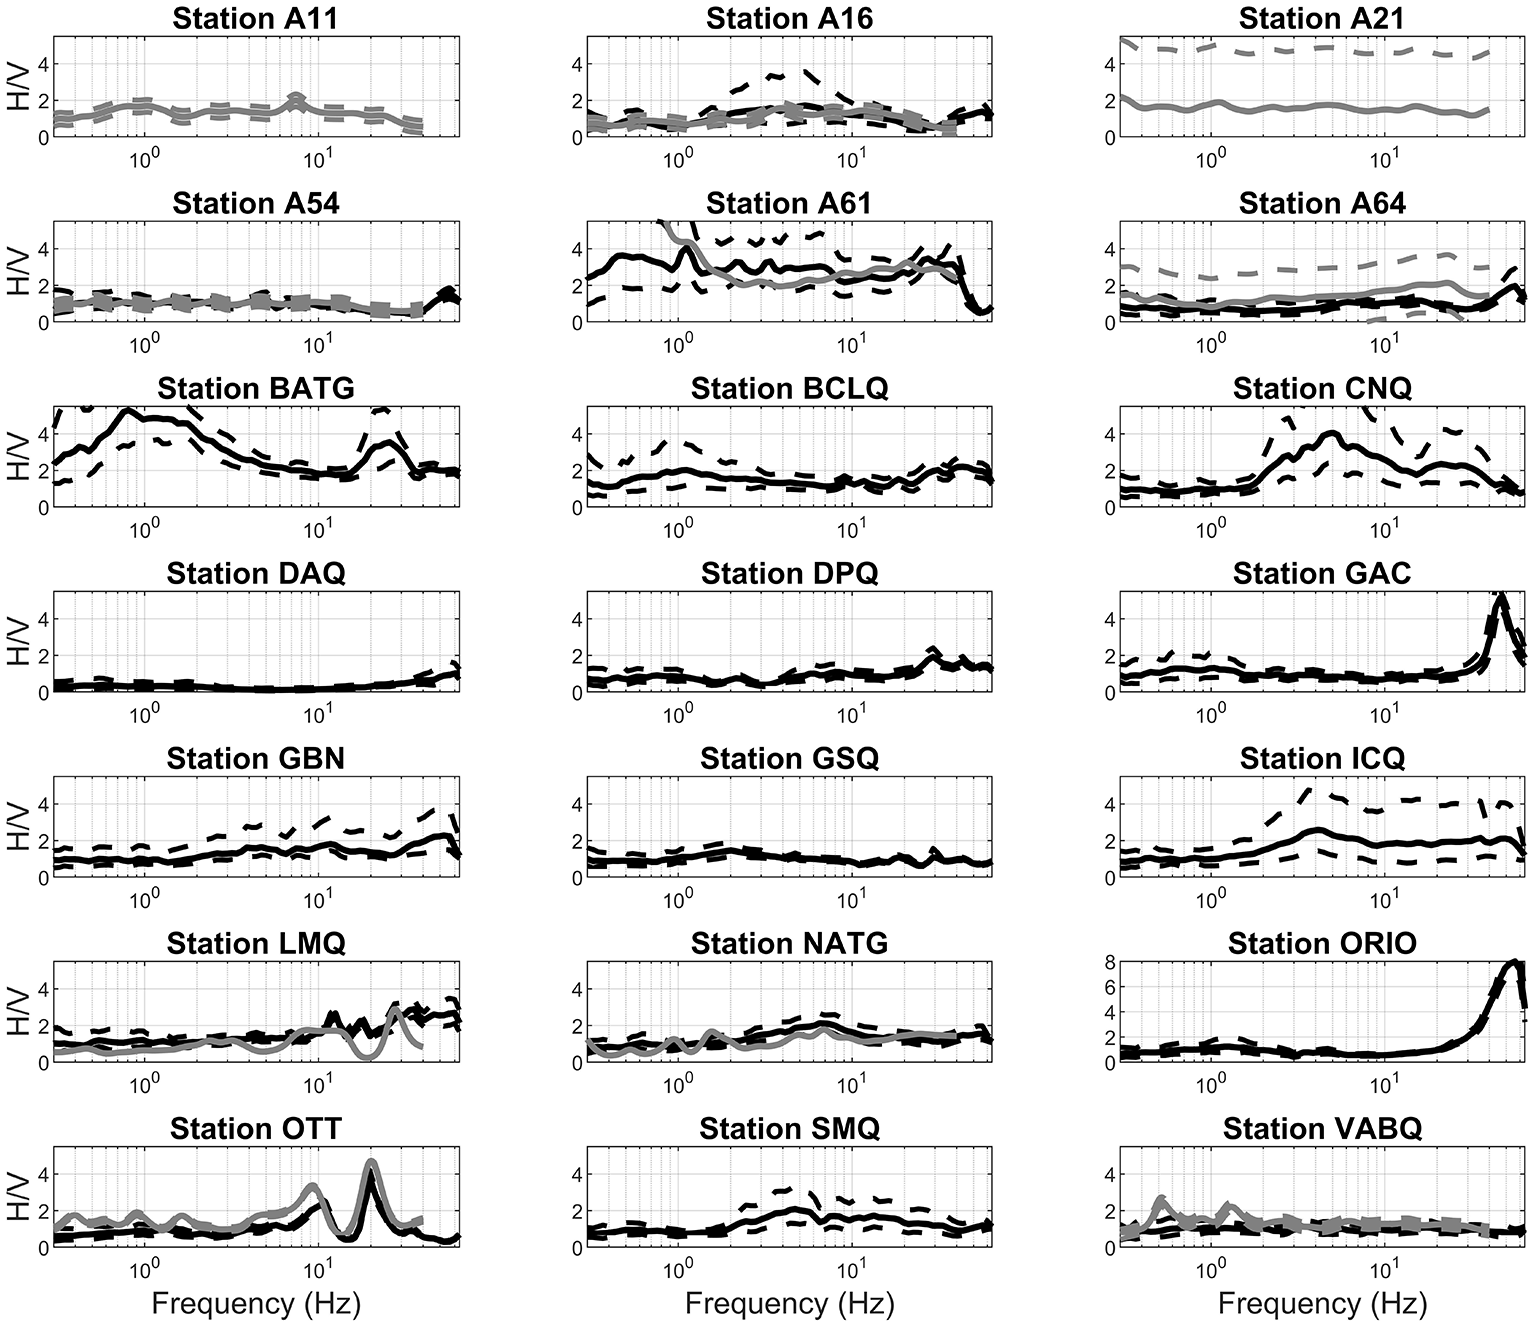
Single station MHVSRs (black line) compared with event-averaged EHVSRs (gray line) for Eastern Canada seismograph stations. Dashed lines denote 1 SD.
Site classification based on HVSR
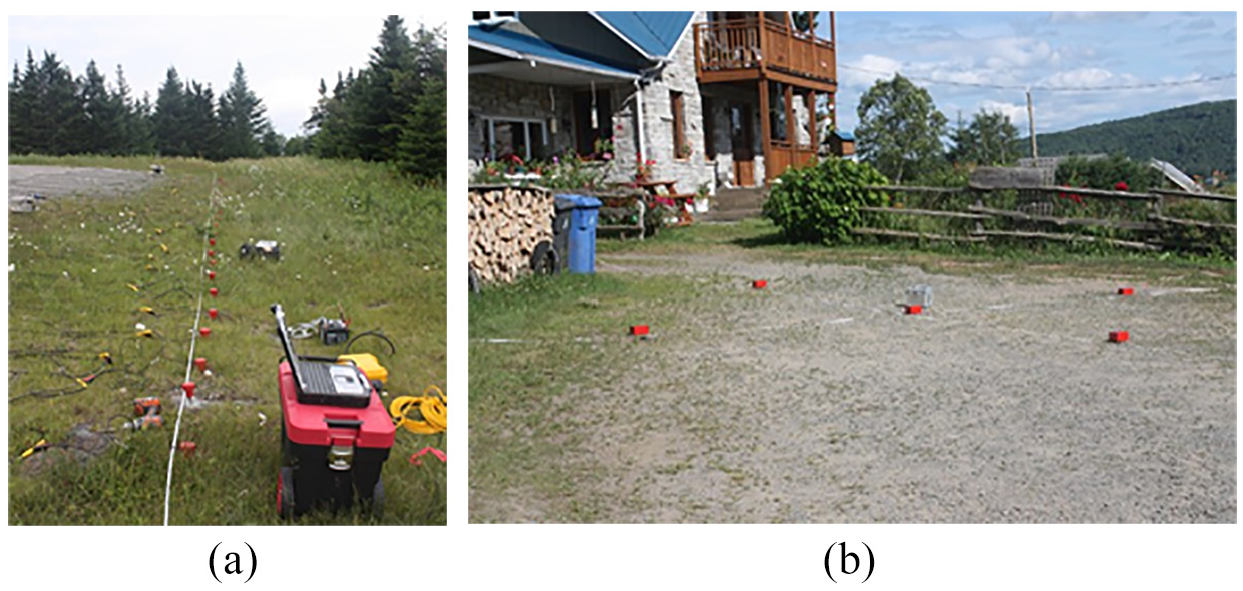
Rather than site classification based on measurable material properties (VS, Su, N60) averaged over the upper 30 m, other alternative site classification schemes have been proposed. The site period-based site classification scheme of Zhao et al. (2006) was expanded by Di Alessandro et al. (2012) into seven classes (I–VII) and is applied here; site period is the inverse of f0 or measured fpeak. Class I corresponds to a site period less than 0.2 s and Class IV corresponds to a site period greater than or equal to 0.6 s. Classes higher than IV are not based on a distinct site period. Class V corresponds to flat amplification (<2) and Class VI corresponds to broadband and/or multiple peak amplification (>2) above 0.2 s. Class VII corresponds to multi-peak amplification across the whole frequency bandwidth (no identifiable site period). We update the amplification criterion from 2 to 3 in this study (i.e. amplification ≤ 3 will correspond to flat Class V amplification). We determine site period within a frequency bandwidth of 0.5–20 Hz (period of 0.05–2 s) for all 25 seismograph stations from both MHVSRs and EHVSRs and report the corresponding site classification in Table 3.
Site-period-based site classification using MHVSR and EHVSRs
Site period classification from either MHVSR or EHVSR is determined at 20 of 25 stations (80% success rate) in Table 3. MHVSRs are sometimes not measured due to site access issues or inconsistent due to vault installation (LMQ, OTT) or wind noise (A11, A21), whereas EHVSRs may not be calculated from a lack of earthquake recordings that meet the specified criteria. Site period classifications are consistent using either the MHVSR or EHVSR due to their similarity; 17 of 20 stations (85%) exhibit CL-V flat amplification, expected of rock sites. It is relatively surprising then that 1 of 20 stations (5%) exhibit Class IV, 1 out of 20 stations (5%) exhibit Class VI broadband amplification, and 1 out of 20 stations (5%) exhibit Class VII multi-peak amplification. Station A61 exhibited moderate amplification (∼3) across majority of its EHVSR and MHVSR frequency bandwidth (CL-VII) that can be indicative of softer or weathered rock. A similar EHVSR moderate amplification response (∼3) was observed by Siddiqqi and Atkinson (2002). Siddiqqi and Atkinson (2002) also examined station GAC and the remaining stations located in Charlevoix (stations with a prefix of A and LMQ) using EHVSRs and found a similar flat response. For 5 of the 25 total stations (20%), an MHVSR is not calculated either because microtremor recordings were not performed (site access issues) or due to inconsistent results and these sites should be revisited in future.
Site characterization from VS profiles
For 23 of 25 stations, active- and/or passive-source noninvasive seismic array techniques were performed to extract dispersion estimates. AVA recordings were collected using five Trominos. Four sensors were located at the apex of a cross-shaped geometry with a fifth central sensor. AVA sensor spacing varied from a minimum of 2 m, up to 30 m maximum, depending on the available open space at each station. Microtremors were recorded for approximately 30 min for each array setup.
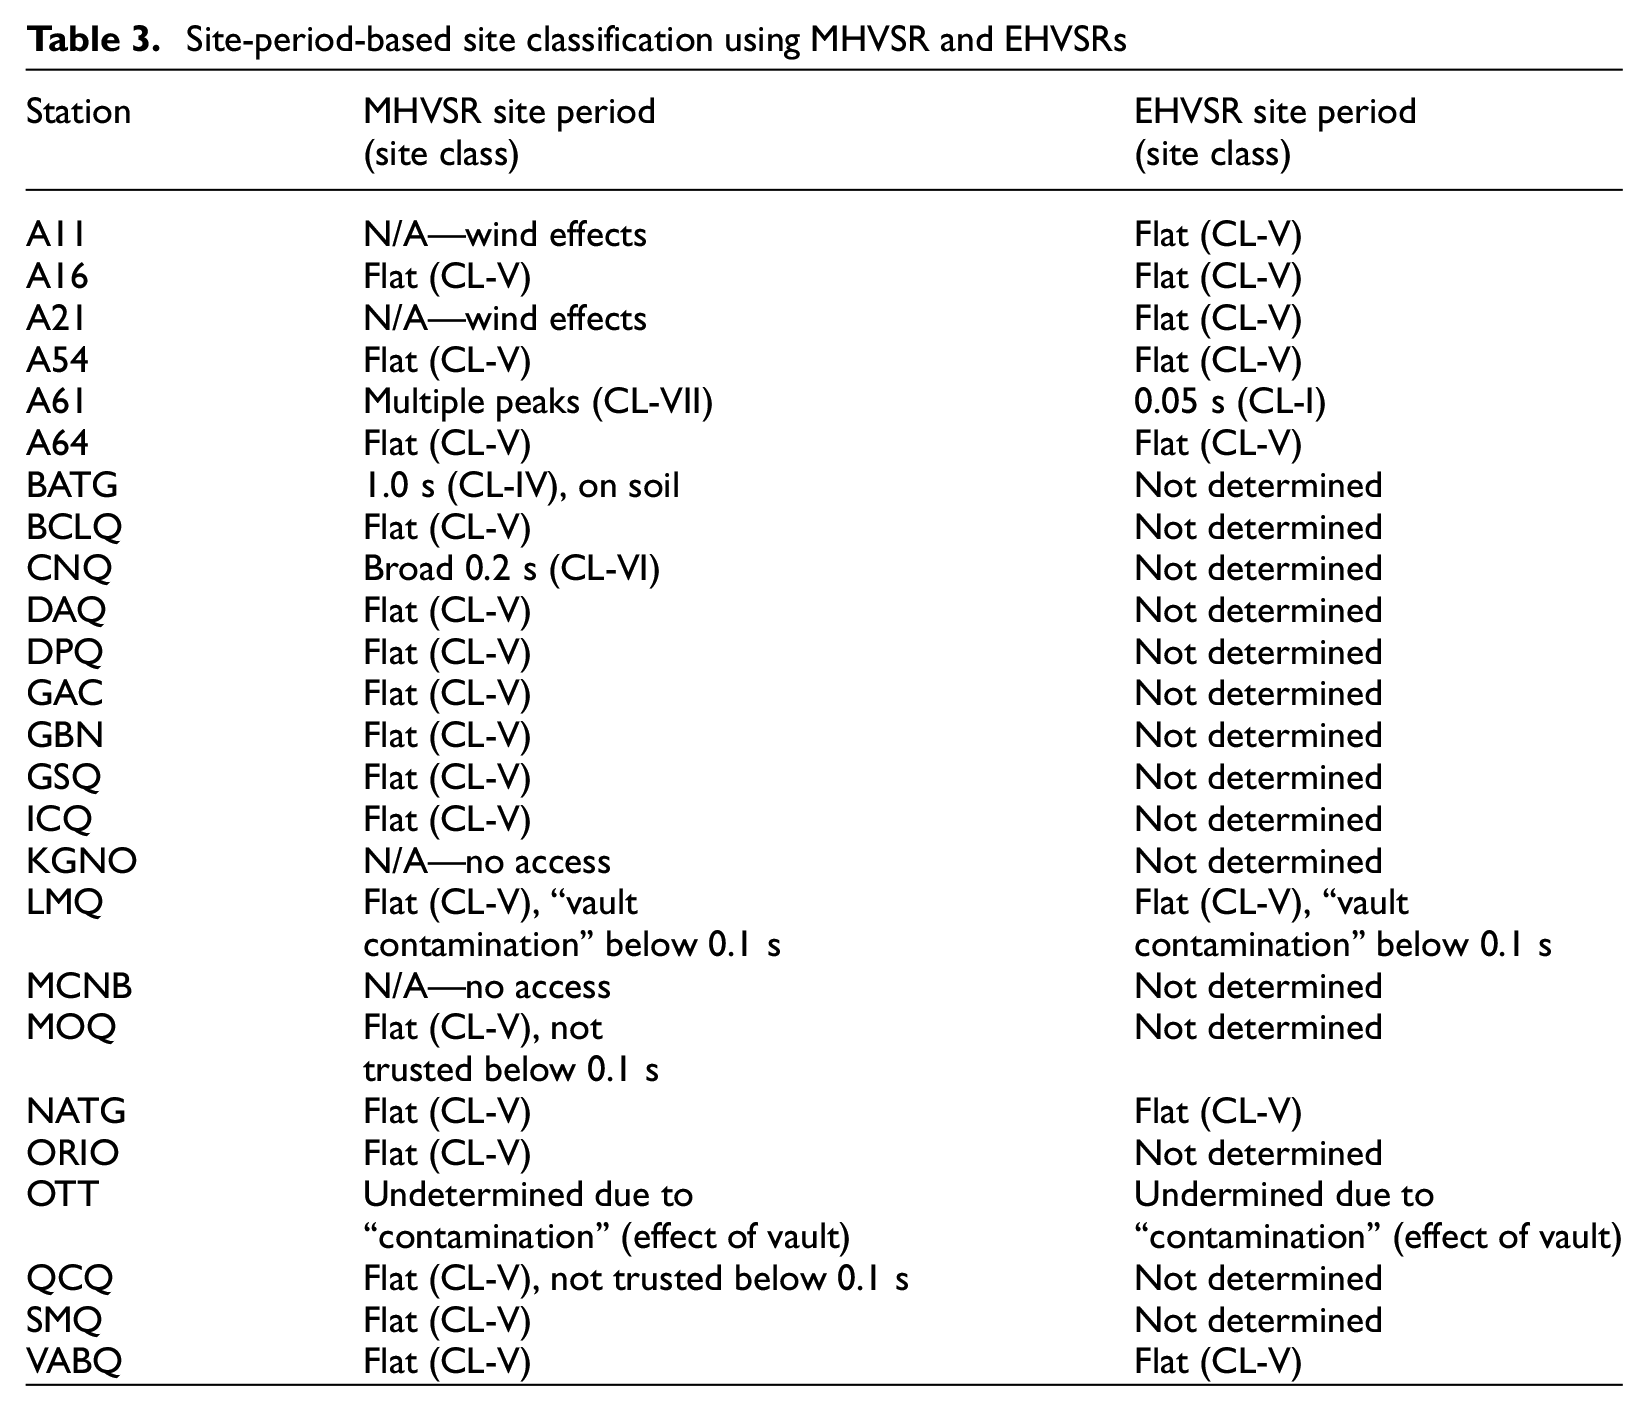
MASW testing utilized a Geode seismograph sampling at 500 Hz with a linear array of 24 vertical 4.5 Hz geophones recording continuously. An 8-lb sledgehammer was used as the seismic source which was struck vertically on an aluminum plate at 5 and 15 m from each end of the linear array. Geophone spacing varied from 0.5 m to a maximum of 3 m. MASW was also performed using five Trominos with 1024 Hz sampling at stations where geophones could not be inserted into the ground (noted as ATromino in Table 2). Tromino spacings varied from 1, 3, and 5 m with the same source offset distances of 5 and 15 m. Figure 4 shows example photos of active MASW and VP refraction survey, and passive AVA survey design.
Example site photos showing array configuration and spacing for (a) active MASW and refraction testing at station MOQ and (b) passive AVA testing at station DPQ.
AVA recordings were prepared for dispersion analysis by synchronizing using GPS timing (accomplished by the Tromino’s proprietary software Grilla) and converted to ASCII text file. AVA and MASW array recordings were converted to applicable file formats and imported to Geopsy, an online open-source software for time-series processing and dispersion analyses. MASW data recorded by the Geode system in SEGY format was converted to Miniseed format using a Python routine. Once imported to Geopsy, shot gathers are created by cutting time windows of 1 or 2 s around each shot from the continuous recordings. Similarly, MASW data collected with Trominos were imported as ASCII files into Geopsy and preprocessed into 1 or 2 s shot gathers.
Dispersion histograms of phase velocities estimated at each frequency are generated by the frequency–wavenumber (f–k) (e.g. (Asten and Henstridge, 1984) method for active MASW shot gathers and by modified spatial autocorrelation (MSPAC) processing (e.g. Bettig et al., 2001) for passive AVA recordings. Processing was implemented in the Geopsy software processing package (Wathelet et al., 2020; version 20170109). More information on noninvasive seismic techniques can be found in the Canadian guidelines for shear-wave velocity profiling and references within (Hunter and Crow, 2015). For 16 of 23 stations (70%), fundamental mode Rayleigh wave dispersion estimates could be identified and extracted from either active or passive methods. We summarize application of the active- and passive-source surface wave techniques with example results in the following subsections. Supplemental Figures A1 to A22 in the electronic supplement show the f–k and MSPAC dispersion histograms and selected fundamental mode dispersion estimates for all 16 stations.
Dispersion estimates
AVA testing provides lower frequency dispersion estimates compared with active MASW methods and is more likely to provide direct measurement of phase velocities in rock at depth, that is, “top” of the dispersion curve. When successful, the AVA method provides the most important and useful information in rock site characterization which is VS of the rock. For the 22 stations with AVA testing, we were able to measure the “top” of the dispersion curve for 7 stations (32%) providing a direct measure of phase velocity at depth, assumed rock. Examples of the variation in AVA dispersion estimates are shown in Figure 5. We did obtain high phase velocity estimates at low frequencies (Figure 5a and b) or lower velocity estimates with increasing frequency (Figure 5c) but for majority of the stations, no dispersion estimates were obtained (Figure 5d).
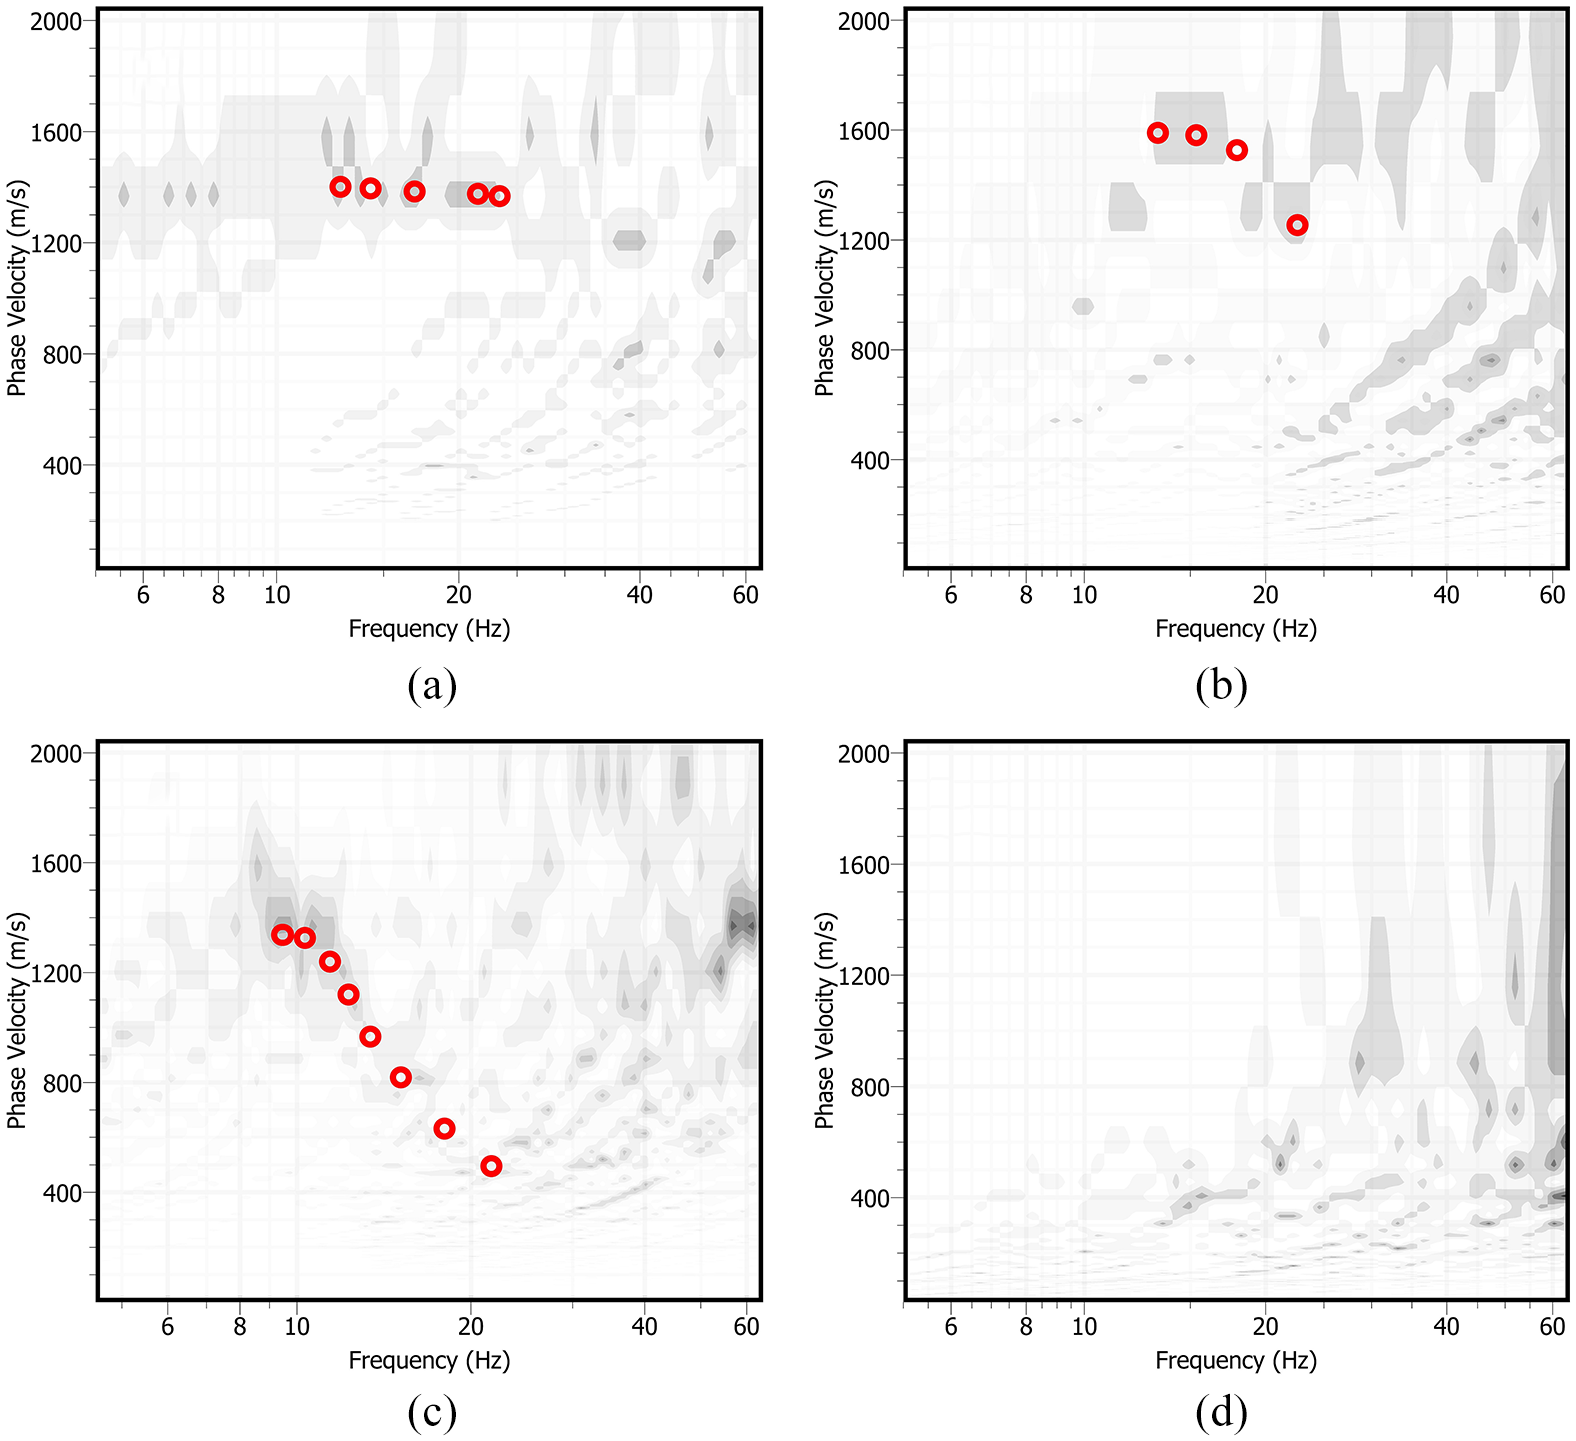
Examples of AVA dispersion estimates (open circles) for stations (a) QCQ, (b) ICQ, and (c) OTT. (d) No AVA dispersion estimates obtained for station MOQ.
Dispersion estimates were obtained from f–k processing of MASW shot gathers at higher frequencies. Reliable dispersion histograms were obtained for all 23 MASW tested stations; we were able to select dispersion estimates with a relatively wide frequency bandwidth useable for inversion at 16 of the 23 stations (70%). Hence, MASW testing was more successful than AVA. Figure 6 shows examples of the variation in MASW dispersion estimates including the transition from soil to rock (Figure 6a and b), rock velocity estimates (Figure 6c), and low velocity estimates of only surficial soils (Figure 6d). For 7 stations, AVA and MASW dispersion estimates are combined to generate a full dispersion curve for inversion. For the remaining 9 stations, only MASW dispersion estimates were obtained and used for inversion. Figure 7 shows dispersion curves used for inversion for the 16 stations with AVA and MASW dispersion estimates. We consistently obtain phase velocities between 10 and 100 Hz for all stations, except GAC. No regional trends in velocity are identifiable. Phase velocities of rock, the “top” of the dispersion curve, obtained at 7 stations is ∼1400–1800 m/s. At high frequencies (shallow depth), 12 stations have phase velocities <500 m/s indicating surficial soil is present. The GAC dispersion curve is an octave higher in frequency than all other site dispersion curves; phase velocities demonstrate GAC is the highest velocity site tested.
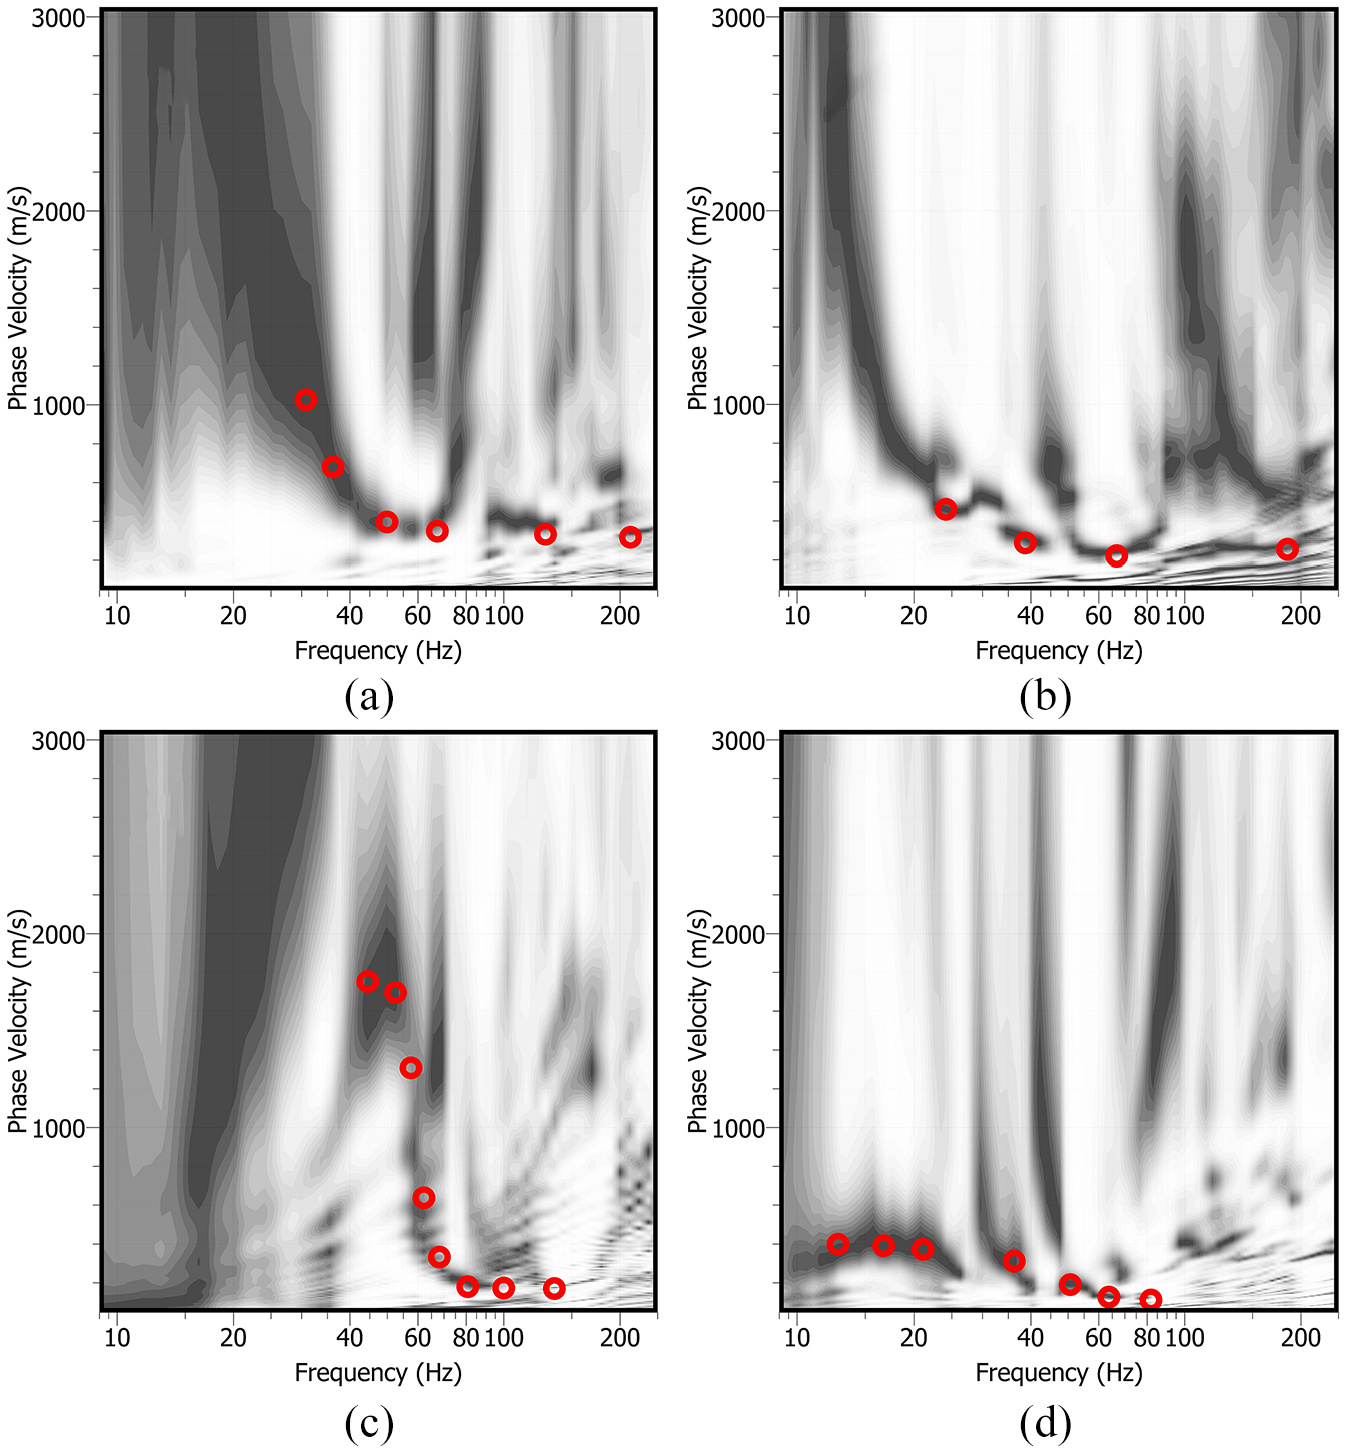
Example MASW dispersion estimates (open circles) for stations (a) ORIO, (b) OTT, (c) MCNB, and (d) DAQ.
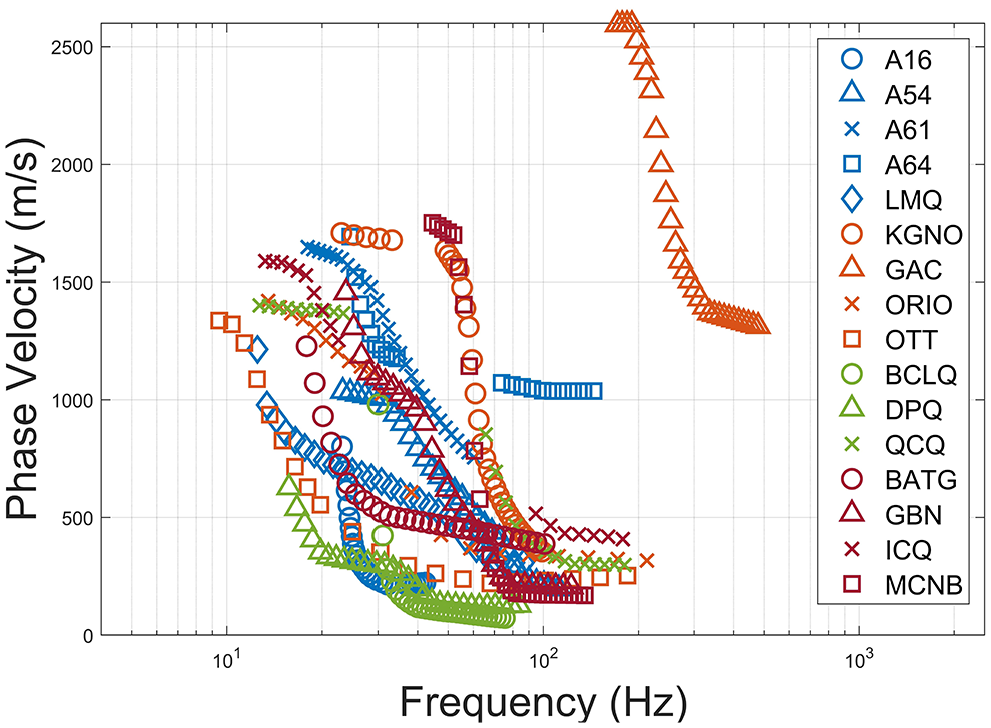
Summary of dispersion estimates at Eastern Canada seismograph stations.
Inverted Vs profiles
AVA and MASW dispersion estimates are combined to generate a dispersion curve, which is inverted using two inversion approaches. PSWP and Geopsy’s Dinver are used to invert Rayleigh wave dispersion estimates to acquire VS profiles for each station. Dinver is used to determine the optimal (minimum misfit) model, while PSWP is used to analyze model parameter uncertainties. Dispersion data is first inverted using Dinver using one to two uniform velocity layers over a halfspace. Uniform model parameter limits are set relatively wide. For example, Dinver’s default 0.2–0.5 parameter range for Poisson’s ratio was used and the default thickness of 100 m is used or reduced to 30 m for input dispersion data with high frequencies. Density is fixed to 2000 kg/m3 for all layers. If available, refraction VP of the rock is used to constrain the uniform VP parameter limits. Several starting seeds with a maximum of 15,000 generated models are used to obtain the lowest misfit model.
PSWP is initiated with two model parameterization options: two uniform velocity layers over a halfspace (a single layer over a halfspace is not available) and a powerlaw velocity gradient over a halfspace. Model parameter limits are uniform and set relatively wide to not constrain the model parameter space. Poisson’s ratio is constrained using a physical limit (VS ≤ VP/√2). In a first stage, PSWP performs optimized inversion using an adaptive simplex simulated annealing algorithm (Dosso, 2002). The most appropriate model parameterization is determined by calculating the BIC from each parameterization’s optimal model. The optimal model of the lowest BIC model parameterization is used as the starting model for the second-stage MCMC sampling routine. The MCMC samples consisted of 100,000 models. This software only inverts fundamental mode Rayleigh wave dispersion estimates.
When PSWP determined two uniform layers over a halfspace as the most appropriate model parameterization based on the BIC, the same multilayer model is selected using Dinver. When PSWP determined a powerlaw velocity gradient over a halfspace as the most appropriate model parameterization, a single uniform velocity layer over a halfspace is selected using Dinver. In this latter case, a sharp change in curvature of the dispersion data occurs. Since a single layer over a halfspace cannot be solved using PSWP, we rerun Dinver using the same powerlaw velocity gradient over a halfspace parameterization for direct comparison.
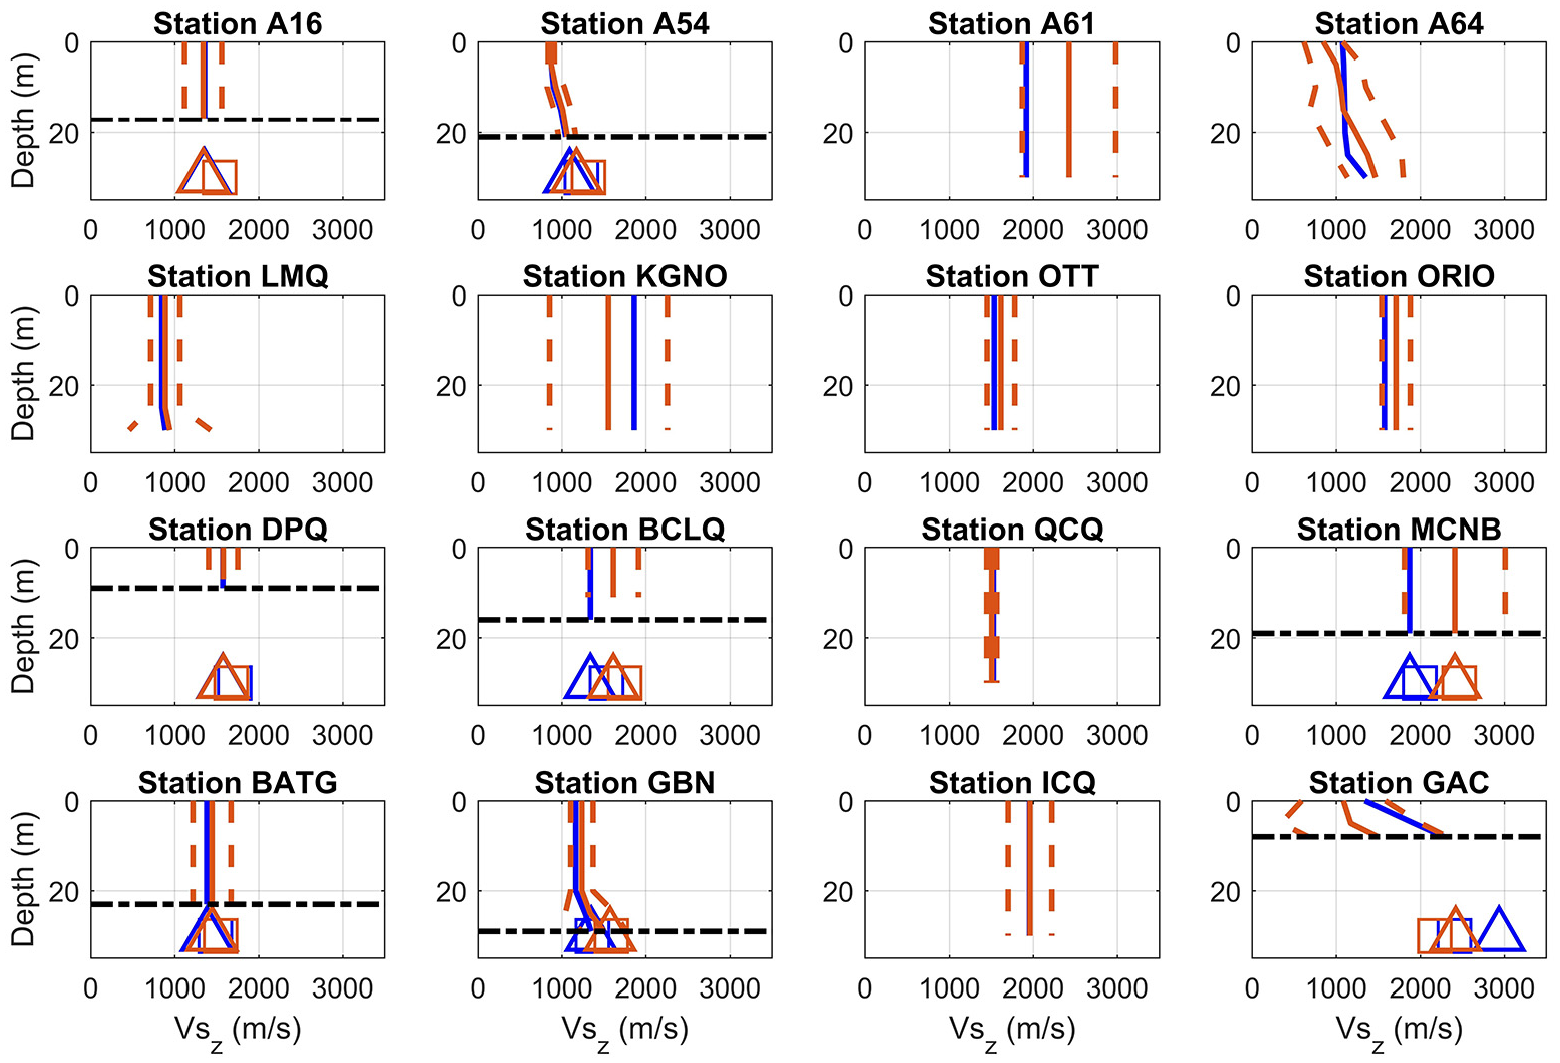
Figure 8 presents inverted VS profile(s) results for 4 selected stations; Supplemental Figures A1 to A22 show the inverted VS profiles for all 16 stations. The optimal VS profile determined by Dinver is shown with the 66% and 95% VS profile HPD credibility intervals determined from PSWP. The optimal VS profile determined by Dinver occurs within the 95% credibility interval determined by PSWP, as expected. Table 4 reports VS of the bottom and/or halfspace layer(s) determined by each inversion, interpreted as rock, including 1 SD from PSWP. Background gray shading in the subsequent tables indicate that the rock VS has more confidence being directly measured by dispersion estimates. The average optimal rock VS of the 16 Eastern Canada seismograph stations is 1650 m/s (rounded to nearest 5 m/s), and the average variance in the mean rock VS is 335 m/s (COV of 0.20). A reminder that the PSWP model uncertainties are underestimated (conservative) based on treatment of data errors and fixing of density in the inversion. For comparison, the mean VS (and 1 SD) of CENA reference (stable crust) rock is 2951 (831) m/s (Hashash et al., 2014). Depth to rock (VS ≥ 800 m/s) is typically less than 5 m (e.g. Figure 8b and c) or up to ∼10 m (e.g. Figure 8a and d).
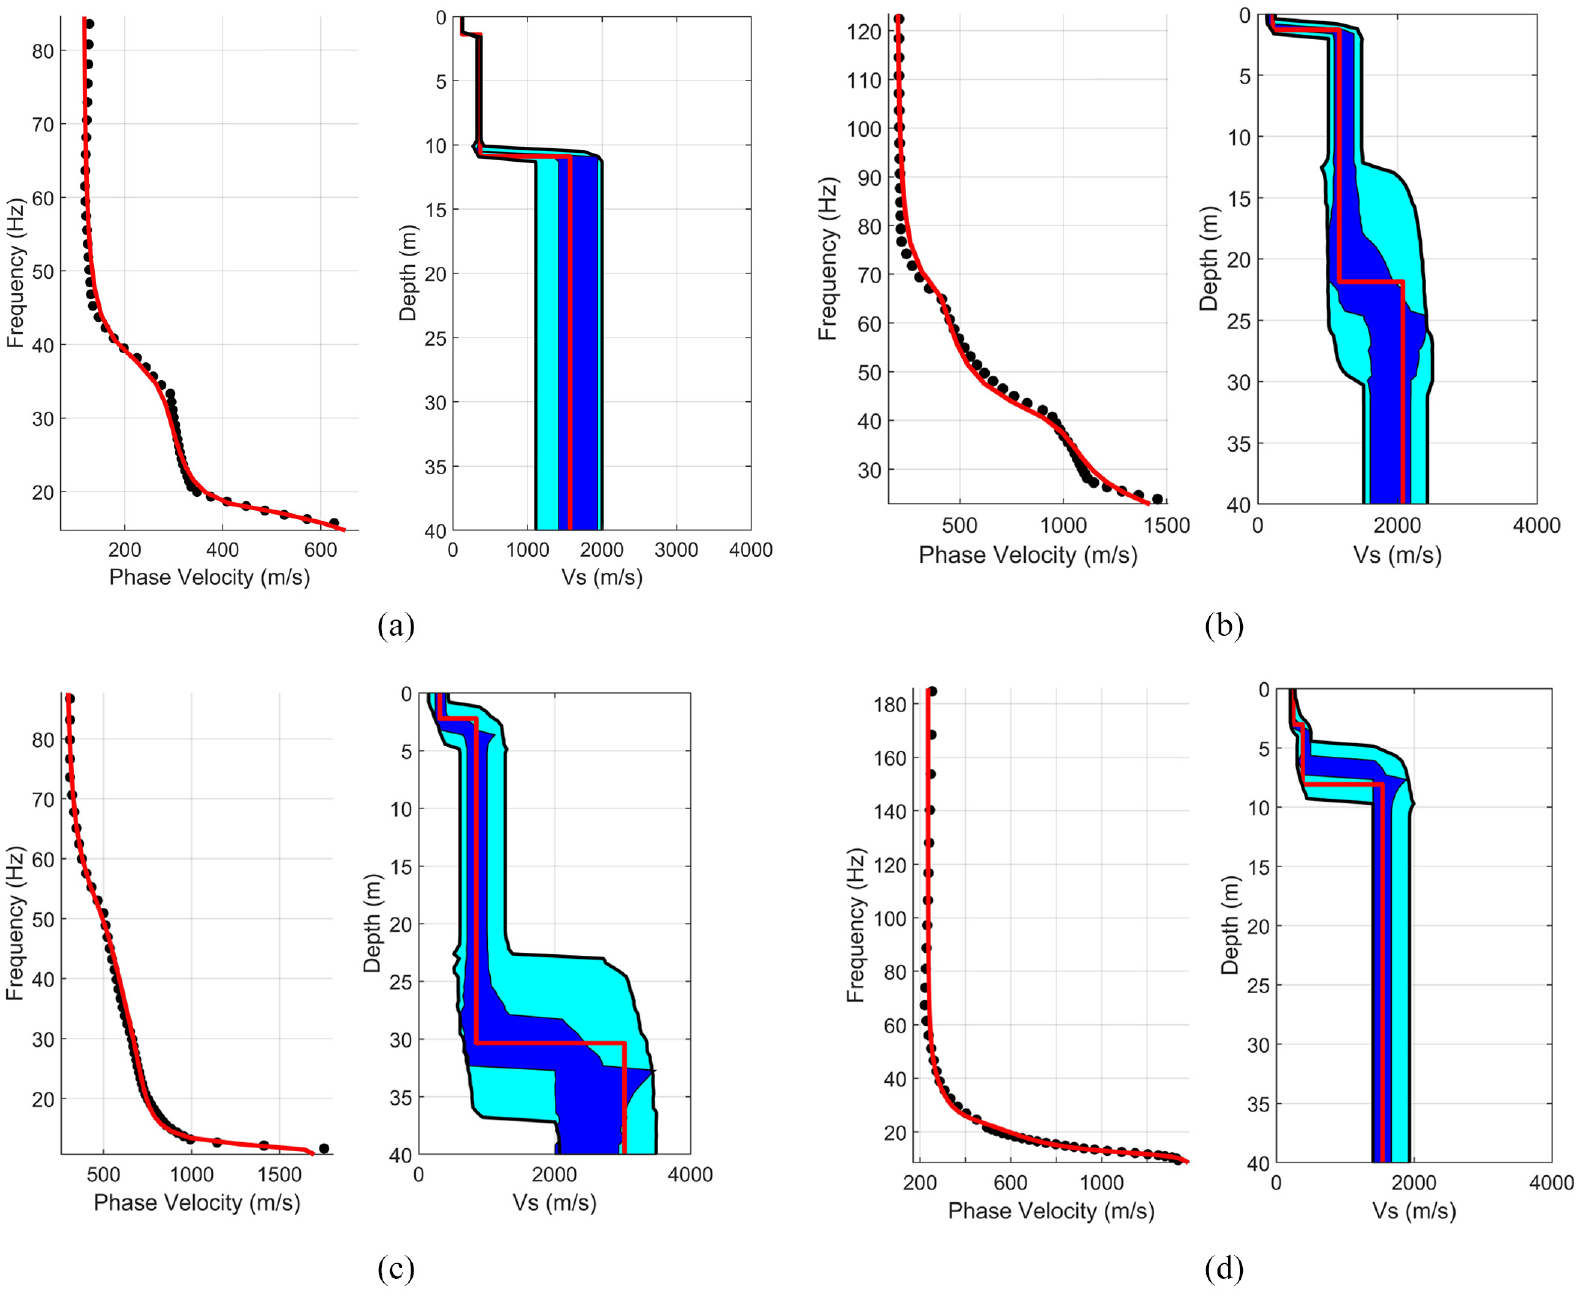
For stations (a) DPQ, (b) GBN, (c) LMQ, and (d) OTT, left panels show dispersion estimates (black circles) plotted with Dinver’s optimal model (red line). Right panels show the Dinver optimal model’s VS profile (red line) with PSWP’s 66% and 95% HPD credibility intervals shown with blue and cyan shading, respectively.
Optimal and mean rock VS determined for each station from Dinver and PSWP inverted VS profile(s), respectively
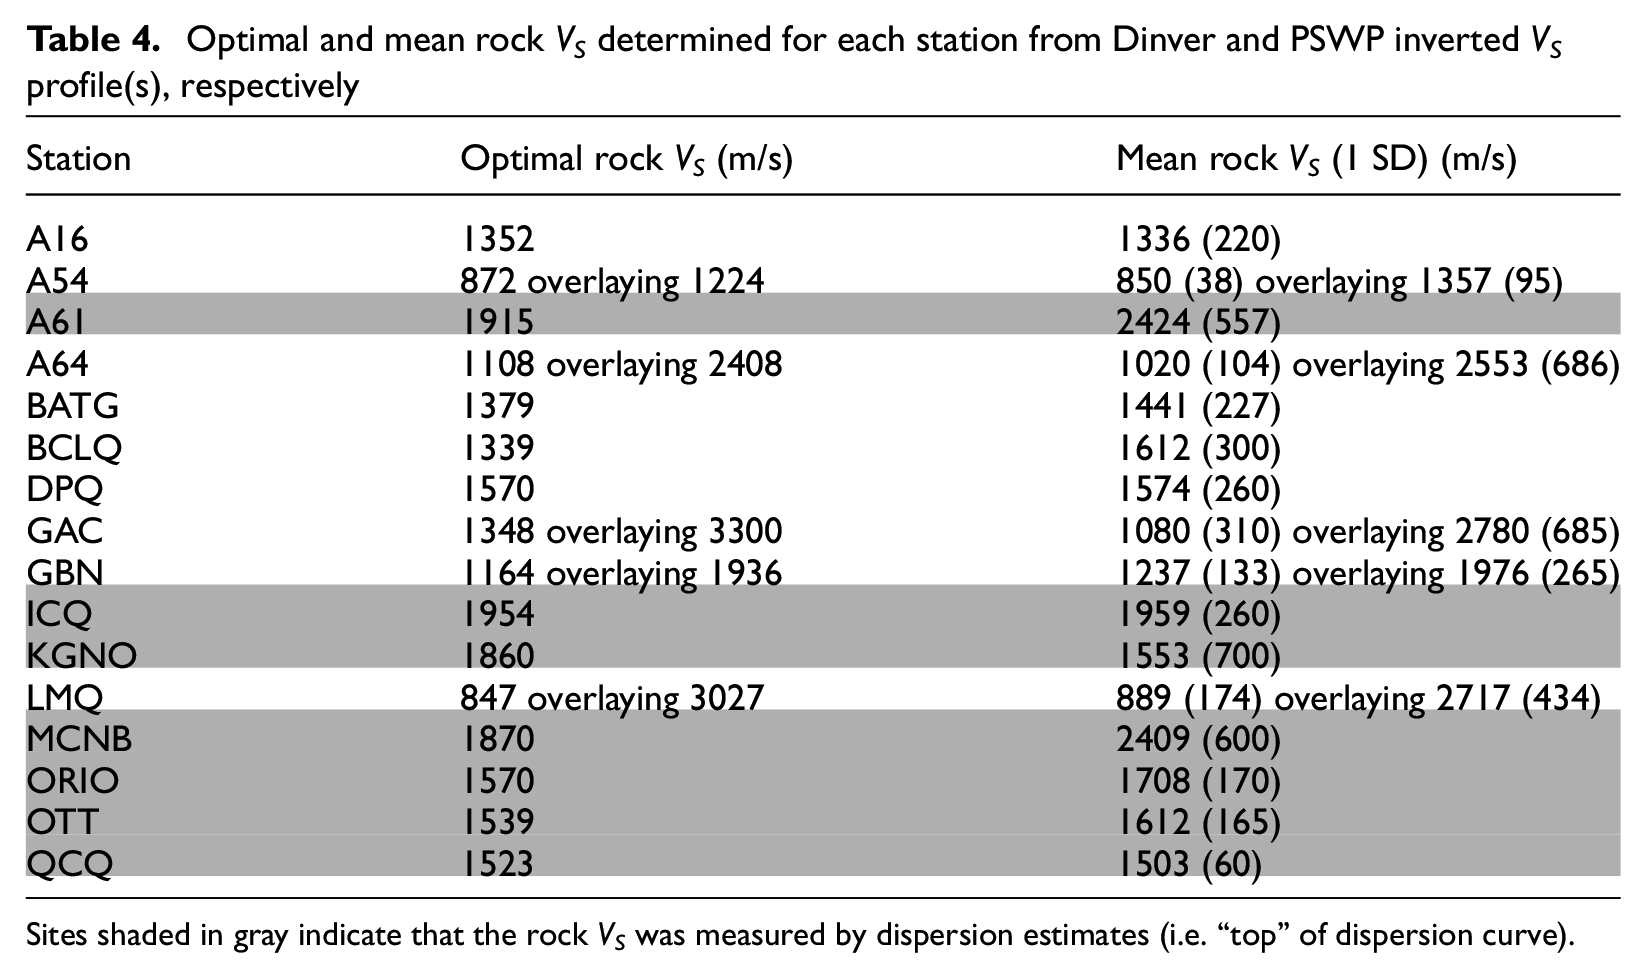
Sites shaded in gray indicate that the rock VS was measured by dispersion estimates (i.e. “top” of dispersion curve).
We further investigate whether there is a significant difference in VS based on geologic rock age at the stations (Supplemental Table A1). Using our inverted optimal rock VS estimates, we determine the average VS (and 1 SD) of Paleozoic and Precambrian rock (Figure 9) to be 1511 (235) m/s and 1875 (781) m/s, respectively. Variances in rock VS reduce when we consider only the 7 stations with rock VS measured by dispersion estimates (i.e. “top” of dispersion curve). Then the average (and 1 SD) VS of Paleozoic and Precambrian rock is 1671 (178) m/s and 1935 (28) m/s, respectively. For the southern St. Lawrence Lowlands (Ottawa to Quebec City), Nastev et al. (2016) determined the average (and 1 SD) in Paleozoic and Precambrian rock VS to be 1500 (500) m/s and 2500 (700) m/s, respectively. We determine similar average rock VS and variances as those of the southern St. Lawrence Lowlands for stations across Eastern Canada, that is, both studies determine higher average VS and variability for Precambrian rock compared with Paleozoic rocks. There is overlap in rock VS between the two geologic ages, but overall Paleozoic rocks have a lower average VS than Precambrian rocks as expected.
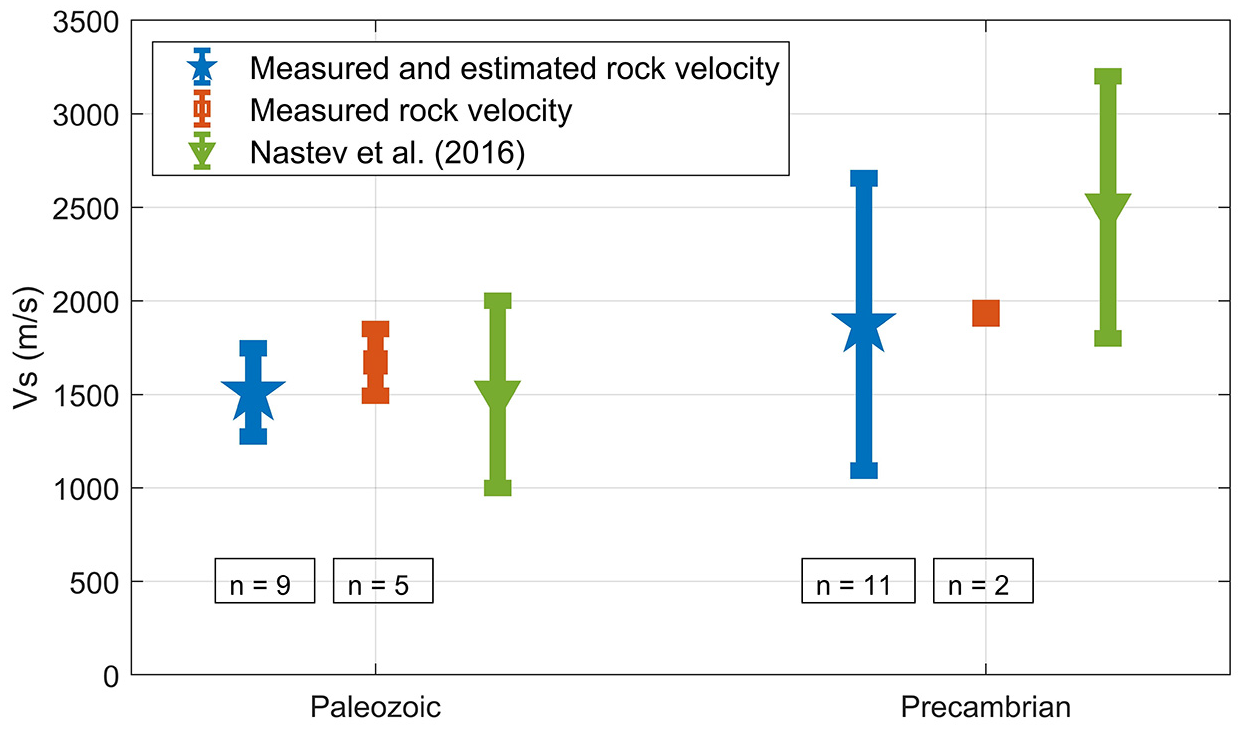
Comparison of Paleozoic and Precambrian rock VS in Eastern Canada.
Site classification based on VS30
The inverted VS profiles are representative of the seismic arrays testing location, some of which are a distance away and located on different ground conditions (surficial soils) than the seismograph station installed on rock. To calculate station-appropriate VS30 (rock only), we remove the low VS (≤800 m/s) uppermost in the inverted VS profiles when present. At stations where our seismic array methods penetrated 30 m or more into rock, VS30 is calculated directly from the inverted VS profiles. At stations where our seismic array methods penetrated less than 30 m, two approaches are used to estimate VS30 which provide lower and upper VS30 bounds. The first is to simply extend the inverted rock VS to 30 m depth. Extending the same constant rock VS at shallower depth to 30 m is a conservative (lower VS30 and site class) approach, because velocity generally increases with depth in the Earth. A more realistic approach is to extrapolate average VS from the maximum measured depth to 30 m.
The maximum resolution depth (zmax) of surface wave dispersion methods is based on an assumption many authors use (e.g. Park et al., 1999), where zmax≈λmax/2 and λmax is the maximum measured wavelength of an AVA or MASW survey. For all stations, λmax is calculated using the dispersion curve’s phase velocity (VR) estimate at the lowest frequency (λmax = VR/f) and halved to determine zmax. Sediment thickness (if present) is subtracted from zmax to calculate the penetration depth into rock, that is, z of Vsz. Table 5 summarizes zmax, depth to rock, and penetration depth into rock at the survey location for each station. Ahdi et al. (2017) summarizes various VS30 extrapolation models from authors who have applied noninvasive and invasive seismic data to create correlations between VS30 and time-averaged VS measurements at a depth z (Vsz). We use the Boore et al. (2011)VS30 extrapolation model developed using 635 velocity profiles from Japan (KiK-Net) stations placed on rock and stiff soil. Boore et al. (2011) developed a second-order polynomial relation (Equation 2) to correlate Vsz with VS30 at 1-m depth intervals from z = 5–29 m as follows:

Determined zmax, sediment thickness (rock depth), and penetration depth into rock for the 16 seismograph stations
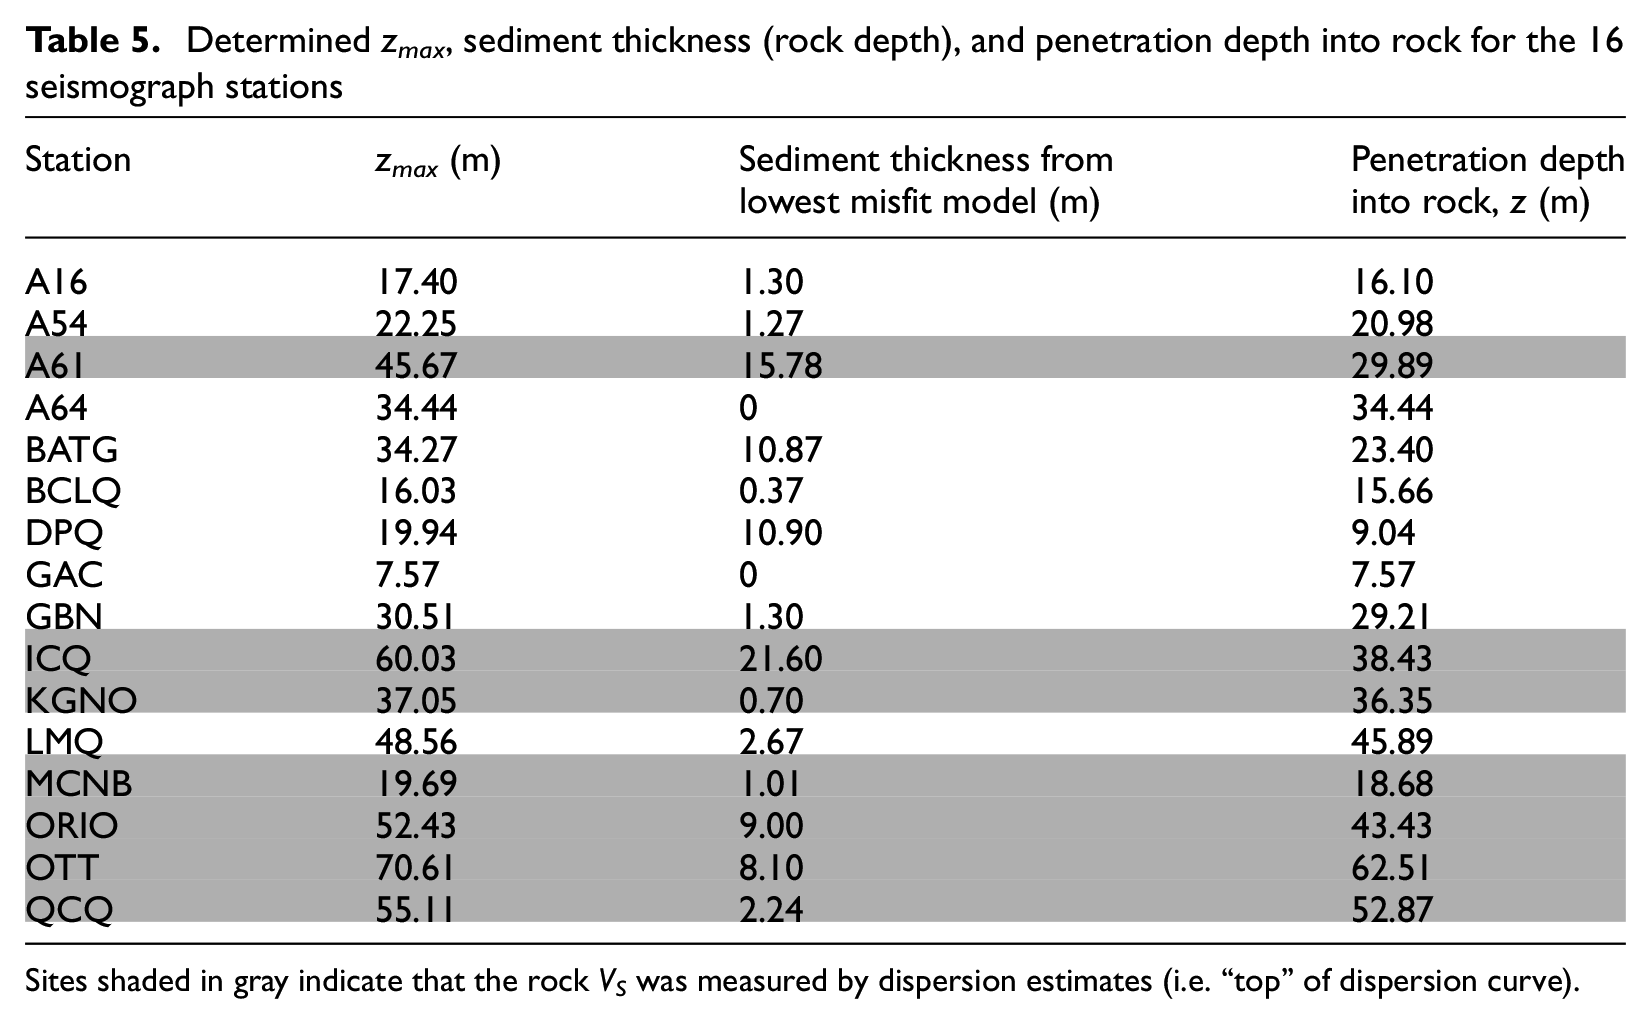
Sites shaded in gray indicate that the rock VS was measured by dispersion estimates (i.e. “top” of dispersion curve).
Coefficients (c0, c1, and c2) were developed from the Kik-Net station VS data.
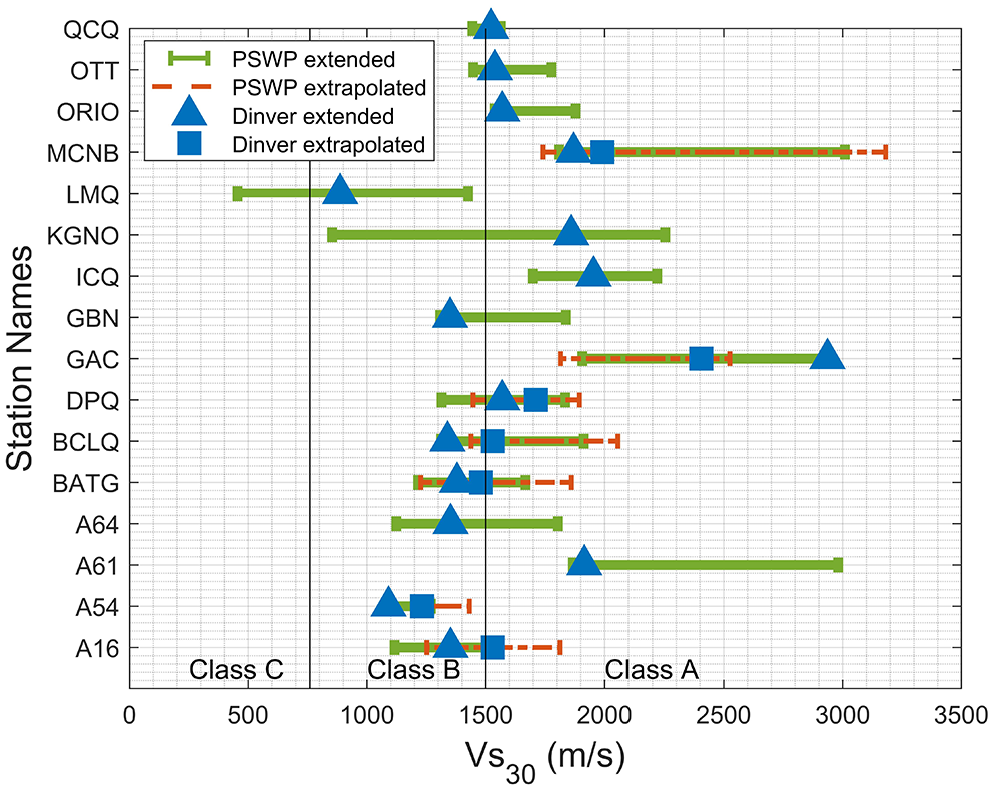
Figure 10 displays average VSz profiles for all 16 stations calculated using the inverted VS profiles from both Dinver and PSWP; Supplemental Figure A23 in the electronic supplement shows the inverted station-appropriate VS profiles in the same format as Figure 10. The inverted optimal rock VS profile from Dinver is used to calculate the optimal VS30 for the seismograph station. The mean VS30 and its SD is calculated from a subset of 10,000 PSWP inverted VS profiles (Molnar et al., 2014). For stations with a rock penetration depth of 30-m depth or more, the station VS profile is used to calculate VS30. When the penetration depth into rock is less than 30 m (black dashed line in Figure 10), VS30 is calculated in two ways, by extending the base rock VS to 30 m (provides a lower VS30 bound) or by extrapolation using Equation 2 from Boore et al. (2011) based on z reported in Table 5 for each station (provides an upper VS30 bound).
Station appropriate (rock only) optimal Dinver VSz profile (solid blue line) and mean PSWP VSz profile (solid orange line) with 1 SD (dashed lines) are shown for 16 stations. Measured rock penetration depth limit of inverted VS profile is shown by the black dashed line. Extended and extrapolated VS30 estimates are plotted with triangle and square symbols, if applicable.
The station appropriate calculated optimal and mean VS30 (with 1 SD) for all 16 stations are reported in Table 6 and summarized in Figure 11. The site class designation A/B refers to an optimal or mean VS30 within Site Class A (>1500 m/s) and its SD spans into Site Class B (760 > VS30 ≤ 1500 m/s), similarly for site class designations B/A and B/C. Of the 16 stations, 9 (56%) correspond to Site Class A, whereas the remaining 7 stations correspond to Site Class B based on the optimal VS30 (extended, if required). The average VS30 and 1 SD of the 16 Eastern Canada seismograph station is 1590 ± 465 m/s (extended optimal VS) or 1615 ± 355 m/s (extrapolated optimal VS). Hence, the hard rock Site Class A assumption is correct, on average. Our Eastern Canada average VS30 value for rock sites is consistent with the 2020 NBCC mean VS30 of 1600 m/s for Site Class A. An assumed VS30 of 2000 m/s is above 1 SD of our average rock VS30 and is therefore too high. Uncertainty in VS30 is relatively high, over 350 m/s and over a COV of 0.22, at these high VS30 values. When this relatively large uncertainty in VS30 is considered, only 5 stations entirely correspond to Site Class A. Since VS30 for 9 stations is closer to the 1500 m/s Class A–B boundary, the determined site class is technically A/B or B/A. Notably, two stations (A54, LMQ) correspond to Site Class B or B/C. It is these latter two stations which do not agree with a hard rock (site class A) assumption. For the 16 Eastern Canada seismograph stations, we recommend that the end-user report or use the optimal VS30 value in Table 6 for the station. VS30 should be rounded to the nearest 5 m/s. Eight of the stations have ready-to-use Vs30 values having met the 30-m resolution limit (noted by an asterisk in Table 6). When applicable, it is recommended to report or use the extrapolated VS30 (listed second per site in Table 6) as it is more accurate than the extended Vs30. For seismic design code purposes, an engineer may prefer to use the more conservative extended VS30 value (listed first per site in Table 6). In addition, the end-user shall report or use the determined standard deviation in VS30 for the station with the optimal VS30; the larger SD from either extending or extrapolating the VS profiles should be used.
Station appropriate VS30 estimates
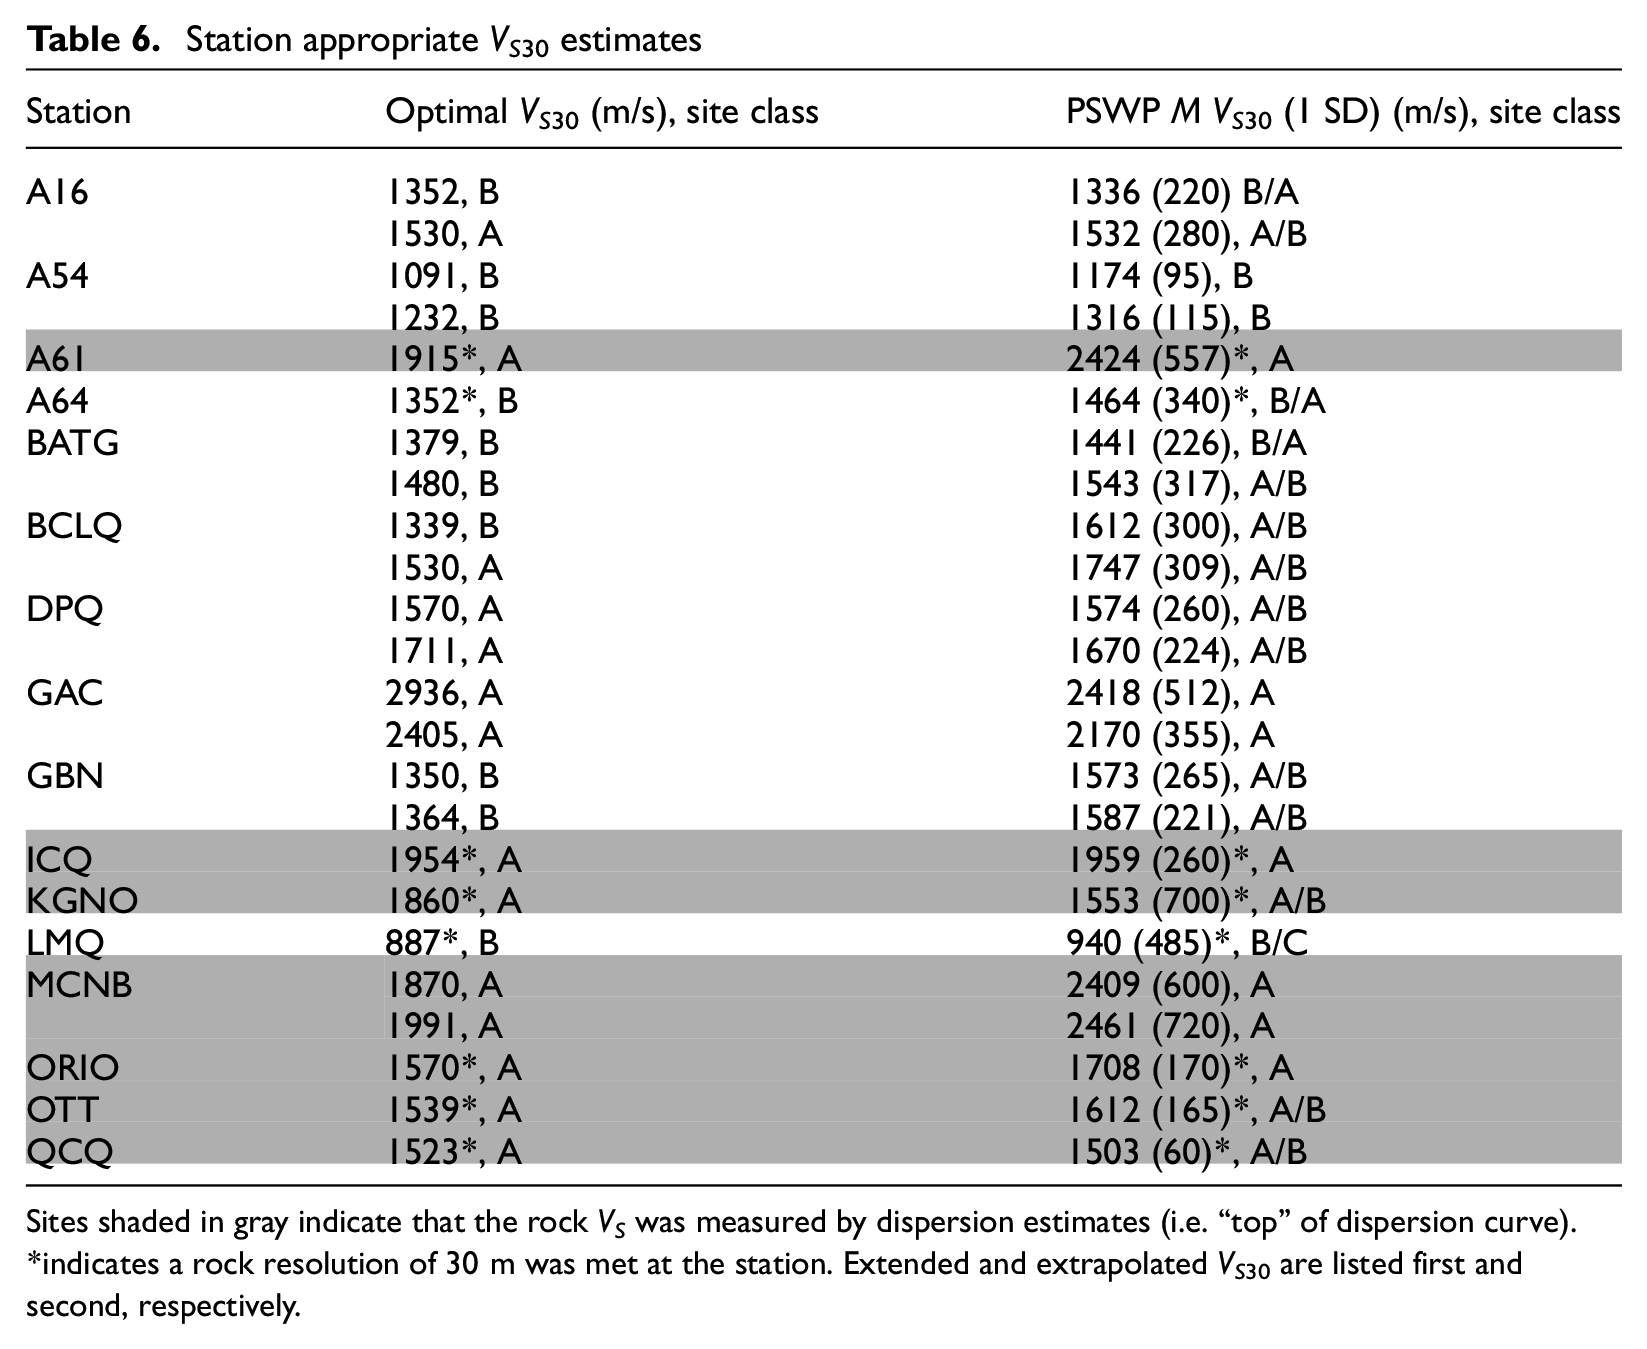
Sites shaded in gray indicate that the rock VS was measured by dispersion estimates (i.e. “top” of dispersion curve). *indicates a rock resolution of 30 m was met at the station. Extended and extrapolated VS30 are listed first and second, respectively.
Station appropriate VS30 estimates from Dinver extrapolated (square) and extended (triangle) VSz profiles and PSWP extrapolated (dashed) and extended (solid) VSz profiles.
Figure 12 summarizes VS30-based site classes according to geologic age of each station’s rock. Regardless of rock age, stations vary among Site Classes A and B and in between (i.e. A/B). The majority of stations placed on Precambrian rocks typically have a VS30 > 1500 m/s or Site Class A, as assumed. Stations on Precambrian rock may also correspond to Site Class B or B/C. Stations on Paleozoic rocks correspond to Class A or Class B, but dominantly have VS30 at the Class A–B boundary of 1500 m/s (Class A/B or B/A). Figure 12 shows there is more variability in site class for stations on Precambrian rock compared with Paleozoic rock.
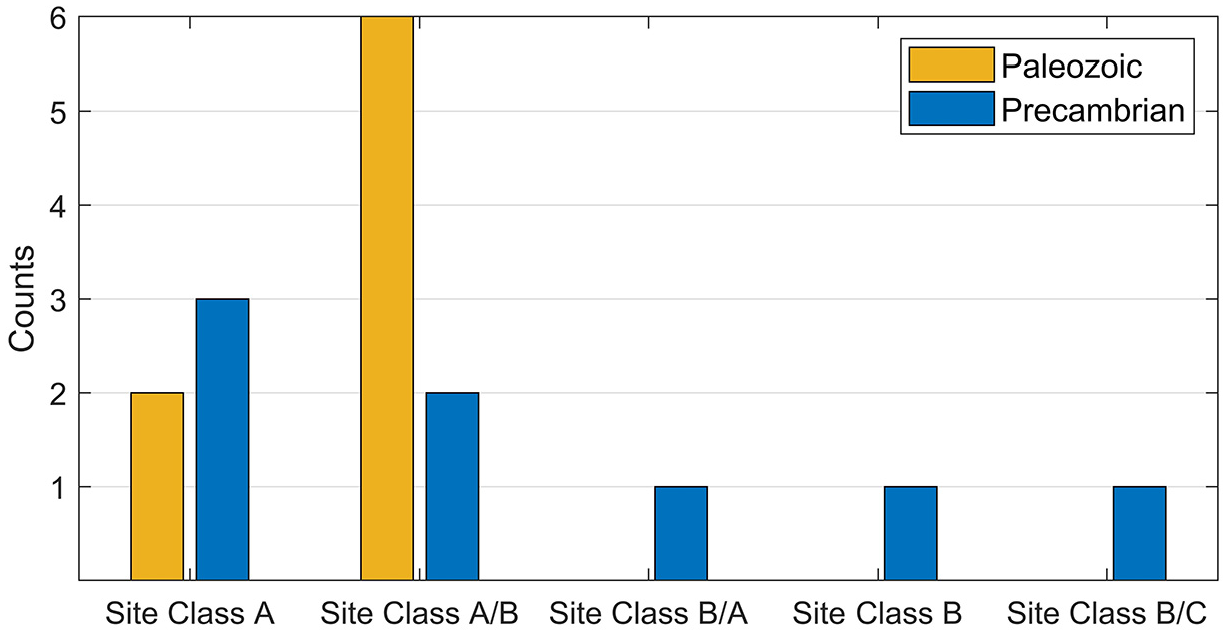
Summary of extrapolated VS30 site class by rock age.
Refraction VP profiles and Poisson’s ratio
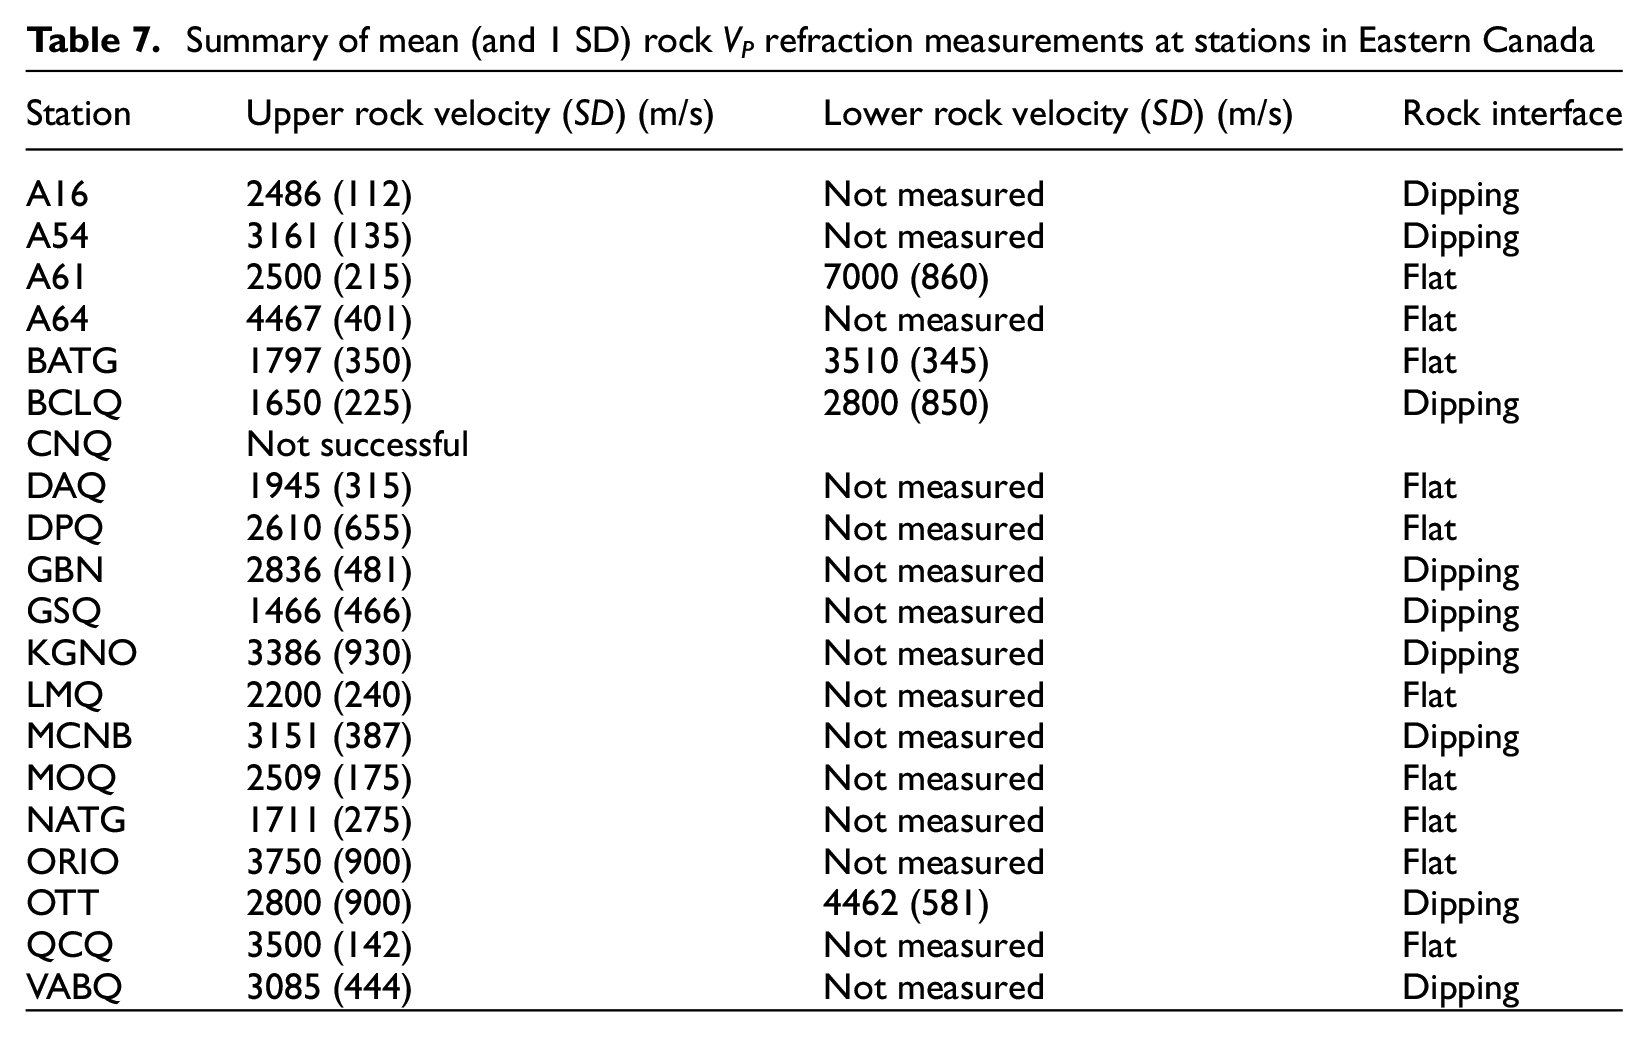
VP refraction data was collected with similar equipment and array setup as MASW at each station. VP refraction testing included a higher sampling frequency varying from 2000 to 8000 Hz, dependent on site. With the use of a trigger switch, five hammer-impact source signals were stacked for both forward and reverse shot gathers. The estimated VP was determined for each layer (linear slope break) from refraction travel-time analysis of each shot gather. For 11 stations, direct P-wave arrivals in lower velocity (<1500 m/s) near-surface material were measured. For station CNQ, reliable travel-time picks were not obtained. VP refraction was successful at 19 of 20 stations (95% success rate) and is the most successful in situ method used to consistently obtain rock velocity.
Table 7 summarizes our refraction VP profiles for rock at each seismograph station. Complexities were observed at sites containing dipping interfaces. A dipping interface was interpreted from variation in VP and source offsets at the front and end of the seismic survey. We calculate a mean VP with 1 SD for upper and lower rock, that is, two-layer rock VP profile, averaged from travel-time analysis of all shot gathers from smaller and larger sized arrays, respectively. The average refraction VP of the upper rock unit across all stations measured in Eastern Canada is 2684 m/s (800 m/s standard deviation). The refraction VP estimates in Table 7 were used to update default VP parameter limits in inversions, if applicable. Rock sample VP measurements were also accomplished using laboratory ultrasonic wave transmission on samples obtained at 3 stations (Ladak, 2020). Intact rock sample VP measurements were approximately two times higher than our in situ refraction VP measurements.
Summary of mean (and 1 SD) rock VP refraction measurements at stations in Eastern Canada
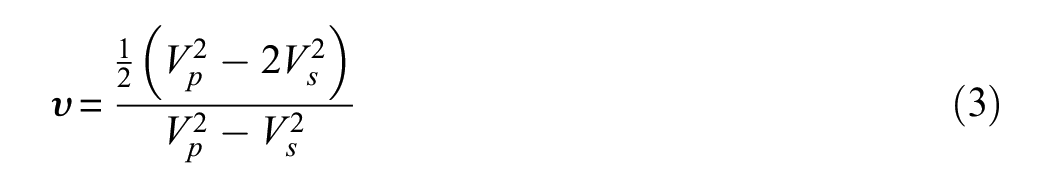
Poisson’s ratio (υ) was calculated using Equation 3 for rock at applicable Eastern Canada seismograph stations (Table 8) with our determined rock VP and VS (Tables 4 and 7, respectively) estimates according to Poisson (1828) as follows:
Calculated Poisson’s ratio for Eastern Canada stations
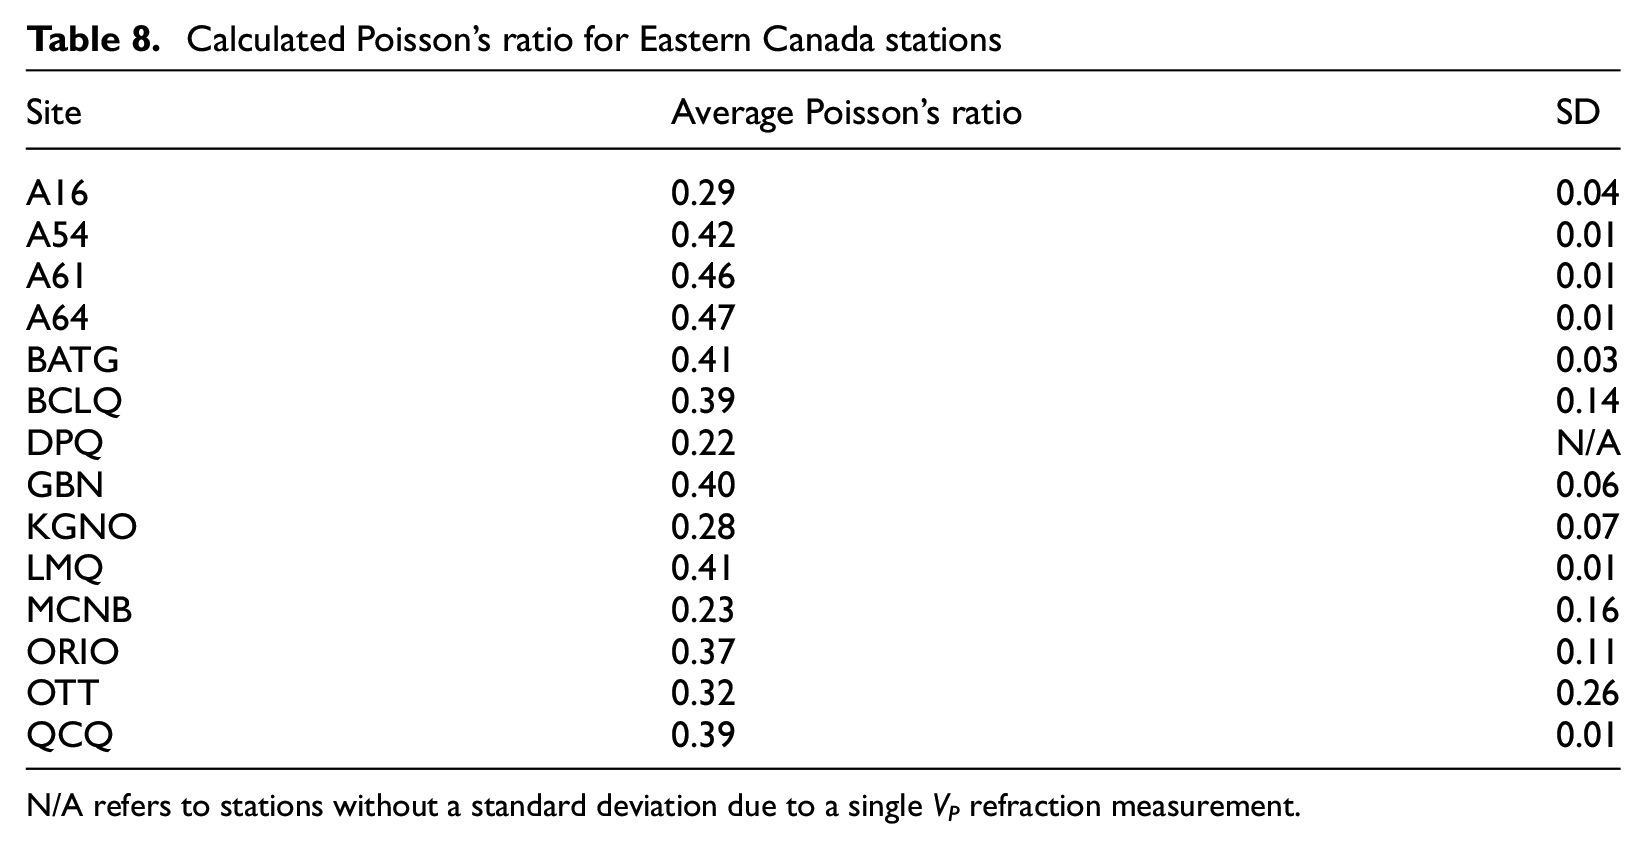
N/A refers to stations without a standard deviation due to a single VP refraction measurement.
Calculations were made using the optimal rock VS and the refraction VP based on 14 measurements. The average Poisson’s ratio (and 1 SD) calculated for stations in Eastern Canada is 0.36 (0.080). The NGA East project (Hashash et al., 2014) determined the average (and 1 SD) Poisson’s ratio for CENA reference rock to be 0.28 (0.025) with values ranging from 0.24 to 0.33. Our Poisson’s ratio value for Eastern Canada seismograph stations is slightly higher than that determined by Hashash et al. (2014) for CENA reference rock, because our VS values are lower. It is expected that reference (stable crust) rock would have a lower Poisson’s ratio than determined for our near-surface rock sites.
Conclusion and future work
This study incorporated a multi-method approach to characterize 25 seismograph stations situated on assumed hard rock (Site Class A) in Eastern Canada. Multiple in situ seismic methods were used to characterize the station’s rock velocities using noninvasive active- and passive-source methods and active P-wave refraction. Dispersion estimates from AVA testing were obtained at 7 of 23 stations (30%) and inverted rock VS is constrained by (the “top”) dispersion estimates at all 7 stations. Dispersion estimates were obtained at all 23 stations using MASW with lower VS of surficial soils measured at 7 of these stations. For the other 16 stations, MASW dispersion estimates included the transition to rock velocity and/or could be combined with AVA for inversion. VP refraction was successful in providing rock VP at 19 out of 20 stations. Active MASW and VP refraction had the highest success rate in acquiring estimates of the station’s rock velocities. Passive methods were less successful but included the important low-frequency (“top”) portion of the dispersion curve which is a measure of the station’s rock velocity. Supplemental Table A2 in the electronic supplement summarizes the multi-method results for all stations including average rock VS, site classification according to VS30 and site period (HVSR amplification), VP profile, and Poisson’s ratio.
The use of an in situ multi-method approach is encouraged to acquire proper and robust site characterization of rock sites. It is recommended to revisit the Eastern Canada seismograph stations, as well as all other CNSN stations in Eastern Canada to perform VS refraction and Love-wave MASW dispersion measurements to acquire the rock VS and further constrain VS30. Rock velocities were measured through dispersion estimates at stations A61, ICQ, KGNO, MCNB, ORIO, OTT, and QCQ. Acquiring reliable VS measurements at stations where rock phase velocities were not acquired is highly recommended. VP refraction was only unsuccessful at station CNQ. MHVSRs are recommended to be reperformed at stations where spurious environmental noise (e.g. MOQ, A11) was evident to obtain a measure of the station’s HVSR amplification.
Our study highlights the importance and difficulty of in situ VS measurements at rock sites to acquire a constrained VS30 value and associated site classification. CENA seismograph rock stations with in situ measured VS30 estimates represent <2% of the NGA-East station database. An increased and concerted effort is required to properly characterize rock sites in Eastern Canada and CENA to confirm the general assumption of hard rock Site Class A (VS30∼ 2000 m/s). We demonstrate that the majority of our stations correspond to Site Class A but some stations also have a probability of Site Class B (A/B or B/A), and notably that two stations are softer (Site Class B and B/C) than the hard rock assumption. We conclude the default hard rock Class A assumption is correct with a mean VS30∼ 1600 m/s (1 SD of ∼400 m/s) for 16 Eastern Canada seismograph stations; an assumed VS30 of ∼2000 m/s is likely too high. An alternative site classification scheme based on measured HVSR amplification (MHVSR and/or EHVSR) taught us that (1) flat amplification (Class V) expected for hard rock sites does occur in nature but should not be assumed (85% of stations, not 100%) and (2) hard rock sites have distinguishable variability in amplification (Classes V–VII). Therefore, HVSR amplification is a viable option for site classification of rock sites in addition to, or in replacement of, VS30 in future Canadian seismic design codes.
Supplemental Material
sj-pdf-1-eqs-10.1177_87552930211001076 – Supplemental material for Multi-method site characterization to verify the hard rock (Site Class A) assumption at 25 seismograph stations across Eastern Canada
Supplemental material, sj-pdf-1-eqs-10.1177_87552930211001076 for Multi-method site characterization to verify the hard rock (Site Class A) assumption at 25 seismograph stations across Eastern Canada by Sameer Ladak, Sheri Molnar and Samantha Palmer in Earthquake Spectra
Footnotes
Acknowledgements
The authors thank Melanie Postman (NSERC USRA student) for field data collection support and Fredrick Jackson (MSc graduate) for preliminary refraction travel-time analysis. They also thank Natural Resources Canada for providing permission, access, and location information for the station visits. They are indebted to the individuals and agencies that provided access to the stations on their property. Collaborative discussions with Dr Gail Atkinson also improved the research. The manuscript was greatly improved from insightful comments from two anonymous reviewers.
Data and resources
Signal processing was completed with the Geopsy software (version: 20170109; http://www.geopsy.org); MATLAB (version R2018a) was used to generate relevant plots (http://www.mathworks.com); Arcmap version 10.6 was used to create relevant maps (![]() ); and Python (v. 3.6.5) was used to convert SEGY data to miniSEED for MASW processing.
); and Python (v. 3.6.5) was used to convert SEGY data to miniSEED for MASW processing.
Declaration of conflicting interests
The author(s) declared no potential conflicts of interest with respect to the research, authorship, and/or publication of this article.
Funding
The author(s) disclosed receipt of the following financial support for the research, authorship, and/or publication of this article: We acknowledge funding support of the Canadian Nuclear Safety Commission (CNSC) and the Natural Sciences and Engineering Research Council of Canada (NSERC) (RGPIN-2016-04634).
Supplemental material
Supplemental material for this article is available online.
References
Supplementary Material
Please find the following supplemental material available below.
For Open Access articles published under a Creative Commons License, all supplemental material carries the same license as the article it is associated with.
For non-Open Access articles published, all supplemental material carries a non-exclusive license, and permission requests for re-use of supplemental material or any part of supplemental material shall be sent directly to the copyright owner as specified in the copyright notice associated with the article.