
Abstract
This study deals with selecting optimal seismic retrofit solutions for reinforced concrete (RC) buildings. To this aim, multi-criteria decision-making (MCDM) is implemented explicitly considering earthquake-induced economic loss as a decision criterion. Fragility (i.e. likelihood of damage levels vs intensity measure (IM) levels) and vulnerability (i.e. likelihood of loss levels vs IM levels) relationships are derived by using three increasingly refined analysis methods: Simple Lateral Mechanism Analysis; numerical pushover; time-history analysis. A seismically deficient RC school index building, with construction details typical of developing countries, is used for illustrative purposes. Concrete jacketing, addition of concrete walls, and addition of steel braces are the considered retrofit alternatives. Intensity-based expected loss and expected annual loss are adopted in the MCDM, among other criteria, independently derived with the three analysis methods. It is shown that, given the adopted loss-analysis methodology, the ranking of the retrofit alternatives is insensitive to both analysis methods and loss metrics, even when the weight for the seismic loss criterion is high. These findings suggest that simplified methods can be effectively employed in the conceptual/preliminary design of retrofit alternatives.
Keywords
Introduction and motivations
In earthquake-prone regions, the seismic capacity of existing structures is often inadequate to sustain the expected earthquake demand. In fact, most of the existing buildings are designed according to pre-seismic codes (i.e. they are underdesigned), if any. For communities aiming to achieve seismic resilience, increasing seismic structural (and non-structural) performance is especially important. Structural retrofit is an effective strategy to realize this, by reducing physical fragility and vulnerability of the considered structures.
When dealing with seismic retrofit of seismically deficient structures, the effective reduction of seismic fragility (and, in turn, of seismic risk) should play a major role. For a desired reduction of the structural fragility/risk, the optimal decision among various retrofit strategies/techniques available in the common practice (Sugano, 1996) is usually based on various criteria. Along with cost–benefit considerations, for example, Liel and Deierlein (2013), criteria such as the invasiveness of the retrofit alternative, the duration of the works (i.e. the disruption to the building use), among others, are of special interest.
Multi-criteria decision-making (MCDM) analysis represents an effective tool supporting decisions, allowing a decision-maker (DM) to select the (often conflicting) criteria that will drive the decision and quantitatively define the relative importance of each of them according to his or her subjective preferences. This allows one to systematically compare alternatives based on the selected criteria and their relative weights. Moreover, MCDM can provide enough flexibility to deal with subjective decisions depending on the personal preferences of the DM, social/political constraints, and so on.
The selection of the optimal seismic retrofit among two or more alternatives on the basis of a finite number of criteria is a multiple-attribute decision-making (MADM) problem, a branch of the MCDM approaches. Examples of those are the weighted sum model (Fishburn, 1967), the weighted product model (Bridgman, 1922; Miller and Starr, 1969), the Elimination et Choix Traduisant La Realité (ELECTRE; Benayoun et al., 1966), the Multi-Attribute Utility Theory (MAUT; Edwards and Newman, 1982), the Preference Ranking Organization Method for Enrichment Evaluations (PROMETHEE; Brans and Vincke, 1985), the Viskriterijumska Optimizacija I Kompromisno Resenje (VIKOR; Oprivic, 1998), the Analytic Hierarchy Process (AHP; Saaty, 1980), and the Technique for Order Preference by Similarity to an Ideal Solution (TOPSIS; Hwang and Yoon, 1981).
The relevant literature indicates that no single approach is generally superior, and the selection of a method depends on the specific problem, for example, Caterino et al. (2009). Among those methods, the joint adoption of the TOPSIS and the AHP is deemed to be the best option for MADM problems (e.g. Rao and Davim, 2008), since those provide a complete ranking of each considered alternative in each criterion and require the minimum number of parameters to be set by the DM.
First, the relative importance of each criterion (weights) is determined with the AHP. This is a mathematical procedure that reduces such a complex decision to a series of one-on-one (i.e. pairwise) comparisons among the criteria, providing a clear rationale for the decision. Therefore, a score (quantitative or qualitative) is assigned to each alternative solution, in each of the selected criteria, which are normalized and weighted. According to the TOPSIS procedure, the optimal retrofit alternative is defined as the one having the shortest Euclidean distance from an ideal solution, which is defined using the maximum score for each criterion.
The suitability of such approach for retrofit selection problems has been confirmed in Caterino et al. (2008, 2009), which provide methodological grounds for the application of the method to such problems. In those studies, MCDM is applied for the selection of the optimal retrofit solution for a case study RC building. However, several simplifying working assumptions are used by the authors. The seismic performance is not controlled in the retrofit design, leading to alternatives resulting in different nominal damage states (DSs) for the same value of the ground motion intensity measure (IM). To account for such differences, seismic risk is considered as a criterion in the MCDM. In their work, risk is simplistically defined as the exceeding probability of a capacity peak ground acceleration (PGA), according to a hazard model implemented in the building code. The capacity PGA is finally based on a pushover analysis and a code-based elastic spectrum.
An attempt to address these shortcomings is presented in this article. First, it is proposed to design different retrofit alternatives ensuring the same nominal DS for a given seismic demand (i.e. a performance-based approach is used). To achieve such a goal, the direct displacement-based design (DDBD; Priestley et al., 2007) is adopted herein. This allows removing the nominal seismic performance from the MCDM criteria. On the other hand, seismic economic loss is instead considered an explicit criterion (to minimize), since such a parameter is deemed to be fundamental in a modern design that goes beyond the life safety performance. Depending on the specific requirements of the risk assessment application, different loss metrics (e.g. expected casualties or downtime) can be considered with no modification to the overall procedure.
Moreover, simplified procedures to calculate earthquake-induced losses are available in the literature. A remarkable example is the code-based approach in the Italian guidelines for seismic risk classification of constructions (Cosenza et al., 2018), which also define the technical principles to exploit tax deductions (Sismabonus) related to seismic retrofit. This approach only requires performing a pushover analysis, assuming, in a simplistic way, that the mean annual frequency (MAF) of exceeding a DS is equal to the MAF of exceeding the PGA related to that DS (derived on the pushover). To overcome this simplified approach, it is proposed here to calculate seismic fragility/vulnerability for the different retrofit alternatives considering a large suite of unscaled, natural ground motion records. Typically, this requires running a refined numerical time-history analysis for each selected ground motion to build a probabilistic seismic demand model (e.g. through cloud-based or incremental dynamic analysis procedures) and derive fragility and vulnerability relationships. It is recognized, however, that the required computational effort (and modeling challenges) for time-history analysis might be unjustified at such a preliminary/conceptual retrofit design phase in which many retrofit alternatives might be tested.
Based on this discussion, it is proposed here to use less complex structural analysis methods as an alternative to non-linear time-history analysis. In particular, force–displacement capacity curves are derived using both numerical pushover analyses and the analytical approach “Simple Lateral Mechanism Analysis (SLaMA)” (Gentile et al., 2019a, 2019c, 2019d, 2019e; New Zealand Society for Earthquake Engineering (NZSEE), 2017). The capacity spectrum method (CSM; Freeman, 1998), adopting a suite of real records, is applied using such curves, therefore deriving building-level fragility (continuous relationship between a ground motion IM and the probability that the specified structure will reach or exceed predefined DSs) and vulnerability curves (continuous relationships between a ground motion IM and the probability distribution of consequences/loss). Such curves allow to produce inputs to the MCDM analysis.
Apart from single-building applications, the overall framework could also be used to derive retrofit guidelines/prioritization scheme for homogeneous building classes, supporting (limited) resource allocation. In such portfolio applications, epistemic uncertainty on geometry, materials, and structural details should in general be considered, together with building-to-building variability. However, these may be neglected if average loss quantities are adopted as a criterion in the MCDM. In fact, as shown in Silva (2019), the mean loss ratio (LR; i.e. the ratio of the repair-to-reconstruction cost) for a given intensity measure
The proposed framework for optimal retrofit selection (shown in Figure 1) is demonstrated for a seismically deficient RC school archetype building (step 0), with construction details typical of developing countries in Southeast Asia, for which real field-data are available (Gentile et al., 2019a; D’Ayala et al., 2020). Seismic response analysis of the as-built structure (step 1) is carried out through SLaMA combined with the CSM. A number of retrofit alternatives are designed and analyzed (step 2): RC column jacketing, addition of RC walls, addition of steel braces for this example. The results of the seismic response analyses are used to derive fragility relationships for both the as-built and the retrofitted configurations (step 3). Simulation-based probabilistic seismic hazard analysis (PSHA) is implemented to calculate the hazard curves (in terms of optimal, state-of-the-art IMs; step 4). With the results of steps 3 and 4, two loss-related metrics are calculated (step 5): intensity-based expected loss (related to the design-level ground motion) and expected annual loss (EAL). The criteria for the MCDM are selected (including the calculated loss metrics) and quantified (step 6). The optimal retrofit solution is finally selected (step 7). It is worth mentioning that the proposed seismic response analysis method is based on SLaMA and the CSM. The numerical pushover and time-history analysis methods are used for validation purposes, discussing the sensitivity of the optimal solution to both the analysis method and the selected loss metric.
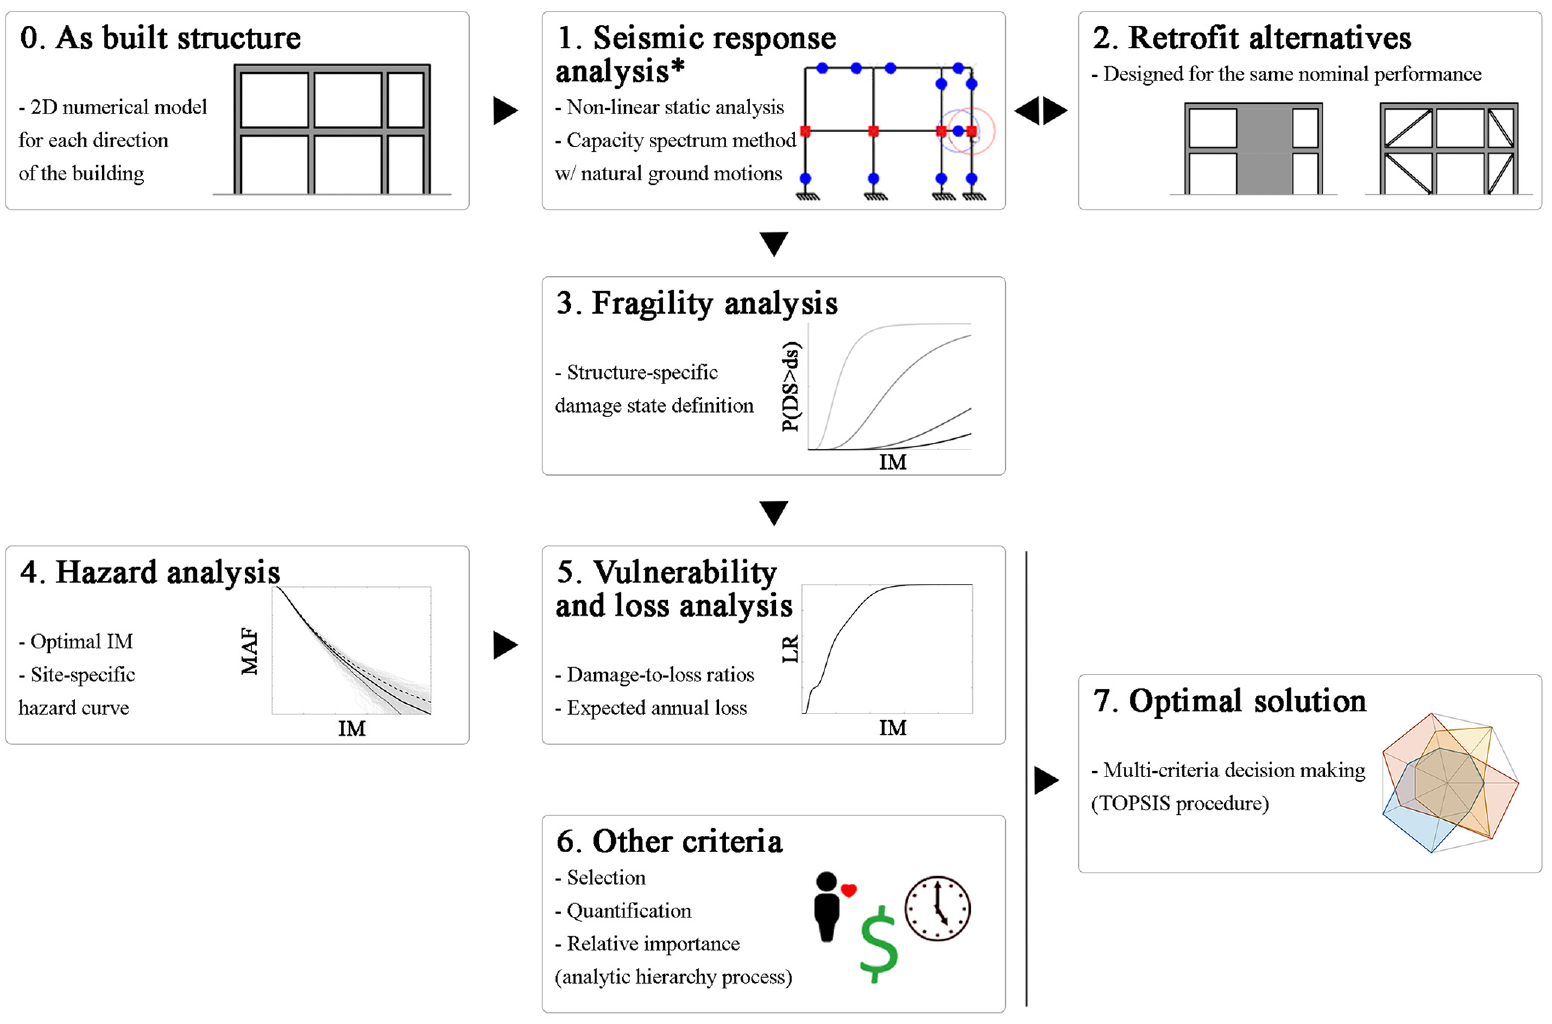
Proposed optimal retrofit selection framework.
Methodology
Seismic response analyses
The as-built and the three retrofitted configurations of a case-study (index) building are analyzed to derive a cloud of points in the engineering demand parameter (EDP) vs IM space. Maximum inter-story drift is the selected EDP; it is a convenient proxy highly correlated with (non-)structural damage and repair costs. The selected IM is defined as the geometric mean
The resulting EDP for each ground motion is independently computed using three different methods. Non-linear time-history analyses, representing the benchmark method, are first carried out for a refined numerical model defined using finite element software Ruaumoko (Carr, 2016). It is worth noting that this response analysis method is adopted herein only for validation purposes, and any non-linear static method is instead proposed within the optimal retrofit selection framework. Separate two-dimensionl (2D) models are assembled for the transverse and longitudinal directions. The modeling strategy (Figure 2) is based on an experimentally validated lumped plasticity approach which allows predicting flexural, bar slip, and shear failure of RC beams and columns, along with strength degradation and possible shear failure in the joint panels. The revised Takeda hysteresis (Saiidi and Sozen, 1979) is adopted for beams and columns, with the columns having a thinner loop. Beam-column joints are consistent with the modified Sina model (Saiidi and Sozen, 1979), which allows considering a pinching behavior. More details can be found in Del Vecchio et al. (2018).
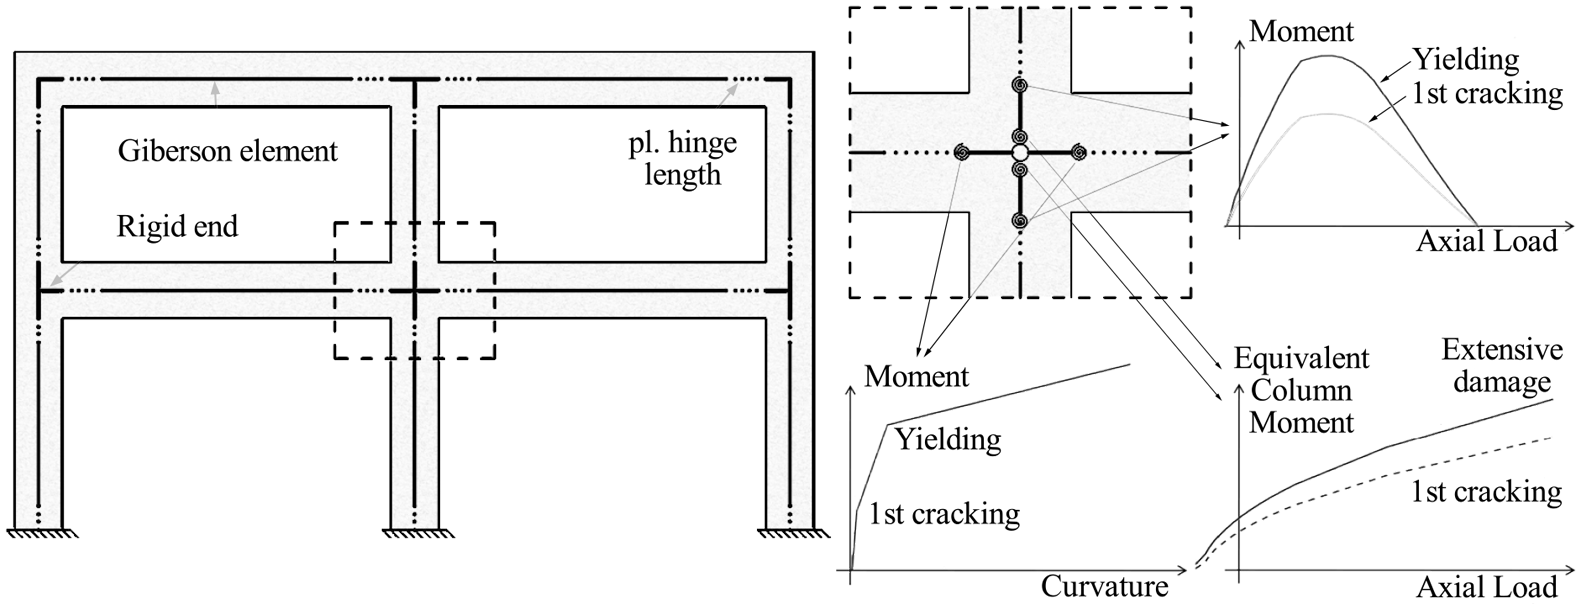
Numerical modeling strategy (Gentile et al., 2019a).
The same numerical model is used as an input for pushover analyses, to derive force–displacement curves. The CSM (Freeman, 1998) is applied to calculate the maximum inter-story drift for each natural ground motion and derive EDP vs IM pairs. It is worth mentioning that the CSM is carried out adopting the equivalent viscous damping formulation provided in Priestley et al. (2007).
Finally, a bi-linear force–displacement capacity curve is derived with SLaMA (Gentile et al., 2019a, 2019c, 2019d, 2019e; NZSEE, 2017), which is combined with the CSM to derive the EDP vs IM cloud. This analytical, “by-hand,” method (Figure 3) allows one to define a rapid estimate of the capacity curve and expected plastic mechanism of RC frames, walls or dual systems, also identifying structural weaknesses in the structure. It can be implemented using a simple spreadsheet. For bare frames, each beam and column is characterized considering its weakest failure mechanism (flexure, bar buckling, lap splice, shear); beam-column joint subassemblies are analyzed to determine their hierarchy of strength and identify the overall plastic mechanism; the results of each subassembly are combined by means of equilibrium and compatibility to derive a global capacity curve compatible with the identified plastic mechanism.
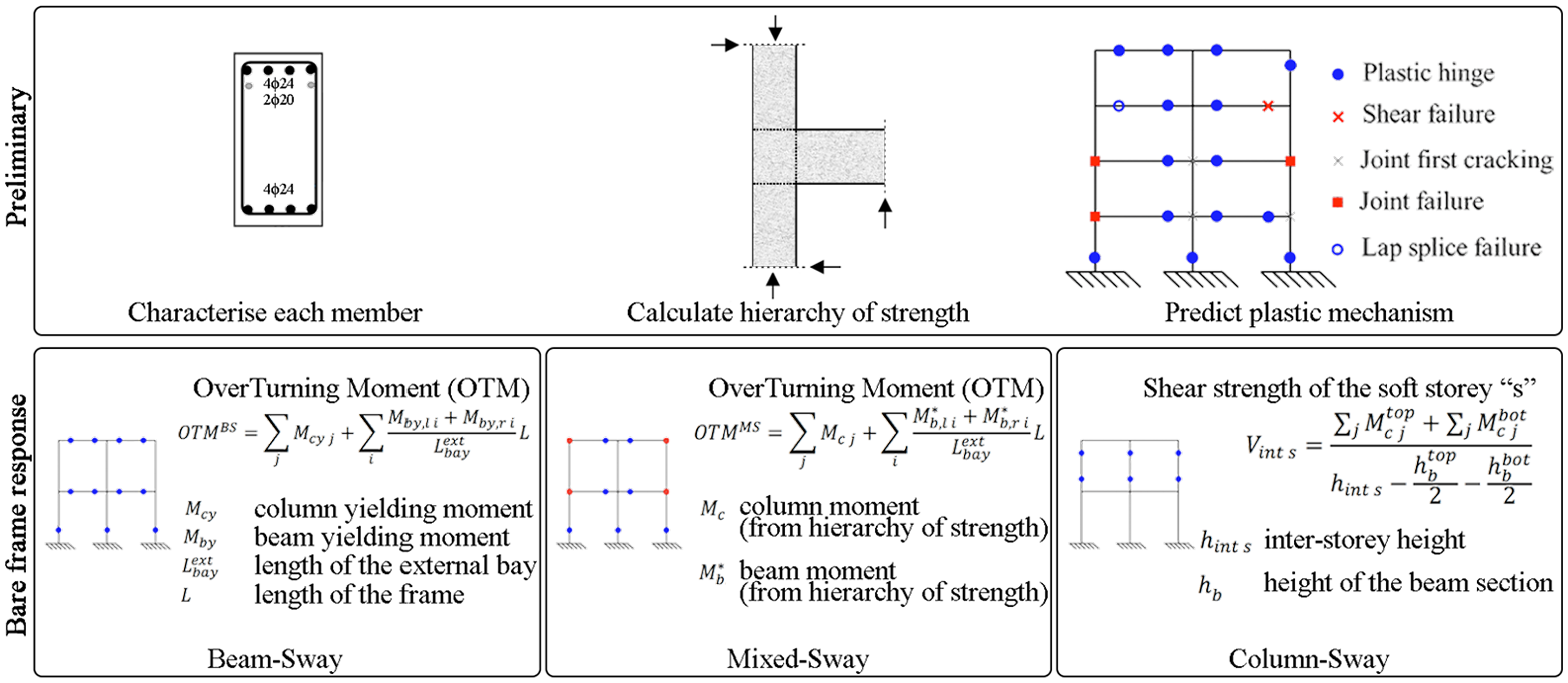
Overview of SLaMA for bare frames. Modified after Gentile et al. (2019c).
Seismic fragility and vulnerability assessment
For this study, building-level fragility relationships are calculated for a set of structure-specific DSs. The cloud of points resulting from the analyses is partitioned into two subsets: the “collapsed (C)” cases, corresponding to ground motions leading to dynamic instability of the analysis or exceedance of a conventional 10% drift threshold; and the “non-collapsed (NoC)” cases, corresponding to ground motions not leading to collapse. Equation 1 describes the derivation of the fragility functions, where

The linear least square method is applied on the “NoC”EDP-IM pairs to derive the commonly used power-law probabilistic seismic demand model
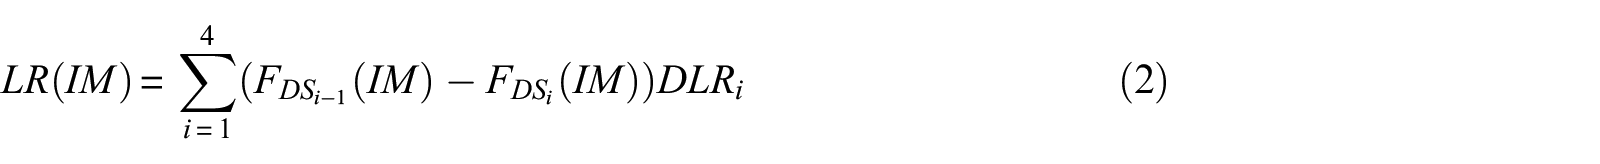
Vulnerability curves are derived using a building-level consequence model relating the repair-to-reconstruction cost to structural and non-structural DSs. Such model requires the definition of the expected building-level damage-to-loss ratios (DLRs) for each DS. The (mean) LR for a given value of the IM is defined according to equation 2, resulting in a vulnerability relationship.
It is worth mentioning that building-level DLRs are generally deemed appropriate for assessing earthquake-induced losses of building portfolios consisting of various building typologies. More advanced, component-based (as opposed to building-level), loss estimation procedures are now available for building-specific applications (e.g. Federal Emergency Management Agency, 2012; Ramirez and Miranda, 2009; Yang et al., 2009). Combining building-specific fragility curves and simplified DLRs as a basis for the loss estimation of a single building could represent an inconsistency. However, this is not the intended use herein. The proposed framework relies on a simplified loss estimation method only to identify the optimal retrofit strategy, while more refined procedures (e.g. Federal Emergency Management Agency (FEMA) P-58) are recommended to compute the loss for the optimal solution only, thus effectively reducing the analysis effort. One of the main findings of this study is that, given the adopted loss-analysis methodology, the ranking of the retrofit alternatives is insensitive to the considered response analysis methods. Further investigations, currently undertaken by the authors, are needed to investigate if the optimal retrofit strategy obtained through the proposed MCDM analysis is also insensitive to the loss estimation procedure.
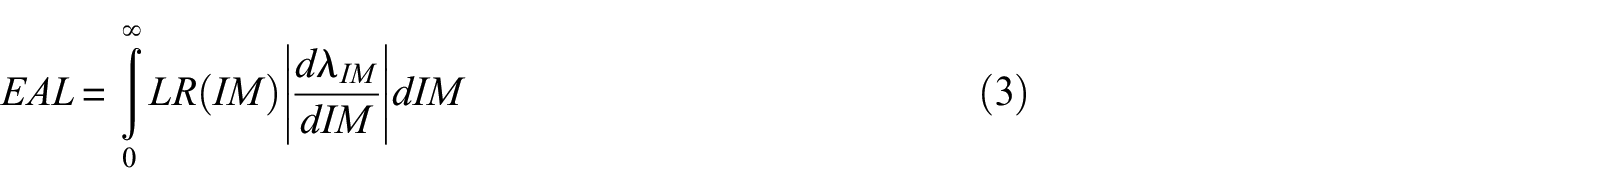
Two loss metrics are independently used in the MCDM: the (mean) LR corresponding to the design-level ground motion; and the EAL. Adopting a hazard curve (see the following section), the latter is calculated according to equation 3, where
Seismic hazard modeling
The proposed MCDM approach requires two inputs related to seismic hazard at the site of interest: a design-level acceleration and a displacement spectrum, to design the retrofit alternatives; and a hazard curve, expressing the MAF of exceeding an IM value, to calculate loss metrics. Depending on the site location, both inputs are generally available (also online) in the majority of the international seismic codes, such as ASCE 7-16 (American Society of Civil Engineers (ASCE), 2016) or the national annexes of Eurocode 8 (European Committee for Standardisation (CEN), 2005). Therefore, no specific calculation is required from the user.
If a more accurate definition of the hazard curve is needed (for instance, in terms of more advanced IMs), or code-based information is not available, a PSHA is needed. In this exercise, this is based on Monte Carlo simulation (Assatourians and Atkinson, 2013) to account for uncertainty in all the factors affecting ground motions at a given site. Specifically, a synthetically generated set of potential earthquakes, with their temporal and geographical distribution, is developed by drawing random samples from the assumed PSHA model components (and related probability distributions), that is, source zone geometries and magnitude-recurrence parameters and maximum magnitude. The details of the source characterization for a case study fault are given in relation to the illustrative application. The generated catalog has a duration of 25,000 years. For each record, 500 realizations of the considered ground motion IM
MCDM
Each considered retrofit technique can be evaluated according to different criteria, which may give different perspectives to the same technical solution. To have a rational and mathematically consistent definition of the weights for the various criteria, the AHP (Saaty, 1980) is performed. According to this procedure, the user expresses an opinion on every possible pairwise comparison among the criteria (21 comparisons in the example, shown below). Each of those is a linguistic phrase subsequently converted into a number between 1/9 and 9. For example, if parameters
The evaluation of each retrofit alternative according to the different criteria can be either quantitative or qualitative. In the former case, some calculation is usually needed to evaluate a criterion (e.g. calculation of the retrofit costs). Instead, qualitative criteria (e.g. need for specialized labor) should be expressed as numerical values to be an input of the TOPSIS MCDM. To accomplish this, the AHP can be used expressing the relative performance of each alternative with respect to the considered qualitative criterion. The calculated “weights” are therefore used as numerical evaluation in the TOPSIS.
The evaluations of each criterion and each retrofit alternative
Illustrative application
Description of the case study
The case study structures selected for this study represent seismically deficient RC school buildings typical of developing countries in Southeast Asia. In fact, this building typology is defined based on large data collection exercises (D’Ayala et al., 2020; Gentile et al., 2019a) involving rapid visual surveys for over 200 school buildings to collect administrative, geometric, and mechanical data. The resulting archetype building represents approximately 80% of the surveyed schools. It is a two-story rectangular frame with ten longitudinal bays and three transverse ones. Its geometrical dimensions are defined as the most frequent values of the statistical distributions fitted for the collected data (Figure 4).
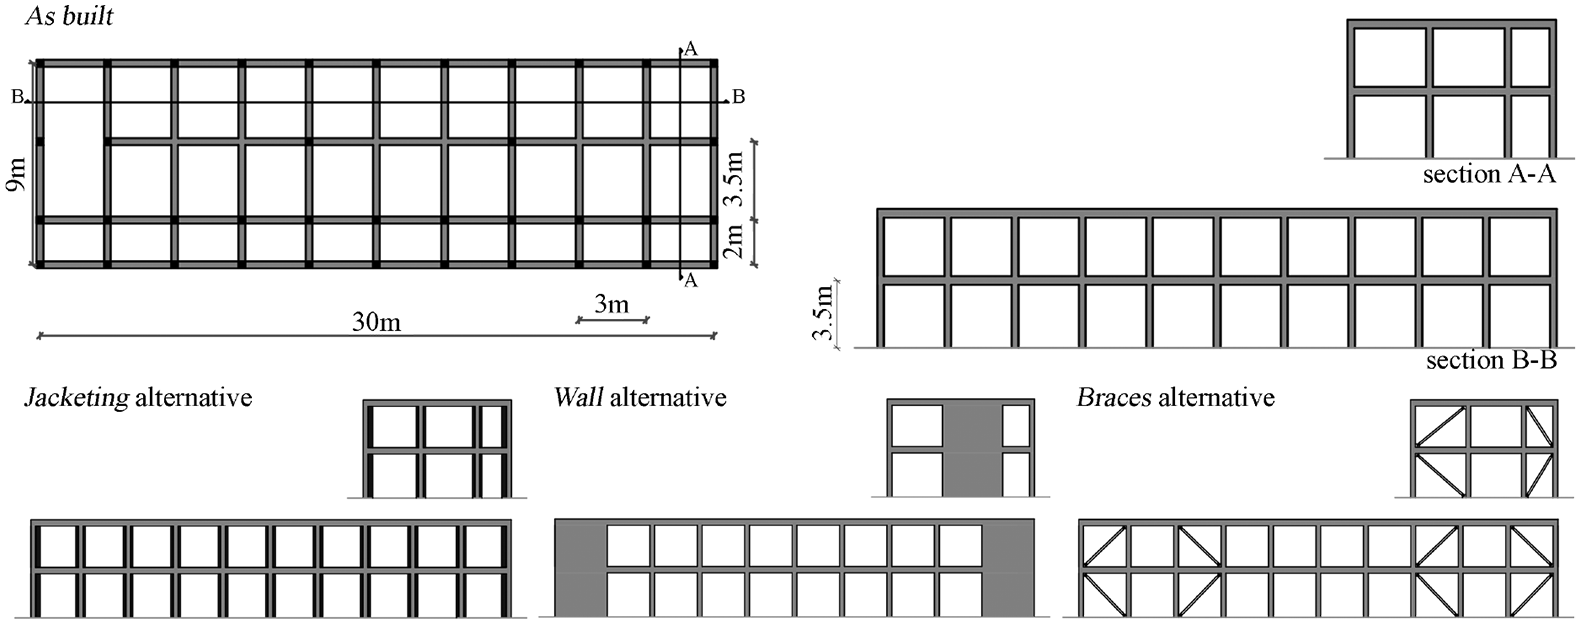
As-built configuration and retrofit alternatives.
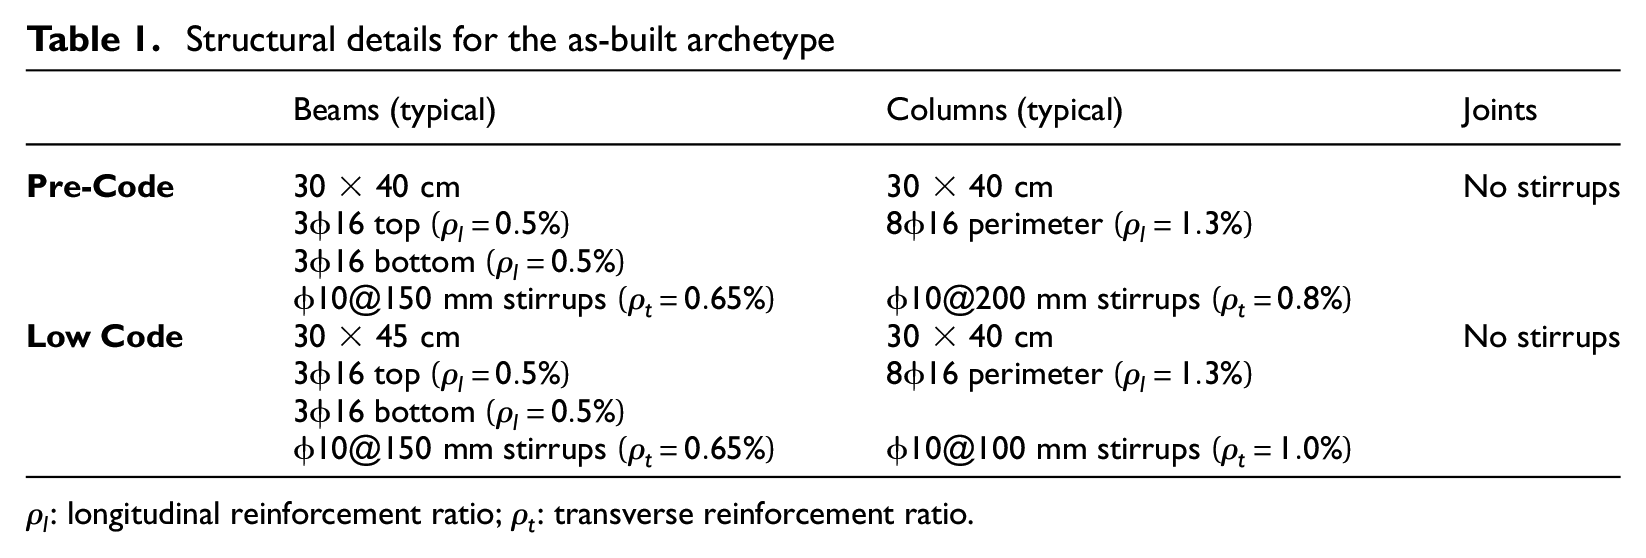
Although structural detailing is not explicitly surveyed, two nominal seismic performance levels are obtained according to a simulated design procedure. This leads to two detailing categories (Table 1) named Pre-Code and Low Code, as defined in HAZUS MH4 (Kircher et al., 2006). It is worth mentioning that, for the Low Code category, the cross-section height of beams and columns is 5 and 10 cm larger than the corresponding members in the Pre-Code one, respectively. The two detailing categories, respectively, comply with the Uniform Building Code (UBC; International Conference of Buildings Officials (ICBO), 1997) and ASCE 7-10 (American Society of Civil Engineers (ASCE), 2010). In fact, building codes in developing countries are often an adaptation of the UBC and/or the US codes (Gentile et al., 2019a; D’Ayala et al., 2020). To consider the possibility of the lack of code enforcement in an approximate way, some of the provisions in such codes are not applied in the simulated design (e.g. stirrups in the joints), also based on the field survey results. For the simulated design, permanent dead loads and live load equal to 5 kPa (1 kPa for the roof) are considered. Based on available local statistics (Saputra, 2017), longitudinal bars are characterized by a mean steel yield stress equal to 400 MPa (240 MPa for stirrups). The mean concrete cylindrical strength is equal to 21 and 24 MPa for the Pre-Code and Low Code configurations, respectively.
Structural details for the as-built archetype
Retrofit alternatives
The three considered different retrofit alternatives—jacketing, walls, braces (Figure 4)—comply with the prescriptions of ASCE 7-16. Those retrofit alternatives are designed to achieve moderate damage (DS2) for the design-level seismic demand calculated according to ASCE 7-16 (10% exceeding probability in 50 years). To this aim, the maximum considered earthquake (MCE) is first calculated for risk category III (schools) and reduced by a factor of two thirds. Consistently with the field data collected in Southeast Asia (Gentile et al., 2019a), very soft soil is assigned to the ideal building site (average shear wave velocity in the first 30 m equal to 200 m/s), that is, class E according to the classification by the National Earthquake Hazards Reduction Program (NEHRP, 2003). The assumed building location is a high-seismicity region in Southeast Asia. Therefore, the spectrum is defined according to the parameters,
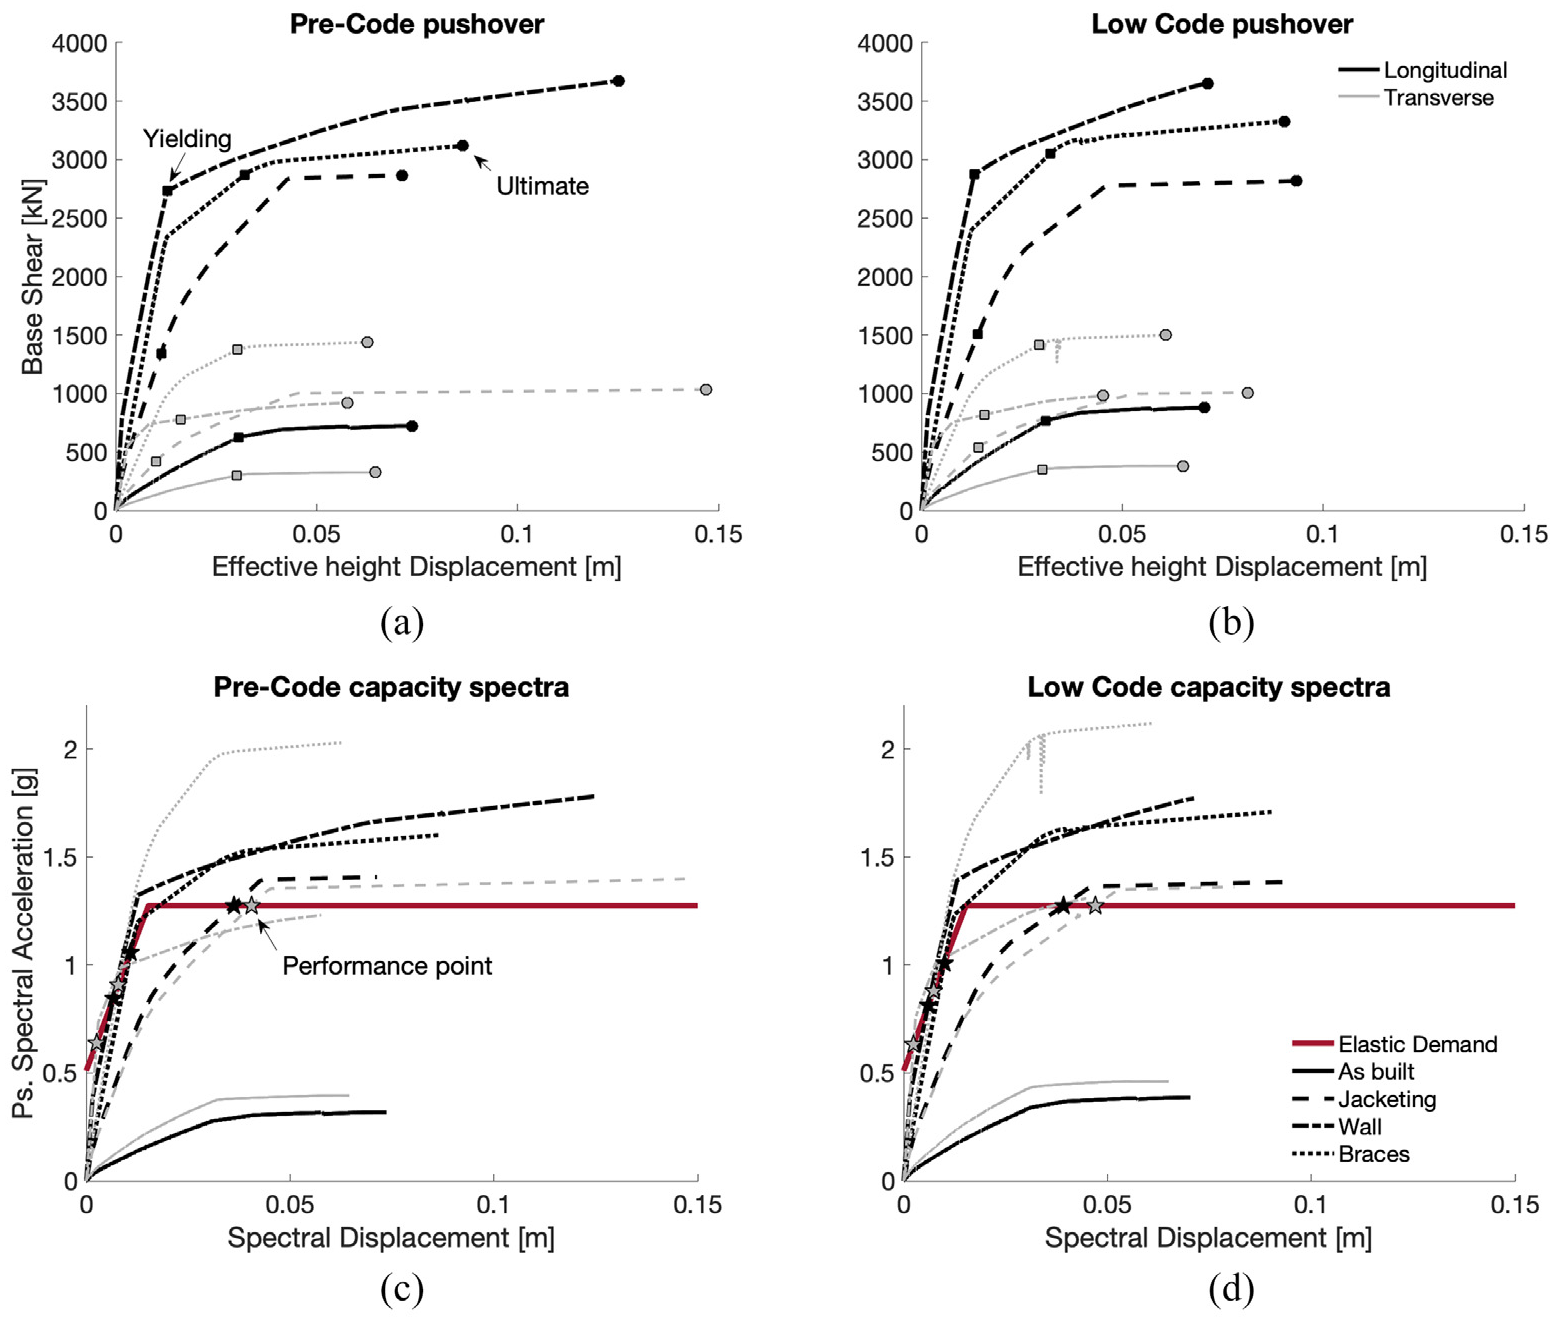
(a, b) Pushover curves and (c, d) capacity spectra for each retrofit alternative.
For the jacketing alternative, the dimensions of all the columns are increased to 60 × 60 cm, adopting improved concrete (30-MPa mean cylindrical strength) and adding 16φ24 mm equally spaced longitudinal bars (400-MPa mean steel yield stress). φ10 mm hoops (135° bent) are spaced at 6 cm in the plastic hinge zones. For the wall retrofit alternative, two 3.3-m-long RC walls are provided for each external longitudinal frame. The reinforcement is composed by 12 equally spaced longitudinal bars (φ16 mm) in the 0.6-m-long confined zone, and one φ16 mm every 14 cm in the central zone; φ14-mm stirrups spaced at 10 cm are provided. Four frames in the transverse direction are equipped with a 3.9-m-long wall, reinforced in the same fashion. Finally, the configuration of the braces in the last retrofit alternative is shown in Figure 4, which are installed on two longitudinal and four transverse frames. Structural steel type S235 (235-MPa minimum yield stress) is adopted for the braces, which have an “X” cross-section (10-cm side and 1.5-cm thickness, composed by four “angle” profiles). It is worth mentioning that the same retrofit specifications are used for both the Pre-Code and Low Code building configurations, as resulted from the DDBD calculations.
Details of the MCDM
Table 2 shows the seven criteria for the MCDM. The one-to-one comparisons (needed to perform the AHP) are possibly in line with the preferences of a government agency (e.g. Department of Education), and the criteria are deemed to be appropriate for interventions on public schools (World Bank Group, 2018). The same table shows the weights assigned to each criterion resulting from the AHP, which represent their relative importance according to the DM.
Relative importance and weights of the criteria, assuming a government agency as the DM
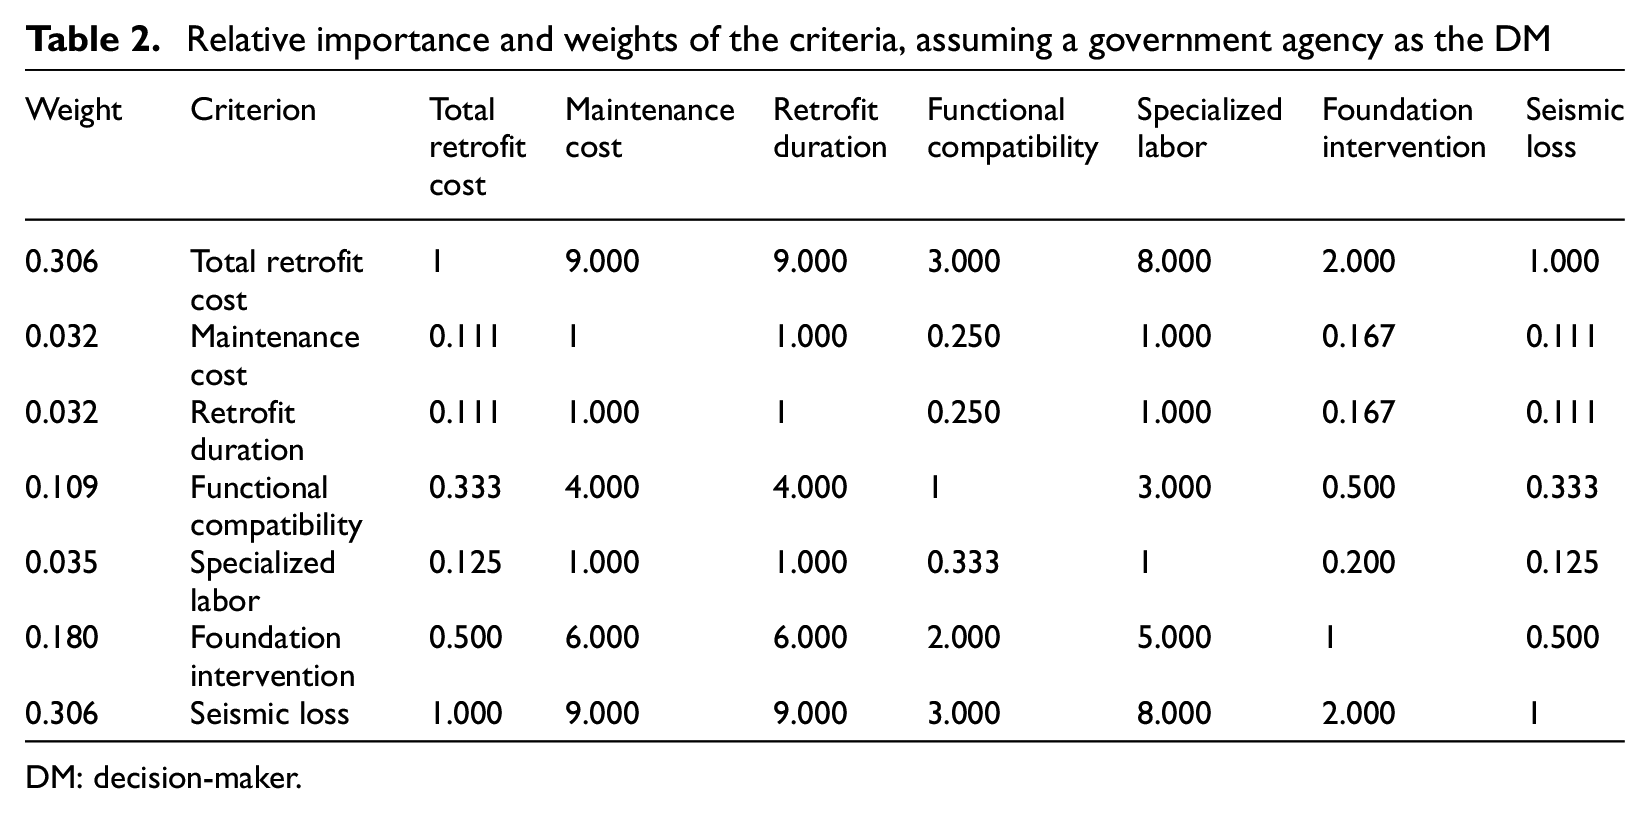
DM: decision-maker.
For the TOPSIS procedure, each criterion is evaluated as follows:
Total retrofit cost: for each retrofit alternative, the total costs are calculated as a sum of demolition cost (if needed), the installation cost of the intervention itself (excluding foundations), and the reconstruction of the demolished parts. Costs related to construction site setting and health/safety costs are also considered. For this example, Southeast Asia average costs for basic materials and labor are used (ARCADIS, 2018), finally converted in US$;
Maintenance cost: based on a given frequency of the required maintenance checks, the total cost of maintenance is calculated for a service life equal to 50 years. For RC jacketing and addition of RC walls, an inspection every five years (US$570) and an instrumental examination every 10 years (US$1700) are considered. For the addition of steel bracings, an inspection every five years (US$570) and an anti-corrosive treatment every 20 years (US$16,000) are needed. It is worth mentioning that the prices are based on a market survey, and a revaluation rate equal to 4% is applied;
Retrofit duration: for each retrofit alternative, the total time required to carry out a given intervention is calculated. It considers the work phases needed for the interventions, and the number of workers, based on engineering judgment;
Functional compatibility: this criterion is evaluated based on an AHP calculation expressing the relative invasiveness of each retrofit alternative (e.g. RC jacketing is less invasive than the addition of walls or braces). As opposed to the others, this criterion is treated as a benefit, meaning that a higher value of functional compatibility indicates a higher performance;
Specialized labor: this criterion is evaluated based on AHP calculations. This allows one to represent the relatively higher level of labor specialization needed for some of the alternatives (i.e. the addition of the steel braces with respect to RC jacketing or wall addition);
Intervention on foundations: this criterion is evaluated based on an AHP calculation that considers installation costs, time, and specialized labor for the intervention on the foundations. This captures the much higher invasiveness and cost of the foundation for the RC wall addition with respect to steel braces and jacketing;
Seismic loss: as mentioned above, the two independently adopted loss metrics are the (mean) LR corresponding to the design-level ground motion (intensity-based loss (IBL)) and the EAL. The average loss metric considering both building directions is adopted.
Results and discussion
The seismic hazard is calculated by means of simulation-based PSHA in terms of
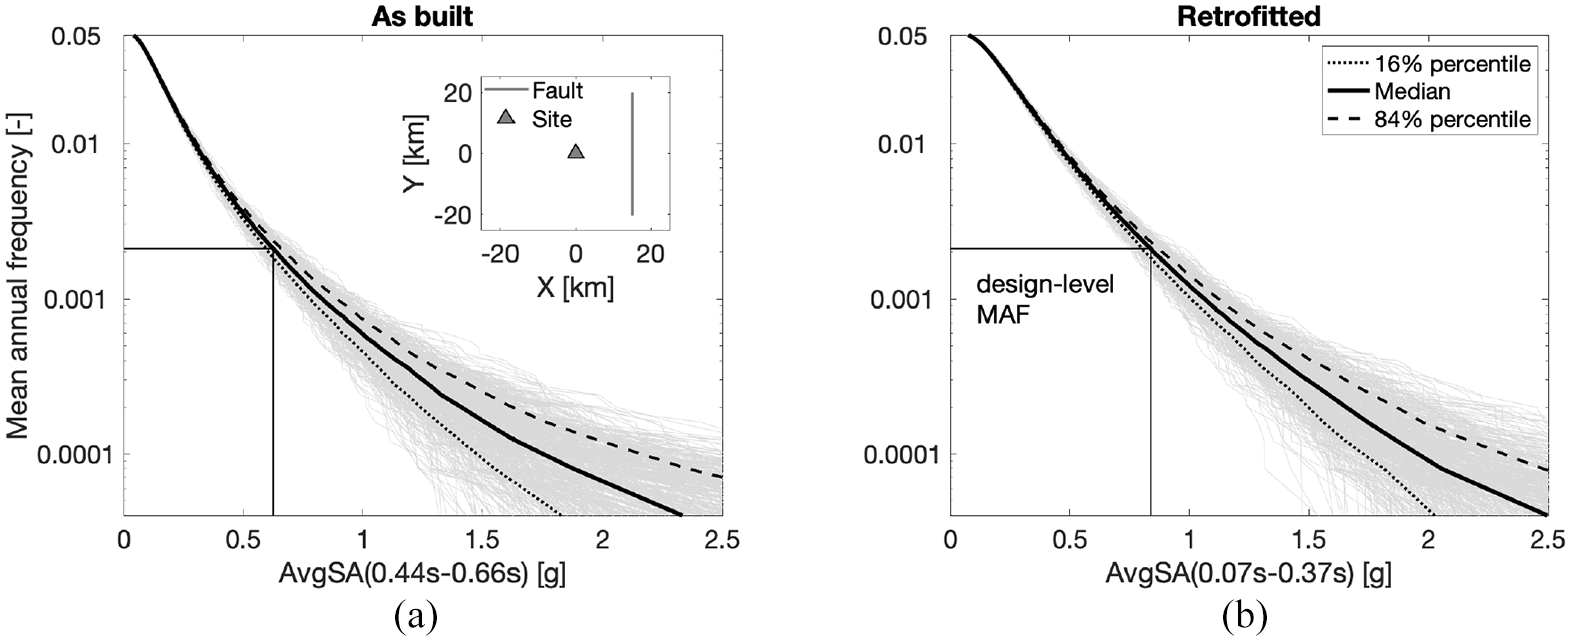
Hazard curves: (a) as built and (b) retrofitted.
The IM is defined in the interval
For each detailing category (Pre-Code, Low Code), and for each alternative (as built, jacketing, wall, braces), the three increasingly refined analysis methods are applied to derive fragility relationships. As an example, Figure 7 shows this for the Pre-Code building retrofitted with jacketing. The SLaMA-based capacity curve agrees well with the numerical pushover curve with minor discrepancies until DS4 (Figure 7a). The discrepancy registered for higher displacements is due to strength degradation, neglected in SLaMA. Such a good match is reflected in the IM vs EDP cloud (Figure 7b). The performance points obtained with the CSM for the set of natural records, both based on SLaMA and numerical pushover, agree well with the results of the non-linear time-history analyses. In turn, this is reflected in the fragility curves (Figure 7c). Four structure-specific DSs are assumed to derive fragility curves: slight, moderate, extensive, and complete damage. Those DSs are defined according to HAZUS, HAZard United States (Kircher et al., 2006), and quantified using the non-linear analysis results (the dots in Figure 7a) for each analyzed model. Other definitions of the DSs are possible, and the proposed framework is independent of their particular choice. For the jacketing alternative, those are equal to [0.15%, 0.60%, 1.50%, 2.00%], respectively, for DS1–DS4. Similar good agreement is registered for all the computed fragility curves, considering that the maximum error for the medians (with respect to time-history analysis) is equal to 15.1% for DS1 and DS2, and 28.7% for DS3 and DS4. This is also observed for a larger database of RC frames in Gentile and Galasso (2020). Exceptions are the SLaMA-based DS1 and DS2 fragilities for the brace alternative, for which the error can be as high as 20%. This is because SLaMA for infilled frames needs further calibrations/validations when applied to steel-braced RC frames.
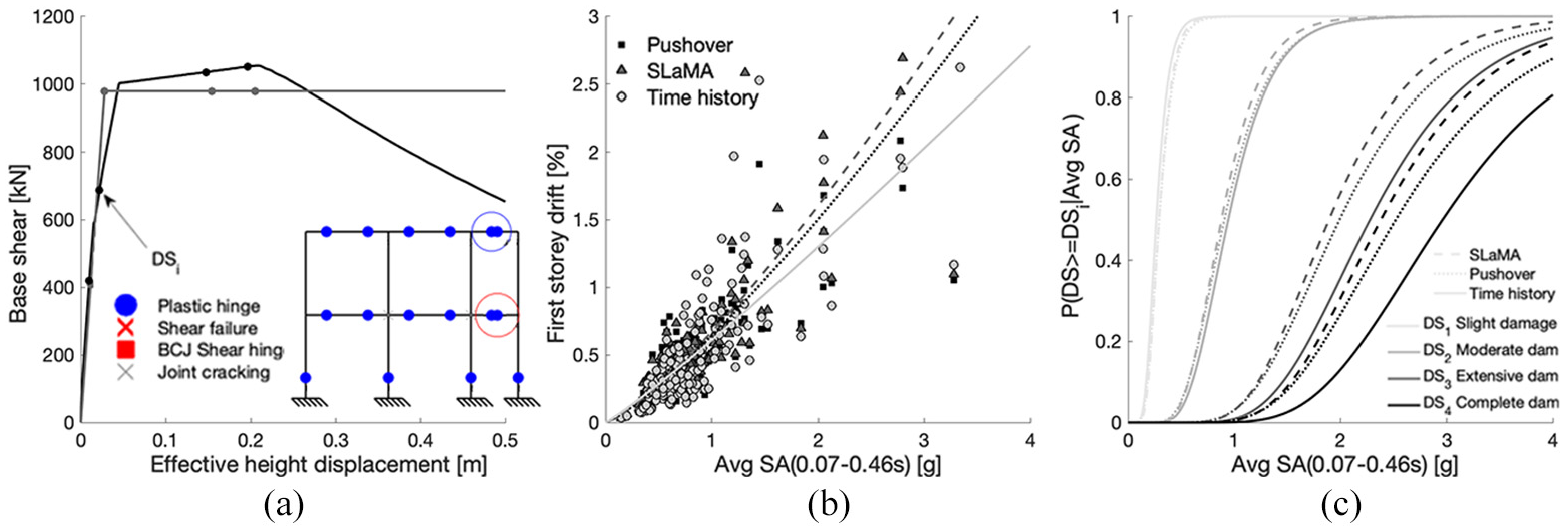
Comparison of the different analysis approaches for the Pre-Code building with jacketing. (a) Non-linear static capacity curves; (b) cloud analysis results; (c) fragility curves.
Vulnerability curves are calculated adopting the (mean) DLR for schools proposed in HAZUS, equal to 2%, 10%, 43.5%, and 100% of the total reconstruction cost (DS1–DS4). Uncertainty on the DLR is not considered for simplicity. Although these are based on US-specific empirical data, studies (e.g. Jaiswal and Wald, 2011) show that for values of the Modified Mercalli intensity greater than eight (reasonable assumption for the considered countries), no corrections are needed for applications in Southeast Asia. Other, more advanced DLR models (e.g. Martins et al., 2016) are available in the literature; the general findings from the illustrative application presented here are not affected by the particular DLR choice.
Figure 8 shows the vulnerability curves calculated for each building configuration, adopting the three analysis methods. For the sake of readability, only the results for the longitudinal direction are shown, since similar trends are observed for the transverse one. The vulnerability curves for the retrofitted cases show a “multi-s” shape, with pseudo-constant branches. The length of such branches is proportional to the distance, in terms of median fragility, of two adjacent DSs. The figure also shows the design-level median IM, for which the IBL is calculated. The EAL is finally calculated. For both loss metrics, the relative error on the seismic vulnerability is fairly low for a conceptual/preliminary design phase. For all the retrofit alternatives, the largest IBL error is equal to 13.7% and 21.8% for pushover and SLaMA, respectively. On the other hand, the largest error on the EAL is equal to 17.9% and 24.7%, respectively. The highest loss error is registered for the brace alternative. This is due to the higher error on the DS1 and DS2 fragilities, which in this case have the highest impact on the loss metrics (as dictated by the hazard curves).
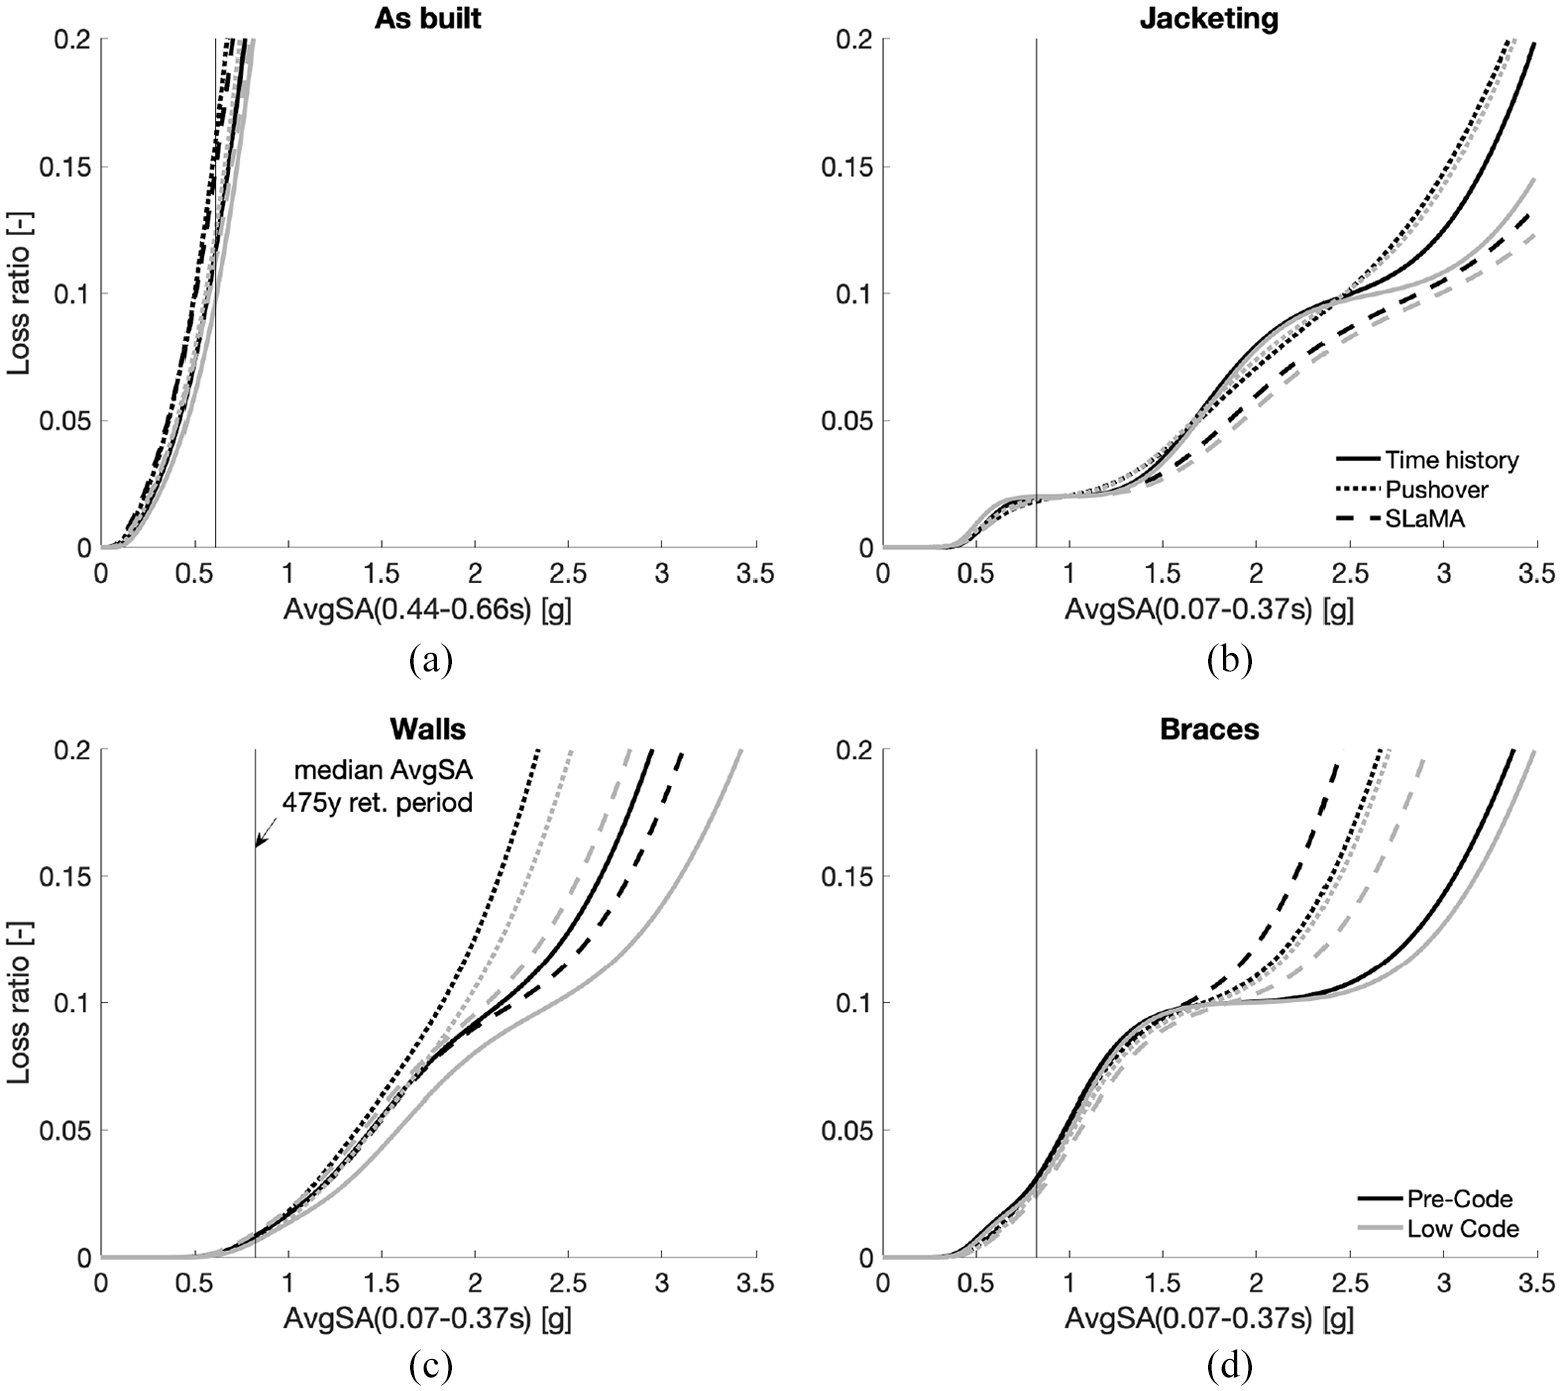
Vulnerability curves (longitudinal direction) for each retrofit alternative and analysis method: (a) as built, (b) jacketing, (c) walls, and (d) braces.
These results for the non-linear static to non-linear dynamic errors are not general, nor generalizable yet. Systematic research is needed to estimate the bias of the SLaMA- and pushover-based method in estimating fragility curves with respect to the time-history analyses, which in turn affects vulnerability estimates. However, the results are promising, and they suggest that efforts should be made to calibrate/validate simplified methods to derive fragility curves, for example, CSM adopting recorded ground motions.
The last step of the procedure is to carry out the MCDM to select the optimal retrofit solution. Table 3 shows the performance of the retrofit alternatives calculated for each of the selected criteria (in this case, the loss metric is based on time-history analysis). On the other hand, Table 4 shows the results of the MCDM: the criterion-specific performances define, for each alternative, the coordinates of a point in an abstract seven-dimensional space, while the overall performance (in the range 0–1) indicates how close each alternative is to the ideal best solution. According to this analysis, the wall retrofit alternative is judged as optimal, followed by the bracing and the jacketing.
MCDM decision matrix for the Low Code detailing category
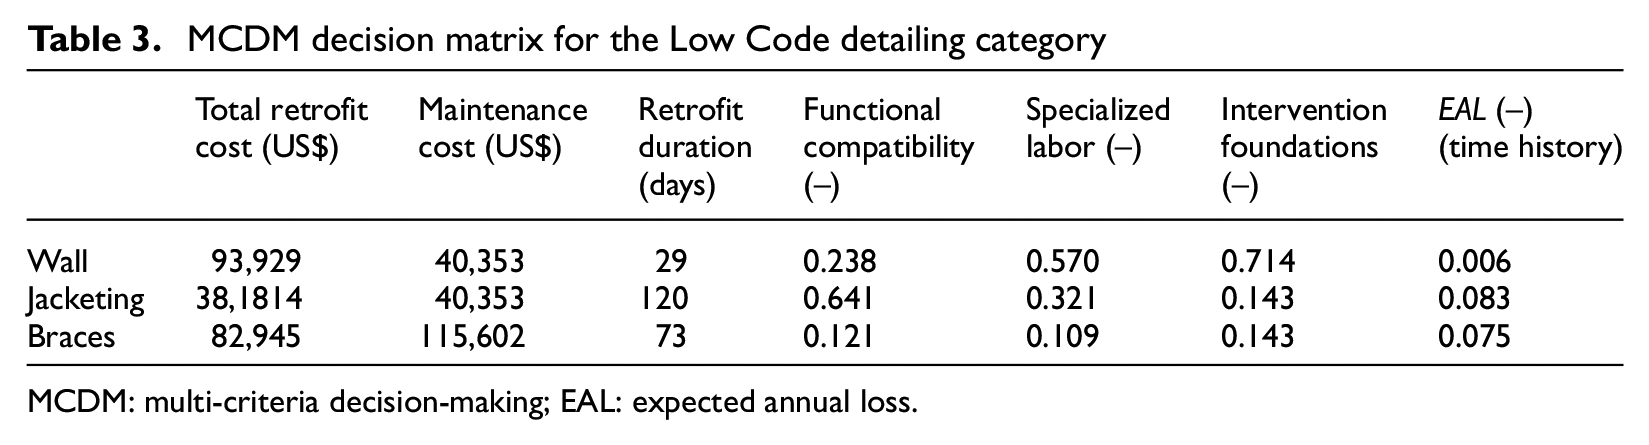
MCDM: multi-criteria decision-making; EAL: expected annual loss.
Ranking of the retrofit alternatives for the Low Code detailing category
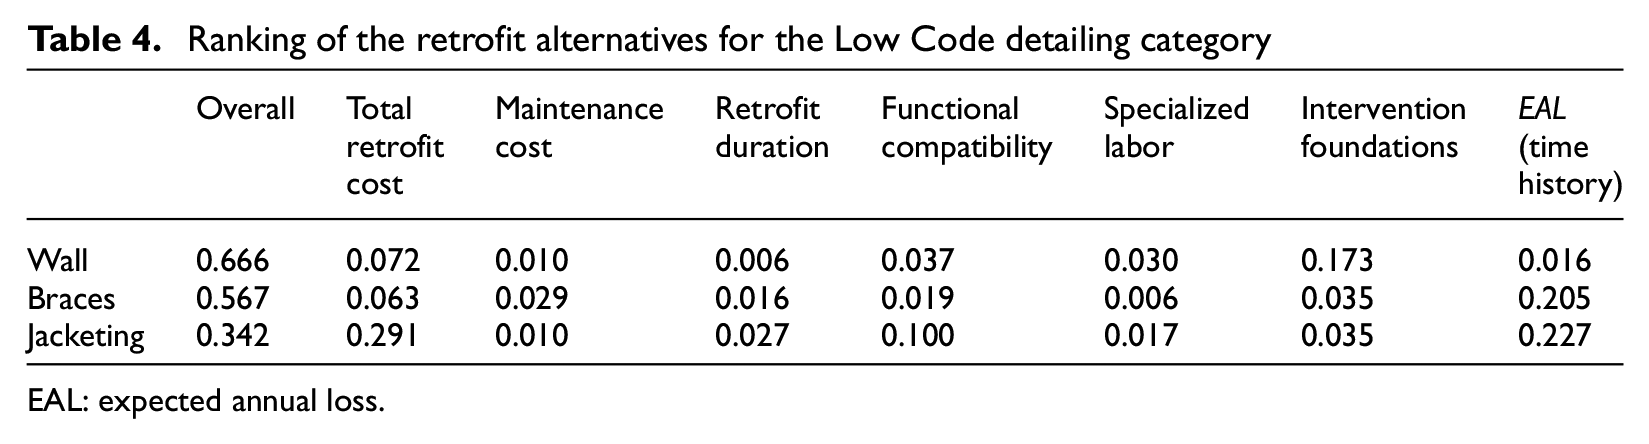
EAL: expected annual loss.
Such a result reflects the relative importance of the installation cost and the seismic economic loss (each of these representing 30% of the weight). In particular, jacketing is the worst alternative since, being a global intervention, its installation cost is one order of magnitude higher than the other two alternatives (local interventions). Between the remaining two alternatives, the expected loss for the bracing alternative is considerably higher than that for the wall alternative, and therefore, the braces alternative is ranked second. Finally, the wall alternative has the highest performance, even if it requires a more invasive and expensive intervention on foundations (18% weight).
The final goal of this article is to investigate the possibility of using simplified-yet-accurate methods to include fragility/vulnerability estimations in the decision process. Therefore, the MCDM is repeated considering the loss calculated by means of the pushover analysis and SLaMA (both EAL and IBL). Table 5 shows the results of such sensitivity analysis: it indicates the overall MCDM performance of each retrofit alternative by considering different response analysis methods and loss metrics. In relation to the Pre-Code building, Figure 9 shows the results of the MCDM using the three different response analysis methods, and the EAL as loss metric. Each radius of the radar plots represents one criterion. A closed figure is obtained, for each retrofit alternative, by connecting the criterion-specific performances on the radii.
Sensitivity of the overall score with respect to the analysis method
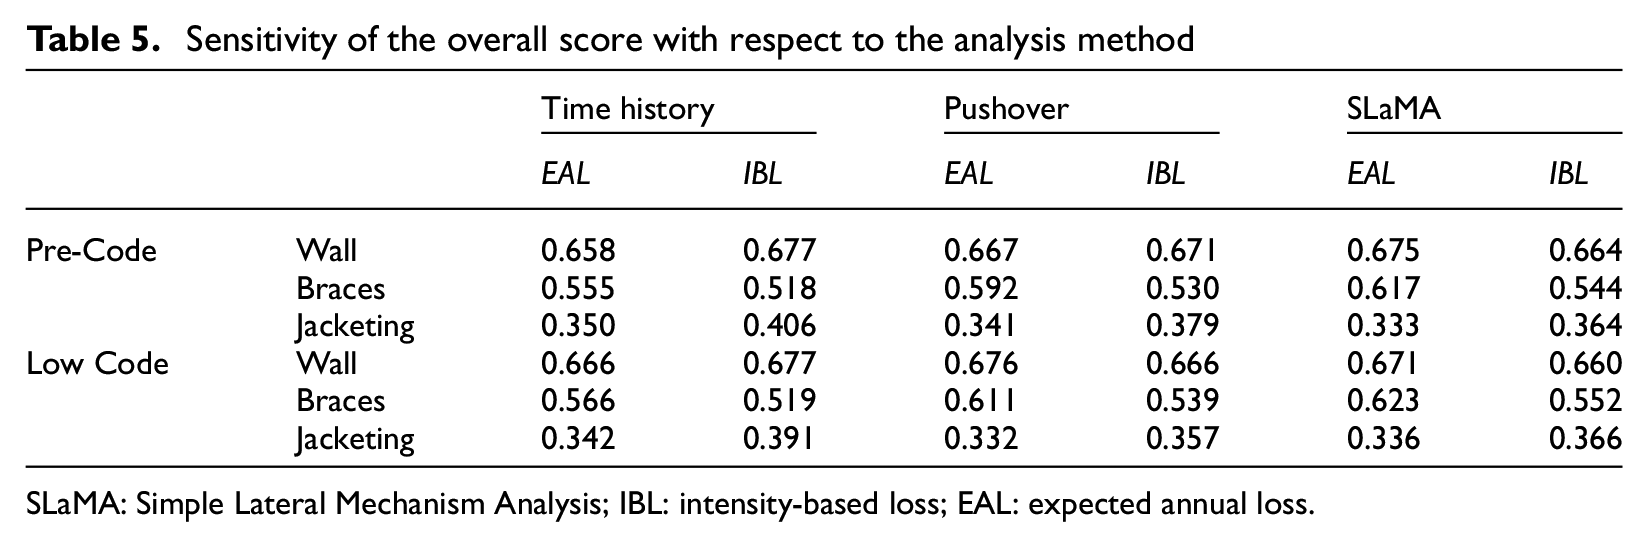
SLaMA: Simple Lateral Mechanism Analysis; IBL: intensity-based loss; EAL: expected annual loss.
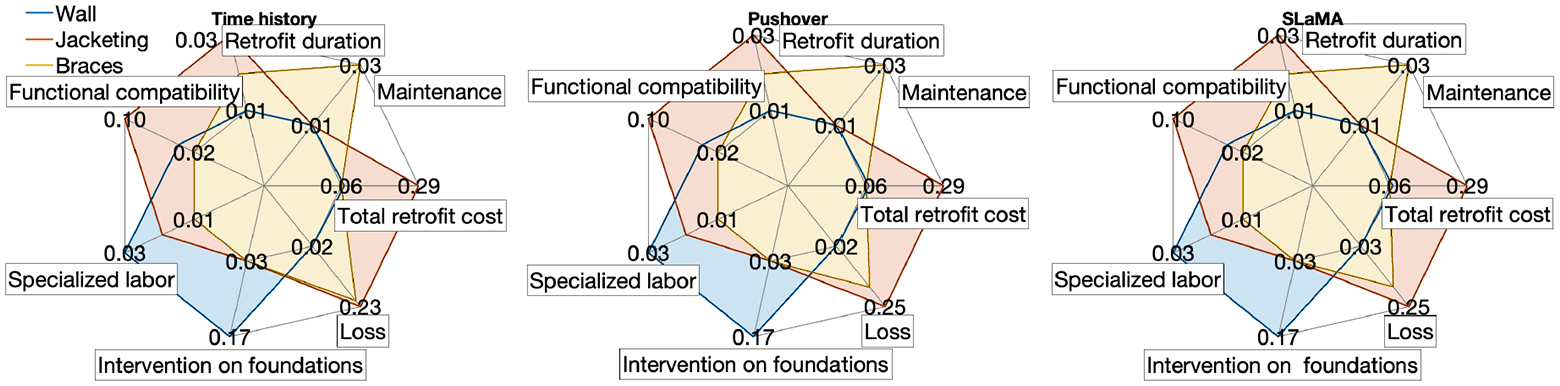
Pre-Code building: sensitivity of the overall score to the analysis method (based on EAL).
As shown in Table 5, the three different response analysis methods lead to the same ranking of the retrofit alternatives (wall, braces, jacketing). Such ranking is also rather insensitive to loss metric, even if the seismic loss criterion is one of the most important in the MCDM (its weight is approximately equal to 30%). This result is also shown in Figure 9, since the shapes representing each retrofit alternatives are essentially insensitive to the analysis method. This seems to suggest that for such a preliminary phase of the retrofit design, refined numerical methods can be effectively replaced by simplified methods without losing the ability to make an informed decision.
Conlcuding remarks
This article dealt with the selection of optimal retrofit solutions for seismically deficient RC buildings. The study adopted an MCDM approach to rank different alternatives using a number of criteria selected by a DM. First, it has been proposed that each retrofit alternative should be designed for the same expected DS under the design-level IM. Adopting a performance-based approach allows one to exclude the seismic performance from the considered criteria. It has also been proposed to explicitly consider seismic economic loss among the criteria. Moreover, it has been proposed to calculate the seismic fragility/vulnerability of the different retrofit alternatives considering a large suite of unscaled, natural ground motions, rather than using code spectra.
If non-linear time-history analyses are carried out, however, the proposed framework may require very high computational effort, together with the structural modeling burden and the consequent interpretation of the analysis results. For this reason, it has been proposed to use less complex structural analysis methods as an alternative. In particular, force–displacement curves have been derived using both numerical pushover analyses and SLaMA. The CSM, adopting a large suite of natural ground motions, has been applied using such curves, therefore deriving fragility and vulnerability curves that are, in turn, an input of the MCDM analysis.
The proposed framework has been demonstrated for a seismic-deficient RC school archetype building, with construction details typical of developing countries in Southeast Asia, for which real data are available. Three retrofit alternatives have been analyzed and compared: RC column jacketing, addition of RC walls, addition of steel braces. Moreover, two loss metrics have been independently used to quantify expected seismic loss: the (mean) LR corresponding to the design-level ground motion and the EAL. The MCDM has been repeated independently using the loss metrics derived with non-linear time histories, pushover analysis, or SLaMA. The ranking of the retrofit alternatives is insensitive to the analysis method and loss metric, even if the considered weight for the seismic loss criterion is relatively high (30% herein).
These results, although based on a limited case study, seem to indicate that simplified structural analysis methods can be effectively adopted to include seismic vulnerability (and hence economic loss) in the optimal retrofit selection for seismic-deficient buildings.
Some interesting trends are observed, and further investigation is deemed to be required. The pushover- and SLaMA-based rankings are particularly similar and slightly biased with respect to the time-history approach. Such discrepancies can be traced back to the determination of the fragility functions. Moreover, since the force–displacement curves according to SLaMA and the pushover are particularly similar, the error on the fragilities can be related to the adoption of the CSM with real records. It is evident that a refinement/calibration of such method could improve the overall accuracy.
The loss analysis in the proposed methodology is based on building-level DLRs, to provide a simple solution appropriate for the preliminary (conceptual) design of retrofit alternatives. Appropriately calibrated damage-to-loss ratios (e.g. Martins et al., 2016) are clearly crucial for the accuracy of the solution. After the selection of the optimal retrofit, more refined, component-based methodologies are recommended to calculate the expected losses (FEMA P-58 Federal Emergency Management Agency, 2012; Yang et al., 2009). Further research efforts are needed to test the sensitivity of the final ranking to the adoption of more refined loss-analysis methodologies. Based on the evidence in this article, it is possible to conclude that, conditional to a given loss estimation methodology, the ranking of the solution is insensitive to the analysis/seismic response method.
Footnotes
Declaration of conflicting interests
The author(s) declared no potential conflicts of interest with respect to the research, authorship, and/or publication of this article.
Funding
The author(s) disclosed receipt of the following financial support for the research, authorship, and/or publication of this article: This study was performed in the framework of the “INSPIRE: Indonesia School Programme to Increase Resilience” and “i-RESIST: Increasing Resilience of Schools in Indonesia to Earthquake Shaking and Tsunami” projects, funded by the British Council through the Newton Institutional Links scheme and Research England through the University College London (UCL) Global Challenges Research Fund (GCRF) Small Research Grants scheme. Roberto Gentile received funding from the European Union’s Horizon 2020 research and innovation program under grant agreement No. 843794 (Marie Skłodowska-Curie Research Grants Scheme MSCA-IF-2018: Multi-level Framework to Enhance Seismic Resilience of RC buildings (MULTIRES)).