
Abstract
Seismic hazard assessments in stable continental regions such as Australia face considerable challenges compared with active tectonic regions. Long earthquake recurrence intervals relative to historical records make forecasting the magnitude, rates, and locations of future earthquakes difficult. Similarly, there are few recordings of strong ground motions from moderate-to-large earthquakes to inform development and selection of appropriate ground-motion models (GMMs). Through thorough treatment of these epistemic uncertainties, combined with major improvements to the earthquake catalog, a 2018 National Seismic Hazard Assessment (NSHA18) of Australia has been undertaken. The resulting hazard levels at the 10% in 50-year probability of exceedance level are in general significantly lower than previous assessments, including hazard factors used in the Australian earthquake loading standard (AS 1170.4–2007 (R2018)), demonstrating our evolving understanding of seismic hazard in Australia. The key reasons for the decrease in seismic hazard factors are adjustments to catalog magnitudes for earthquakes in the early instrumental period, and the use of modern ground-motion attenuation models. This article summarizes the development of the NSHA18 explores uncertainties associated with the hazard model, and identifies the dominant factors driving the resulting changes in hazard compared with previous assessments.
Keywords
Introduction
Probabilistic Seismic Hazard Analysis (PSHA) has been used widely through recent decades to provide information on seismic hazards for a range of societal and industry applications. One of the fundamental uses of national-scale seismic hazard assessments is in national building codes and standards (e.g. Standards Australia, 2007). However, the inputs and derivative products of these assessments are used in a wide range of additional infrastructure and community safety applications, including to inform the seismic design and construction of infrastructure and post-disaster facilities (e.g. AECOM, 2018; Australian National Committee on Large Dams, 2019; McBean, 2015); the development of local earthquake risk mitigation strategies (e.g. Dhu et al., 2004; Griffith et al., 2017) and land-use planning; and to benchmark insurance and reinsurance premiums for asset portfolios (e.g. AIR-Worldwide, 2013; Walker, 2008).
While the commonly applied PSHA methodology remains based on the classical Cornell (1968) approach (McGuire, 2008), significant progress has been made in refining its implementation through the improved knowledge of component input models, such as improved seismic-source characterization (e.g. faults and distributed seismicity models) through longer observation periods and advances in active fault studies (Clark and Allen, 2018; Clark et al., 2012); improved characterization of earthquake ground motion through significantly augmented empirical datasets (e.g. Ancheta et al., 2014; Goulet et al., 2014) and advances in ground-motion simulations (e.g. Goulet et al., 2015; Graves et al., 2011); and improved integration and scrutiny of input component models (e.g. Bommer et al., 2015; Hanks et al., 2009; U.S. Nuclear Regulatory Commission, 2018). Much of this research has been conducted and applied to plate margin settings. Forecasting seismic hazard in stable continental regions (SCRs) brings unique challenges to hazard modelers and practitioners in terms of the characterization of seismic sources and their ground motions (Allen, 2019; Leonard et al., 2014). By their very nature, SCRs experience significantly lower earthquake rates as compared to tectonic plate margins. Consequently, the typical observation period of historical seismicity (both in the instrumental and pre-instrumental eras) is significantly shorter than the typical seismic cycle of rare large earthquakes that may generate damaging ground motions on any given fault source. In Australia, this limited observation period is exacerbated by the sparse seismic recording network relative to the size of the continent (e.g. Leonard, 2008; McCue, 2004). In addition, the seismogenic characteristics (in terms of frequency, magnitude, and temporal variability) of various combinations of geology, crustal architecture, and geological history are underexplored and relatively poorly understood. While many of these challenges require ongoing monitoring and research to reduce the epistemic uncertainties for hazard assessments in Australia, there are several opportunities to improve seismic hazard estimation using existing datasets and methods. Furthermore, improved characterization of modeling uncertainties provides additional information regarding the utility and confidence of seismic hazard assessments for end users (e.g. Lee et al., 2018).
In 2018, Geoscience Australia, together with contributors from the wider Australian seismology community, produced a revised National Seismic Hazard Assessment (NSHA18; Allen et al., 2018b). Relative to the seismic hazard map included in the AS 1170.4–2007 (R2018), the NSHA18 leverages advances in earthquake-hazard science in Australia and analog tectonic regions over the last three decades to offer many improvements over its predecessors, including
calculation in a fully probabilistic framework using the OpenQuake-engine (Pagani et al., 2014);
incorporation of almost three decades of new, high-quality earthquake epicenter data (Allen et al., 2018c);
consistent expression of earthquake magnitudes in terms of moment magnitude (M) (Allen et al., 2018c);
inclusion of a national fault-source model based on the Australian Neotectonic Features Database (Clark et al., 2016); and
the estimation of epistemic (i.e. modeling) uncertainty through the use of multiple alternative source and ground-motion models (GMMs) (Griffin et al., 2018).
Peak ground acceleration (PGA) values at the 1/500 annual exceedance probability (AEP) across Australia have decreased, on average, by 72% relative to the earthquake hazard factors provided for localities in the Australian earthquake loading code, AS 1170.4–2007 (Standards Australia, 2007). Furthermore, NSHA18 PGA values at the 1/500 AEP are approximately half of those in the 2012 National Seismic Hazard Maps (NSHM12; Burbidge, 2012; Leonard et al., 2013), with a decrease of 48% (on average) at AS 1170.4 localities.
This article provides a brief overview of the development of the NSHA18 and the rationale for the changes in seismic hazard for Australia relative to previous national-scale assessments. Key advances are discussed with particular reference to the seismic-source characterization through the contribution of third-party source models and their subsequent weighting through a structured expert elicitation process (Griffin et al., 2018). In addition, this article explores how uncertainties in input data and modeling choices contribute to uncertainties in the hazard results. This demonstrates the uncertainties inherent to seismic hazard assessment in SCRs and identifies which of the model components contribute most to the uncertainty, and hence should be prioritized for future research. A full technical account of the NSHA18 and its associated data products are outlined in Allen et al. (2018b), and references to reports therein.
Seismotectonic setting of Australia
The Australian continent lies wholly within the Indo-Australian tectonic plate and is considered to be an SCR in terms of its tectonic setting and seismicity (e.g. Clark et al., 2012; Johnston, 1994; Leonard et al., 2014; Schulte and Mooney, 2005). Clark et al. (2011) first developed a “neotectonic domains” model for Australia that subdivides the continent in terms of its seismotectonic characteristics. In particular, it characterizes the behavior of faults that are considered to have hosted large earthquakes in the current stress regime (i.e. within the last 10-5 Myr; Hillis et al., 2008). The neotectonic domains are generally consistent with Australia’s major tectonic units (Shaw et al., 1996) and broadly subdivide cratonic terranes (Precambrian cratons and reactivated Proterozoic crust) of western and central Australia from the non-cratonic terranes (Phanerozoic accretionary crust and Mesozoic basins) of eastern Australia (Figure 1). The continent is generally bounded by passive margin extended continental crust. Clark et al. (2012) provide a more thorough overview of the neotectonic domains model and the seismotectonic setting of Australia.
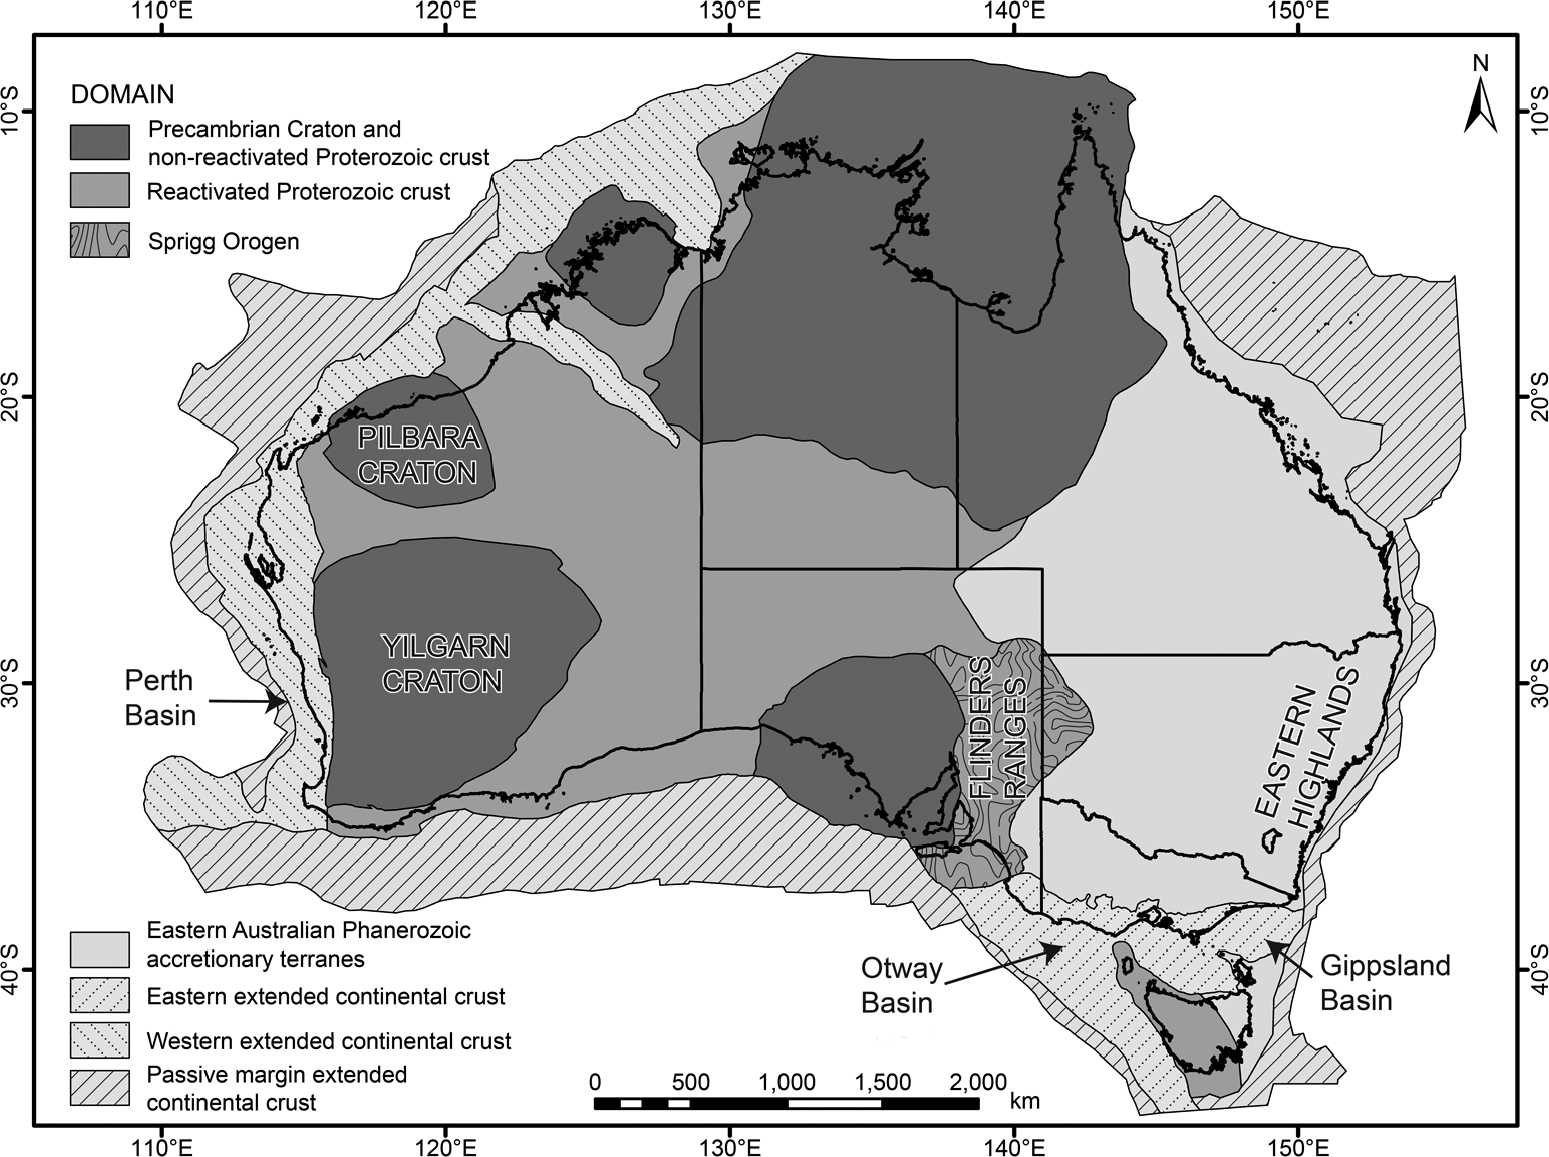
The neotectonic domains model for Australia (modified after Clark et al., 2011, 2012). The neotectonic domains broadly subdivide cratonic terranes (Precambrian cratons and reactivated Proterozoic crust) of western and central Australia from the non-cratonic terranes (Phanerozoic accretionary crust and Mesozoic basins) of eastern Australia.
A number of seismic networks have operated throughout Australia in the instrumental era (roughly, the last century), ranging in scale from local infrastructure monitoring networks (e.g. Peck, 2016) to the Australian National Seismic Network (Leonard, 2008; McCue, 2004). The earthquake catalog that underpins the NSHA18 is based on both instrumental observations from all available networks and known pre-instrumental observations. This catalog is described further in Allen et al. (2018c). Australia has a short historical record of seismicity relative to many regions globally and, in particular, relative to the return periods of large earthquakes on intraplate seismogenic faults (e.g. Clark et al., 2012). Nevertheless, pervasive patterns in seismicity are evident in some regions (Figure 2). For example, seismicity has remained relatively stationary in space and time in the historical era in the eastern highlands, the Flinders Ranges, and the northwest continental shelf region (Leonard, 2008). In contrast, earthquake activity appears to have increased significantly in the Southwest Seismic Zone (SWSZ) of western Australia since the 1940s (Leonard, 2008), where contemporary seismicity rates may exceed long-term averages based on Quaternary fault scarps (Leonard and Clark, 2011). This suggests that the seismicity in the region is likely to be transient and migratory (Leonard and Clark, 2011). Furthermore, the hypothesized migratory nature of seismicity in the SWSZ is consistent with the observation that none of the faults relating to the nine historical surface rupturing earthquakes in Australia could have been identified and mapped using topographic signature prior to the causative historical events (Clark and Allen, 2018; Clark and Edwards, 2018). Therefore, we can expect that large (up to M = 7.6; Clark et al., 2014) earthquakes could occur anywhere, and in unanticipated locations throughout the Australian crust (e.g. Bowman, 1992; Clark and Allen, 2018; Gordon and Lewis, 1980).
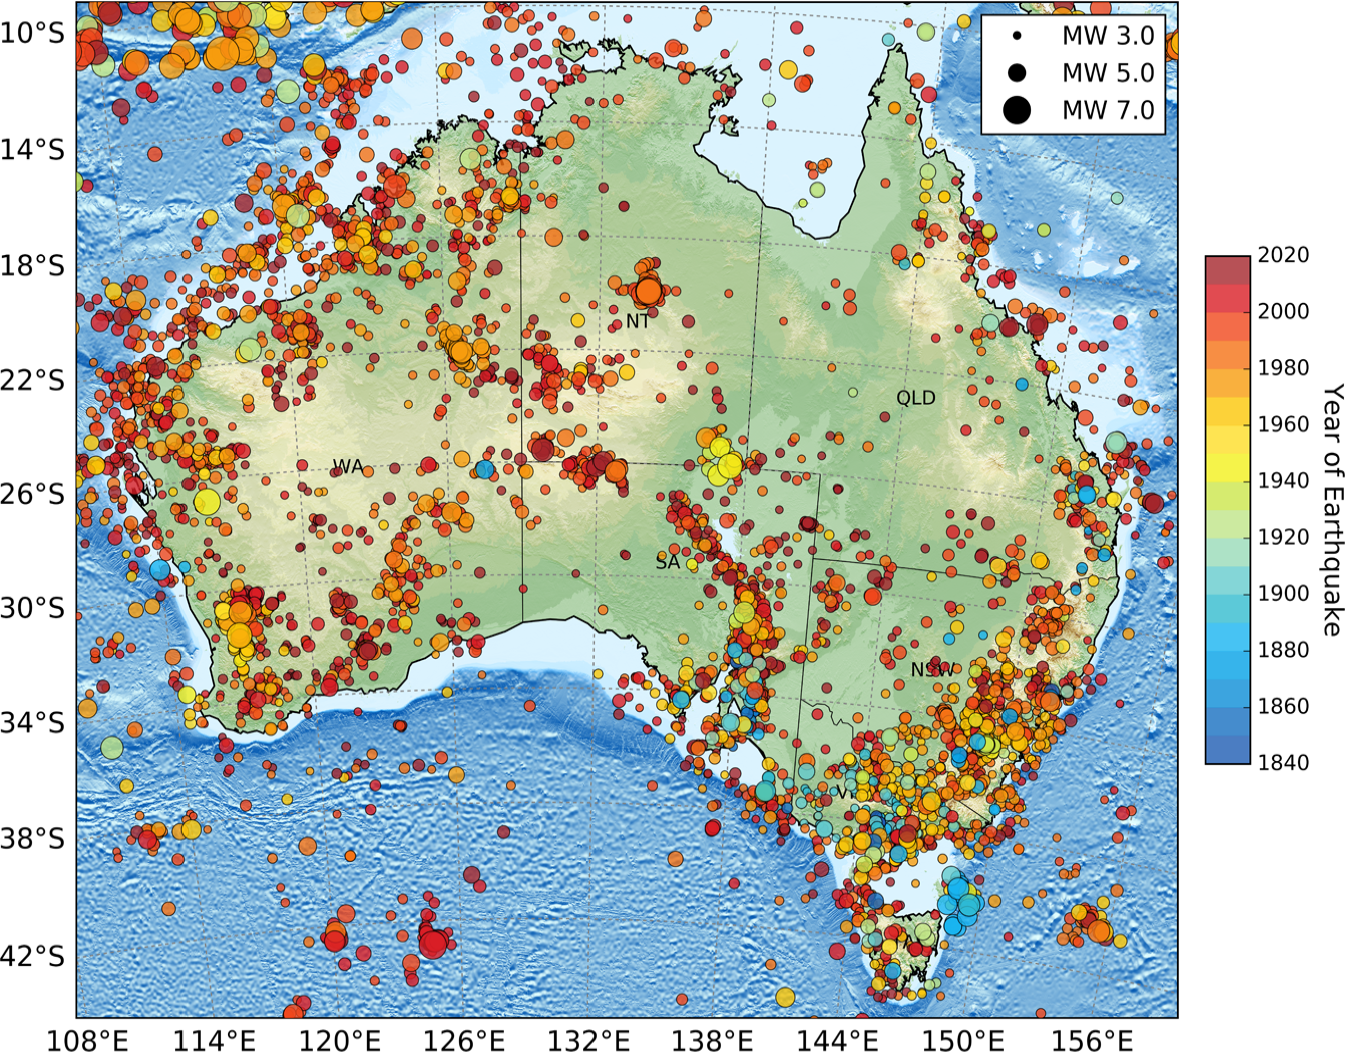
Map of earthquake epicenters of M ≥ 3.0 in the NSHA18-Cat. This catalog is merged with the International Seismological Center (ISC)–Global Earthquake Model (GEM) Global Instrumental Earthquake Catalog (Version 5) in regions not covered by NSHA-Cat for earthquakes of M ≥ 5.0 since 1904. The ISC-GEM catalog is merged for mapping purposes only. Epicenters are sized by moment magnitude and color-coded by the year of the earthquake.
Seismic design maps for Australia
Damaging earthquakes in Australia are considered low probability, but high consequence events. Given Australia’s stable continental setting (e.g. Johnston, 1994; Schulte and Mooney, 2005), and the consequent low public perception of earthquake hazard, earthquake resilience was not commonly considered in the early design and construction of buildings in many population centers. Following the near-complete destruction of the township of Meckering in the south-west of western Australia as the result of a magnitude M 6.5 earthquake in 1968 (Gordon and Lewis, 1980; Vogfjörd and Langston, 1987), the first seismic design requirements were introduced in 1979 through the Australian Standard AS 2121–1979 (Standards Australia, 1979). The AS 2121–1979 included the seismic zoning map compiled by Denham and McEwin (1979). The next major update to Australia’s earthquake loading actions followed the deadly 1989 Newcastle earthquake (McCue et al., 1990) with the AS 1170.4–1993 (Standards Australia, 1993). The hazard map underpinning the AS 1170.4–1993 was developed in 1991 (McCue et al., 1993) and continues to underpin the map referenced by the recently published AS 1170.4–2007 (R2018) (Standards Australia, 2018). Several manuscripts provide excellent summaries of the history of seismic design and code development in Australia (e.g. Brown and Gibson, 2004; McPherson et al., 2011; Woodside and McCue, 2017) up to the current edition of Standards Australia’s Structural design actions, part 4: Earthquake actions in Australia (AS 1170.4–2007 (R2018)). It is estimated that as many as 70% 1 of current national building stock was built prior to the publication and enforcement of the AS 1170.4–1993. This represents a significant legacy risk from earthquakes to Australian communities.
The seismic hazard design factor Z in the Standard is represented as the PGA value calculated on rock sites (AS 1170.4 Site Class Be 2 ) with a uniform AEP of 1/500. This probability level is approximately equivalent to a 10% probability of exceedance in 50 years. The AS 1170.4–2007 (R2018) hazard design factors trace their lineage back to the PSHA of Gaull et al. (1990). This was a landmark study for its time and was developed based on scientific understandings and available data from the late 1980s. The Gaull et al. (1990) map was subsequently adjusted through a process of expert judgment (McCue, 1993) for inclusion in a revision of the design standard AS 1170.4–1993 (McCue et al., 1993). This assessment, compiled in 1991, was not a probabilistic assessment, but reflected the collective understanding of seismic hazard in Australia at the time, and has guided engineering design since its publication. The 1991 map also underpinned Australia’s contribution to the Global Seismic Hazard Assessment Program (GSHAP) seismic hazard map (Giardini et al., 1999; McCue, 1999).
The NSHA18 process sought to engage with the Australian seismological and earthquake engineering communities to provide broad community engagement to update the seismic hazard model as used in the Standard. This engagement consisted of two expert elicitation workshops (Griffin et al., 2018), special conference sessions and presentations, and the formation of an NSHA18 Science Advisory Panel (Allen et al., 2018b). While the NSHA18 was ultimately not adopted for the AS 1170.4–2007 (R2018) given the substantial changes to the existing earthquake loading actions, the model nevertheless has a broad range of infrastructure-related and community safety–related applications beyond the building code.
Seismic-source characterization
One of the major advances in the NSHA18 relative to its predecessors is its use of a large range of seismic-source models (SSMs) to explicitly consider the epistemic uncertainties associated with seismic-source modeling (Allen et al., 2018b; Griffin et al., 2018). A call to third-party contributors, in addition to models developed by Geoscience Australia, resulted in the characterization of 19 SSMs for the Australian continent and adjacent offshore regions (Table 1). The characterization of these source models is outlined in terms of their model type, earthquake occurrence, and rupture properties below. The source models and their characterization were reviewed and weighted through a structured expert elicitation process (Griffin et al., 2018). Contributing to some of these models is the national fault-source model (Clark et al., 2016).
List of geoscience Australia and third-party source models considered for use in the NSHA18 together with their assigned weights from the expert elicitation workshop (Griffin et al., 2018)
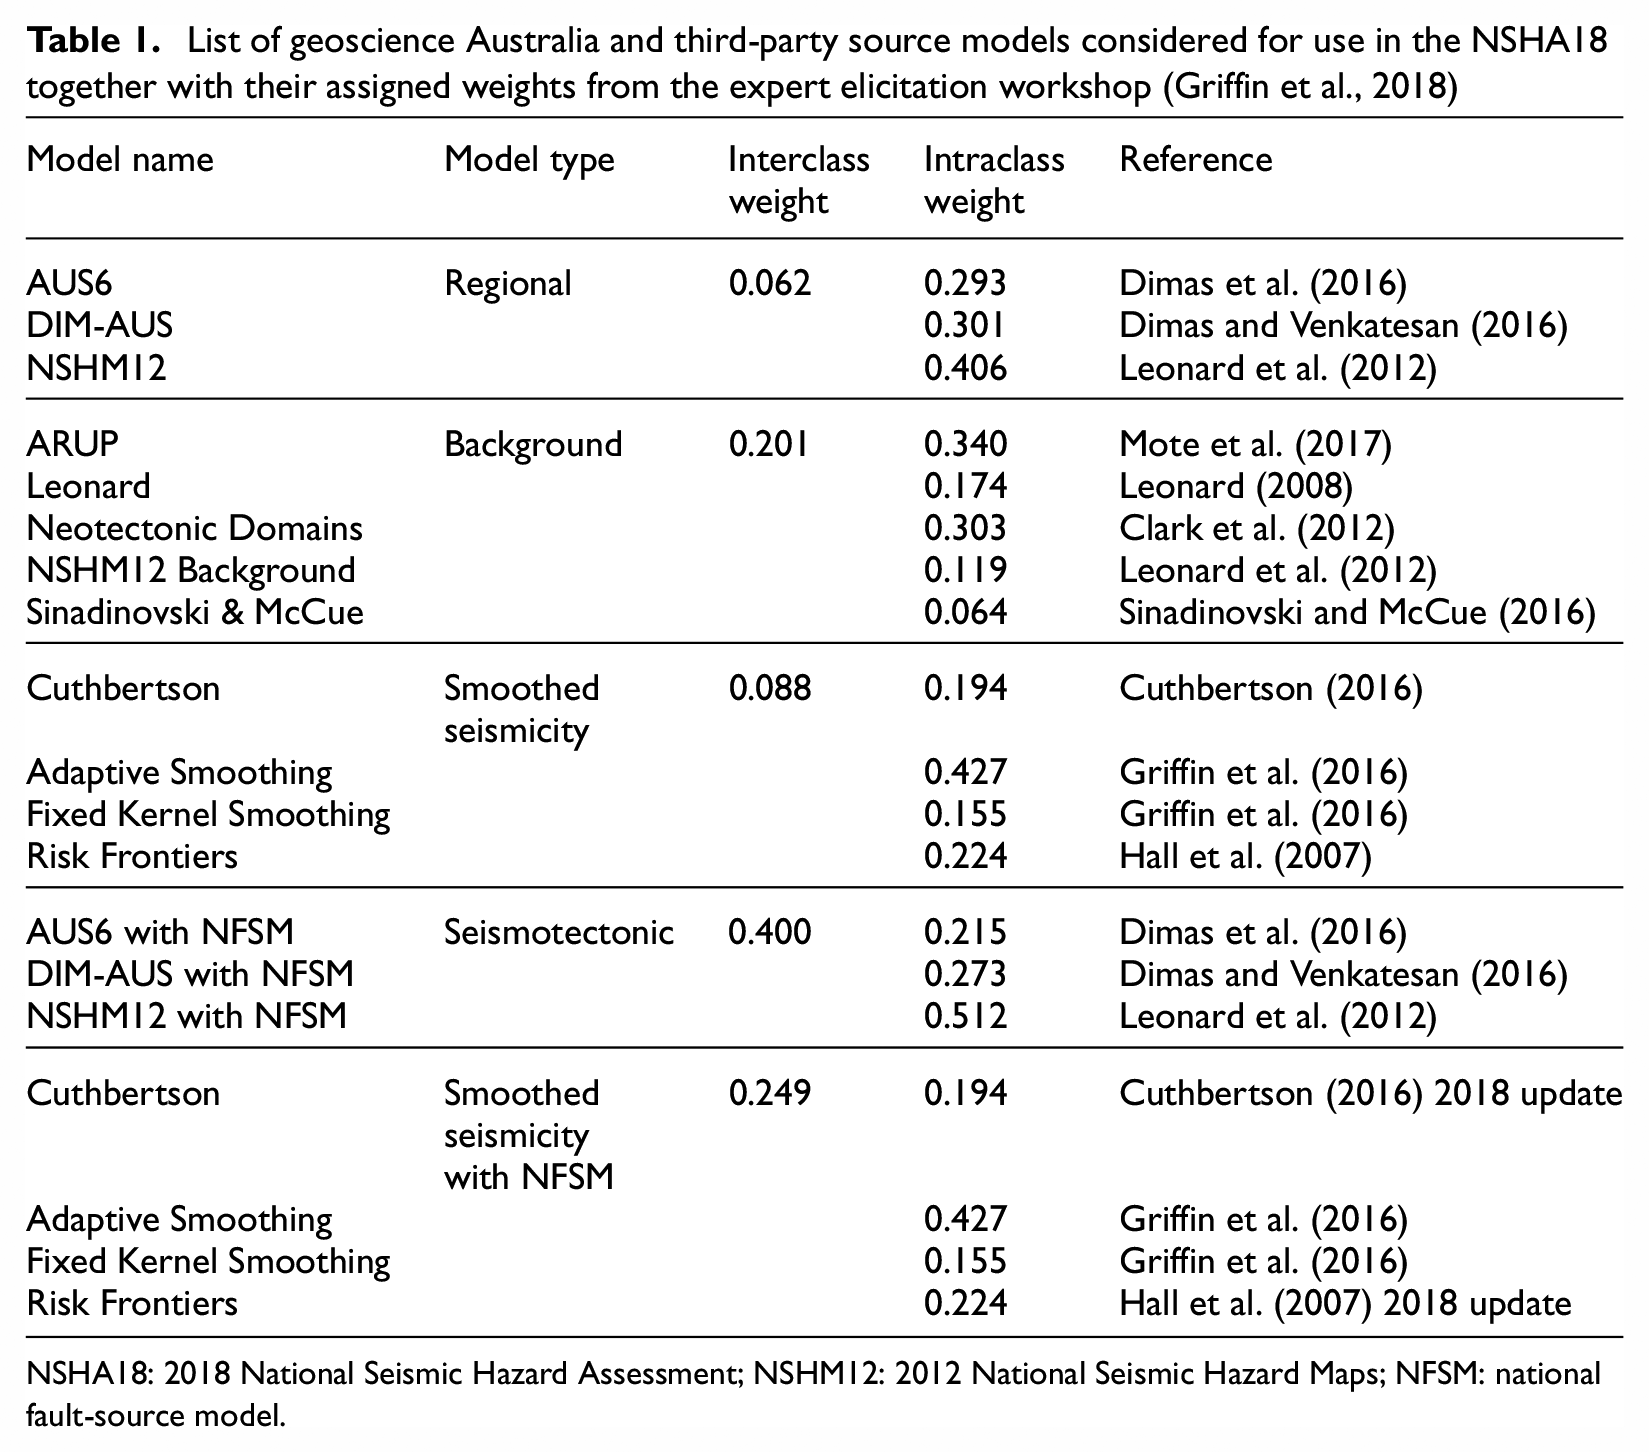
NSHA18: 2018 National Seismic Hazard Assessment; NSHM12: 2012 National Seismic Hazard Maps; NFSM: national fault-source model.
Under ideal circumstances, it would be desirable to follow the intended outcomes from the expert elicitation workshops. However, practical limitations negated the full model implementation within the existing computational framework. There were also instances where subsequent data analysis strongly conflicted with the expert elicitation outcomes. As a consequence, several exceptions to the expert elicitation outcomes were introduced into the final NSHA18 model. These exceptions are documented in Allen et al. (2018b).
National fault-source model
The NSHA18 has, for the first time, incorporated a national fault-source model (NFSM; Clark et al., 2016) to reflect the long-term hazard posed by known geological structures. The model includes some 356 onshore faults and 23 offshore faults, which are modeled as simplified planes and assigned a general dip and dip direction. Fault dips are obtained preferentially: (1) from seismic-reflection profiles, (2) inferred from surface geology and geomorphology, or (3) using faults in similar neotectonic settings as a proxy. The base of faulting is generally taken as the regional maximum seismogenic depth modeled in distributed seismicity sources, discussed below. Slip rates are estimated preferentially: (1) from displaced strata of known age, (2) from surface expression combined with knowledge of landscape modification rates (erosion/deposition), or (3) by proxy from similar neotectonic settings. A logic tree is developed to capture epistemic uncertainty in fault-source parameters, including the magnitude-frequency distribution (MFD) type (i.e. Gutenberg and Richter (1944) and characteristic Youngs and Coppersmith (1985)), and the potential for periodic or episodic recurrence behavior. The weights for this parameterization were calibrated through the expert elicitation workshop (Griffin et al., 2018).
Source-model types for Australia
Alternative SSMs combined through a logic-tree approach are often used in PSHAs to capture the epistemic uncertainty of multiple scientifically defensible alternatives (e.g. Bommer, 2012). For classical zone-based SSMs, the calculated ground-motion hazard can be very sensitive to the location of area-source boundaries (Leonard et al., 2014). The placement of these boundaries is often subjective and can be dependent on the modeler’s professional judgment and experience. Furthermore, if the modeler only considers one zone-based SSM, the strongest hazard gradients will often tend to occur in the vicinity of the area-source boundaries. Because the area-source boundaries developed by two (or more) independent modelers are unlikely to be duplicated exactly, the use of multiple SSMs will introduce “fuzzy” source-zone boundaries and can damp these strong spatial hazard gradients. In the NSHA18, five different SSM classes were used (Table 1). These include the following:
Background area-source models that use broad geographic zones within which earthquakes can occur anywhere with equal probability. For the NSHA18, these are typically source models with 20 or fewer area-source zones on the national scale;
Regional area-source models that assume the spatial distribution of seismicity is nonuniform at the scale of background source models and that the distribution of historical seismicity is useful to forecast future earthquake occurrence. These are typically models with 30 or more area-source zones on the national scale;
Smoothed seismicity data-driven models that yield spatially varying earthquake occurrence rates by smoothing the observed rates of earthquake occurrence with a given smoothing kernel (e.g. Frankel, 1995). These models assume that historical seismicity is a good predictor of future seismic hazard;
Seismotectonic models that combine regional source models with the national fault-source model (Clark et al., 2016);
Smoothed seismicity combined with a national fault-source model. These models combine short-term information from the instrumental catalog with long-term geological information from the fault-source model.
The latter two source-model types represent minor variations on the regional and smoothed seismicity models. In total, the NSHA18 used 19 independent SSMs for estimating the rates of earthquake occurrence at any given location in continental Australia (Allen et al., 2018b). These source models were weighted through a logic-tree framework (Griffin et al., 2018), and each provides a unique spatial representation of seismic hazard. As demonstrated in Figure 3, the consequence of using background source models (Figure 3a) may lead to lower seismic hazard values where seismicity has been relatively stationary in the instrumental era (Leonard, 2008). This raises questions over the appropriateness of including background models comprised of broad source zones for some areas such as the Flinders Ranges, the Latrobe Valley in the Gippsland Basin, and the eastern highlands regions (see Figure 1), where a century of observational data suggests seismicity in these regions is relatively stationary in space and time (Leonard, 2008).
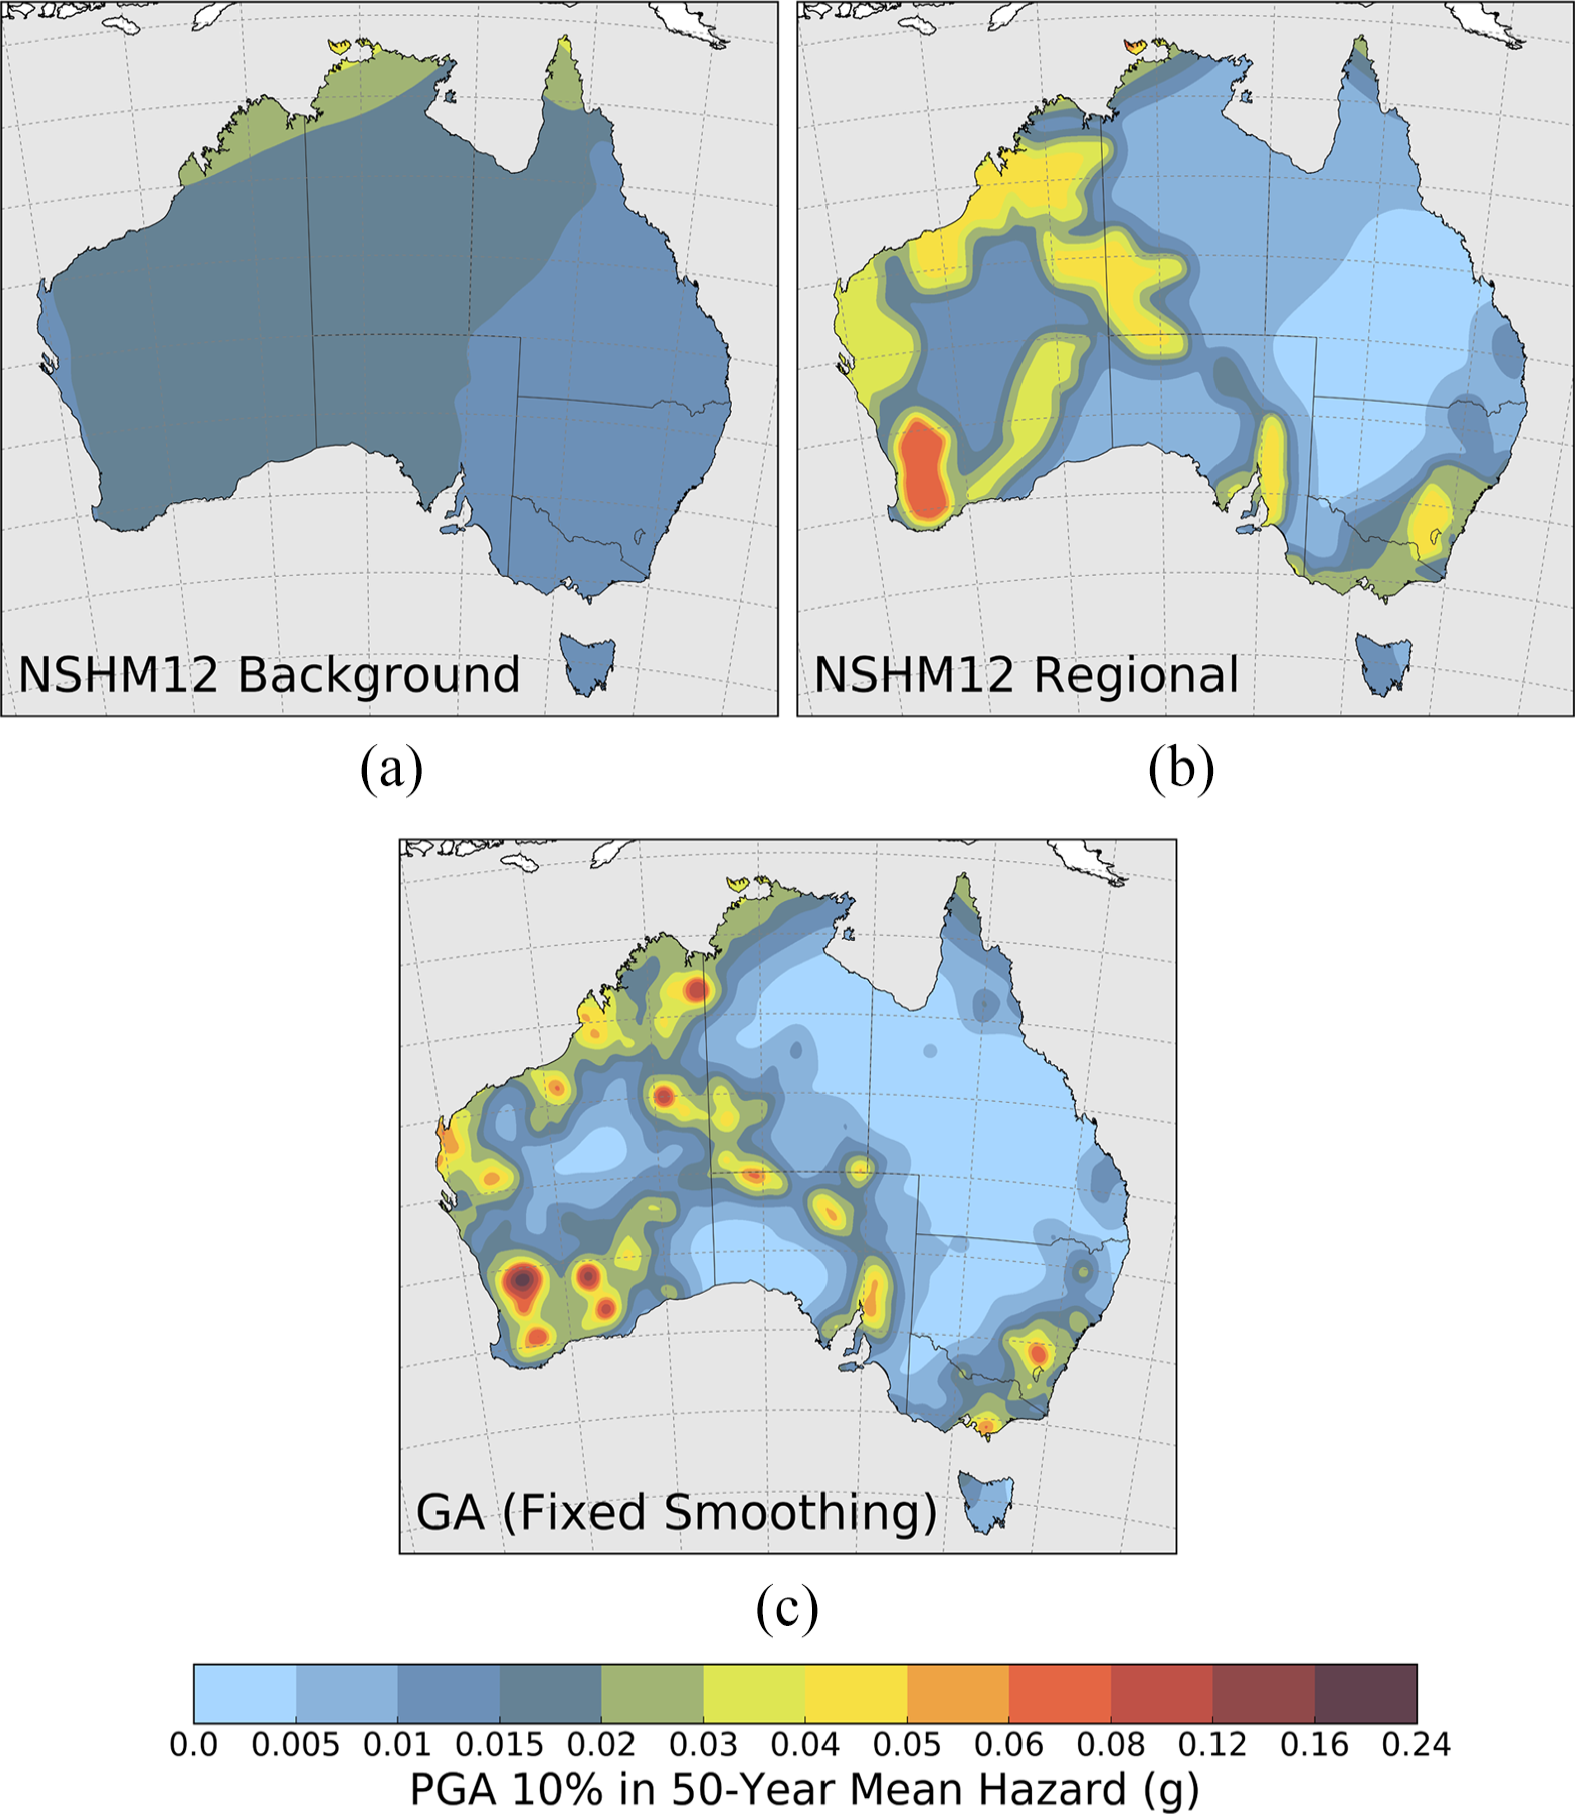
The mean 10% in 50-year PGA hazard expressed by three end-member source-model types as used in the NSHA18: (a) broad background zones (NSHM12; Leonard et al., 2012); (b) regional area sources (NSHM12; Leonard et al., 2012); and (c) smoothed seismicity (GA Fixed Kernel; Griffin et al., 2017).
The end-member alternative to the background source-model type is the smoothed seismicity model type (Figure 3c). These models focus the earthquake rate forecasts on regions with a high density of historical seismicity and tend to diminish the rates (and hazard) away from these areas. Smoothed seismicity source models have demonstrated effectiveness in active tectonic regions (ATRs; for example, Helmstetter et al., 2007) where the historical observation period is more likely to have recorded the full seismic cycle. Although this is not the case in slowly deforming regions, Griffin et al. (2017) achieved similar predictive performance of smoothed seismicity models for Australia when compared with those for ATRs. These results, which are primarily based on small earthquakes, suggest decadal-scale seismicity for at least some parts of Australia may be approximated by a stationary process despite strong evidence for longer-term non-stationarity of large earthquakes (Clark et al., 2012). The regional source models (Figure 3b) forecast hazard intermediate to these model types and provide some balance to the discrepancies between the two SSM end-members.
One challenge for forecasting seismic hazard for SCRs is the long recurrence times for large earthquakes. While the use of large background source models may need to be reconsidered for eastern Australia where seismicity has been comparatively stationary, there is mounting evidence in central and western Australia to suggest that seismicity is non-stationary over time and could vary over decade-long timescales (Clark and Allen, 2018; Clark et al., 2012; Leonard, 2008; Leonard and Clark, 2011). Therefore, the use of background source models that allow for migration of large earthquake locations over longer timescales may become more important. Hazard modelers must therefore strike a balance between these end-member models when calculating seismic hazard at national scales. Furthermore, the relative weight placed on a specific model type (e.g. smoothed seismicity, regional, or background) might vary spatially, and also on the return period of interest.
The earthquake occurrence rates for all SSM types (in continental Australia), with the exception of the fault-source model, are underpinned by the earthquake catalog developed for the NSHA18 (Allen et al., 2018c). Within a background source model, the individual zones were grouped into neotectonic domain classes, modified slightly from those defined by Clark et al. (2012). All earthquakes from the declustered NSHA18-Cat (Allen et al., 2018c) enveloped within the combined zone class were used to calculate the class-specific b-value using the Weichert (1980) algorithm. An activity rate for individual source zones was then calculated assuming a fixed b value consistent with the neotectonics class. Individual source zones in regional source models were assigned b values from those calculated by the background Neotectonic Domains source model (Clark et al., 2012) based on the centroid of the zones. The activity rates were calculated on a zone-by-zone basis. The b values used for the smoothed seismicity models were also adopted from the Neotectonic Domains source model. The full details on the assignment of earthquake recurrence statistics to each of the SSMs are explained in Allen et al. (2018b). The models were combined using a logic-tree framework and the final SSM logic-tree weights are provided in Table 1. Readers are referred to references provided in Table 1 for more discussion on the development of the individual SSMs used in the NSHA18 source-model logic tree.
Northern plate margin sources
Large earthquakes in eastern Indonesia and Papua New Guinea (PNG) have the potential to generate significant ground-shaking in northern Australia. This has particular significance for northern Australian communities and infrastructure projects. Several large earthquakes in the Banda Arc—at its nearest, approximately 400 km away from the nearest Australian continental landmass—have caused ground shaking–related damage in Darwin over the historical period (Hearn and Webb, 1984; McCue, 2013; Saroukos, 2019). Due to the tectonic complexity of the region, and the availability of a number of recent geological, geodetic, and seismological studies, a revised SSM was developed to underpin both NSHA18 and the 2018 revision to the Australian Probabilistic Tsunami Hazard Assessment (PTHA18; Davies and Griffin, 2018). The rationale for the revised source model, including a review of recent literature on seismogenic sources in the region, is detailed in Griffin and Davies (2018).
A common plate margin SSM was appended to each of the SSMs developed for continental Australia in Table 1. This plate margin source model extends to a distance of more than 800 km from the mainland Australian coastline, based on the GMM integration distance recommended by the expert elicitation panel (Griffin et al., 2018). A subsequent review of hazard profiles with distance from the Timor Trough indicated the need to extend the GMM integration distance for these plate boundary sources to at least 1000 km (Allen et al., 2018b). However, this change was not retrospectively used to update the plate margin SSM. This is partially because the most significant active seismic sources that could influence ground-shaking hazard on the Australian mainland lie within the original 800 km cut-off range.
Fault-source models are defined for the major tectonic structures of the region (e.g. the Java Trench, the Timor Trough). Area-source models were then defined for regions not covered by the major fault sources. In general, these source zones were adapted from existing seismic hazard models for PNG and Indonesia (e.g. Ghasemi et al., 2016; Irsyam et al., 2017). Some geometrical simplifications were made to these models recognizing that such details will have limited impact for calculation of hazard in Australia given the large source-to-site distances (Griffin and Davies, 2018). Intraslab sources were modeled using a series of tiered area sources covering different depth ranges. Earthquake recurrence statistics for these sources used Version 5 of the International Seismological Center (ISC)–Global Earthquake Model (GEM) Global Instrumental Earthquake Catalog (Storchak et al., 2015). Catalog declustering was performed using the Gardner and Knopoff (1974) algorithm.
Ground-motion characterization
The aleatory variability within and epistemic uncertainty between ground-motion attenuation models are often considered to contribute some of the largest uncertainties in PSHAs (Al Atik et al., 2010; Bommer and Abrahamson, 2006). This is particularly true of SCRs such as Australia with few near-source data recorded from moderate-to-large earthquakes. Nevertheless, GMMs that predict the intensity of ground-shaking for a given magnitude and distance (on a given site class) form an essential component to modern PSHAs. While there is a paucity of data from which to develop empirical GMMs, simulation-based approaches in Australia (e.g. Allen, 2012; Liang et al., 2008; Somerville et al., 2009) can be applied through the use of local earthquake source and propagation path characteristics (e.g. Allen et al., 2007).
Models to estimate the attenuation of PGA and peak ground velocity (PGV) were developed as part of the Gaull et al. (1990) national seismic hazard assessment. These models were based on mean isoseismal radii from well-documented Australian earthquakes (e.g. Everingham et al., 1982). Macroseismic intensity levels were converted to peak ground-motion intensity measures using conversions developed by Gaull (1979) from strong-motion observations in PNG. While this was a practical solution due to the paucity of high-quality Australian ground-motion records available at the time, it has been recognized that attenuation relationships based on isoseismal radii can significantly overestimate median ground-motion intensities commonly used in modern hazard assessments (e.g. Campbell, 1986). Furthermore, intensity conversion relationships can be regionally dependent (e.g. Caprio et al., 2015; Cua et al., 2010) and the assumption that the relationships derived for PNG are applicable to Australian earthquakes has not been sufficiently verified.
When the 1991 earthquake hazard map was developed, there was a general perception that the Gaull et al. (1990) PGA attenuation relationships underestimated recorded accelerations for Australian earthquakes (McCue, 1993). Consequently, McCue et al. (1993) divided the PGV contours (in mm/s) developed by Gaull et al. (1990) by a factor of 750 to calibrate the PGA contours (in g). The 750 divisor appears to be a rounded version of the number recommended by the Applied Technology Council (ATC, 1984: 301) for converting peak velocity to “effective” PGA. A more precise determination of this conversion factor yields a value of 762 (McPherson et al., 2011). Applying the former conversion factor (750) on the Gaull et al. (1990) PGV ground-motion predictions yields effective PGAs approximately 30%–65% larger at distances less than 100 km, compared to the published Gaull et al. (1990) PGA equations (Figure 4).
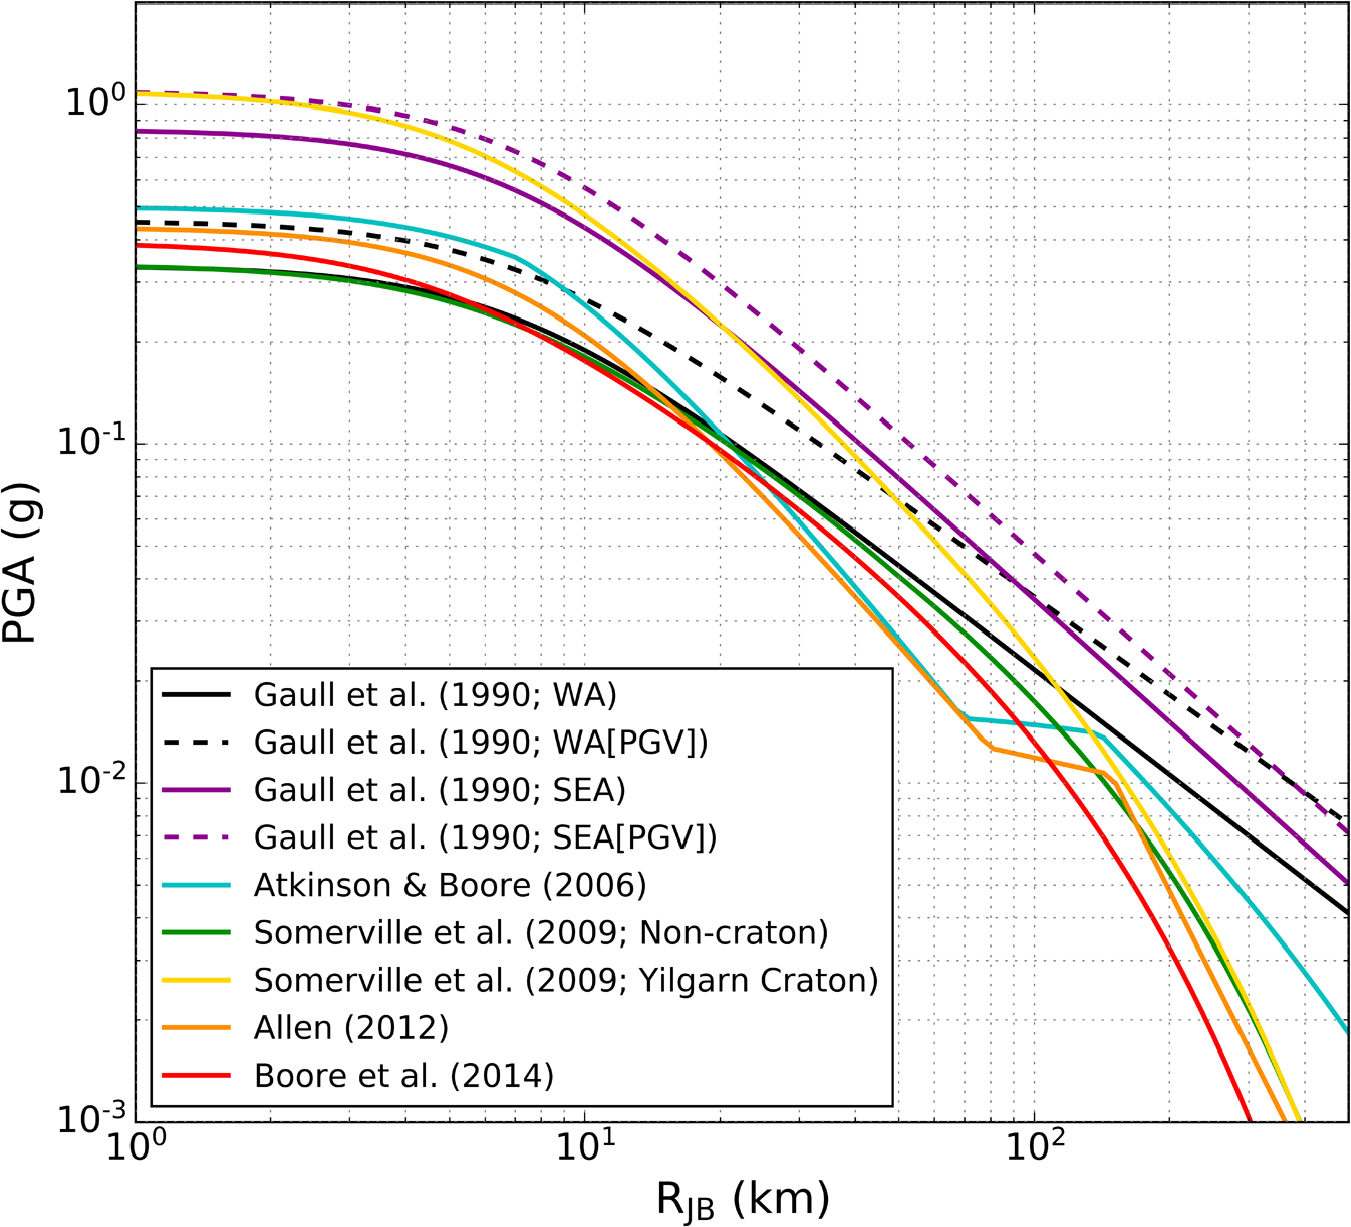
A selection of ground-motion models (GMMs) as applied in the NSHA18 showing the attenuation of PGA with distance for an earthquake of magnitude M 6.0 and an AS 1170.4–2007 (2018) soil class of Be (VS 30 = 760 m/s). The Gaull et al. (1990) GMMs—the basis for the AS 1170.4–1993 seismic hazard factors—for southeastern Australia (SEA) and western Australia (WA) are shown. The M was adjusted to an equivalent ML for the implementation of the Gaull et al. (1990) SEA GMMs (approximately ML 6.2). The modified Gaull et al. (1990) SEA PGV-based GMM shows significantly higher PGA values than all models, particularly at distances greater than 50 km. The WA PGV-based GMM is more consistent with the attenuation of PGA at short distances relative to modern GMMs, but also indicates slower attenuation (and higher ground motions) at larger distances.
Figure 4 compares the PGA attenuation with distance for a selection of GMMs as applied in the NSHA18. For comparison, the Gaull et al. (1990) GMMs are shown, together with the adjustments used to calibrate the AS 1170.4–1993 hazard contours (McCue et al., 1993). In general, the Gaull et al. (1990) GMMs attenuate at slower rates than modern GMMs. The southeastern Australian (SEA) model of Gaull et al. (1990), in particular, predicts very high ground-motions for moderate-to-large-magnitude earthquakes at all distances relative to most of the other non-cratonic GMMs used for the NSHA18.
In order to guide the selection of appropriate GMMs for use in the NSHA18, ground-motion data were compiled from significant Australian earthquakes that occurred in cratonic and non-cratonic crust (i.e. Figure 1). These data were processed in a uniform manner and 5% damped response spectra were calculated to compare the data against commonly used GMMs (Ghasemi and Allen, 2018). The OpenQuake oq-hazardlib library (Weatherill, 2014) was used to calculate a suite of predictive ground-motion values from 18 GMMs for magnitude–distance couples consistent with the recorded data. The recorded data were subsequently compared to the predictions using both semi-quantitative residual analysis and quantitative likelihood testing (e.g. Scherbaum et al., 2009). Rock sites with a National Earthquake Hazards Reduction Program (NEHRP) site class B/C were assumed, with a time-averaged shear-wave velocity in the upper 30 m (VS 30) of 760 m/s. The full details of these analyses are provided in Ghasemi and Allen (2018).
The number of GMMs available for use in PSHAs continues to grow rapidly (e.g. Douglas, 2018; Goulet et al., 2018) and choosing appropriate models for any given tectonic region type is a challenging task. Various measures can be applied to provide quantitative rankings of GMMs from local and analogue tectonic regimes (e.g. Scherbaum et al., 2009). While these quantitative analyses can be informative, care should be taken not to overinterpret the results, particularly given the sparsity of ground-motion datasets available in SCRs like Australia (Ghasemi and Allen, 2018). For example, the use of quantitative ranking measures can reflect the overall performance of a model against the entire ground-motion dataset. However, this may undermine some desirable features of a GMM, such as model performance against near-field or long-period data (e.g. Somerville and Ni, 2010). Furthermore, conclusions drawn regarding ranking the performance of GMMs using small-magnitude data may not be a reliable indication of their relative performance in predicting motions from larger events (e.g. Beauval et al., 2012). Consequently, there is an ongoing need for professional judgment in this aspect of ground-motion characterization (GMC) for Australia.
Information on the performance of various GMMs with respect to Australian earthquake data was provided to participants at the GMC expert elicitation workshop (Ghasemi and Allen, 2018). This information was intended to provide a basis for the workshop participants to make semi-quantitative judgments on the performance and application of these models for the NSHA18. GMMs were selected through the structured expert elicitation process (Griffin et al., 2018) for three tectonic region types; cratonic, non-cratonic, and subduction. The latter tectonic region type was intended to be used for all plate margin earthquake sources and represents a mélange of GMMs developed for subduction interface, subduction intraslab, active shallow crust, and SCR crust. Given the difficulty in specifying appropriate attenuation for this region (e.g. Allen, 2019), some of these GMMs were used outside of their predefined magnitude, distance, and hypocentral depth ranges. Consequently, minor adjustments to the expert elicitation-based GMM logic tree were applied where subsequent analysis indicated that some GMMs resulted in erratic behavior when used outside of their preferred conditions of use (Allen et al., 2018b). Weights for the final NSHA18 GMM logic tree are provided in Table 2.
List of GMMs used in the NSHA18 together with their assigned weights (Allen et al., 2018b), modified from the Expert Elicitation Workshop (Griffin et al., 2018)
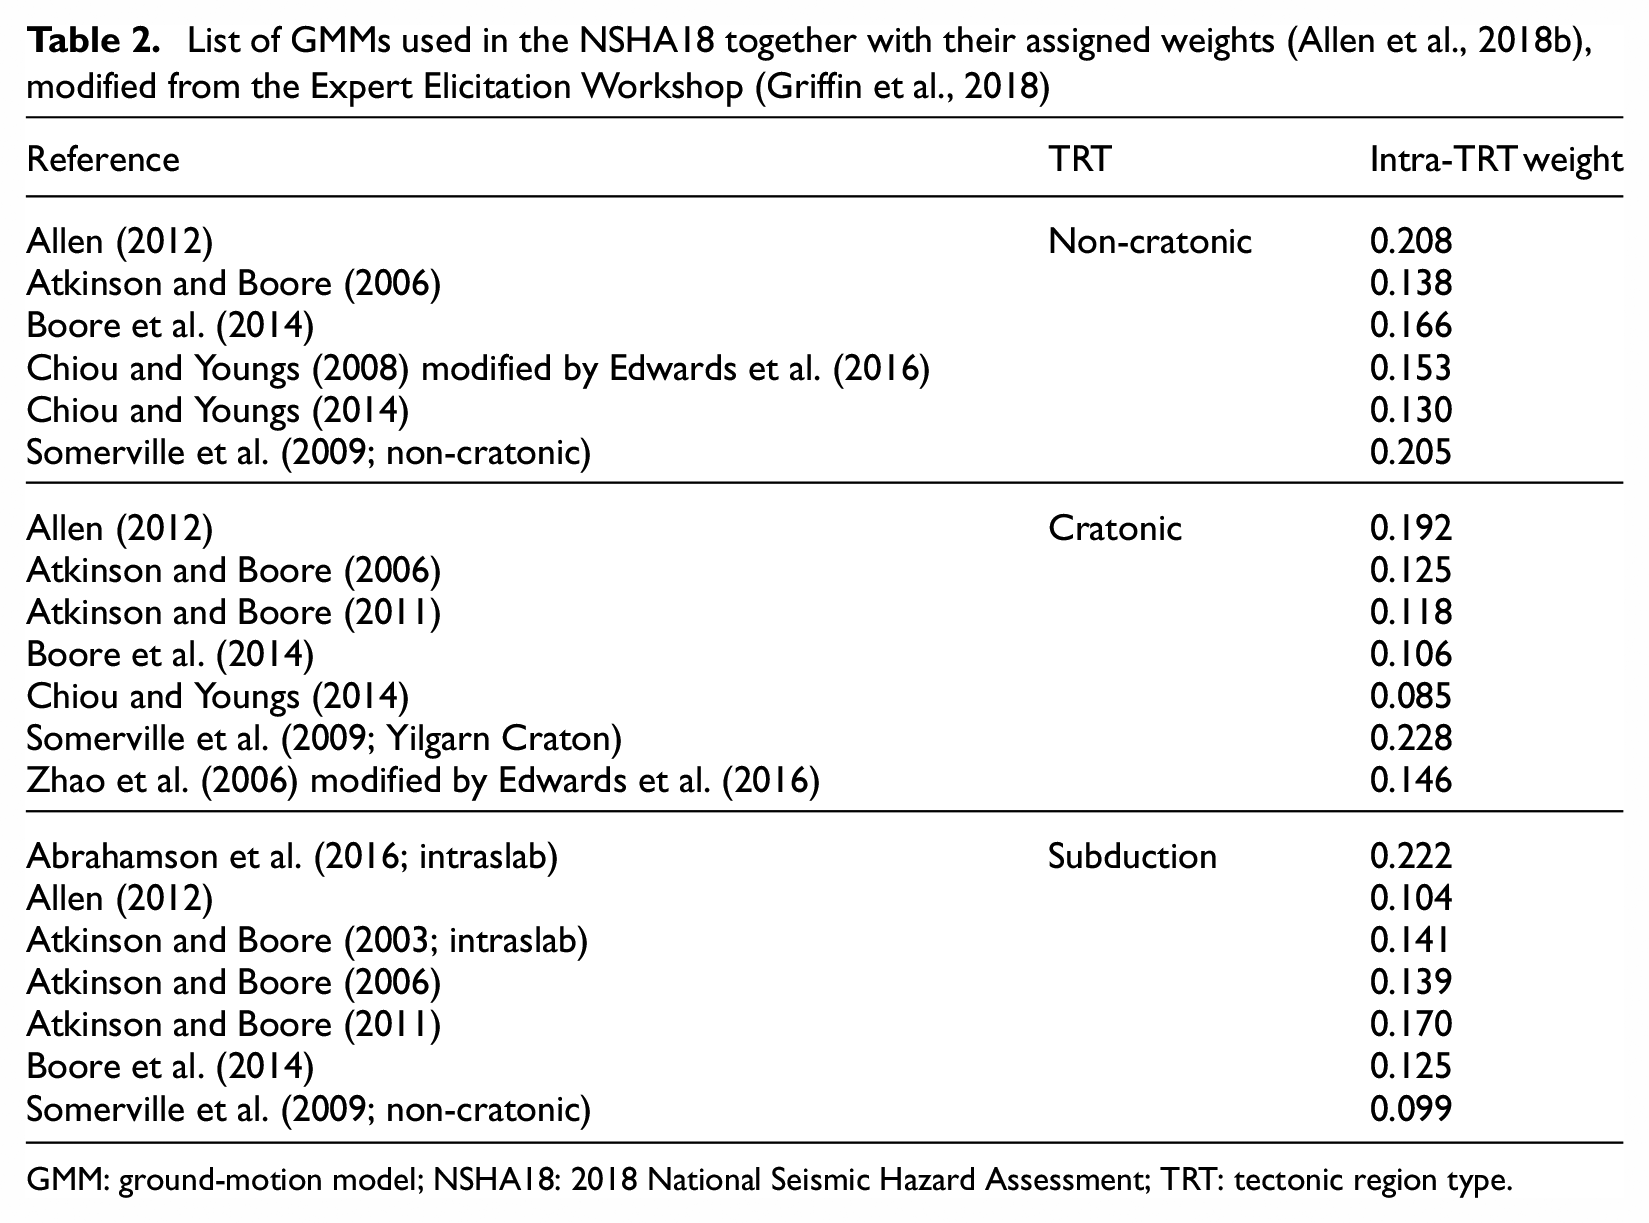
GMM: ground-motion model; NSHA18: 2018 National Seismic Hazard Assessment; TRT: tectonic region type.
NSHA18 hazard model implementation
All SSMs were combined as input for the OpenQuake-engine (Allen et al., 2018a). The NSHA18 earthquake catalog (Allen et al., 2018c), homogenized to moment magnitude M, is used to determine earthquake rates for all of the area and gridded seismicity source models for continental Australia. Regionally dependent magnitude-completeness models were developed based on the spatiotemporal distribution of Australian seismograph networks (Leonard, 2008; McCue, 2004). Using this information, Gutenberg–Richter b values (Gutenberg and Richter, 1944) were determined using the Weichert (1980) maximum likelihood method.
For each SSM, earthquake occurrence rates from multiple MFD branches (five maximum magnitude Mmax branches and three coupled a- and b-value branches) were collapsed onto a single incremental occurrence rate curve per source by calculating the weighted mean from the 15 MFD branches (Allen et al., 2018a). While preserving mean seismic hazard and significantly improving computational efficiency, this approach does not allow for the calculation of the full suite of hazard fractiles (see “Intrasource-model uncertainty” section). An alternative approach would be to sample the logic-tree branches. While better representing the model uncertainty, this may not necessarily result in mathematically exact mean hazard. The final model was deployed on the National Computational Infrastructure (NCI), and mean PGA and spectral acceleration values Sa(T) for T = 0.05, 0.1, 0.2, 0.3, 0.5, 0.7, 1.0, 1.5, 2.0 and 4.0 s were calculated. The hazard is calculated for AS 1170.4–2007 (2018) site class Be.
Hazard curves indicating the probability of exceedance for a range of ground-motion intensities were calculated over a 15-km-spaced grid for over 54,000 sites across the continent and surrounding region to allow for the generation of a national seismic hazard map for each ground-motion intensity measure. The hazard curves were interpolated to return hazard grids at 10%, 9.52%, and 2% probability of exceedance in 50 years. These probabilities correspond to ground-motion return periods of 475 years (Figure 5), 500 years, and 2475 years, respectively. While there are only minor hazard differences between the 475- and 500-year return periods (typically less than 5%), the AS 1170.4 specifies hazard values at the latter return period. Consequently, explicitly providing these values removes any unnecessary ambiguity in comparing hazard values. Hazard curves derived on site class Be were also calculated for populous localities listed within Table 3.2 of the AS 1170.4–2007 (R2018), as well as some additional sites of interest. In this article, the reported maps and hazard values are given at the probability level of 10% chance of exceedance in 50 years unless otherwise stated. All data presented are provided in the data package associated with Allen (2018) in addition to maps and data grids for other exceedance probabilities and the suite of ground-motion intensity measures.
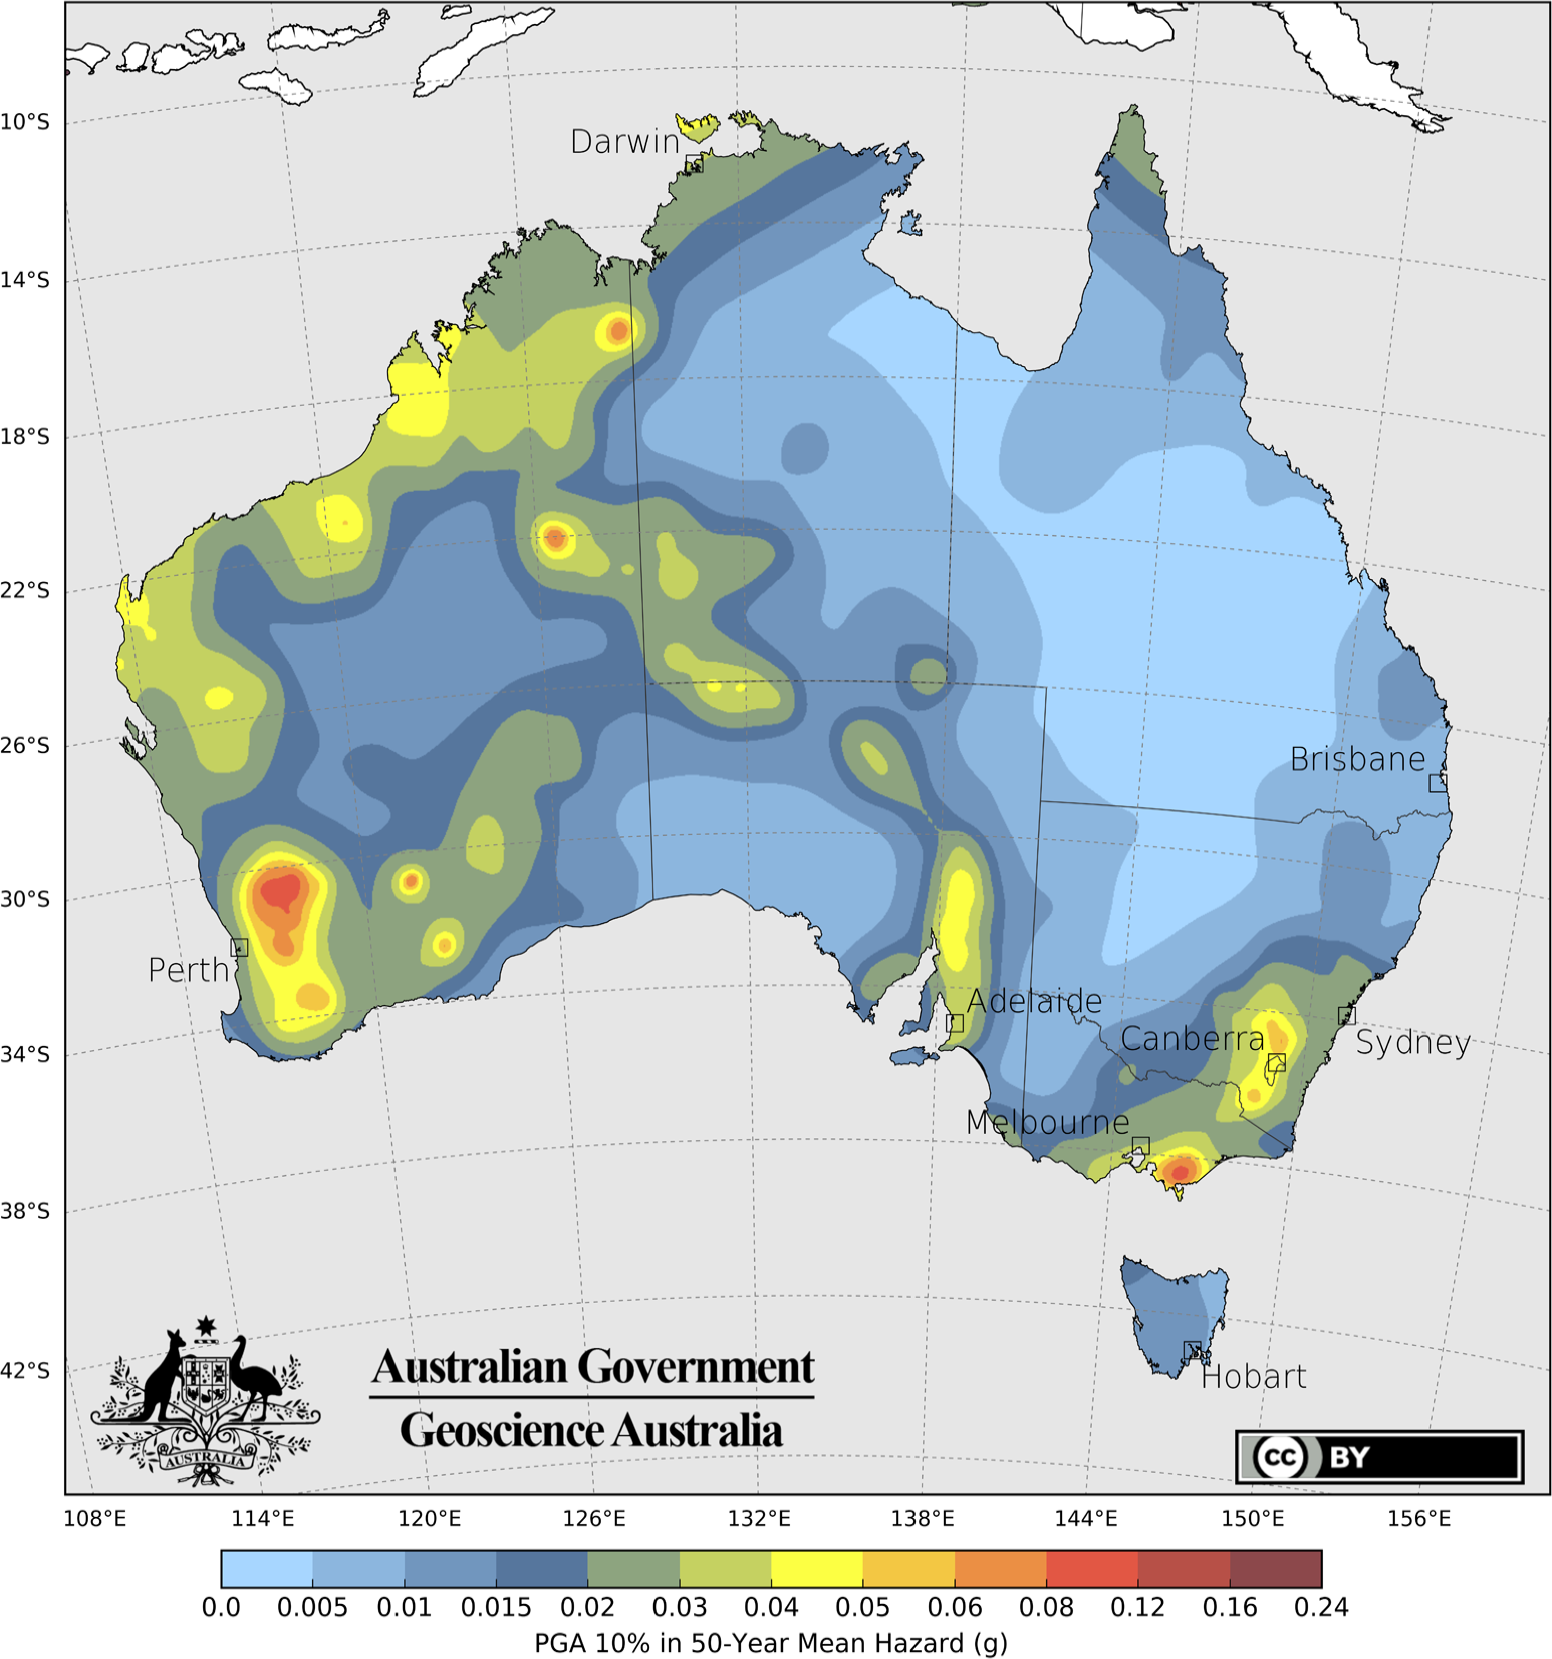
The NSHA18 hazard map indicating the mean PGA (in g) for 10% probability of exceedance in 50 years on AS 1170.4 Site Class Be (equivalent to VS 30 = 760 m/s).
PGA values at the 10% probability of exceedance in 50-year level across Australia have decreased, on average, by 72% relative to the earthquake hazard factors provided for localities in the AS 1170.4–2007 (Standards Australia, 2007). Furthermore, the NSHA18 10% in 50-year PGA values are approximately half of those in the NSHM12 (Leonard et al., 2013, 2014), with an average decrease of 48% at AS 1170.4 localities.
Rationale for changes to mean hazard
It is clearly apparent from the preceding section that seismic hazard factors estimated from the NSHA18 are significantly lower than those used in the AS 1170.4–2007 (R2018) and its predecessors since 1991. In the two and a half decades since the AS 1170.4–1993 was first established, scientists have learned a great deal about earthquake occurrence, the seismogenic potential of different crustal settings, and the physical effects of earthquakes in Australia, as well as those in analog tectonic regions. For this reason, it is essential to update seismic design values in Australia based on the best available evidence-based science and methods. In addition to more accurate earthquake source parameters (i.e. hypocenters and magnitudes) and a more complete catalog augmented with almost three decades worth of data, this section outlines the key attributes of the NSHA18 that have led to the large differences in seismic hazard relative to the 1991-era hazard map that currently underpins Australian seismic design (Standards Australia, 2018).
Use of a national fault-source model
While hazard values have generally decreased relative to the AS 1170.4–1993 hazard values, the introduction of national seismotectonic SSMs (Clark et al., 2016; Clark and Leonard, 2014; Griffin et al., 2016) has resulted in some localized increases in accelerations relative to simple distributed seismicity source models (Allen et al., 2018b; Clark and Allen, 2018). The increases are particularly pronounced in regions with a high density of mapped neotectonic faults, and where these faults are associated with relatively high activity rates (Clark and Allen, 2018; Clark et al., 2016; Clark and Leonard, 2014). Figure 10 in the electronic supplement shows plots hazard curves for four Australian capital cities with varying contributions of hazard from the seismotectonic source models. As previously noted by Clark and Leonard (2014), while the city of Perth is located near the seismically active SWSZ (Doyle, 1971), it receives very little contribution to total hazard from nearby fault sources, which are sparsely distributed and assigned with very low slip rates (Allen et al., 2018a; Clark et al., 2016). In contrast, the cities of Adelaide and Canberra (see Figure 5 for city locations) are proximal to a number of relatively high-slip-rate faults (up to 120 m/Ma; Allen et al., 2018a; Clark et al., 2016). Consequently, they experience significant localized hazard contributions from the seismotectonic fault-source model, with an increase of PGA hazard at the 10% in 50-year level of approximately 40% relative to distributed seismicity source models alone. The city of Melbourne presents a third end-member case. The city is bounded by relatively high-slip-rate, fault-dense regions: the Otway and Gippsland Basins (Figure 1), respectively. However, the hazard relating to these regions decays rapidly in the 30–50 km to the Melbourne metropolitan region, resulting in only an approximate 14% increase in hazard relative to distributed seismicity models alone.
Adjustment of local magnitudes
A part of the reason for the significant decrease in seismic hazard at many sites is the adjustments made to catalog magnitudes. Prior to the early 1990s, most Australian seismic observatories relied on the Richter (1935) local magnitude (ML ) formula developed for southern California (Allen et al., 2018c; Leonard, 2008). At regional distances (where many earthquakes are recorded, approximately > 200 km), the Richter scale tends to overestimate ML relative to modern Australian magnitude formulae (Allen, 2010). Hence, there is a need to correct magnitude biases for Australian earthquakes where the magnitude has been determined using California magnitude relationships. A process was employed that systematically corrected local magnitudes using the difference between the original (inappropriate) magnitude corrections (e.g. Richter, 1935) and the Australian-specific corrections (e.g. Michael-Leiba and Malafant, 1992) at a distance determined by the nearest recording station likely to have recorded any given earthquake. The method is detailed in Allen et al. (2018c), and has the general effect of decreasing the magnitudes of those earthquakes recorded at regional distances. The effect is greatest prior to 1990 by virtue of the lower spatial density of seismic instrumentation across the continent. As the magnitudes of moderate-to-large earthquakes are in general reduced, so too are the annual rates of occurrence of these events (e.g. Figure 6). Given that this method only considers the nearest recording station likely to have recorded an earthquake, it is likely that these corrections represent an underestimate of the possible corrections required given the increasing divergence of Australian and Californian magnitude corrections for increasing distances (Allen et al., 2018c).
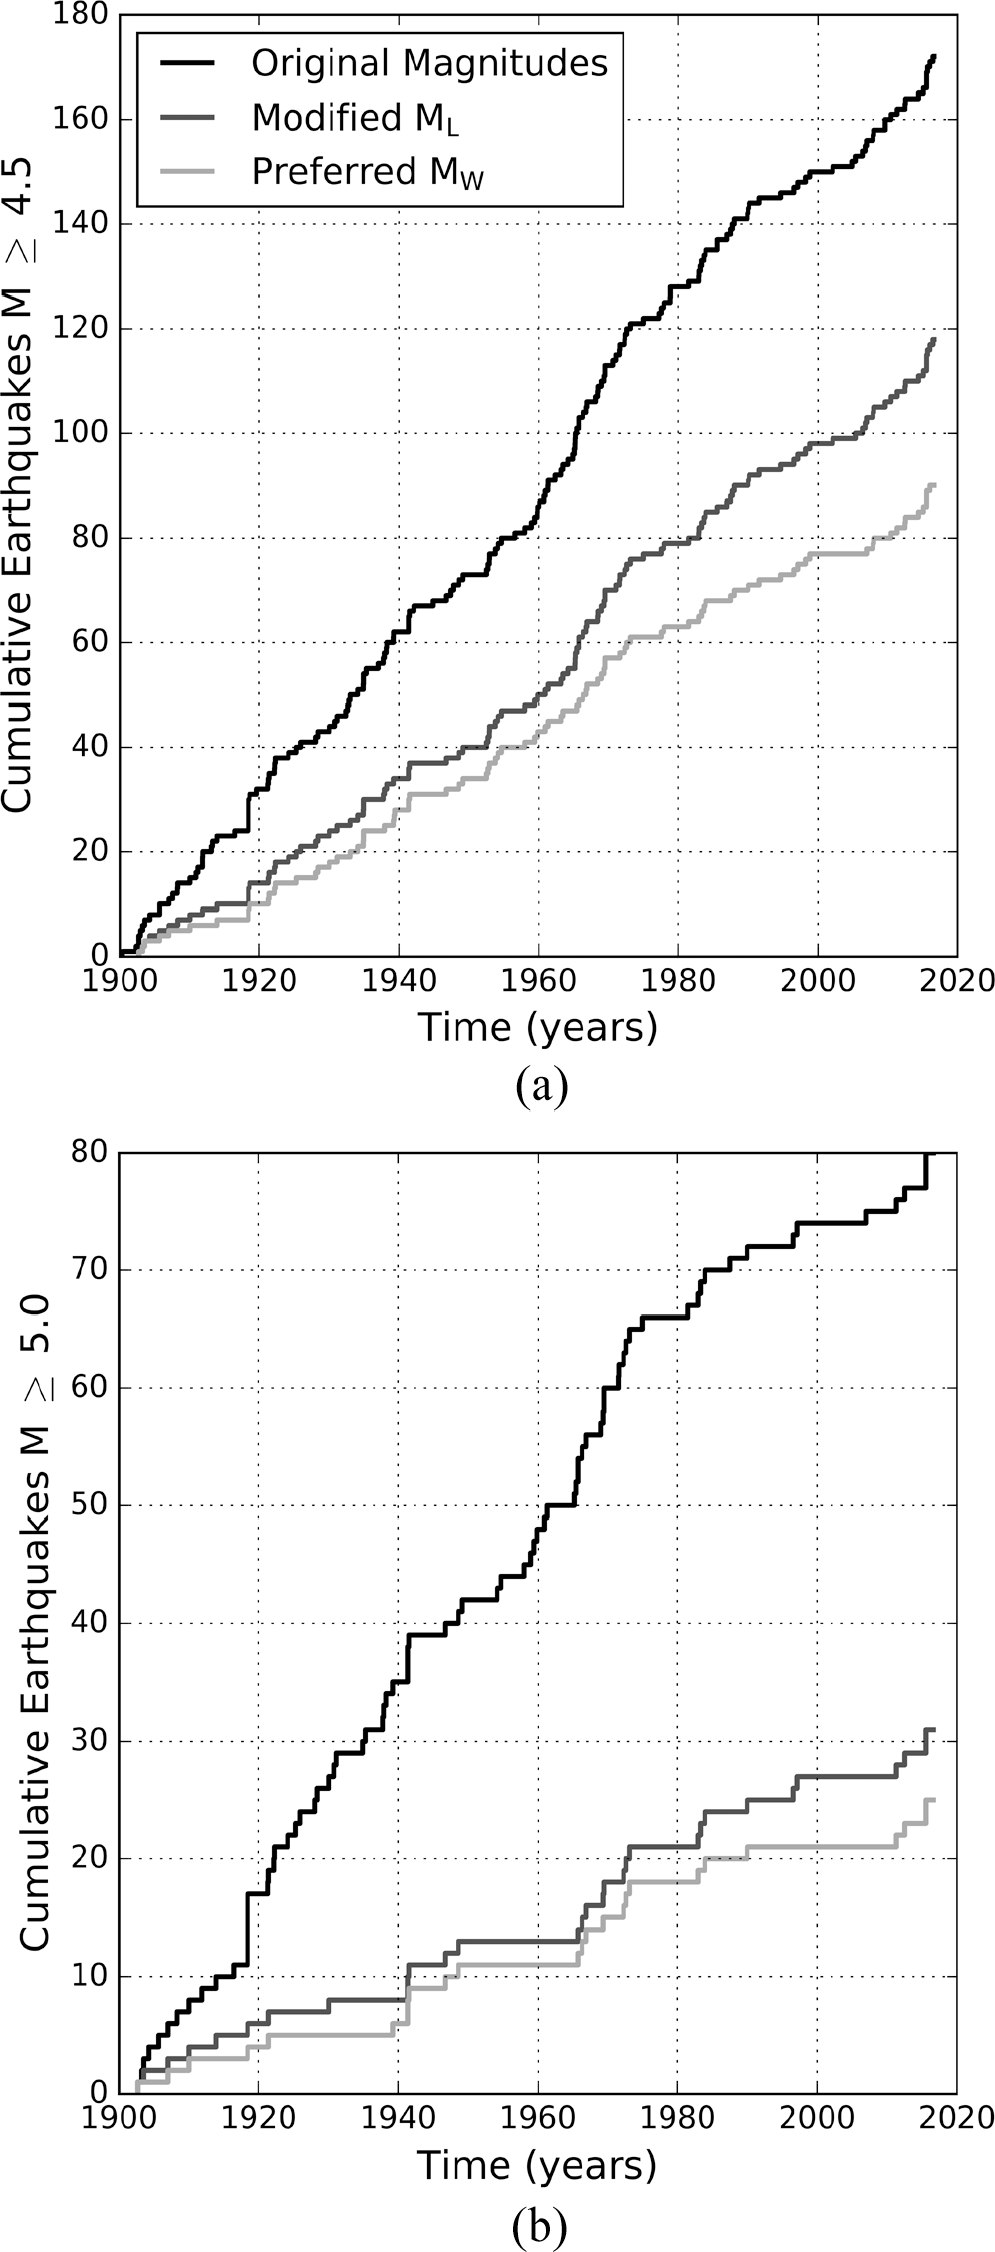
Cumulative number of earthquakes exceeding magnitude (a) 4.5 and (b) 5.0 for earthquakes in eastern Australia (east of 135°E longitude) since 1900. The different curves show different stages of the NSHA18 catalog preparation: original preferred magnitudes, modified magnitudes only local magnitude modified), and preferred
ML-
M conversions
Another factor contributing to the reduction in hazard is the conversion of catalog (e.g. ML
) magnitudes to moment magnitude (
Changes to Gutenberg–Richter b value
The ML
to
Hazard changes from combined magnitude adjustments
To explore the sensitivity of seismic hazard estimates to the catalog adjustments (ML
adjustments and
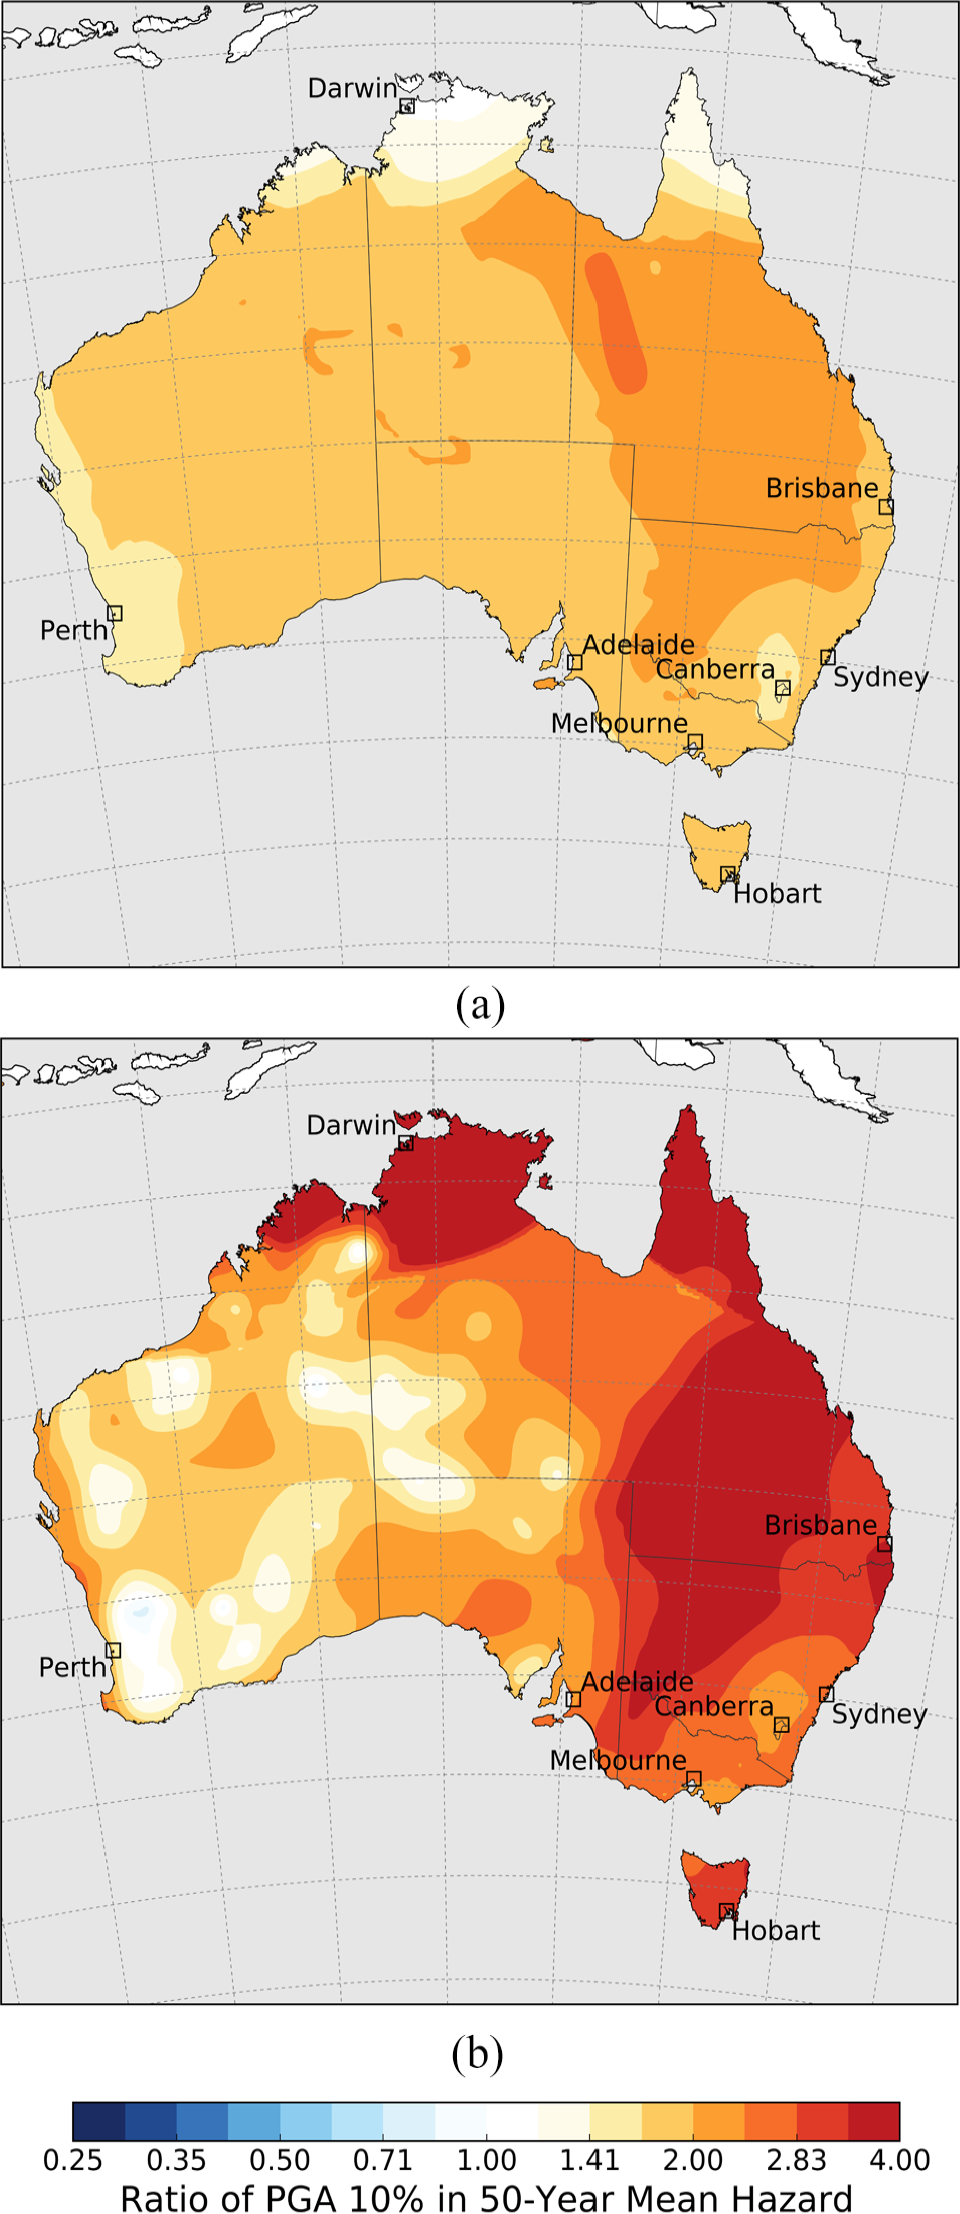
The ratio of 10% probability of exceedance in 50-year PGA hazard calculated (a) using MFDs calculated using original catalog magnitudes, Mx and (b) using the Gaull et al. (1990) GMMs (PGV converted to PGA) with the full 19-branch NSHA18 source model. Values greater than 1.0 (orange-red colors) indicate where the alternate hazard assessments (the numerators) forecast higher hazard than the NSHA18 (the devisor). The color scale is truncated at a factor of 4.0 for plotting clarity.
Use of modern GMMs
The final factor driving the reduction of calculated seismic hazard in Australia relative to the 1991 national map of McCue et al. (1993) is the use of modern GMMs. While seismologists in SCRs worldwide recognize the complexity in characterizing the likely ground motions from rare large earthquakes, the intensity of near-source ground-motions and the rates of crustal attenuation are becoming better understood as more ground-motion data from moderate-to-large-magnitude earthquakes become available (e.g. Goulet et al., 2014). Furthermore, methods for simulating earthquake ground motions in SCRs are continuing to improve (e.g. Goulet et al., 2015). As described previously, the hazard levels for the AS 1170.4–1993 map (McCue et al., 1993) were informed by the contours of the Gaull et al. (1990) PGV maps, divided by a factor of 750 (in mm/s) to approximate PGA in units of g (e.g. ATC, 1984). The Gaull et al. (1990) GMMs are generally found to be more slowly attenuating than modern GMMs (Figure 4).
To explore this contribution to the changes in seismic hazard relative to the assessment of McCue et al. (1993), the Gaull et al. (1990) GMMs were implemented within the OpenQuake-engine for the calculation of national-scale PGA ground-motions at the 10% probability of exceedance in 50 years. In undertaking this calculation, the full 19-branch SSM as used in the final NSHA18 calculations remained unchanged. However, the NSHA18 ground-motion logic tree, that weights at least six GMMs for each tectonic region type (Table 2), was replaced by a simplified logic tree that only referenced the Gaull et al. (1990) GMMs using their western Australian, SEA, and Indonesian GMM coefficients. These were used for cratonic, non-cratonic, and subduction tectonic region types, respectively.
Figure 7b shows the ratio of the mapped hazard calculated using the Gaull et al. (1990) GMMs (PGV converted to PGA) relative to the preferred GMMs used in the NSHA18. It can be seen that the Gaull et al. (1990) GMMs, with the PGV models converted to PGA as per the AS 1170.4–1993 development, result in higher hazard across the majority of the Australian landmass, with factors locally greater than four in the lower-hazard regions of eastern and northern Australia. The lower ratios in central and western Australia are likely due to three potential factors: (1) at near-source distances, the Gaull et al. (1990) GMM for western Australia is generally comparable to the modern suite of GMMs used in the NSHA18, but with lower rates of attenuation with distance (see Figure 4); (2) there are more abundant high-seismicity regions (relative to eastern Australia) that have a greater likelihood for these earthquakes to occur at near-source distances; and (3) the Somerville et al. (2009) GMM for the Yilgarn Craton (as used generically for cratonic environments), which estimates significantly higher PGAs at near-source distances than other modern models, contributes to higher hazard levels in these regions.
Quantifying modeling uncertainty
In developing national-scale PSHAs, the mean hazard is commonly presented with little attention given to the range of potential alternative solutions. This ensemble of solutions largely arises through the use of weighted logic-tree distributions that consider alternative seismic-source and GMMs. End users often perceive the mean results from PSHAs to be an accurate representation of reality (Lee et al., 2018). However, it is becoming increasingly important to communicate the mean hazard results from PSHAs in the context of their uncertainties. This ensures that hazard assessments are both transparent and defensible to end users and the wider seismological community (Douglas et al., 2014; Stein et al., 2012). Alternative seismic-source and GMMs combined through a logic-tree approach are often used in PSHA to capture the epistemic uncertainty of multiple scientifically defensible alternatives (e.g. Bommer, 2012). While the source geometry and consequent earthquake rates of area-based distributed seismicity models contribute notably to hazard variability among models (e.g. Leonard, 2017), there are additional uncertainties associated with other attributes of the source-model parameterization. These are typically characterized through probability density functions for parameters such as hypocentral depth, MFDs, Mmax , and style (and orientation) of faulting (Allen et al., 2018b). These parameters represent a mix aleatory variability and epistemic uncertainty.
Below, various contributions to the NSHA18’s epistemic uncertainty model are explored. In particular, (1) the variability within a single SSM in terms of the uncertainties associated with its MFD; (2) the variability between representative SSM types; and (3) the variability across the complete NSHA18 source model. For each of the components explored below, an ensemble of solutions of the 0th to the 100th percentile of hazard estimates for a 10% probability of exceedance in 50 years is calculated for the Australian capital cities. The end-member percentiles are approximated by the discrete branches of the respective logic trees.
Intrasource-model uncertainty
The variability of seismic hazard at a site can be sensitive to the proximity of that site to the boundaries of area-source models (Leonard et al., 2014). If a site is centrally located within a large area-source zone with uniform earthquake occurrence, then it should be expected that the within-model variability should be low, and any variability in the hazard would most likely be due to the epistemic uncertainty associated with GMMs and the zone’s MFDs (including Mmax ).
For each SSM, earthquake occurrence rates from 15 MFD branches (five Mmax branches and three coupled a- and b-value branches) were collapsed onto a single MFD per source by calculating the weighted mean incremental rate for each magnitude bin in the distribution. This preserves mean seismic hazard (see Figure 11 in the electronic supplement) and improves computational efficiency within the OpenQuake-engine. However, for any one seismic-source model, this approach does not allow for the calculation of the full ensemble of hazard fractiles. Figure 11 in the electronic supplement shows a comparison between the intramodel (or within-model) variability for the 15-branch MFD and the collapsed earthquake occurrence rates for a single SSM. The cumulative density functions (CDFs) representing the hazard fractiles differ at the tails of the distribution, but are generally similar near the 16th and 84th percentiles. The mean ground-motion for each site is nearly identical (≪1% difference). Therefore, while there is some loss of fidelity at the tails of the distribution by collapsing earthquake rates to a single incremental occurrence curve, the impact on the mean hazard is negligible. Figure 11 in the electronic supplement shows the within-model epistemic uncertainty for only one of the 19 SSMs used in the NSHA18 and demonstrates that any additional knowledge that could be gained on hazard variability through the use of the 15-branch MFD for each SSM would be difficult to distinguish when the full NSHA18 source-model logic tree is implemented given the large number of logic-tree branches required to sample the full model.
As seen in Figure 11 in the electronic supplement, Darwin demonstrates large within-model variability. This variability is likely driven by the large number of active seismic sources in the plate margin source model that affect the city (Griffin and Davies, 2018), and by the large variability between the selected GMMs used for these sources. The GMM logic tree used for this near-plate margin region represents a mélange of GMMs from different tectonic regions (Allen et al., 2018b). It includes models originally defined for subduction intraslab, shallow active crust, and SCRs. The intent for including this mix of models from different tectonic environments, as determined through the expert elicitation workshop (Griffin et al., 2018), was to capture both the range of source and attenuation properties possible from ground motions propagating through this complex tectonic environment. However, this decision also results in large uncertainties in the overall hazard for sites in northern Australia, such as Darwin, with many of these GMMs being extended beyond their predefined conditions of use. The within-model uncertainty for the other capital cities is generally more tightly constrained, with those located within higher-seismicity area sources typically having relatively lower spread in the hazard fractiles. This has also been observed in other low-seismicity regions (Adams and Halchuk, 2019). The hazard for localities in regions of lower seismic activity tends to be affected more by a larger number of distant seismic sources (with diverging ground-motion predictions), thus yielding larger uncertainty in hazard.
Intersource-model uncertainty
As previously mentioned, the ground-motion hazard forecasts at a given site can be very sensitive to the placement of area-source model boundaries (Leonard et al., 2014). Using a preliminary NSHA18 earthquake catalog to define earthquake occurrence rates, Leonard (2017) explored the variability among the mean hazard for a range of ground-motion exceedance probabilities for each of the available source models considered for the NSHA18. Leonard (2017) concluded that the candidate NSHA18 SSMs successfully sampled the epistemic uncertainty relating to the spatial distribution of Australia’s seismicity. It was also observed that the hazard curves of the background area-source models tended to cluster together for most sites, suggesting that the NSHA18 background source-model logic tree could be simplified to fewer representative source models. This observation indicates that most localities for which the hazard was calculated are positioned within large area sources characterized by uniform seismicity rates with little variability between the zones.
Rather than compare mean seismic hazard at different exceedance probabilities as undertaken by Leonard (2017), the 0th to 100th hazard fractiles for eight representative SSMs are calculated and plotted as CDFs for a 10% chance of exceedance in 50 years. Figure 8 shows the spread of epistemic uncertainty both within and between the candidate SSMs for the Australian capital cities. In general, regional models tend to have slightly larger variability (flatter slopes), with those having smaller zones (e.g. Dimas et al., 2016; Dimas and Venkatesan, 2016), demonstrating larger uncertainties due to a greater number of potential sources and fewer earthquakes to constrain the activity rates for each source zone. Consequently, for these SSMs, there is greater uncertainty in the Gutenberg–Richter a value for some source zones, which manifests in a wider spread in the MFDs and subsequent hazard fractiles.
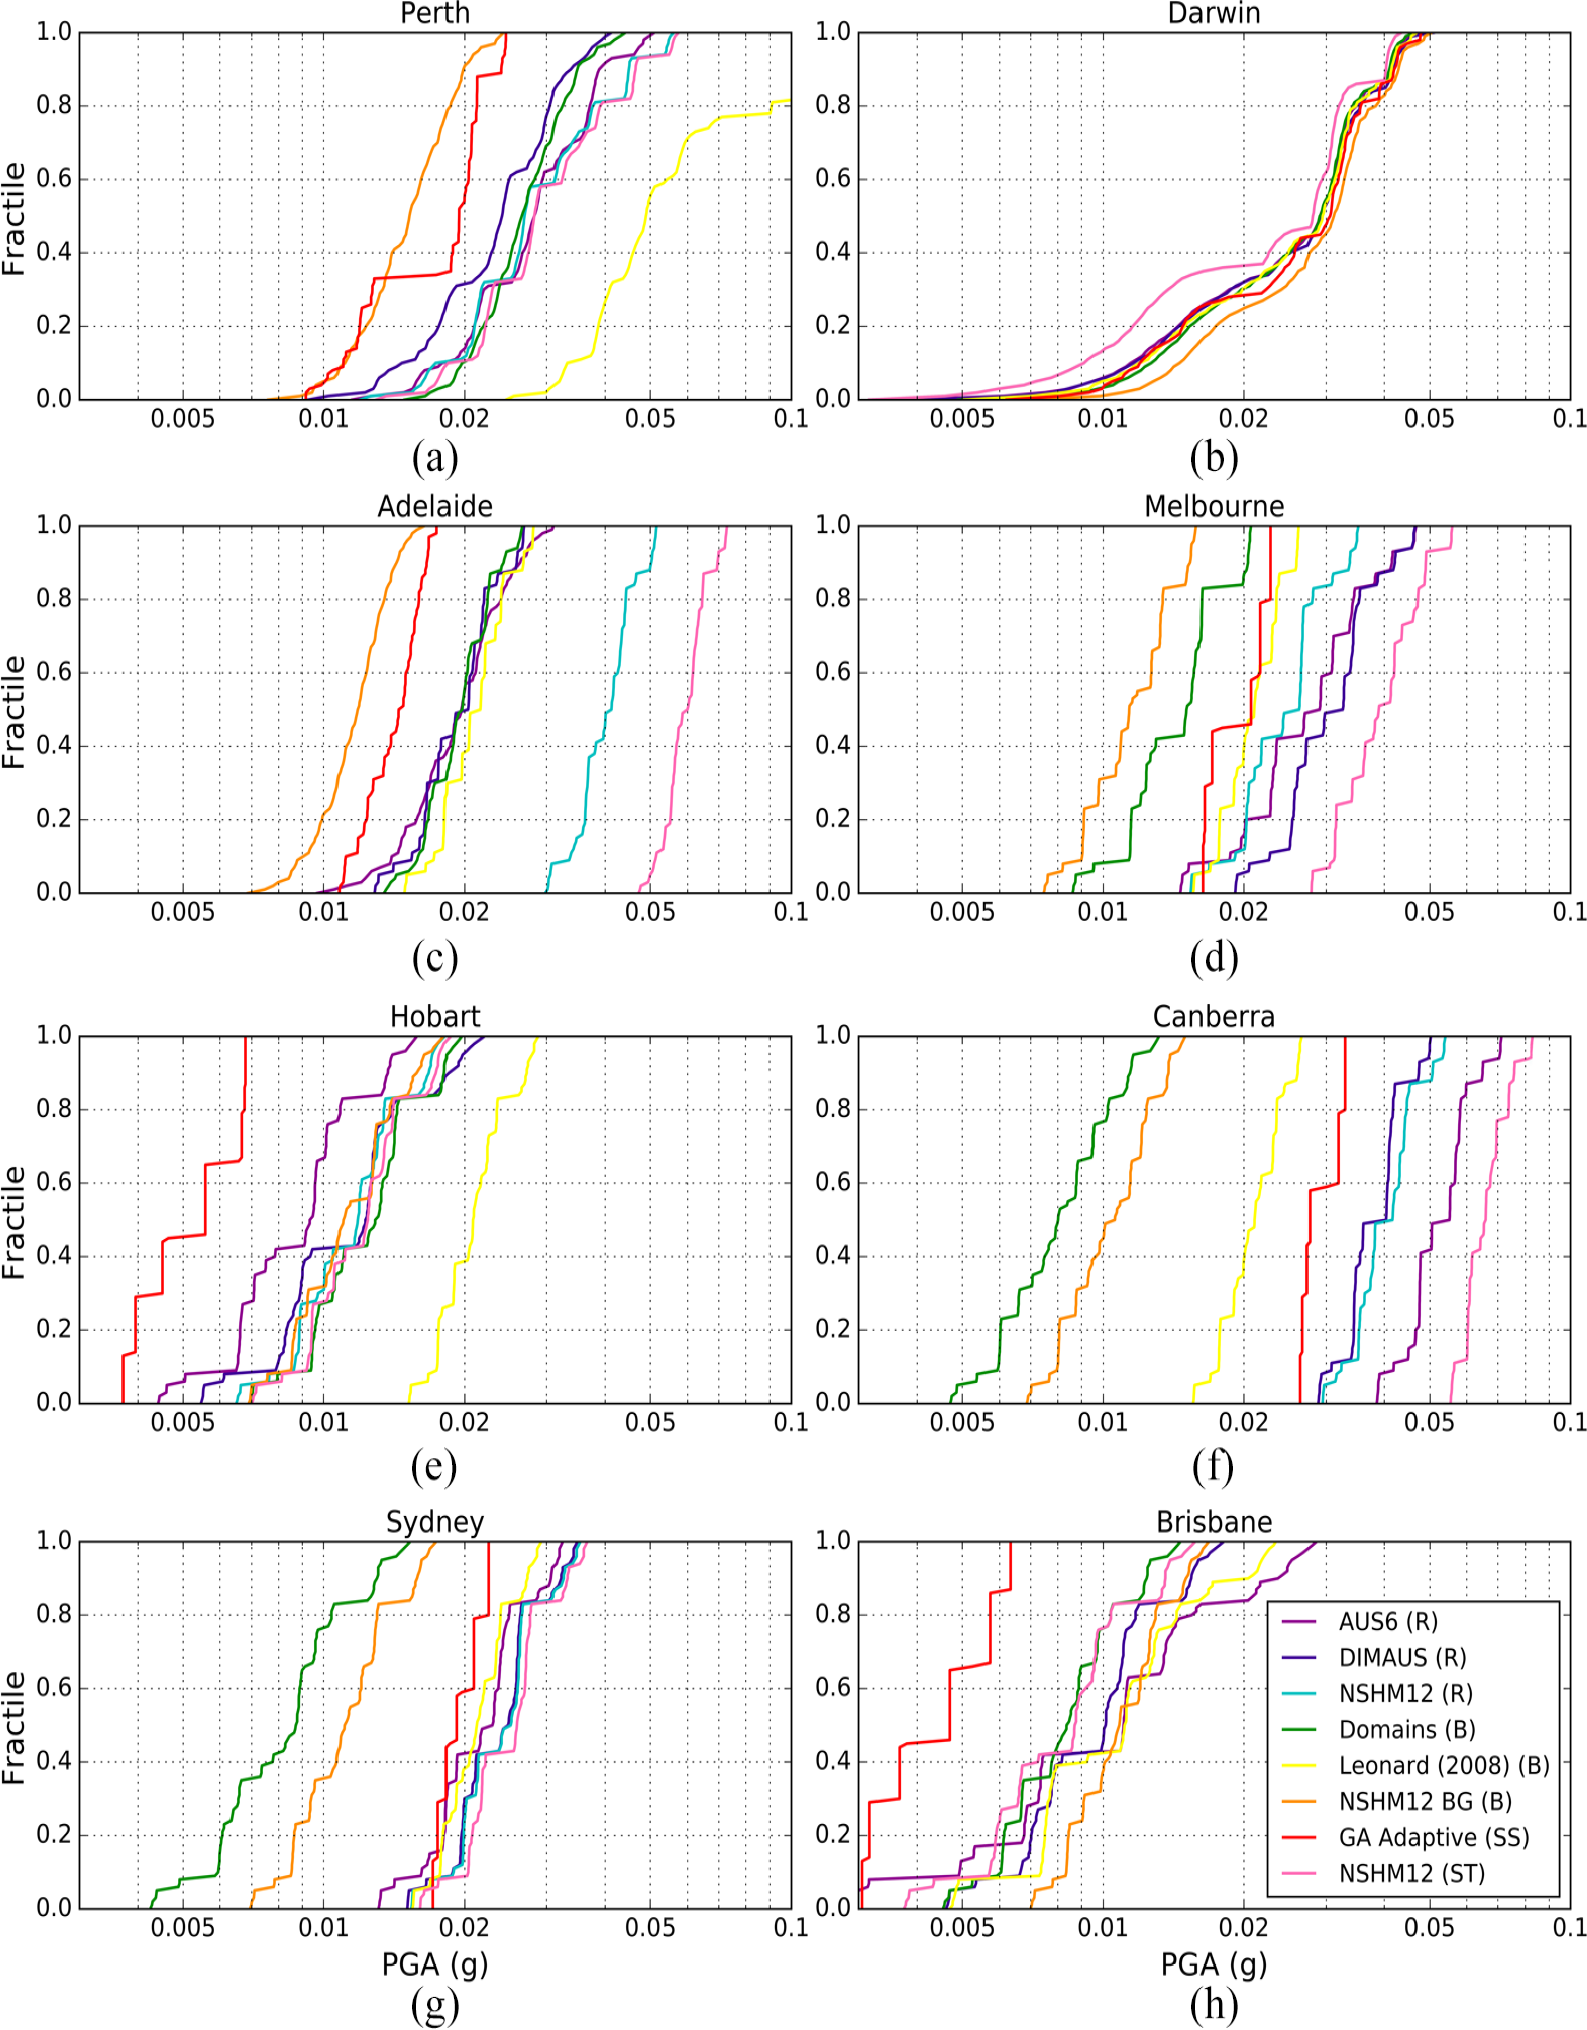
Cumulative density functions between representative regional (R), background (B), smoothed seismicity (SS), and seismotectonic (ST) seismic-source models used in the NSHA18. The CDFs indicate the PGA ground motion for a 10% exceedance probability in 50 years for Australian capital cities and show the variation in uncertainties both within and between the candidate seismic-source models. Note that not all of the models represented above receive equal weighing in the final source-model logic tree (see Table 1). AUS6 (R): Dimas et al. (2016); DIMAUS (R): Dimas and Venkatesan (2016); NSHM12 (R): Leonard et al. (2012); Domains (B): Clark et al. (2012); Leonard (2008) (B): Leonard (2008); NSHM12 BG (B): Leonard et al. (2012); GA Adaptive (SS): Griffin et al. (2016); NSHM12 (ST): Leonard et al. (2012)
There is comparatively little epistemic uncertainty between the seismic models for Darwin (Figure 8b) suggesting the hazard is driven by the plate margin SSM (Griffin and Davies, 2018) and the variability among the GMM suite for these sources. These plate margin sources, GMMs, and their consequent uncertainties are common between all source models. For each of the capitals, with the exception of Darwin, there are some source models that appear to be outliers, but nevertheless are still deemed scientifically valid (e.g. Leonard, 2017). The Leonard (2008) source model for the city of Perth (Figure 8a) is a prime example of a source-model outlier. In contrast to all other source models for the city, the source zone that characterizes the seismically active SWSZ (Doyle, 1971) for the Leonard (2008) model also envelopes the city of Perth, overstepping the major geologic boundary of the Darling Fault that separates the Yilgarn craton from the Perth Basin (see Figure 1; Veevers and Cotterill, 1978). For all other area-source models, Perth falls outside of this seismically active zone. Consequently, the high-seismicity rates for the SWSZ in the Leonard (2008) source model translate to higher than average seismic hazard for the locality of Perth.
For the eastern capital cities (e.g. Canberra, Melbourne, and Sydney), the background and regional source model CDFs tend to cluster in their respective model classes, with the regional models typically forecasting larger ground motions than the background models at the 10% probability of exceedance in 50-year level. The between-model variability for Canberra (Figure 8f), in particular, shows significant disparities between the background and regional source models. Thus, the use of large background SSMs to characterize the chance of random earthquakes occurring anywhere within a broad, tectonically analogous region may lead to lower seismic hazard values where seismicity has been relatively stationary in the historical era.
Smoothed seismicity models generally assume that the historical seismic record will be representative of the future seismic hazard (Moschetti, 2015). Unlike area-source zone models that distribute earthquake occurrence evenly across a zone, smoothed seismicity models (depending on the smoothing kernel size) will focus seismic hazard near historical earthquake epicenters. The city of Adelaide (Figure 8c) has historically been characterized as one of the Australia’s cities with the highest seismic hazard, given its proximity to the high-seismicity Flinders Ranges region (Figure 1). However, the Geoscience Australia adaptive kernel model (Griffin et al., 2017) focuses the seismic hazard further north in the central Flinders Ranges. Consequently, the use of smoothed seismicity models in the NSHA18 effectively draws seismicity and the hazard away from the Adelaide urban region. In contrast, the introduction of seismotectonic models that consider local fault sources within the Flinders Ranges acts to increase the hazard, even at relatively short ground-motion return periods of significance to ordinary-use structures (Figure 8c).
Total NSHA18 uncertainty
This section compares the total NSHA18 uncertainty and considers the weighted contributions of all sources of epistemic uncertainty, from the GMM logic tree to the variability among SSMs and their parameterization. Figure 9 shows the PGA ground-motion distributions for the full NSHA18 with a 10% exceedance probability in 50 years for Australian capital cities. The CDFs shown sample the complete source and ground-motion logic trees using the appropriate weight of each model (Griffin et al., 2018). Most of these CDFs generally show a log-normal shape, with the mean value relatively close to the median (or 50th percentile). Of these sub-plots, the CDF for Canberra (Figure 9f), in particular, indicates a distinctly different shape with a wide distribution of ground-motions, typified by a long tail at lower-hazard fractiles. Based on the NSHA18, the city of Canberra is estimated to have one of the higher levels of seismic hazard in Australia due to moderate rates of nearby historical seismicity and its proximity to two of the most active neotectonic faults in the national fault-source model (Allen et al., 2018b; Clark et al., 2016). The large tail at low fractiles is likely due to the use of background SSMs within the NSHA18, which do not consider the fault-source model. Of the candidate source models within the NSHA18, five were categorized in the background model class and these contributed a combined weight of 0.201 to the NSHA18 (Table 1). Background source models typically envelope broad regions and distribute earthquake rates, determined from the historical seismicity, uniformly across the zones. In regions with locally high rates of earthquakes, the use of background SSMs will tend to reduce earthquake occurrence rates relative to regional and smoothed seismicity models (see Figure 3). Subsequently, this leads to a reduction of seismic hazard near Canberra due to a redistribution of seismic moment across large distributed area sources. Relatively high localized hazard contributed through the regional source zones, smoothed seismicity, and seismotectonic source models (with a combined weight of 0.799) contributes to the Canberra’s hazard at higher fractiles.
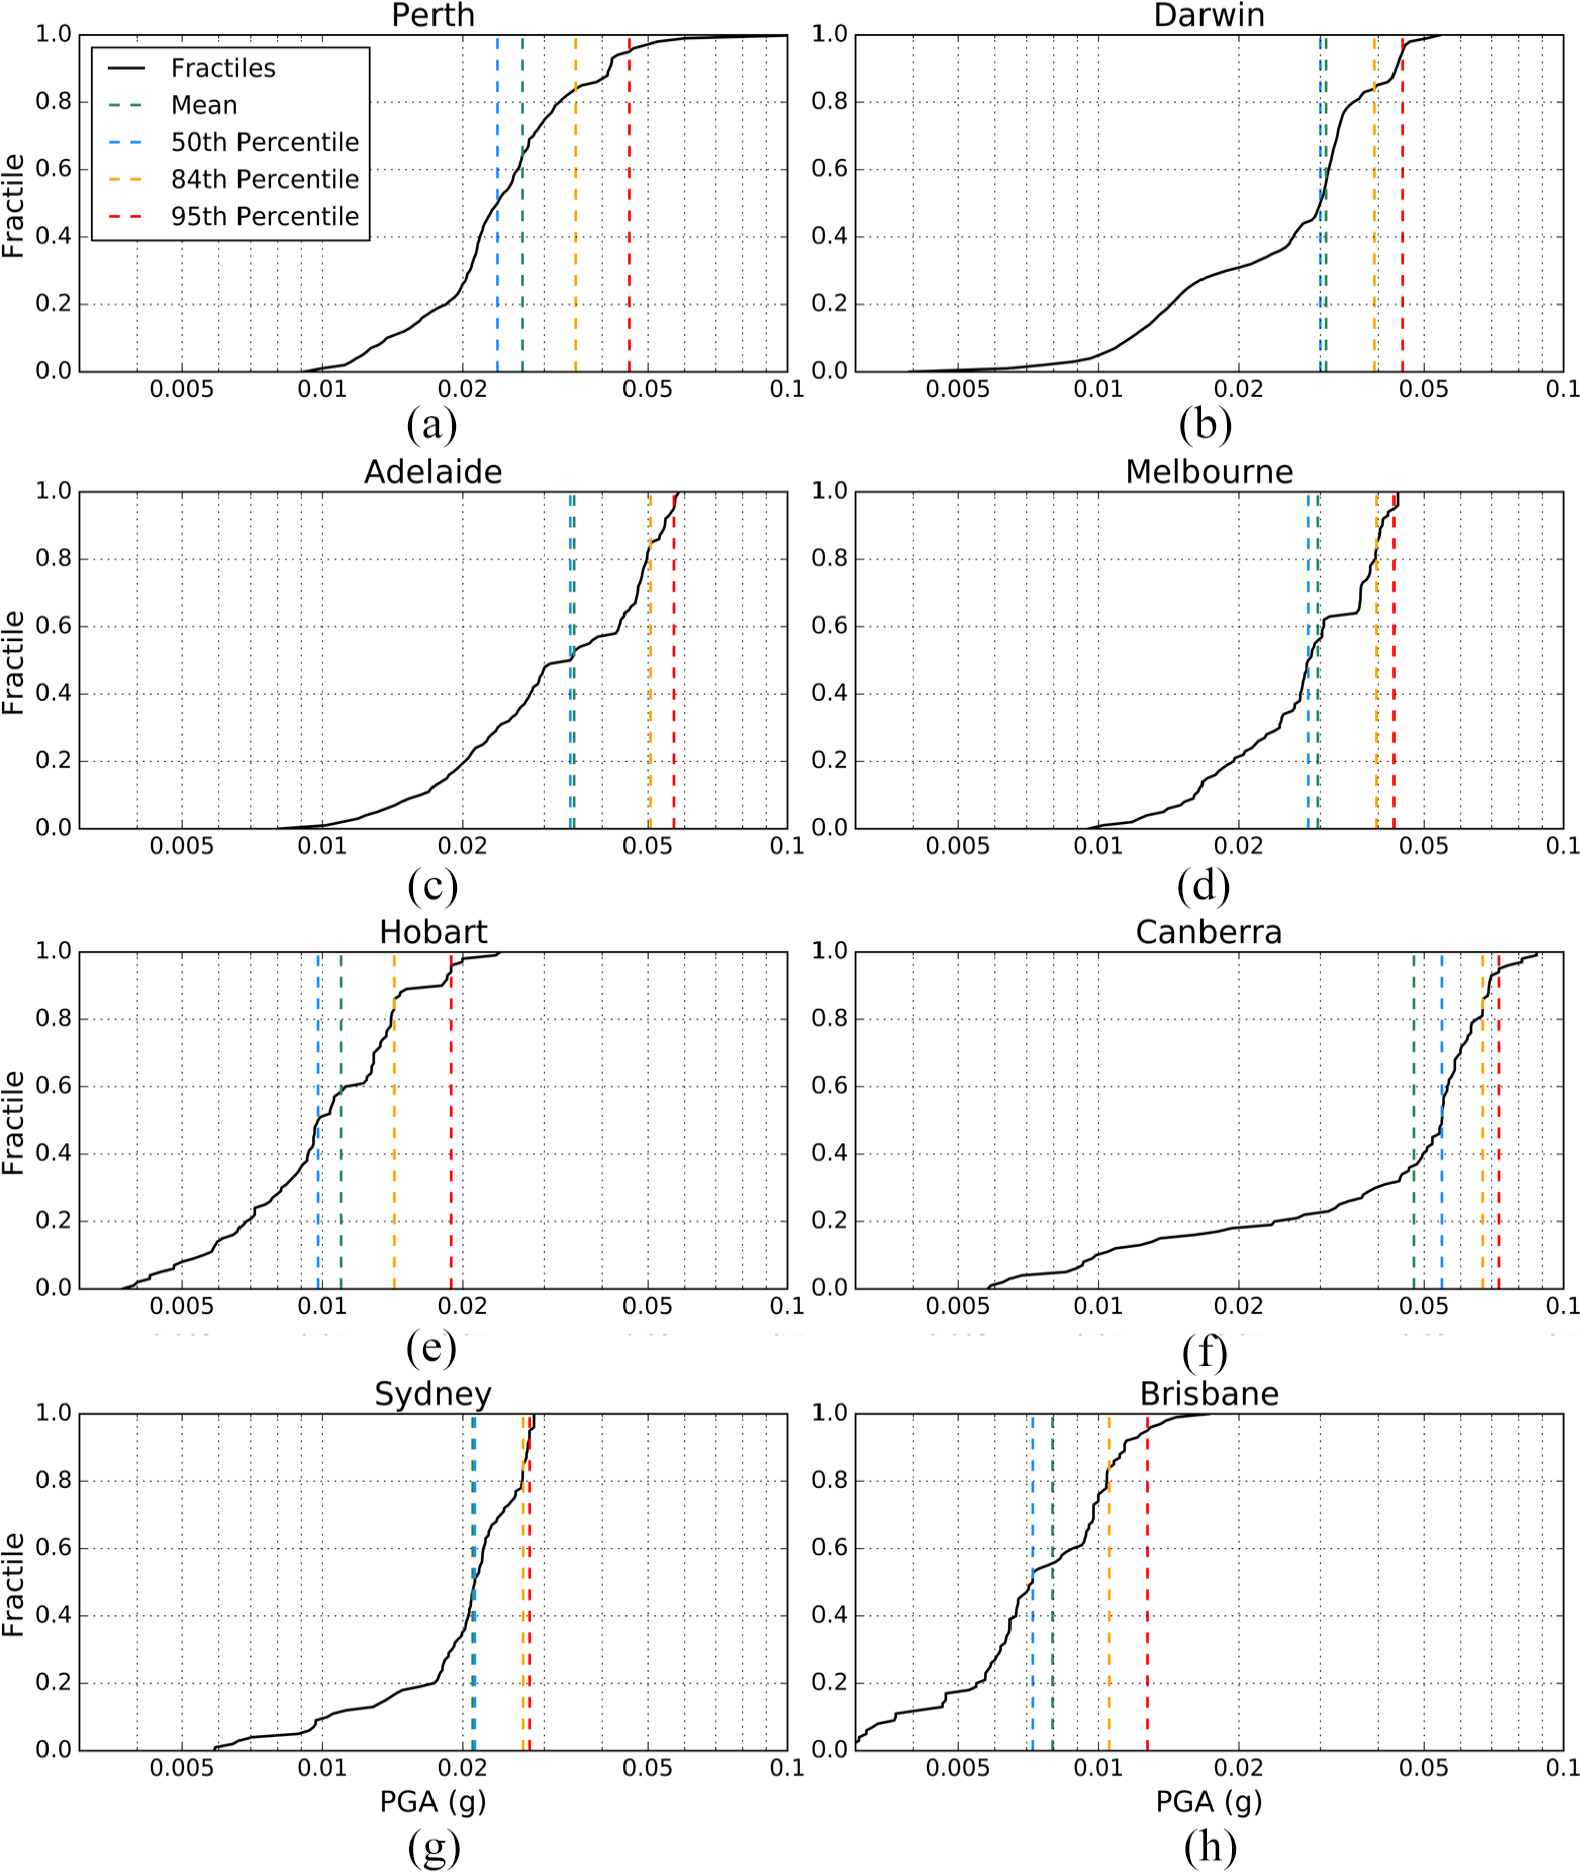
Fractile curves show cumulative density functions (black curves) that indicate the total PGA ground-motion distributions from the sampled NSHA18 source and ground-motion logic trees for Australian capital cities; Hazard fractiles are calculated assuming a 10% exceedance probability in 50 years; The acceleration value corresponding to the mean hazard, together with the 50th, 84th and 95th hazard fractiles are indicated.
Challenges for source-model weighting
One challenge in forecasting seismic hazard for SCRs is the long recurrence times for large earthquakes. As discussed above, it may be a poor choice to use broad background SSMs where the seismicity has been relatively stationary over the recording history. However, in western and central Australia, there is mounting evidence to suggest that seismicity in parts of Australia is non-stationary over time and could vary over timescales ranging from decades to 100,000s of years (Clark and Allen, 2018; Clark et al., 2012). This poses challenges to practitioners for calculating seismic hazard at national scales, where the relative weight placed on a specific model type (e.g. smoothed seismicity, regional or background) might vary spatially, and also on the return period of interest. The 2013 European Seismic Hazard Model (ESHM13; Woessner et al., 2015) attempted to address these issues and varied the source-model logic-tree weights with probability of exceedance. This allows for the production of hazard maps at different exceedance levels using a variable source-model weighting scheme. However, this poses challenges in developing hazard curves that transition smoothly across varying ground-motion levels. The ESHM13 accommodated these challenges by leaving source-model weights constant for the generation of the hazard curves. The consequence of this approach is that hazard forecasts at any given site from a hazard map for a defined exceedance probability will be inconsistent with the forecasts estimated from hazard curves at some probability levels and this may create confusion among end users.
The NSHA18 process attempted to accept and implement the outcomes of the expert elicitation workshops (Griffin et al., 2018) as closely as practically possible. Given the preceding commentary, Geoscience Australia can reflect on the choices made through the expert elicitation process and the consequences of those choices on the production of the final seismic hazard model, such as the relative weights of different source-model classes or GMMs (e.g. Griffin et al., 2020). These impacts may not have been fully appreciated prior to embarking in the development of the NSHA18. It is thus recommended that for future national-scale hazard assessments, the experts be re-engaged to allow for 360° feedback and to review the consequences of choices made during the expert elicitation process. The primary limitation to this approach, however, is that the experts may prejudice their responses to achieve specific outcomes. This contrasts with the SSHAC process where the final model weights are often informed through ongoing feedback on the consequences of modeling decisions (e.g. Hanks et al., 2009; U.S. Nuclear Regulatory Commission, 2018). Therefore, the benefits of expert reengagement need to be balanced between the potential for undermining the original intent for the expert elicitation process and the potential that experts’ choices may have been misinformed due to a lack of information at the time of elicitation.
Considerations for future building provisions
In light of the new hazard model and the reduction in hazard values relative to current design levels, it is timely to review whether the ground-motion probability level prescribed by the National Construction Code (NCC) of Australia (Australian Building Codes Board, 2016) for use in the AS 1170.4 is appropriate for the design of ordinary-use structures in Australia. The selection of the 10% exceedance probability in 50 years for the first United States National Seismic Hazard Maps was originally a rather arbitrary decision (e.g. Bommer, 2006) and appeared to be a “reasonable” choice to ensure structures “remain operable” following large earthquakes (Algermissen and Perkins, 1976). This probability level was generally viewed to be appropriate for the average recurrence of large damaging earthquakes in well-studied ATRs such as California and designing to these levels was considered to provide enough resilience to minimize structural collapse. Given that this was best practice for the time, this exceedance probability was also adopted by the NCC for use in the first edition of the AS 1170.4–1993 (Standards Australia, 1993).
However, in the late 1990s, concerns were raised by engineers and seismologists in the United States that the anchoring of design hazard values to 10% exceedance probability in 50 years would result in significant disparities in the seismic performance of ordinary-use structures across the country, with regions of low-to-moderate levels of seismicity being considerably more at risk of extreme ground-motion events (e.g. Federal Emergency Management Agency, 2004; Nordenson and Bell, 2000; Wilson et al., 2008). These concerns led to the adoption of seismic design ground-motion demands for a 2% probability of exceedance in 50 years (a 1/2475 AEP) for the International Building Code developed in the United States. This change in the probability of exceedance level was adopted in the National Building Code of Canada (NBCC) shortly thereafter (Heidebrecht, 2003). The 1/2475 AEP level was thought to more closely relate to the probability of structural collapse for ordinary-use structures (Bommer and Pinho, 2006). The adoption of this ground-motion exceedance probability leads to several advantages:
In low-to-moderate seismicity regions, there is a larger difference between 1/475 and 1/2475 AEP ground-motions than in more tectonically active regions (e.g. Allen and Luco, 2018). Transitioning to lower exceedance probabilities in the national design provisions reduces the risk in low-to-moderate seismicity regions due to rare extreme ground motions (Leyendecker et al., 2000);
The rate of attenuation of earthquake ground-shaking is generally lower in SCRs like Australia (e.g. Bakun and McGarr, 2002; Frankel et al., 1990). Thus, these provisions protect against rare events that have the potential to affect larger areas than in tectonically active regions;
Structures in low-to-moderate seismicity regions would be designed with more comparable seismic resistance (combined strength and ductility) to structures in high-seismicity regions;
In many cases, effective seismic resistance for new construction can be achieved at minimal incremental cost (Nordenson and Bell, 2000).
Australia has much in common in terms of the vintage of urban development and tectonic setting with eastern North America (Bairoch and Goertz, 1986). Given that both Canada and the United States have recognized that 10% probability of exceedance in 50 years may not provide seismic protection to ground motions from rare events in their low-seismicity settings, it would seem sensible that Australia too should review appropriateness of the probability levels currently required for ordinary-use structures by the NCC. This is underscored by the significant reductions in its seismic hazard forecasts at the 1/500 AEP through the NSHA18 (Allen et al., 2018b). In line with the AS 1170.4–2007 (2018) amendment (Standards Australia, 2018), any changes to design probability levels could also specify minimum base shear design values for the remaining low-hazard jurisdictions (e.g. Humar, 2015) to ensure life safety in the event of rare extreme-ground-motion events. It should be noted that neither Canada nor the United States uses the 2% in 50-year hazard values directly calculated from their national-scale probabilistic hazard assessments for defining the seismic loading for building design, and use methods such as deterministic capping of ground motions for near-fault sites, or 2/3 of the risk-targeted maximum credible earthquake ground motions for assigning design levels (i.e. Leyendecker et al., 2000; Luco et al., 2007; Malhotra, 2005). Nevertheless, the application of these adjustments would still yield higher seismic loading requirements, relative to the AS 1170.4–2007 (2018) for many localities across Australia (Allen, 2019).
Conclusion
Geoscience Australia, together with contributors from the wider Australian seismology community, has produced the NSHA18 (Allen et al., 2018b). One of the major advances in the NSHA18 relative to its predecessors is its use of a large range of SSMs to explicitly consider the epistemic uncertainties associated with seismic-source modeling at a national scale. Through the call to third-party contributors, in addition to models developed by Geoscience Australia, 19 seismic-source characterizations for the Australian continent and adjacent offshore regions were defined. Multiple source-model types were used (e.g. background, regional, smoothed seismicity; Table 1), with each model type contributing unique earthquake rates for any given locality. All source models contributed to the NSHA18 were considered scientifically valid and were assessed through the structured expert elicitation workshop. These models were combined using a weighted logic-tree framework (Table 1; Griffin et al., 2018).
Mean PGA and spectral acceleration values Sa(T) for T = 0.05, 0.1, 0.2, 0.3, 0.5, 0.7, 1.0, 1.5, 2.0, and 4.0 s were calculated for AS 1170.4–2007 (2018) site class Be. In general, PGA values at the 1/500 AEP across Australia have decreased, on average, by 72% relative to the earthquake hazard factors provided for localities in the Australian earthquake loading code, AS 1170.4–2007 (Standards Australia, 2007). The key reasons for this decrease in seismic hazard factors are
the reduction in the rates of moderate-to-large earthquakes (approximately
increases in Gutenberg and Richter (1944) b
values, particularly in eastern Australia, owing to the ML
to
the use of modern ground-motion attenuation models that predict lower ground-motions and faster attenuation of PGA and other spectral ordinates with increasing distance.
A challenge in forecasting seismic hazard for SCRs is the long recurrence times for large earthquakes and a paucity of data (relative to ATRs) from which to calibrate hazard models. This poses challenges to practitioners for calculating seismic hazard at national scales, where the relative weight placed on a specific model type (e.g. smoothed seismicity, regional, or background) might vary spatially, and also on the return period of interest. Philosophical challenges will remain in terms of how to best model seismic hazard at different spatial scales for varying return periods of interest. In the face of these uncertainties, there are still opportunities to advance earthquake hazard science for SCRs in order to improve building provisions. These opportunities should be prioritized to provide improved evidence-based hazard assessments for our communities and to secure major infrastructure assets from the negative effects of earthquakes.
Supplemental Material
EQS900777_Supplementary_figures – Supplemental material for The 2018 national seismic hazard assessment of Australia: Quantifying hazard changes and model uncertainties
Supplemental material, EQS900777_Supplementary_figures for The 2018 national seismic hazard assessment of Australia: Quantifying hazard changes and model uncertainties by Trevor I Allen, Jonathan D Griffin, Mark Leonard, Dan J Clark and Hadi Ghasemi in Earthquake Spectra
Footnotes
Acknowledgements
We particularly thank our third-party source-model contributors (listed in Table 1) for sharing their work and donating their time through various NSHA18 (2018 National Seismic Hazard Assessment) workshops and discussions. In particular, we thank the contributors of the third-party smoothed seismicity models (Russell Cuthbertson, Valentina Koschatzky, and Paul Somerville), which required an iterative model development and implementation with the NSHA18 team after finalization of the NSAH18 earthquake catalog. The authors also thank the contribution of the NSHA18 Scientific Advisory Panel (Phil Cummins, Gary Gibson, Michael Griffith, Masyhur Irsyam, Mark Petersen, Paul Somerville, and Mark Stirling), whom provided Geoscience Australia with valuable and ongoing feedback with respect to progress toward the NSHA18. The Geoscience Australia NSHA18 team are particularly grateful to the Global Earthquake Model Foundation team, in particular, Marco Pagani, Michele Simionato, and Graeme Weatherill (now at GFZ) for their continued development, maintenance, and support of the OpenQuake-engine. The NSHA18 was produced with the assistance of resources and services from the National Computational Infrastructure (NCI), supported by the Australian Government. Rui Yang is thanked for supporting the deployment and maintenance of the OpenQuake-engine on the NCI. Lauren Power is thanked for providing 2018 statistics on the vintage of Australia’s building stock from the NEXIS and we also thank Hyeuk Ryu for his internal review of the article. The authors publish with the permission of the Chief Executive Officer of Geoscience Australia.
Declaration of conflicting interests
The author(s) declared no potential conflicts of interest with respect to the research, authorship, and/or publication of this article.
Funding
The author(s) received no financial support for the research, authorship, and/or publication of this article.
Supplemental material
Supplemental material for this article is available online.
Notes
References
Supplementary Material
Please find the following supplemental material available below.
For Open Access articles published under a Creative Commons License, all supplemental material carries the same license as the article it is associated with.
For non-Open Access articles published, all supplemental material carries a non-exclusive license, and permission requests for re-use of supplemental material or any part of supplemental material shall be sent directly to the copyright owner as specified in the copyright notice associated with the article.