
Abstract
Background:
The Ki-67 antigen, a marker of cell proliferation, serves as a biomarker for assessing tumor malignancy. However, measuring Ki-67 levels through immunohistochemistry is often challenging due to difficulties in specimen collection and individual health issues. Radiological analysis has emerged as a potential alternative for predicting Ki-67 levels, although its accuracy has been limited. This study aims to enhance the prediction of Ki-67 levels using chest X-rays by employing a refined approach that combines detailed, manually delineated radiological features with conventional imaging characteristics.
Methods:
This study collected X-ray images and Ki-67 expression data from 109 patients diagnosed with Non-Small Cell Lung Cancer (NSCLC). Seven radiological features related to tumor progression were annotated on each image by clinical professionals. Tumor areas were delineated using Python, resulting in the generation of 5 types of data from these regions. Data integration facilitated the development of predictive models utilizing Logistic Regression (LR), Support Vector Machine (SVM), Random Forest (RF), and Deep Neural Networks (DNN), with feature selection processes applied.
Results:
Using the RF, 8 predictive features were selected from the datasets, of which 7 exhibited a linear correlation with Ki-67 levels (Mantel-Haenszel test, P < .05). The model demonstrated robust performance metrics: Accuracy: 0.818, Precision: 0.823, Recall: 0.849, and F1 Score: 0.783.
Conclusions:
This research underscores the effectiveness of integrating specific radiological features, manually delineated regions of interest (ROIs), with traditional imaging characteristics and machine learning techniques. This approach significantly enhances the predictive accuracy of chest X-rays for Ki-67 levels, offering a non-invasive method for Ki-67 estimation.
Keywords
Graphical abstract

Introduction
Ki-67 is a marker of cellular proliferation activity and holds significant value in the diagnosis and prognostic assessment of tumors. 1 High Ki-67 expression is often associated with increased tumor aggressiveness and a poorer prognosis, 2 making it widely utilized in the diagnosis and prognostic evaluation of lung cancer.
In clinical practice, factors such as the specific location of a patient’s tumor and their physical condition can hinder the successful acquisition of tumor tissue for pathological examination.3 -6 Hence, scholars like Luo, Wang, et al, have investigated the use of imaging data and machine learning to predict Ki-67 levels.7,8 However, previous studies on predicting Ki-67 in NSCLC have often been limited to binary classification models. While these models can achieve relatively high area under the curve (AUC) values, they offer limited clinical significance in evaluating the biological behavior of tumors. As a result, their application in clinical diagnosis and treatment remains challenging.
To address this issue, this article reviews X-ray imaging examinations to gather information about the location, size, shape, tissue structure, and biological behavior of masses within the body.9,10 By manually processing patient imaging data and integrating it with machine learning models to predict Ki-67,11,12 clinicians can more accurately and non-invasively assess the biological characteristics of lung cancer, thereby aiding in the development of personalized treatment strategies.
Methods
Please refer to Figure 1 for a comprehensive overview of the research process. This study has received approval from the Medical Ethics Committee of the Affiliated Cancer Hospital and Institute of Guangzhou Medical University, under project number 2024-ZN030. This article adheres to the TRIPOD 2015 statement 13 [Checklist-Chinese-1].

Flowchart.
Data Collection and Organization
Dependent Variable Set
This study collected data from X-ray images and Ki-67 levels obtained through pathological immunohistochemistry for a total of 109 patients diagnosed with NSCLC at the Affiliated Tumor Hospital of Guangzhou Medical University over the past 10 years (from June 1, 2014, to June 1, 2024).
Inclusion criteria: (1) The patients have been definitively diagnosed with NSCLC through Computed Tomography-guided Needle Biopsy (CTNB) or Endobronchial Ultrasound-guided Transbronchial Needle Aspiration (EBUS-TBNA); (2) Lung mass on chest X-ray has not undergone relevant treatments prior to the X-ray examination; (3) Lesion diameter >1.5 cm; (4) Interval between the patient’s imaging examination and pathological examination is <2 weeks; (5) Comprehensive pathological information of the patient. Exclusion criteria: (1) ROI regions are blurred and difficult to delineate due to quality control issues in the digital X-ray imaging process ; (2)The grayscale display monitor cannot maintain a viewing brightness of 400 to 500 cd/m², has a resolution of fewer than 3 megapixels, or the graphics card outputs grayscale levels of less than 10 bits; (3) Tumors with significant internal necrosis, extensive hemorrhage, and absence of an appropriate target area for measurement. Please refer to Table 1 for the baseline of the patients. Unlike typical studies that categorize Ki-67 expression levels as high or low, this study divides Ki-67 expression levels into 4 grades based on the following criteria. 14 The Ki-67 level of the included patients was assessed using a ready-to-use mouse monoclonal antibody, provided in liquid form and stored in a buffer containing 1% BSA stabilizer and 0.015% sodium azide, along with an SP immunohistochemistry detection kit. For result interpretation, 2 experienced pathologists independently examined the slides. Five random fields of view were selected under a high-power microscope, and 100 cells were counted in each field. Specific criteria are as follows: Any detectable Ki-67 nuclear staining (dot or diffuse) is considered a positive reaction, with 1% to 10% of positive expressing cells classified as weakly positive (+), 10% to 50% of positive expressing cells as positive (++), and greater than or equal to 50% of positive expressing cells as strong positive (+++).
Patient’s baseline characteristics.

ADC: Adenocarcinoma
SCC: Squamous Cell Carcinoma.
Independent Variable Set
We selected 7 features that can be easily observed in X-ray images and are potentially correlated with tumor progression to some extent. In the following text, these features will be referred to as “lung features data.” features include vascular signs, pleural effusion, obstructive pneumonia, multiple lung nodules, homogeneity of lung mass density, lung mass density, and signs of infection. Among these features, vascular signs, multiple lung nodules, homogeneity of lung mass density, and signs of infection are binary in nature, indicating only the presence or absence of the feature, represented by 1 or 0, respectively. Below are the definitions or criteria for each feature.15 -17
Vascular signs: The vascular bundle sign appears on the image as 1 or several blood vessels reaching into or intersecting with the tumor or passing through the tumor’s edge.
Multiple lung nodules: Defined as the presence of 2 or more lesions within the lung.
Density variation: A lung mass with varying intensity is categorized as 1, while a mass with homogeneous density is categorized as 0.
Signs of infection: Refer to the presence of unclear shadows around the lung parenchyma, thickening of lung texture, and darkening of lung fields.
Three features will be classified as ordinal variables: pleural effusion, obstructive pneumonia, and lung density occupancy. The criteria for their classification are as follows:
Pleural effusion: Divided into 4 levels: none, slight, moderate, and heavy. This classification is based on the “Chinese Expert Consensus on the Diagnosis of Pleural Effusion” and is supplemented by the clinical experience of medical professionals.
Obstructive pneumonia: Divided into 3 levels based on clinical experience: (1) none, (2) not affecting more than half of the lung area, and (3) affecting more than half of the lung area.
Lung density occupancy uniformity: Divided into 3 levels based on clinical experience: low density, medium density, and high density. Low density is defined as being greater than lung tissue density, while high density is characterized as being less than bone tissue density, with medium density falling in between these 2 extremes.
Feature Values: These 3 features are assigned integer values starting from 0, based on their levels in sequential order.
To enhance the predictive capabilities of the model, a computer programing language was employed in this study to develop a program for outlining the ROI in an interactive human-computer interface. 18 Through computation, 5 shape features related to lung occupancy were extracted. The significance and extraction methods of these features are detailed below.
An interactive image drawing program was implemented, enabling clinicians to manually outline the ROI on locally stored images using a mouse. Users can click and drag the mouse on the image to delineate the desired area, with the program displaying the outlined region in real-time. This approach not only provides the most intuitive response from clinicians regarding lesion and affected area recognition but also offers precise boundary information for subsequent data analysis and processing. As illustrated in Figure 2, the high-density white lines represent the manually drawn ROI. Upon completion of the outlining process, mathematical calculations are employed to analyze the data presented in Table 2 (ROI information from Figure 2, results rounded to 2 decimal places).
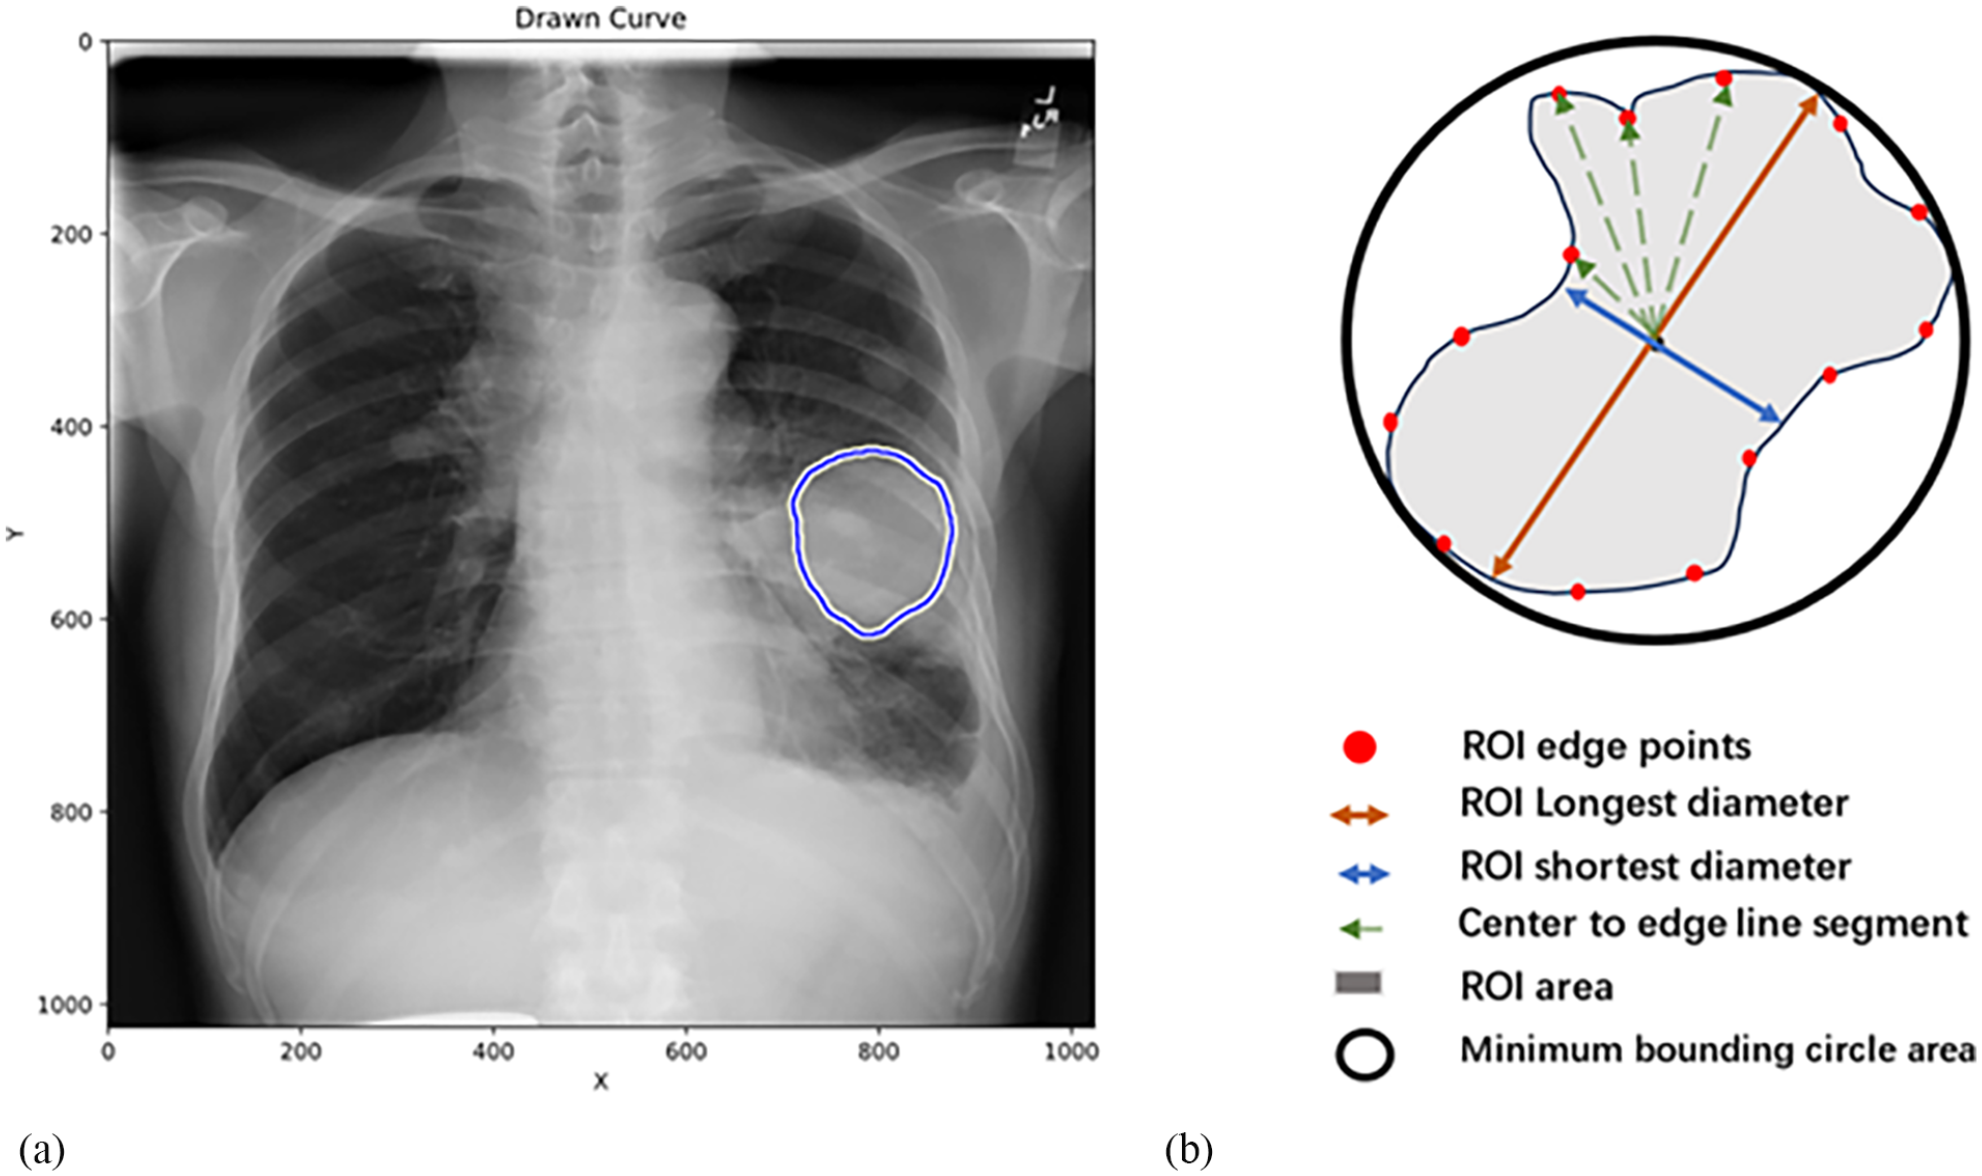
(a) Drawing ROI on an X-ray film. (b) Schematic diagram of each feature in ROI data.
ROI data.

The area delineated by the clinical physician for the lung mass region in the X-ray imaging direction (AP or PA view). All variables refer to Figure 2b.
The pixel in Figure 2a corresponds to 0.143 cm in the real world.
Refers to the area of the smallest circle that can exactly surround the ROI.
By mathematical calculation, the geometric center of the ROI is obtained, and a line passing through this geometric center with 2 intersections with the ROI edge is calculated to find the ratio of the longest to the shortest line segment.
Starting from the geometric center of the ROI and emitting line segments toward the shape edge (composed of several dense points), a set of line segment lengths is obtained, and the standard deviation of this set is calculated.
Starting from the geometric center of the ROI and emitting line segments toward the shape edge (composed of several dense points), a set of line segment lengths is obtained, and the variance of this set is calculated.
Due to the fact that the ratio of the minimum bounding circle area of ROI to the ROI area is derived from both measures, and since the aim of this study is to explore the relationship between the 2, we have chosen to exclude the minimum bounding circle area of the ROI to mitigate issues related to multicollinearity. The remaining 5 features will be referred to as “ROI data.”
In summary, a total of 12 features have been identified, which can be categorized into 2 groups. One group consists of 7 features obtained from clinical image analysis, while the other group includes 5 features derived from manually delineated ROI calculations. Since these 5 features are continuous variables, we will categorize them into ordinal variables ranging from levels 1 to 4 based on their quartiles in ascending order, thereby converting them into ordered variables.
Modeling and Analysis
To explore models that are more suitable for the dataset at hand, this study employed LR, SVM, RF, and DNN for model construction.19,20 The random state for the train/test split during model training is set to 6, with the test set ratio established at 30%.
The remaining data were utilized for fivefold cross-validation, with the mean performance metric derived from this process serving to evaluate the comparative effectiveness of different models. Throughout the study, the test set remained entirely isolated from all data preprocessing and cross-validation procedures to ensure unbiased evaluation.
We selected 4 metrics—Accuracy, Precision, Recall, and F1-score—to comprehensively evaluate the models’ performance, and we presented the results using a confusion matrix, all formatted to 3 decimal places for accuracy.
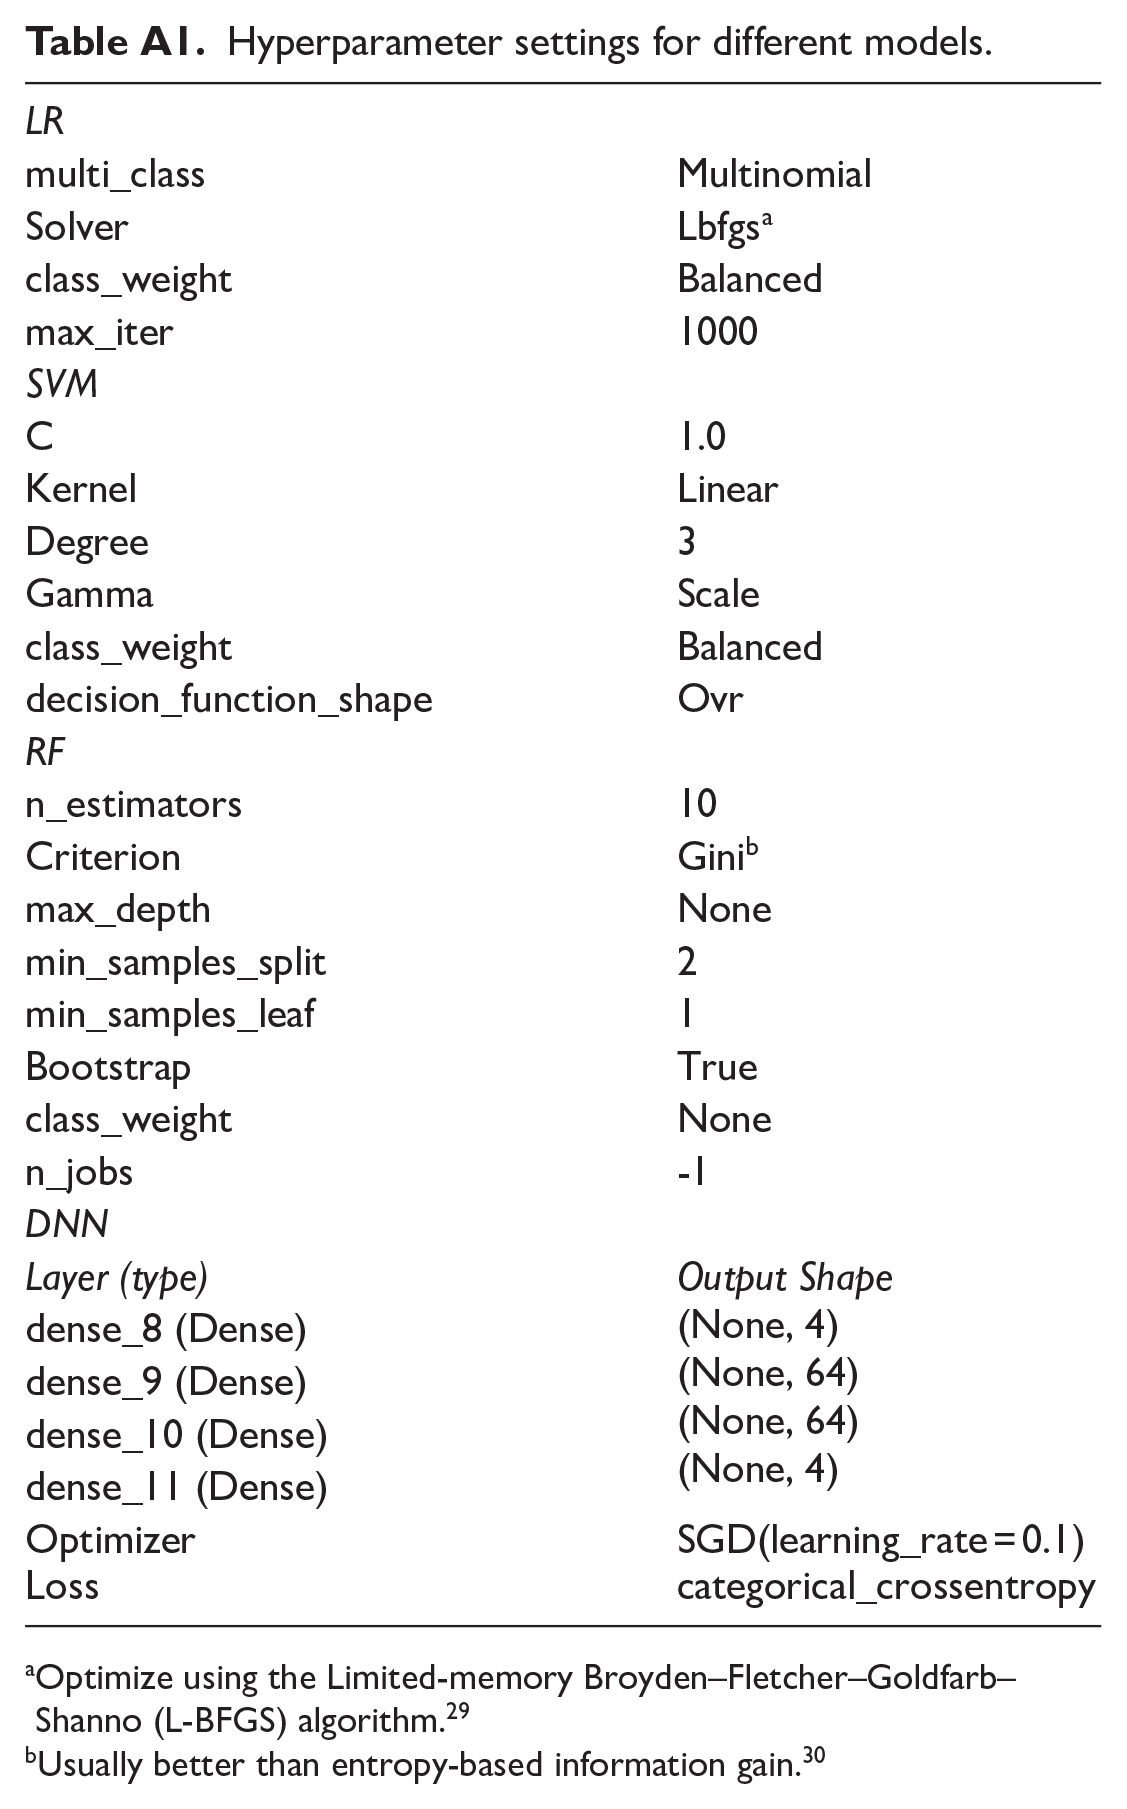
This study utilized 4 distinct machine learning and neural network algorithms, combined with 3 feature categories—specifically, “Lung Features Data,” “ROI Data” and their combined form “Lung Features + ROI Data” in a total of 12 unique computational models for comparative analysis. The hyperparameter settings for the various models are detailed in Appendix A, Table A1.
In Table 3, the performance of each machine learning method is compared using 3 different categories of features. It is evident that, across all machine learning/neural network approaches, the combination of “lung features data + ROI data” yields superior predictive performance compared to using either of the 2 individual feature categories alone. When the combined features “lung features data + ROI data” are employed, the Random Forest model outperforms the other 3 models, as shown in Table 4.
Model performance comparison.

Performance comparison of different models.

All model development and statistical analyses were conducted using Python (version 3.9). The Mann-Whitney U test was employed to compare continuous variables with non-normal distributions, while the independent samples t-test was utilized for continuous variables with normal distributions. The chi-squared test was applied to categorical variables. Performance comparisons among different models were performed using fivefold cross-validation. A P-value < .05 was considered indicative of a significant difference between the datasets being compared.
Model Optimization
This study includes 12 features. After comparing the performance of various models, the Random Forest algorithm was ultimately selected to construct the predictive model using the combined feature set of “Lung features + ROI data.”
Given that some imaging features may exhibit significant multicollinearity, we plotted a collinearity heatmap (Figure 3). The heatmap revealed that certain features are highly correlated, such as “standard deviation” with “diameter ratio” and “area ratio” where the correlation coefficient is greater than or equal to .9. To select features that contribute more significantly to model interpretation and to reduce prediction errors caused by multicollinear features, we plotted a feature importance score chart (Figure 4). Keeping the lung features unchanged, we systematically removed different ROI features in increasing order of feature importance. After conducting tests and comparing the results, we retained the top 4 key ROI features. Subsequently, by fixing the ROI features, we removed lung features with lower importance in the same order. Since the number of features is small, we applied an exhaustive search to select features, halting the elimination process when the model’s F1-score decreased. The features retained were those identified before the drop in the F1-score.

Correlation heatmap: (a) RF model based on 12 features, (b)RF model based on 8 features after feature selection.
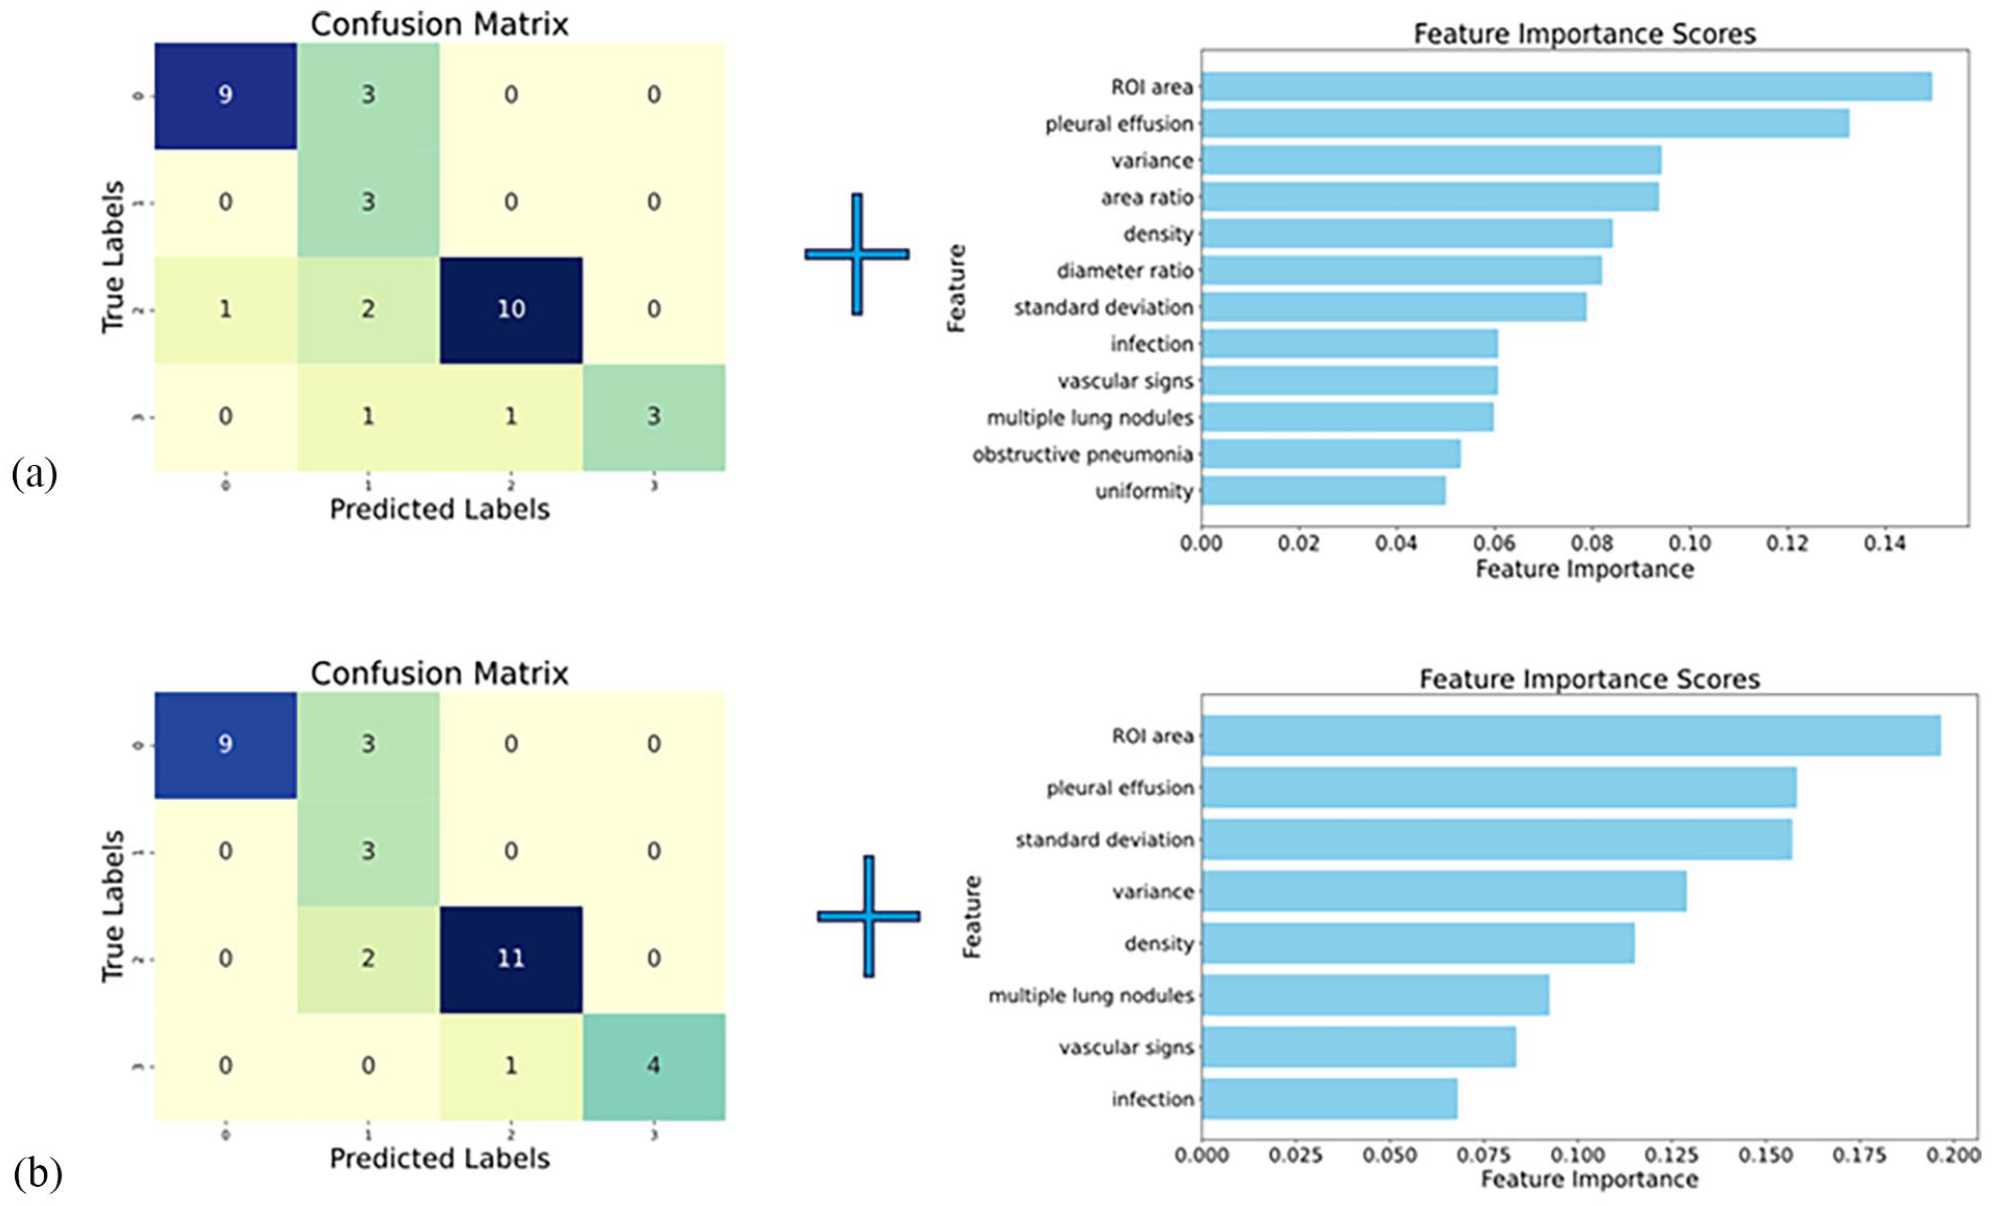
Confusion matrix and feature importance ranking graphs (axes labeled 0-3 representing Ki-67 levels :- ~+++): (a) RF model based on 12 features, (b) RF model based on 8 features after feature selection.
Here, the mean F1-score obtained through cross-validation on the training set was utilized to evaluate changes in model performance. Although there was no significant difference in the F1-score before and after excluding certain features, we decided to retain or remove features based on the observed trends in the mean values. The model’s performance was validated using an independent test set.
Ultimately, 8 features that significantly contributed to the prediction results were retained. Finally, we will compare the performance of the optimized model with that of the original model, as shown in Table 5 and Figure 4.
Performance comparison between new and original RF models.

Feature Contribution Analysis
After training the data using a random forest model, we employed SHapley Additive exPlanations plots (SHAP) to understand which features contribute most to the model’s interpretability for different levels of Ki-67 expression, as illustrated in Figure 5. We observed that in the SHAP plots for predicting all levels of Ki-67, the top 3 features, based on SHAP values, include imaging features extracted from the ROI, constituting 7/12 (58.3%) of them. Specifically, the ROI area was identified as the most significant feature contributing to model interpretability when Ki-67 expression levels were classified as negative (−), positive (+), or strongly positive (+++).

(a-d) correspond to the SHAP plots of various features when Ki-67 expression levels are −, +, ++, and +++.
Results
Through the comparison of models and feature selection, this study ultimately identified 8 features from 2 types of data to predict Ki-67 levels. The results of the Mantel-Haenszel chi-square test indicated that Ki-67 levels were linearly related to the X-ray lung mass area (χ² = 37.856, P < .001), the standard deviation of the distance between the mass boundary and the center (χ² = 12.279, P < .001), the variance of the distance between the mass boundary and the center (χ² = 39.081, P < .001), lung mass density (χ² = 17.071, P < .001), the presence of multiple lung nodules (χ² = 14.746, P < .001), vascular signs (χ² = 8.269, P = .004), and pleural effusion (χ² = 8.100, P = .004), all of which demonstrated a linear relationship. Conversely, no linear relationship was observed between Ki-67 levels and signs of infection (χ² = 0.683, P = .409). The statistical results are presented in descending order of importance. 21 Following the analysis using SHAP plots, the results suggest that manually delineated ROIs compensate for limitations in conventional imaging features, as they play a significant role in elucidating the decision-making process of the model. The integration of these 2 types of features substantially enhances the model’s capability for structured classification prediction.
By comparing the performance of 4 models (Accuracy, Precision, Recall, F1-score) under fused features, the results are as follows: LR:(0.606, 0.546, 0.588, 0.541); SVM:(0.606, 0.571, 0.586, 0.555); DNN:(0.576, 0.469, 0.478, 0.424); RF:( 0.758, 0.786, 0.780, 0.725). RF was selected for the final model construction. Subsequently, we removed features from the “lung features data + ROI data” that interfered with the model’s predictions. Using cross-validation, the original RF model retaining all features in the “lung features data + ROI data” achieved an F1-score of 0.709 (95% CI: 0.496-0.873), while the feature-selected RF model achieved an F1-score of 0.783 (95% CI: 0.628-0.918). The difference in F1-scores between the 2 models was statistically significant (t = −2.357, P = .046 < .05). The performance of the optimal RF model was as follows: Accuracy: 0.818, Precision: 0.823, Recall: 0.849, F1-score: 0.783. The F1-score on the test set was 0.793.
Discussion
This study innovatively applies a method similar to “target area delineation” to feature extraction. The method of manually delineating lung mass ROIs offers higher objectivity and precision compared to the traditional method of measuring length and width distances, partially compensating for information loss in manual image reading. Based on the SHAP plots, we observed that among the 8 selected features, those derived from manually delineated ROIs constitute nearly half of all features and rank highly in terms of SHAP value. This indicates that these data significantly contribute to the model’s interpretability.22,23
Regarding the 2 categories of selected features, pleural effusion—a traditional clinical pulmonary characteristic—serves as a significant predictor of the Ki-67 level. This aspect has been thoroughly examined in the Chinese expert consensus on treatment of malignant pleural effusio. 24 In this consensus, Yao et al consistently assert that pleural involvement is a crucial factor in predicting the Ki-67 level.25,26 Concerning Region of Interest (ROI) features, previous studies by Sun, Fu, et al utilizing radiomics on CT scans have revealed a relationship between morphological features and the Ki-67 level. However, because nomograms were employed, all imaging features were aggregated into a single numerical value (threshold), which limited the exploration of the specific relationships between individual morphological features and the Ki-67 level. In the present study, X-ray imaging features were utilized, with 3 features incorporated into the final predictive model, which ranked highly in terms of importance: “ROI area” standard deviation and the “ROI area” feature, it is evident that tumors with faster proliferation rates are more likely to progress locally in a short period, rather than growing slowly. This observation aligns with the principle that higher tumor malignancy correlates with increased peripheral invasion. The remaining 2 features highlight the irregularity of lung tumor shapes. This measurement approach takes into account several factors that influence tumor proliferation, including local biological heterogeneity, the uneven distribution of surrounding bronchi and blood vessels, which leads to variations in oxygen and nutrient supply, and differences in immune microenvironments caused by the irregular distribution of lymph nodes and immune cells. These and other potential factors ultimately result in varying proliferation rates across different regions of a uniform tumor, manifesting as morphological diversity. The rapid proliferation of specific tumor regions leads to overall irregularity in tumor shape, making “standard deviation” and “variance” essential features for predicting Ki-67 level. This finding provides strong evidence for the need to further standardize and universally define these features, as well as to explore additional radiomic characteristics in future research.
Although traditional length and width measurements are straightforward and practical, they often suffer from operator subjectivity, which challenges the reliability and consistency of the results. In terms of performance across various models, the manual delineation of lung mass ROI delineation has improved the ability to predict Ki-67 levels based on imaging features. Both precision and recall rates have achieved relatively high levels, significantly reducing the risks associated with diagnostic errors.
In this study, we innovatively categorized Ki-67 expression levels into 4 distinct grades, moving away from the traditional binary classification approach, such as the 5% threshold proposed by Huang et al to differentiate between invasive and non-invasive lung adenocarcinomas. 27 This method allows for a more precise assessment of tumor progression in patients and facilitates comparative analysis. Typically, the outcomes of binary models can fluctuate based on the established threshold for Ki-67. It is challenging to justify placing tumors with Ki-67 levels of 1% and 20% in the same category if the threshold is set at 20%. Such predictions do not positively contribute to clinical practice. To address this issue and effectively harness the predictive potential of Ki-67 levels, this study accepts a slight decrease in model performance compared to binary models. However, due to the introduction of new predictive indicators, the comparison of multiple models, and variable screening, we do not compromise the overall performance of the model.
Of course, the reliability of this model largely depends on the imaging expertise of those delineating the ROIs. 28 Poor ROI delineation practices include drawing boundaries of lung masses that are significantly larger or smaller than the actual size, marking areas of inflammation, effusion, or other non-mass regions as ROIs, and failing to adhere strictly to the established boundaries during the delineation process. Inaccurate ROI delineation can lead to misestimation of the tumor’s Ki-67 level, potentially causing clinicians to misinterpret the patient’s condition. Therefore, the study recommends that at least 2 qualified clinicians delineate the ROIs. After eliminating possible drawing errors, the average of the obtained results should be considered the true value to facilitate accurate estimation of Ki-67 levels.
Overall, utilizing radiomics to predict Ki-67 expression is a vital non-invasive method for assessing Ki-67 levels in patients. However, it encounters challenges related to low accuracy and coarse classification, which impede its clinical application. To address these issues, this study combines manually delineated tumor ROI with traditional radiological features for feature extraction. By employing various machine learning models and integrating feature selection, we enhance the precision of predicting the multi-class expression of Ki-67. This approach has significantly facilitated the incorporation of radiomics into clinical diagnostics.
Conclusions
Manual delineation of NSCLC ROIs provides greater objectivity and precision compared to traditional length and width measurements, which are susceptible to personal biases that can compromise reliability. By integrating clinical imaging features with mathematical characteristics derived from manually delineated ROIs in radiomics, the loss of information due to human interpretation is minimized. This integration allows for the objective quantification of tumor characteristics, thereby enhancing assessment accuracy. This study employed manual ROI delineation to extract features of NSCLC, combined with traditional imaging attributes, and applied machine learning techniques to improve the prediction of Ki-67 expression levels in lung cancer. This approach assists physicians in accurately assessing conditions and prognoses, reduces financial burdens on patients, and minimizes radiation exposure. It holds significant clinical potential as a diagnostic and prognostic tool for evaluating the proliferation rate of NSCLC.
Footnotes
Appendix A
Hyperparameter settings for different models.
| LR | |
| multi_class | Multinomial |
| Solver | Lbfgs a |
| class_weight | Balanced |
| max_iter | 1000 |
| SVM | |
| C | 1.0 |
| Kernel | Linear |
| Degree | 3 |
| Gamma | Scale |
| class_weight | Balanced |
| decision_function_shape | Ovr |
| RF | |
| n_estimators | 10 |
| Criterion | Gini b |
| max_depth | None |
| min_samples_split | 2 |
| min_samples_leaf | 1 |
| Bootstrap | True |
| class_weight | None |
| n_jobs | -1 |
| DNN | |
| Layer (type) | Output Shape
(None, 4) (None, 64) (None, 64) (None, 4) |
| dense_8 (Dense) | |
| dense_9 (Dense) | |
| dense_10 (Dense) | |
| dense_11 (Dense) | |
| Optimizer | SGD(learning_rate = 0.1) |
| Loss | categorical_crossentropy |
Optimize using the Limited-memory Broyden–Fletcher–Goldfarb–Shanno (L-BFGS) algorithm. 29
Usually better than entropy-based information gain. 30
Acknowledgements
Thanks to Hongjiang Liu for his assistance with software installation and debugging for this paper. We extend our heartfelt gratitude to Tina Zhang for her invaluable suggestions regarding the writing of this article. We would like to express our gratitude to Associate Chief Physician Fengmei Qiu for her invaluable assistance in interpreting the standards for the grayscale display monitor used in this study.
Ethical Considerations
This study has received approval from the Medical Ethics Committee of the Affiliated Cancer Hospital and Institute of Guangzhou Medical University, under project number 2024-ZN030.
Consent to Participate
Written informed consent was obtained for each participant according to ICMJE guidelines.
Author Contributions
Yizhi Li: Conceptualization, Methodology, Software, Validation, Formal analysis, Writing - Original Draft, Writing - Review & Editing, Visualization.
Jia Zhang: Data Curation, Writing - Original Draft.
Xiaodan Lin: Writing - Original Draft, Writing - Review & Editing, Supervision, Project administration.
Funding
The author(s) received no financial support for the research, authorship, and/or publication of this article.
Declaration of Conflicting Interests
The author(s) declared no potential conflicts of interest with respect to the research, authorship, and/or publication of this article.