
Abstract
Introduction:
In type 1 diabetes, hybrid closed-loop (HCL) systems have proven effective in improving glucose control without increasing time below range (TBR). We aimed to compare the performance of different HCL systems through a meta-analysis and network meta-analysis of randomized controlled trials (RCTs).
Methods:
We searched MEDLINE, EMBASE, CENTRAL, PubMed, and conference proceedings up to April 18, 2025, and ultimately included RCTs involving children, adolescents, and adults with type 1 diabetes, with baseline HbA1c 7.0%–8.5%, comparing HCL systems with other forms of insulin therapy, and reporting time in range (TIR).
Results:
A total of 32 RCTs were analyzed. Among the 22 RCTs with a mean participant age ≥ 18 years, Omnipod 5, MiniMed 780G, and iLet BP improved TIR by approximately 20% over subcutaneous insulin therapy (SIT) without continuous glucose monitoring (high certainty); of the three, only MiniMed 780G achieved a mean end-of-study TIR > 70%. In the 10 RCTs with participants < 18 years, Control IQ showed the greatest improvement in TIR, although none of the systems reached a mean TIR > 70%. All HCL systems reduced TBR compared with SIT in studies with participants ≥ 18 years but showed similar effects to SIT in younger populations. The risk of severe hypoglycemia and diabetic ketoacidosis was low and similar to other treatment strategies.
Conclusions:
In RCTs involving individuals with type 1 diabetes, HCL systems demonstrate a hierarchy of efficacy compared with SIT, which also appear to be influenced by the mean age of participants.
Introduction
In type 1 diabetes, hybrid closed-loop (HCL) systems have proven effective in reducing glycated hemoglobin (HbA1c) levels and increasing time spent within target glucose range (TIR) without increasing (and in some studies even reducing) time spent below range (TBR).1,2 A network meta-analysis (NMA) conducted by our group, including 28 randomized controlled trials (RCTs) and updated as of August 9th, 2023, evaluated five commercially available HCL systems against other types of subcutaneous intensive insulin therapy in people with type 1 diabetes, showing for the first time a hierarchy of efficacy between systems in terms of glycemic outcomes and according to specific subgroups of participants. 3 Since then, additional RCTs have been completed in the field, some of which assess systems not included in the aforementioned NMA.
With this systematic review of RCTs, we aimed to provide an updated overview of the efficacy and safety of HCL technology, with a particular focus on comparing the performance of the different systems available in the market through meta-analysis (MA) and NMA.
Methods
The study protocol was uploaded to PROSPERO with registration number CRD42023453717.
Data sources
We searched MEDLINE (via Ovid), EMBASE, and CENTRAL from inception to April 18th, 2025 (search strategy in Supplementary Appendix S2) and performed hand-searching in PubMed and conference proceedings to find all relevant studies outside the databases. Corresponding authors were contacted in case of missing data for any of the outcomes of interest.
Ethics approval
All analyses were performed on data extracted from previously conducted trials. Patient consent for publication was not required.
Study selection
We initially searched for RCTs including children, adolescents, and adults with type 1 or type 2 diabetes, evaluating any commercially available HCL system against other types of subcutaneous intensive insulin therapy, and reporting 24-h TIR (70–180 mg/dL) as an outcome of the trial.
Trials conducted in special populations with diabetes (e.g., pregnant women, people with kidney or liver failure or with highly unstable diabetes, hospitalized people, etc.) or evaluating the efficacy of HCL therapy under experimentally induced stress challenges (physical exercise, gastronomic meals, etc.) were excluded, as insulin dosing in these subgroups and/or situations may not reflect the usual practice.
The primary outcome was TIR (mean difference [MD]). Secondary outcomes included difference in time in 70–140 mg/dL glucose range (time in tight range, TITR), TBR, time below 54 mg/dL (TBR < 54 mg/dL), time above range (TAR), 24-h mean sensor glucose, coefficient of variation of mean glucose (CV), HbA1c, occurrence of severe hypoglycemia (SH) or diabetic ketoacidosis (DKA), and patient-reported outcome measures (PROMs), including treatment satisfaction and quality of life. All causes of death, occurrence of major adverse cardiovascular events, lower limb gangrene or lower limb amputation, development/worsening of diabetic retinopathy or nephropathy, and need for renal replacement therapy were also collected.
Data extraction
Three reviewers (I.C., L.D.G., and S.D.M.) independently evaluated article titles and abstracts based on the above-mentioned inclusion and exclusion criteria. Disagreements were settled by discussion. The following data were collected from the included articles: study characteristics (study design, duration, year of publication, sample size), participants’ characteristics (age, sex, HbA1c at baseline, and disease duration), HCL model under evaluation, comparator(s), TIR, TITR, TBR, TBR <54 mg/dL, 24-h mean sensor glucose, TAR, CV, HbA1c, PROMs, prevalence of SH and DKA, and occurrence of other severe adverse events (all causes of death, occurrence of major adverse cardiovascular events, lower limb gangrene or lower limb amputation, development/worsening of diabetic retinopathy or nephropathy, and need for renal replacement therapy). For the purposes of our analysis, data were collected by pooling comparators as reported in the statistical analyses section.
Study investigators were contacted in case of missing data. For continuous variables, if the mean value was not provided in the article, it was calculated by dividing the sum of the median, first quartile, and third quartile by 3. 4 If standard deviation (SD) was missing, it was calculated from the standard error (SE) by multiplying SE by the square root of the sample size. If SE was also missing, SD was imputed based on the higher value within each group. 5 Disagreements in data extraction were settled by debate. Data were ultimately entered in a spreadsheet application.
Risk of bias assessment
Bias risk was independently evaluated by two authors (I.C., L.D.G.) using the Cochrane Collaboration’s Risk of Bias 2 tool. This tool considers several domains, including the randomization process, adherence to the intended intervention, completeness of outcome data, outcome measurement, selection of reported results, and overall risk of bias (RoB). Each domain was classified as having a low RoB, some concerns, or a high RoB. Any discrepancies between reviewers were resolved through discussion.
Statistical analysis
Continuous variables were expressed as mean (SD) or as median (interquartile range, IQR) in case of normal and non-normal distribution, respectively; categorical variables were expressed as counts and percentages.
Pairwise MAs were conducted for direct comparisons. The transitivity assumption that an NMA approach is appropriate was assessed by comparing the distribution of potential effect modifiers (duration of intervention, duration of diabetes, age, HbA1c at baseline) across all treatment comparisons. However, after observing potential violations of the transitivity assumption (Supplementary Appendix S4.1), we decided to exclude studies enrolling individuals with type 2 diabetes (n = 3) and those with baseline HbA1c below 7.0% and above 8.5% (n = 7) (Supplementary Appendix S3.1) and to stratify the analyses by age group (<18 years vs ≥18 years) rather than conducting formal subgroup comparisons. All these corrective measures were applied to improve the plausibility of the transitivity assumption and ensure more homogeneous comparisons across treatment nodes (Supplementary Appendix S4.2, S4.3, S13, and S14). We subsequently performed frequentist random effects NMA, 6 using MD and 95% confidence interval (CI) for TIR, TITR, TBR, TBR < 54 mg/dL, TAR, 24-h mean sensor glucose, CV, and HbA1c, and odds ratio (OR) and 95% CI for the risk of severe hypoglycemic events and DKA. For NMAs, comparison-adjusted funnel plots and Egger-type tests were used, when feasible, to explore potential reporting bias and small-study effects at the network level.
Heterogeneity was primarily assessed using the estimated between-study variance (τ2) for each outcome, compared with empirical distributions of heterogeneity variances.7,8 To provide a more intuitive measure of relative variability, I2 statistics were also calculated. Local consistency in networks was evaluated by comparing direct with indirect evidence 9 and global consistency with the design-by-treatment interaction model. 10 Furthermore, we performed network meta-regression analyses to evaluate the impact of potential effect modifiers on MD in TIR. For all outcomes, we performed sensitivity analyses restricted to trials at a low RoB and excluding trials for which SDs were imputed. For the main outcome, we also performed a sensitivity analysis including trials with HbA1c < 7% or > 8.5%. In addition, we conducted MAs of end-of-study glycemic metrics and HbA1c, as well as the risk of SH and DKA. This approach was adopted to provide an estimate of the “absolute” effect of HCL systems (i.e., an effect not influenced by the performance of comparator treatments) in RCTs, informative of the potential achievement of recommended targets. TIR was reported both as unadjusted and as baseline HbA1c-adjusted estimates based on meta-regression analyses, and was presented separately for studies including patients with type 1 diabetes aged < 18 years and ≥ 18 years. For these MAs, heterogeneity was assessed with the I2 statistics, random-effects models were applied, and potential small-study effects were explored through funnel plots and, when feasible, Egger’s test. Unit harmonization across trials was performed before quantitative synthesis. Glucose metrics reported in mmol/L were converted to mg/dL using standard conversion factors, and HbA1c values reported in mmol/mol were converted to % according to established National Glycohemoglobin Standardization Program (NGSP)/International Federation of Clinical Chemistry and Laboratory Medicine (IFCC) conversion formulas, 11 ensuring consistency of outcome scales across studies. All analyses were performed using RStudio 2025.05.1 Build 513 (MacOS, Apple Silicon version), R 4.5.1 (2025-06-13), and R packages meta 12 version 8.1-0, NMA 13 version 1.4-3, and netmeta 14 version 3.2-0. Treatment comparisons were generated using the pairwise() function from the netmeta package, specifying the study identifier as studlab. Subsequently, the netmeta() function was used to perform the frequentist NMA. This function accounts for the correlation between effect estimates arising from shared comparators through its built-in multi-arm adjustment, thereby avoiding double counting and preventing inappropriate up-weighting of multi-arm studies.
We assessed confidence in NMA estimates using the Confidence In Network Meta-Analysis (CINeMA) framework and online application. 15 All statistical analyses were supervised by an independent statistician with no conflicts of interest related to diabetes technologies or pharmaceutical companies.
Role of the funding source
Funding sources had no role in study design, data collection, data analyses, interpretation, or writing but provided for publication fees.
Results
Study characteristics
Thirty-two RCTs with baseline HbA1c 7.0%–8.5%, involving 3477 participants with type 1 diabetes and evaluating seven different HCL systems, were ultimately included in this systematic review (Fig. 1 and Supplementary Appendix S1).
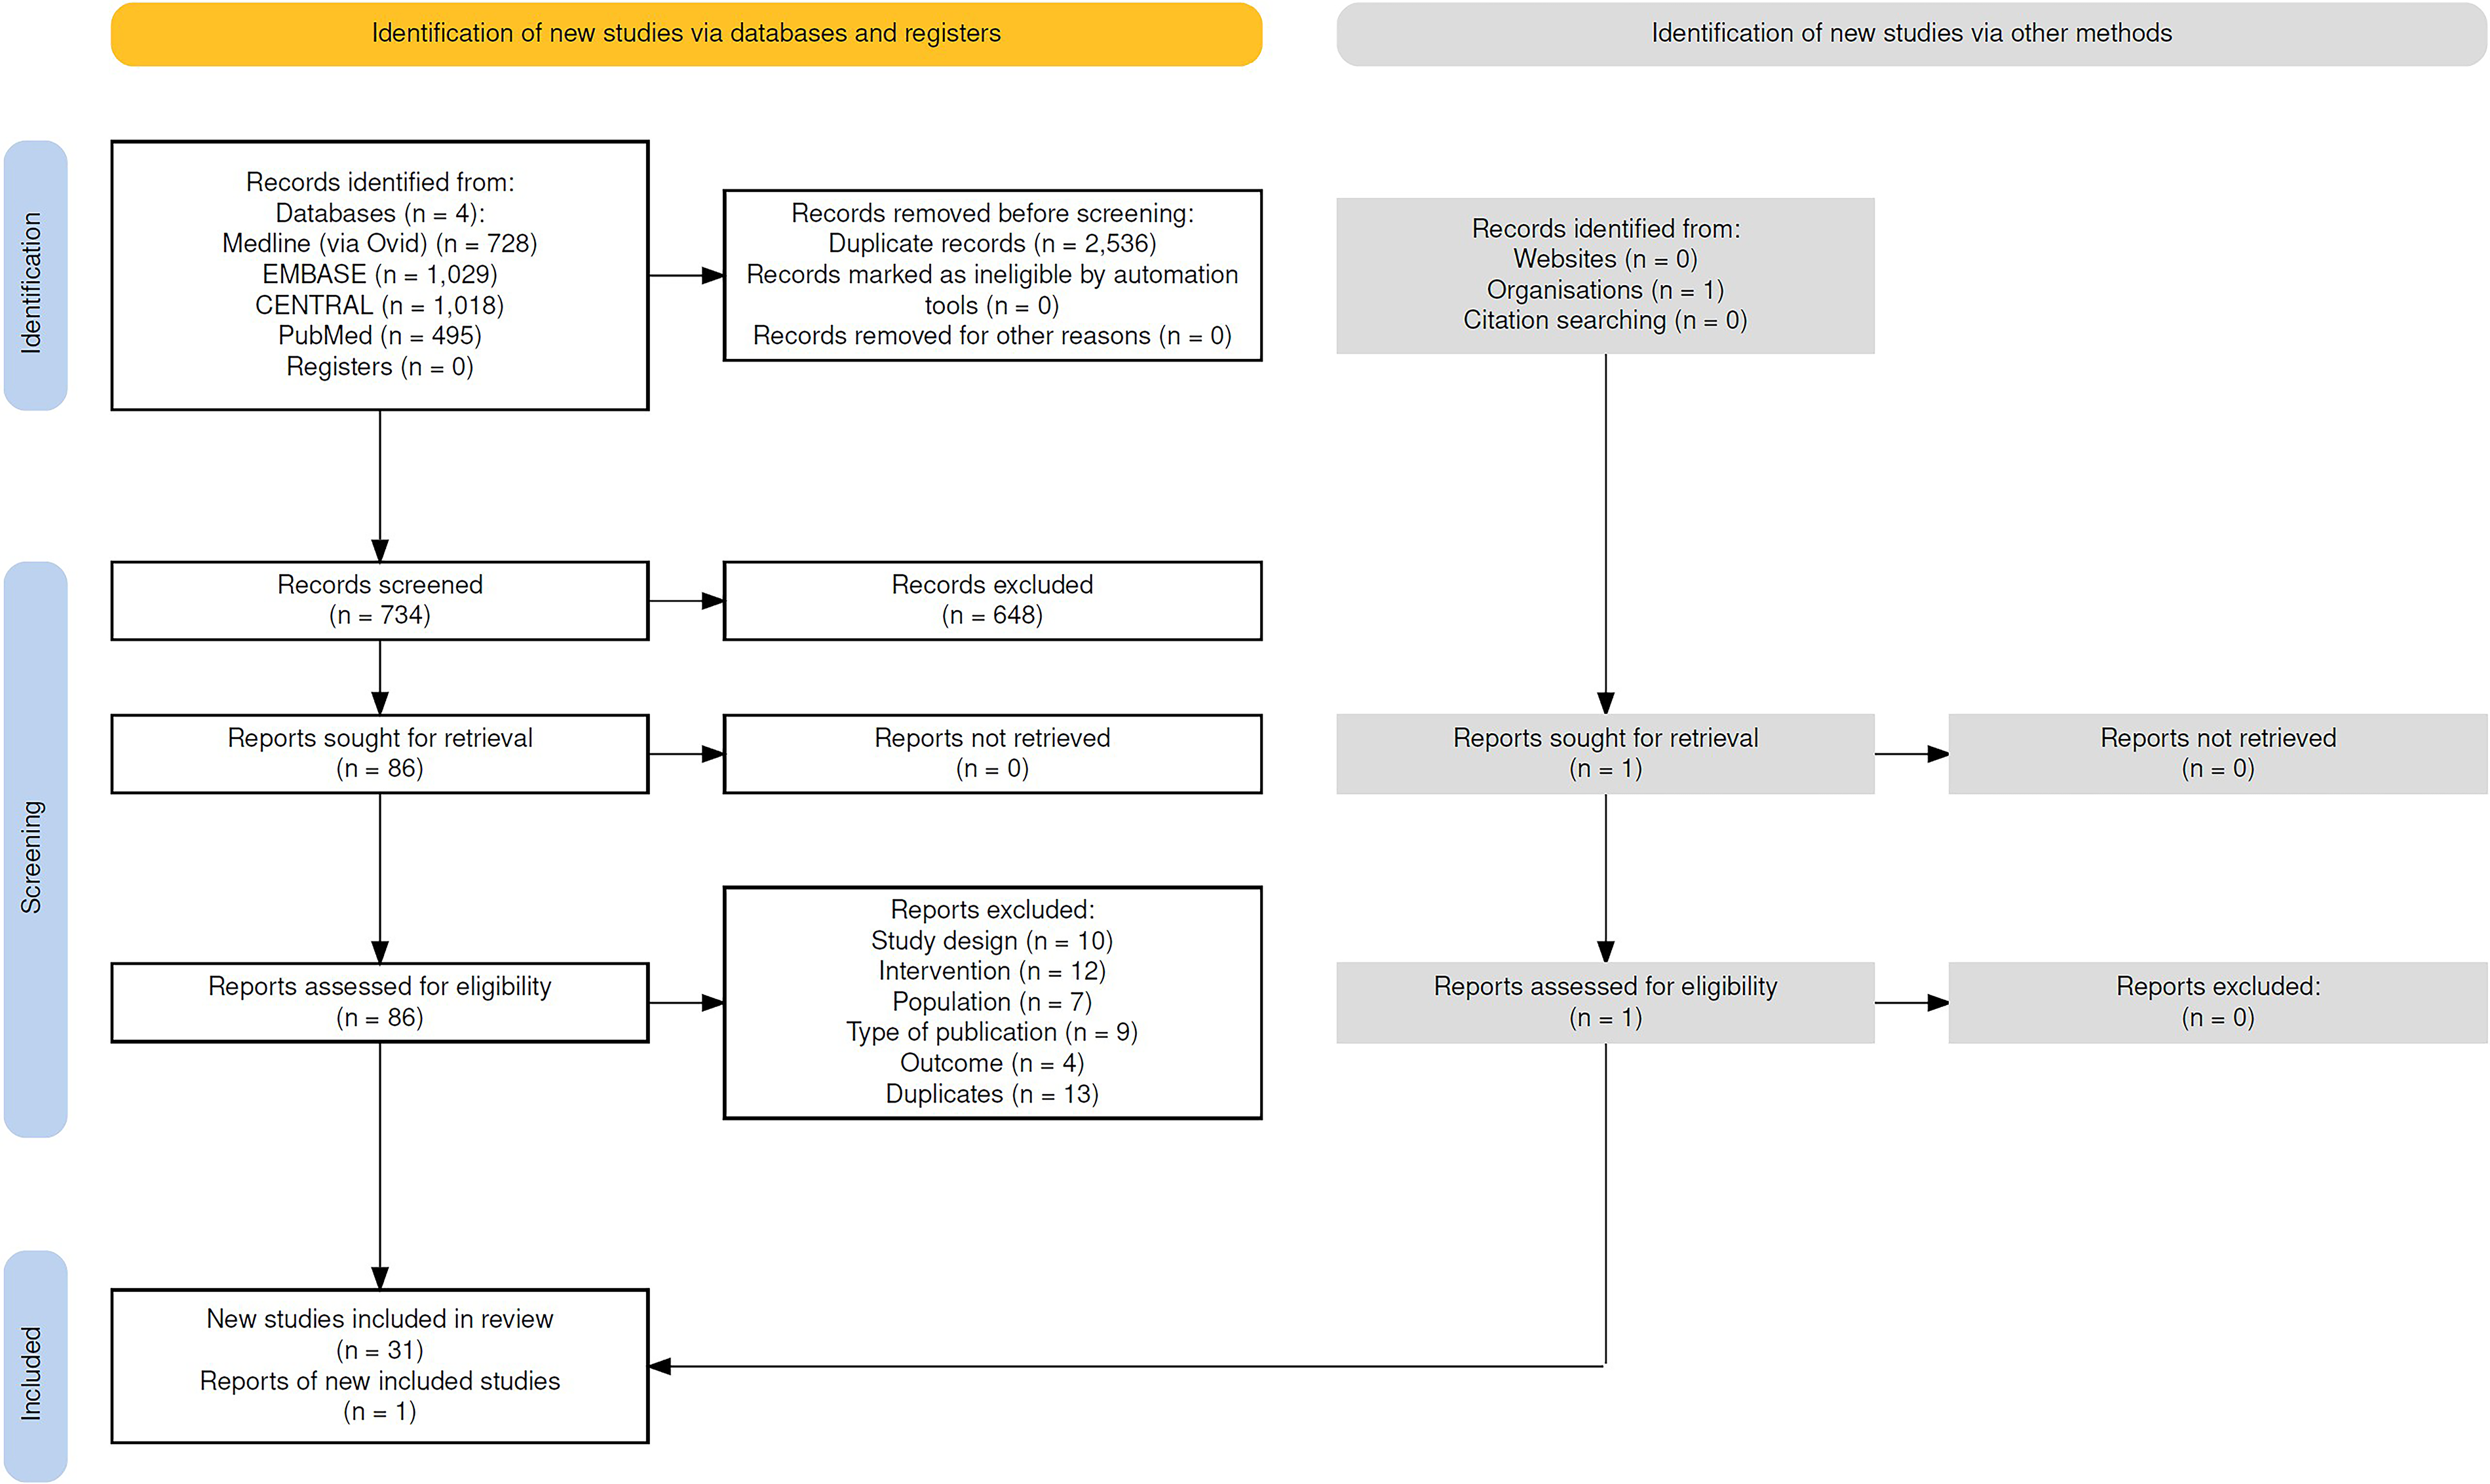
Preferred Reporting Items for Systematic reviews and Meta-Analyses (PRISMA) flow diagram of study search strategy. Haddaway, N. R., Page, M. J., Pritchard, C. C., & McGuinness, L. A. (2022). PRISMA2020: An R package and Shiny app for producing PRISMA 2020-compliant flow diagrams, with interactivity for optimized digital transparency and Open Synthesis Campbell Systematic Reviews, 18, e1230. https://doi.org/10.1002/cl2.1230.
Thirty-one out of 32 RCTs evaluated HCL systems against other forms of subcutaneous intensive insulin therapy, while one trial 16 compared two different HCL systems (MiniMed 670G and MiniMed 780G), resulting in a total of 33 data sources.
In detail, CamAPS Fx (CamDiab Ltd., Cambridge, UK) was evaluated in four RCTs; T:slim X2 with Control IQ technology (Control IQ; Tandem Diabetes Care, San Diego, CA, USA) in seven; Diabeloop Generation 1 (DBLG1) (Diabeloop, Grenoble, France) in four; iLet Bionic Pancreas (iLet BP) (Beta Bionics, Inc., Boston, MA, USA) in two; MiniMed 670G (Medtronic, Northridge, CA, USA) in eight; MiniMed 780G (Medtronic, Northridge, CA, USA) in six; and Omnipod 5 (Insulet Corporation, Acton, MA, USA) in two.
Study design and patients’ baseline features are presented in Supplementary Appendix S3.
For the purposes of the NMA, comparators were pooled as follows: subcutaneous insulin therapy (either multiple daily injections [MDI] or continuous subcutaneous insulin infusion [CSII]) without continuous glucose monitoring [CGM] (SIT); SIT with either real-time or intermittently scanned CGM (SITCGM), including sensor-augmented pump therapy (SAPT); and LGSPLGS, defined as SAPT with low glucose suspend (LGS) or predictive low glucose suspend (PLGS) functions.
Pooling was performed at the study-arm level. In the two trials evaluating the iLet BP system,17,18 where the comparator group included different types of treatment (HCL systems other than iLet BP, MDI without CGM, MDI with CGM, CSII without CGM, SAPT, and SAPT with PLGS) and outcomes were reported separately for each type, we aggregated the non-HCL participants into SIT, SITCGM, or LGS/PLGS using weighted averages. In other RCTs, the control groups likewise included participants on different treatment types, but separate outcomes were not reported. Specifically, the control groups included participants on SAPT with or without LGS or PLGS functions in 2 RCTs19,20 and on either CSII or MDI therapy in 4 RCTs,21–24 one of which included participants with or without CGM. 22 These control groups were assigned to SIT, SITCGM, or LGSPLGS based on the highest level of technology used within the group. Finally, one study 25 included two distinct control arms (i.e., SAPT with and without the PLGS function), which were meta-analyzed as SITCGM and LGSPLGS, respectively.
Baseline HbA1c was similar across studies with different HCL systems (Supplementary Appendix S3 and S4). To enhance comparability across treatment nodes, NMAs were stratified by the mean age of study participants, with separate analyses conducted for studies with a mean age ≥ 18 years (22 RCTs, n = 2497) and those with a mean age < 18 years (10 RCTs, n = 980). The networks of trials used to evaluate TIR, TITR, TBR, TBR < 54 mg/dL, TAR, CV, mean glucose, HbA1c, and risk of severe hypoglycemic events and DKA are shown in Supplementary Appendix S13, S14, S15, S16, S17, S18, S19, S20, S21, S22, S23, S24, S25, S26, S27, S28, S29, S30, S31, and S32. In the case of iLet BP, NMA was feasible only for TIR and HbA1c, since the remaining outcomes were reported with comparators aggregated in pooled analyses rather than distinguished by individual technologies. For Omnipod 5, no RCTs enrolled participants with a mean age < 18 years; therefore, the analyses were restricted to trials with a mean participant age ≥ 18 years. Overall RoB for the main outcome was deemed low for 8 and 16 trials and of some concern for 2 and 6 trials in trials with a mean participant age < 18 and ≥ 18 years, respectively (Supplementary Appendix S5 and S6). Comparison-adjusted funnel plots were inspected for all outcomes across both age strata (<18 years and ≥18 years). Egger-type tests were performed for all outcomes in the ≥18 years population and for TIR in the < 18 years population, where a sufficient number of studies was available. These analyses did not suggest relevant small-study effects or reporting bias at the network level (Supplementary Appendix S7 and S8). Evidence certainty was generally high to moderate for mean change in TIR, TAR, TBR, and HbA1c for participants with a mean age ≥ 18 years, while it was generally moderate to low for those with a mean age < 18 years. Regardless of the participants’ age, certainty of evidence was generally low for TITR and the risk of SH and DKA (Supplementary Appendix S13, S14, S15, S16, S17, S18, S19, S20, S21, S22, S23, S24, S25, S26, S27, S28, S29, S30, S31, and S32). Trials with a mean participant age ≥ 18 years demonstrated a consistent network structure across outcomes, as shown in Supplementary Appendix S10. Estimates of heterogeneity (τ2) were generally low across outcomes. 7 However, moderate to substantial heterogeneity was observed for specific endpoints such as TITR, TBR, and CV. In analyses restricted to trials with a mean age < 18 years, heterogeneity was more variable, with τ2 values corresponding to I2 estimates ranging from low to considerable, as detailed in Supplementary Appendix S9.
Regarding inconsistency, some comparisons within the network of trials with a mean participant age ≥ 18 years showed local incoherence (notably for CV and HbA1c), although the global design-by-treatment interaction test did not indicate statistically significant inconsistency for most outcomes. In contrast, both local (node-splitting) and global tests revealed no evidence of incoherence in the network of trials with a mean participant age < 18 years. In the MA, substantial heterogeneity was observed for all end-of-study outcomes in the subgroup of trials enrolling participants with a mean age < 18 years, except for SH, and for DKA in both age groups (<18 and ≥18 years). In the MAs of end-of-study results, Egger’s test was suggestive of small-study effects for TIR in studies with a mean participant age ≥ 18 years, and for TBR, TBR < 54 mg/dL, and DKA in both age groups (Supplementary Appendix S13, S14, S15, S16, S17, S18, S19, S20, S21, S22, S23, S24, S25, S26, S27, S28, S29, S30, S31, and S32). These signals were outcome-specific and were interpreted cautiously given the limited number of studies in several analyses.
Time In range
A total of 22 RCTs (n = 2497) enrolling participants with a mean age ≥ 18 years reported TIR outcomes (Fig. 2A). In the NMA, all HCL systems were significantly more effective than SIT in improving TIR (high certainty; Table 1a and Supplementary Appendix S14). Omnipod 5 yielded the greatest improvement over SIT (MD 22.8%, 95% CI: 17.0–28.6); however, its efficacy appeared to be similar to that of MiniMed 780G and iLet BP (low certainty; Supplementary Appendix S14). Of note, Omnipod 5 and MiniMed 780G demonstrated greater efficacy than MiniMed 670G, Control IQ, CamAPS Fx, and DBLG1, with MDs ranging from 5.7%–10% in head-to-head comparisons (moderate to high certainty; Supplementary Appendix S14). Network meta-regression showed no significant effect modification by baseline HbA1c, participant age, diabetes duration, or intervention duration across treatment comparisons. In the MA of end-of-study TIR, only four out of seven HCL systems, namely CamAPS Fx (72.4%, 95% CI: 57.8–87.0), Control IQ (71.9%, 95% CI: 69.0–74.8), DBLG1 (70.4%, 95% CI: 64.6–76.0), and MiniMed 780G (75.3%, 95% CI: 69.1–81.4), achieved a mean TIR > 70%. This finding remained consistent after adjusting the end-of-study TIR for baseline HbA1c (Table 1a and Supplementary Appendix S14).
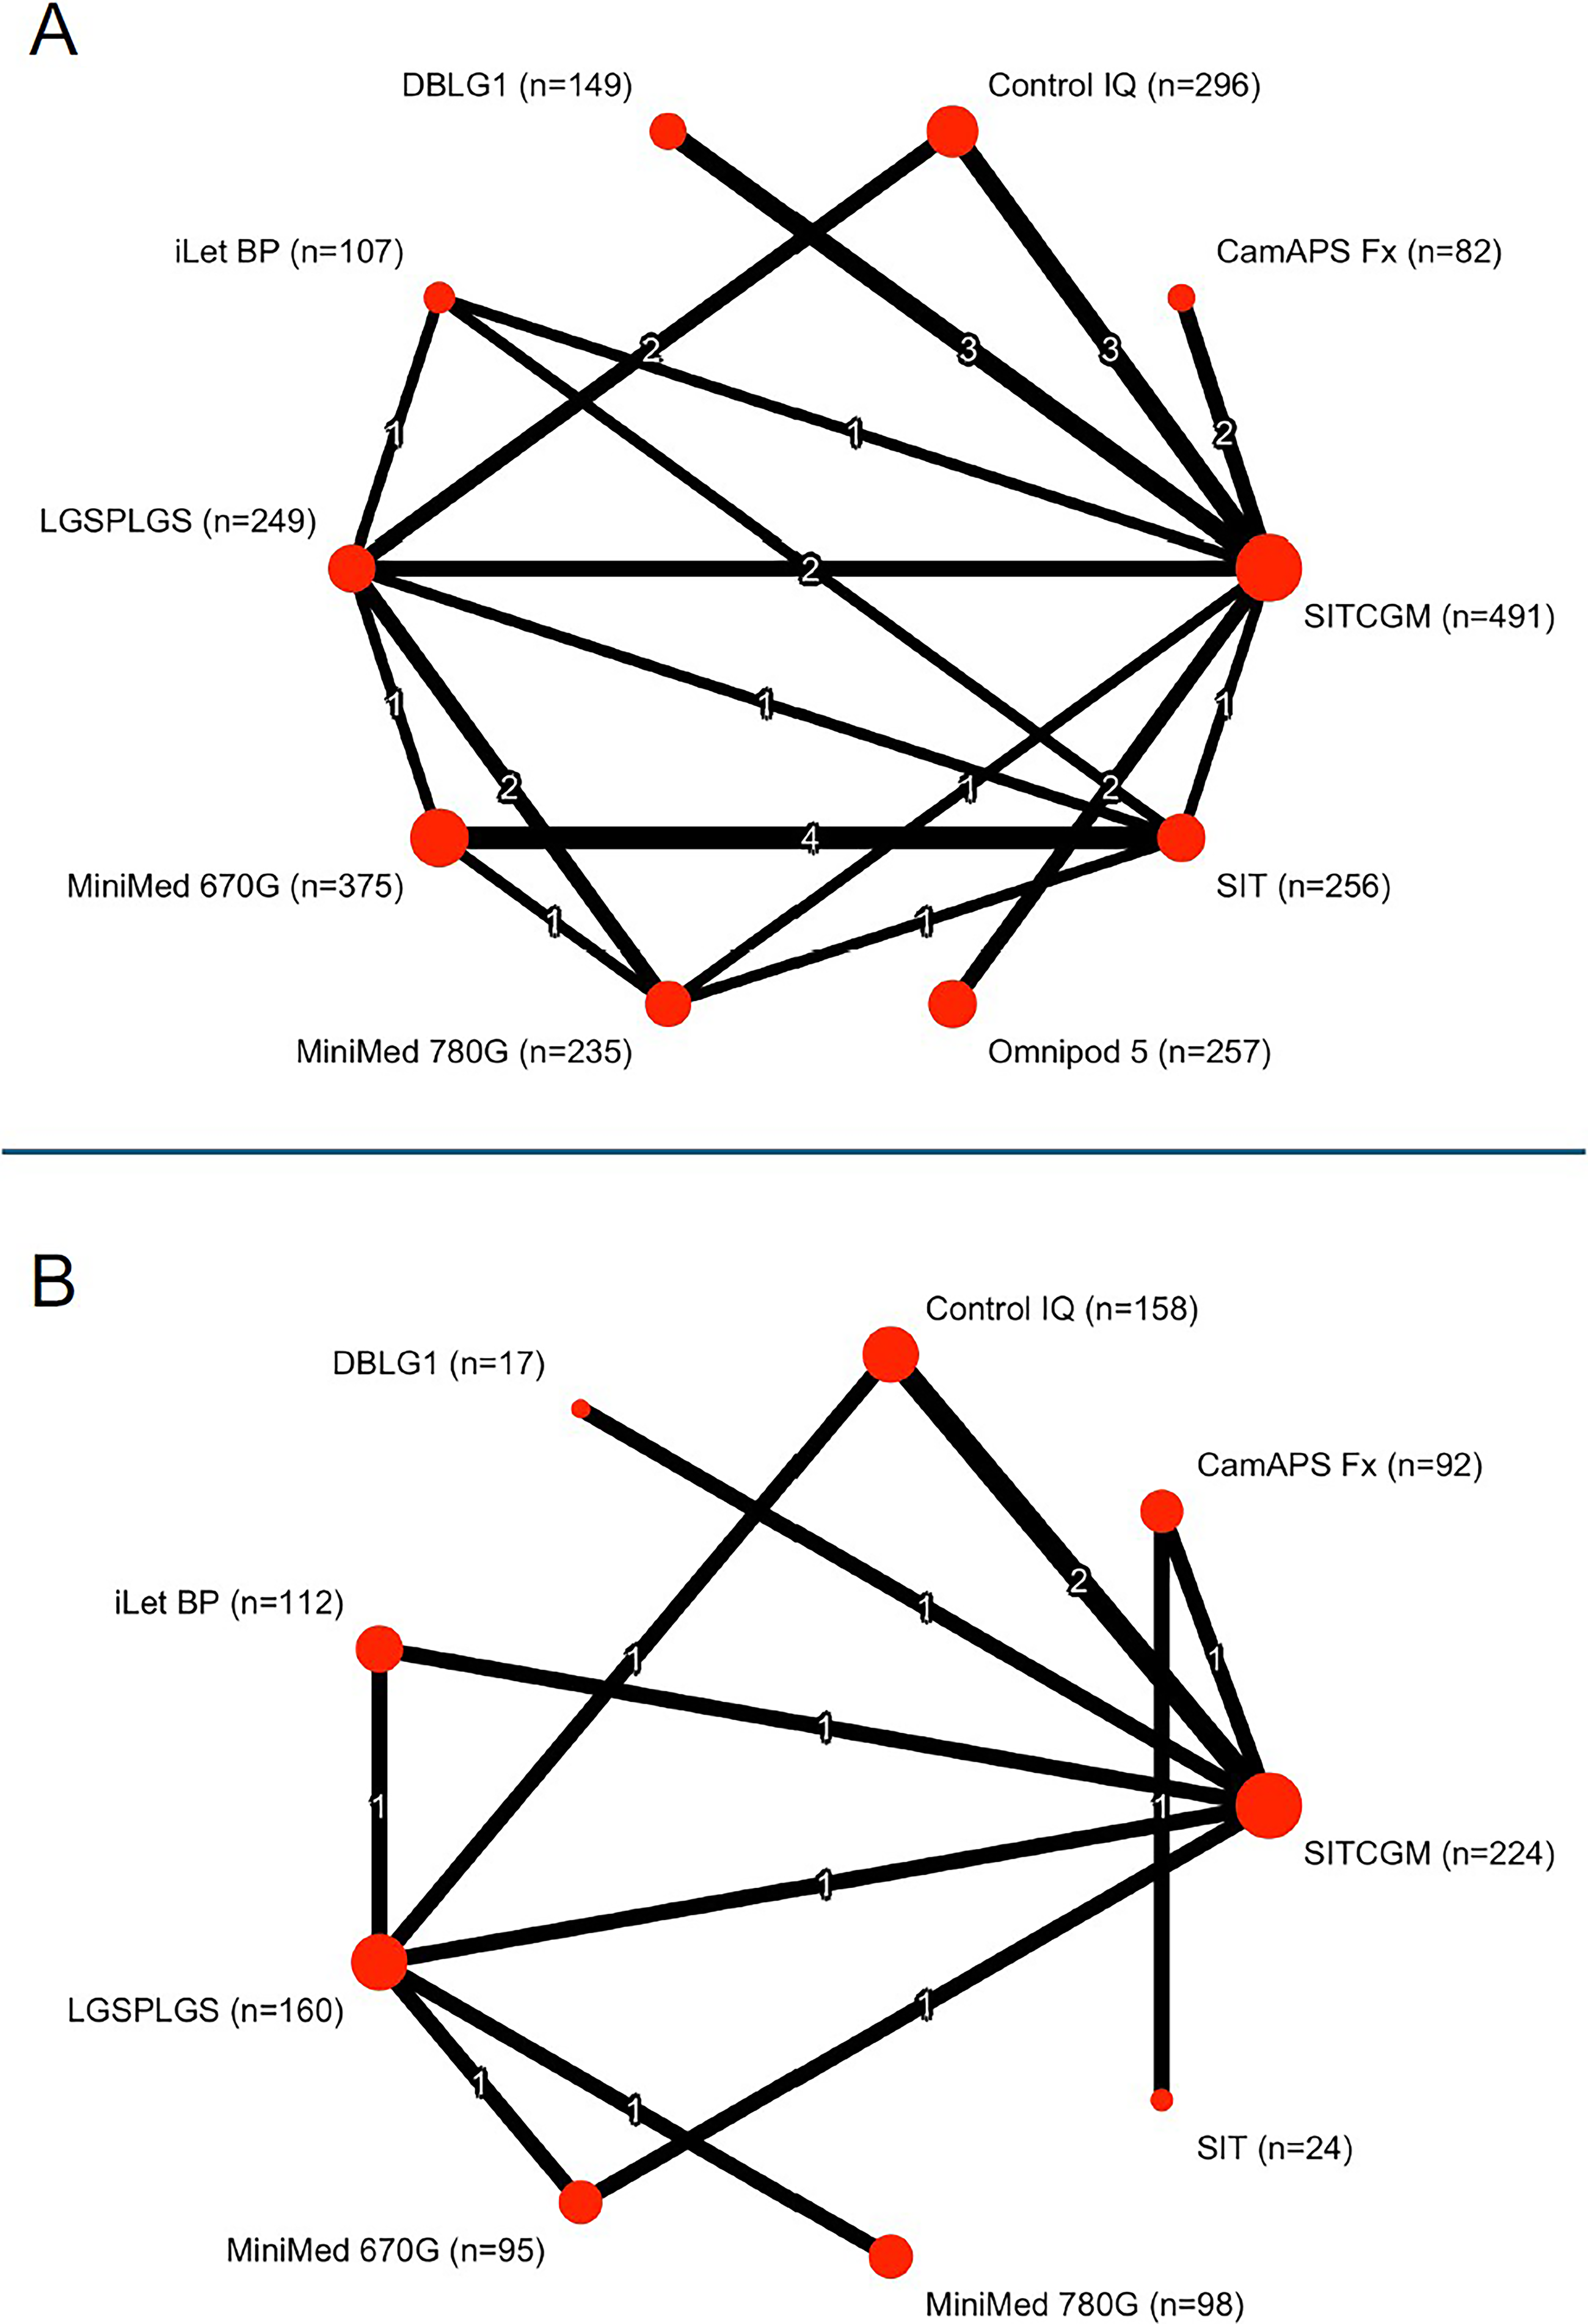
Meta-analysis network for time in range (TIR) from studies including participants with mean age ≥ 18 years
Summary of Meta-Analytic Results on TIR from Studies Including Participants with Mean Age ≥ 18 Years (1a) and < 18 Years (1b)

The first column reports the MD in TIR versus SIT from the NMA, the second column presents the certainty of evidence (GRADE) from the NMA, the third column shows the pooled estimate of mean TIR at the end of study from the MA, and the fourth column reports the same pooled estimate after adjustment for baseline HbA1c.
GRADE, Grading of Recommendations Assessment, Development and Evaluation; MA, meta-analysis; MD, mean difference; NMA, network meta-analysis; SIT, subcutaneous insulin therapy without continuous glucose monitoring; TIR, Time in Range (70–180 mg/dL).
A total of 10 RCTs (n = 980) enrolling participants with a mean age < 18 years reported TIR outcomes (Fig. 2B). In the NMA, all HCL systems were significantly more effective than SIT in improving TIR (low to moderate certainty; Table 1b and Supplementary Appendix S13). Use of Control IQ resulted in the greatest improvement over SIT (MD 19.1%, 95% CI: 9.8–28.3); however, its effects appeared to be comparable with iLet BP (low certainty), MiniMed 780G (moderate certainty), and CamAPS Fx (moderate certainty) (Supplementary Appendix S13). Network meta-regression showed no significant effect modification by participant age, diabetes duration, or intervention duration across treatment comparisons. In the MA of the same trials, none of the HCL systems achieved a mean TIR > 70% at the end of the study, even after adjustment for baseline HbA1c (Table 1b and Supplementary Appendix S13).
Time In tight range
A total of 11 RCTs (n = 1155) enrolling participants with a mean age ≥ 18 years reported TITR outcomes. TITR was not reported in any RCT with CamAPS Fx. In the NMA, MiniMed 780G (MD 19.49%, 95% CI 10.12–28.87) and MiniMed 670G (MD 12.68%, 95% CI 6.03–19.32) were significantly more effective than SIT in improving TITR (Supplementary Appendix S16, low certainty, and S35.2). According to the MA, DBLG1 and MiniMed 780G achieved end-of-study TITR values approaching 50%, whereas other HCL systems yielded lower estimates (Supplementary Appendix S16).
Among the six RCTs enrolling participants with a mean age < 18 years (n = 567), none of the trials reporting TITR used SIT as comparator. In the NMA, MiniMed 780G (MD 17.65%, 95% CI 5.14–30.16; moderate certainty) and Control IQ (MD 15.40%, 95% CI 9.03–21.77; low certainty) were significantly more effective than SITCGM in improving TITR, achieving end-of-study values of 47.8% (95% CI 46.6–48.9) and 46.4% (95% CI 43.4–49.5), respectively (Supplementary Appendix S15 and S35.1).
Time below range
A total of 21 RCTs (n = 2353) enrolling participants with a mean age ≥ 18 years reported TBR outcomes. In the NMA, all the included HCL systems were significantly more effective than SIT in improving TBR (moderate certainty for MiniMed 670G and 780G and high certainty for other HCL systems; Table 2a and Supplementary Appendix S18). The efficacy of the different HCL systems in reducing TBR was broadly comparable; however, DBLG1 showed the greatest improvement over SIT (MD −3.69%, 95% CI −5.59 to −1.79) (Supplementary Appendix S18). In the MA, all HCL systems achieved end-of-study TBR values < 4% (Table 2a and Supplementary Appendix S18). Among the nine RCTs enrolling participants with a mean age < 18 years (n = 831), all HCL systems included in the NMA showed a comparable impact on TBR relative to SIT and to each other. At the end of the study, mean TBR values < 4% were observed with all HCL systems but CamAPS Fx and MiniMed 780G (Table 2b and Supplementary Appendix S17).
Summary of Meta-Analytic Results on TBR from Studies Including Participants with Mean Age ≥ 18 Years (2a) and < 18 Years (2b)

The first column reports the MD in TBR versus SIT from the NMA, the second column presents the certainty of evidence (GRADE) from the NMA, and the third column shows the pooled estimate of mean TBR at the end of study from the MA.
GRADE, Grading of Recommendations Assessment, Development and Evaluation; MA, meta-analysis; MD, mean difference; NA, not available; NMA, network meta-analysis; SIT, subcutaneous insulin therapy without continuous glucose monitoring; TBR, Time Below Range (<70 mg/dL).
Time below range < 54 mg/dL
A total of 15 RCTs (n = 1541) enrolling participants with a mean age ≥ 18 years reported TBR < 54 mg/dL outcomes. In the NMA, all the included HCL systems (TBR < 54 mg/dL was not reported in any RCT with DBLG1) significantly reduced TBR < 54 mg/dL compared with SIT, with similar efficacy to each other in head-to-head comparisons (Supplementary Appendix S20 and S35.4). In the MA, all the included HCL systems achieved TBR < 54 mg/dL values < 1%.
Among the nine RCTs enrolling participants with a mean age < 18 years (n = 831), all HCL systems included in the NMA showed a similar effect on TBR < 54 mg/dl compared with SIT and to each other (Supplementary Appendix S19 and S35.3). In the MA, all included HCL systems except CamAPS Fx achieved TBR < 54 mg/dL values < 1%.
Time above range
A total of 21 RCTs (n = 2353) enrolling participants with a mean age ≥ 18 years reported TAR outcomes. All included HCL systems significantly reduced TAR compared with SIT (high certainty; Table 3a and Supplementary Appendix S22), with Omnipod 5 showing the largest reduction and greater efficacy than all other HCL systems in head-to-head comparisons (high certainty). In the MA, CamAPS Fx and MiniMed 780G achieved end-of-study TAR values < 25%.
Summary of Meta-Analytic Results on TAR from Studies Including Participants with Mean Age ≥ 18 Years (3a) and < 18 Years (3b)

The first column reports the MD in TAR versus SIT from the NMA, the second column presents the certainty of evidence (GRADE) from the NMA, and the third column shows the pooled estimate of mean TAR at the end of study from the MA.
GRADE, Grading of Recommendations Assessment, Development and Evaluation; MA, meta-analysis; MD, mean difference; NA, not available; NMA, network meta-analysis; SIT, subcutaneous insulin therapy without continuous glucose monitoring; TAR, time above range (>180 mg/dL).
Among the nine RCTs enrolling participants with a mean age < 18 years (n = 831), all HCL systems included in the NMA except DBLG1 were more effective than SIT in reducing TAR (low to moderate certainty; Table 3b and Supplementary Appendix S21), with similar efficacy to each other in head-to-head comparisons (very low to moderate certainty). In the MA, only CamAPS Fx achieved an end-of-study TAR < 25%.
Mean glucose
A total of 18 RCTs (n = 1779) enrolling participants with a mean age ≥ 18 years reported mean glucose outcomes. In the NMA, Omnipod 5, MiniMed 780G, and MiniMed 670G were significantly more effective than SIT in reducing mean glucose (Supplementary Appendix S24 and S35.6). MiniMed 780G was more efficacious than MiniMed 670G, while Omnipod 5 showed comparable efficacy with both. End-of-study mean glucose values were 174 mg/dL (95% CI 170.6–177.4) with Omnipod 5, 157 mg/dL (95% CI 151.4–162.6) with MiniMed 670G, and 146.8 mg/dL (95% CI 137.8–155.7) with MiniMed 780G. Among the nine RCTs enrolling 831 participants with a mean age < 18 years (n = 831), all HCL systems included in the NMA showed greater efficacy than SIT in improving mean glucose, with Control IQ yielding the greatest improvement (MD −43.1 mg/dL, 95% CI −68.6 to −17.6). In head-to-head comparisons, Control IQ showed similar efficacy to MiniMed 780G CamAPS Fx and DBLG1, and greater efficacy compared with MiniMed 670G (Supplementary Appendix S23 and S35.5). In the MA, end-of-study mean glucose values ranged from 144.5 mg/dL (CamAPS Fx) to 172 mg/dL (iLet BP).
Coefficient of variation
A total of 16 RCTs (n = 1635) enrolling participants with a mean age ≥ 18 years reported CV outcomes. In the NMA, Control IQ achieved the largest improvement in CV compared with SIT (MD −7.49%, 95% CI −10.89 to −4.08); however, it showed similar efficacy to all other included HCL systems in head-to-head comparisons (Supplementary Appendix S26 and S35.8). All HCL systems but CamAPS Fx and Omnipod 5 achieved CV ≤ 36% in the MA.
Among the nine RCTs enrolling 831 participants with a mean age < 18 years (n = 831), all HCL systems included in the NMA showed a comparable impact on CV relative with SIT and with each other. At the end of the study, mean CV values ≤ 36% were observed only with MiniMed 670G (35.8%, 95% CI 30.9–40.8) (Supplementary Appendix S25 and S35.7).
HbA1c
A total of 19 RCTs (n = 2229) enrolling participants with a mean age ≥ 18 years reported HbA1c outcomes. In the NMA, MiniMed 780G, Omnipod 5, iLet BP, and MiniMed 670G were significantly more effective than SIT in improving HbA1c (high certainty; Table 4a and Supplementary Appendix S28), with comparable efficacy with each other except for 780G vs 670G (MD −0.3%, 95% CI −0.5 to −0.1, high certainty). In the MA, the lowest end-of-study HbA1c values were achieved with Control IQ (7%, 95% CI 6.9–7.1) and MiniMed 780G (7%, 95% CI 6.7%–7.4%).
Summary of Meta-Analytic Results on HbA1c from Studies Including Participants with Mean Age ≥ 18 Years (4a) and < 18 Years (4b)

The first column reports the MD in HbA1c versus SIT from the NMA, the second column presents the certainty of evidence (GRADE) from the NMA, and the third column shows the pooled estimate of mean HbA1c at the end of study from the MA.
GRADE, Grading of Recommendations Assessment, Development and Evaluation; HbA1c, glycated hemoglobin; MA, meta-analysis; MD, mean difference; NA, not available; NMA, network meta-analysis; SIT, subcutaneous insulin therapy without continuous glucose monitoring.
Among the seven RCTs enrolling participants with a mean age < 18 years (n = 816), all of which included HCL systems (HbA1c was not reported in any RCT with DBLG1), HCL systems were significantly more effective than SIT in improving HbA1c (high certainty; Table 4b and Supplementary Appendix S27). MiniMed 780G showed the greatest improvement over SIT (MD −1.25%, 95% CI: −1.89 to −0.61); however, a similar efficacy of this system versus Control IQ, CamAPS Fx, and iLet BP was observed in head-to-head comparisons (low certainty; Supplementary Appendix S27). In the MA, all included HCL systems achieved HbA1c ≤ 7.5% at the end of the study, with CamAPS Fx achieving the lowest estimate (6.7%, 95% CI 6.5%–6.9%).
Adverse events
A total of 20 and 9 RCTs reported the number of patients who experienced SH and DKA episodes in the ≥18 years and <18 years cohorts, respectively. The risk of SH and DKA was not statistically different with HCL systems compared with other types of subcutaneous intensive insulin therapy (low to very low certainty, Supplementary Appendix S29, S30, S31, and S32). However, these comparisons are likely underpowered due to the low event rates and the short duration of the included trials. The other severe adverse events are detailed in Supplementary Appendix S33: due to the exiguous number of events detected throughout all 32 included studies, any comparison was unfeasible. In total, only eight prespecified events of interest were reported, seven of which occurred in the control groups and one in the HCL group. In most studies, these severe adverse events were deemed unrelated to treatment; however, in one trial, 25 the authors highlighted a cardiac arrest occurring in the control group with a concomitant blood glucose level of 400 mg/dL.
Patient-reported outcome measures
PROMs were available for 21 out of the 32 included studies, either in the primary reports or in ancillary publications. In general, HCL systems demonstrated comparable or superior results with the comparators, except for the trial by Abraham et al., in which the MiniMed 670G group reported lower scores on the Diabetes Treatment Satisfaction Questionnaire (status version) compared with the control group (Supplementary Appendix S34).
Sensitivity analyses
Sensitivity analyses limited to trials with low RoB or excluding those with imputed SD largely confirmed the findings of the main analysis relative to SIT, with minor changes in the ranking of HCL systems observed in some instances (Supplementary Appendix S13, S14, S15, S16, S17, S18, S19, S20, S21, S22, S23, S24, S25, S26, S27, S28, S29, S30, S31, and S32). Unlike the main analysis, sensitivity analyses of trials with low RoB and a mean participant age ≥ 18 years indicated that CamAPS Fx and Control IQ were also among the systems more effective than SIT in improving HbA1c. Furthermore, Omnipod 5 demonstrated superior efficacy in reducing HbA1c compared with MiniMed 670G, Control IQ, and DBLG1. (Supplementary Appendix S28.2). Regarding TIR, sensitivity analyses including trials with baseline HbA1c < 7% or > 8.5% (Supplementary Appendix S13.4 and S14.4 for populations aged < 18 years and ≥ 18 years, respectively) showed slight differences in treatment ranking compared with the main analysis, although there was significant effect modification by baseline HbA1c.
Discussion
The results of this NMA indicate that commercially available HCL systems exhibit varying levels of efficacy in improving specific glycemic outcomes in RCTs involving individuals with type 1 diabetes and baseline HbA1c between 7% and 8.5%. This finding aligns with our previous NMA 3 and extends the observation by including two additional HCL systems (i.e., iLet BP and Omnipod 5).
In the NMA of RCTs involving participants with a mean age ≥ 18 years, MiniMed 780G and Omnipod 5 consistently ranked among the systems showing the greatest improvements in hyperglycemia-related measures compared with SIT, while Control IQ and DBLG1 stood out for their impact on hypoglycemia-related outcomes. In contrast, in the NMA of RCTs involving participants < 18 years of age, Control IQ and MiniMed 780G were associated with improvements in hyperglycemia, whereas DBLG1 and MiniMed 670G showed the most favorable changes in hypoglycemia measures, although the MDs were not statistically significant compared with SIT.
Since MDs in the individual studies included in the NMA may be influenced by the performance of comparator treatments as well as the interventions themselves, we complemented our review with an MA of end-of-study glycemic outcomes.
Although this approach is primarily descriptive and not intended for causal inference, we believe it better highlights the “absolute” effect of each HCL system and its potential to achieve recommended glycemic targets, independent of the performance of the comparator in the specific trial. 26 In the case of the current analysis, although both MiniMed 780G and Omnipod 5 improved TIR by approximately 20% compared with SIT in RCTs involving participants with a mean age ≥ 18 years, studies specifically evaluating these systems reported mean end-of-study TIR values of 75.3% for MiniMed 780G and 63.1% for Omnipod 5, possibly indicating greater efficacy of the former over the latter. Moreover, in the same age group, while HCL systems showed a hierarchy in their impact on TBR compared with SIT, the included studies reported end-of-study values below the recommended 4% threshold for all systems. Notably, these observations are based on pooled end-of-study means, whereas individual-level attainment may differ substantially. In studies involving participants < 18 years of age, Control IQ was associated with the greatest improvement in TIR over SIT, ahead of MiniMed 780G and CamAPS Fx. This ranking was also reflected in the MA of end-of-study values, although the achieved mean TIRs were very similar and remained below 70% for all three systems. While in the NMA TBR was not statistically different from SIT across all HCL systems, all systems except CamAPS Fx (8.2%) and MiniMed 780G (4.6%) yielded end-of-study values below 4%. These findings, however, should be interpreted with caution, as the elevated TBR observed with CamAPS Fx may reflect an unusually high baseline level and, in one study, an overestimation of hypoglycemic exposure with the retrospective CGM device (FreeStyle Libre Pro) used to capture glucose metrics, as the authors reported discrepancies between its readings and those provided by the CGM device integrated into the HCL system under evaluation.26,27 In the case of MiniMed 780G, the estimate derives from a single study, limiting its generalizability. 28
Severe adverse events, including SH and DKA, were infrequent across all treatments. Although safety comparisons were formally underpowered, the consistently low event rates observed with HCL systems across studies are nonetheless reassuring and support the overall favorable safety profile of this technology, at least in the short term.
This study has several strengths. Indeed, it represents the most comprehensive analysis of RCTs to date, applying both pairwise MAs and NMAs. It should be noted that, except for one trial directly comparing MiniMed 670G and 780G, all head-to-head comparisons between different HCL systems were based on indirect evidence. This lack of direct evidence underlines the importance of a network meta-analytic approach, which allowed us to generate comparative estimates that would otherwise not be available. Besides including RCTs within a relatively narrow baseline HbA1c range, the rigor of our approach and the reliability of our results are ensured by the careful assessment of potential effect modifiers under the transitivity assumption, reinforced by the network meta-regression analyses showing no significant impact of baseline HbA1c, age, diabetes duration, and intervention duration on MD in TIR. Importantly, the certainty of evidence was generally high to moderate for comparisons involving participants with a mean age ≥ 18 years. Finally, sensitivity analyses restricted to trials at low RoB or excluding studies with imputed SDs largely confirmed our main findings, thereby supporting the robustness of our conclusions.
However, some limitations need to be acknowledged. First, the included studies employed different CGM systems, and earlier trials relied on older-generation sensors that were likely less accurate; therefore, comparisons of CGM-derived outcomes should be interpreted with caution, particularly in the MA. 29 To mitigate this limitation, we included HbA1c as a complementary outcome, providing an additional and standardized measure of glycemic control. Notably, in the NMA, the ranking of treatments for HbA1c followed a consistent pattern that closely mirrored that observed for TIR (Supplementary Appendix S14 and S18 for studies with mean age ≥ 18 years). Second, given the inclusion of studies with mixed comparator groups or where type of CGM was not specified, outcomes from MDI and CSII users, as well as from real-time and intermittently scanned CGM users, were pooled within the SIT and SIT-CGM groups. While we recognize that these treatment modalities may yield different results, this strategy has been consistently adopted in previous MAs.30–33 Third, despite our stratified approach, heterogeneity remained substantial for some outcomes, particularly in pediatric populations. In fact, the certainty of evidence was lower for comparisons in participants with a mean age < 18 years compared with their older counterparts, mostly due to the limited number of included RCTs and heterogeneity in their results. Fourth, PROMs were inconsistently reported across studies, limiting the possibility of a comprehensive comparative evaluation of treatment satisfaction and quality of life. A more uniform approach to selecting the PROM instruments would be desirable in future HCL trials. Fifth, the applicability of our findings to specific populations such as pregnant women, hospitalized patients, or individuals with end-stage renal disease, liver failure, or highly unstable diabetes is uncertain, as these groups were excluded from our eligibility criteria.
Moreover, studies involving people with type 2 diabetes or individuals with particularly low or high HbA1c levels were excluded at a later stage of our review to maintain the transitivity assumption and ensure adequate comparability across trials. Although these restrictions limit the generalizability of our results to these populations, they should not discourage the initiation of HCL therapy in such groups, as they may still derive substantial benefits from it.34,35 Finally, as with any NMA, our estimates reflect relative treatment effects within trial settings and may not fully capture the complexity of routine clinical practice.
Selecting an HCL system requires consideration of multiple factors, including pump and CGM features, algorithm specifications, regulatory indications, and clinical evidence from both RCTs and real-world studies.30,36 Within this framework, we believe that our analysis may offer additional insights to support personalized decision-making, informing the selection of one specific system over others based on the planned glycemic goals.
Conclusion
In RCTs involving individuals with type 1 diabetes, commercially available HCL systems demonstrate a hierarchy of efficacy compared with SIT, as well as differences in hyperglycemia and hypoglycemia metrics, which also appear to be influenced by the mean age of participants.
Authors’ Contributions
S.D.M.: Conceptualization, methodology, investigation, data curation, and writing—original draft; L.D.G.: Conceptualization, methodology, investigation, data curation, formal analysis, and writing—original draft; I.C.: Investigation and writing—original draft; M.C.: Investigation and writing—original draft; P.T.: Validation and writing—review and editing; A.N.: Writing—review and editing; S.P.: Writing—review and editing; L.L.: Writing—review and editing; F.G.: Conceptualization, funding acquisition, supervision, and writing—review and editing.
Ethical Considerations
This article is based on previously conducted studies and does not contain any new studies with human participants or animals performed by any of the authors.
Data Availability
All data relevant to the study are included in the article or uploaded as supplementary Data. Statistical code and data set are available on reasonable request from Prof. F. Giorgino (e-mail,
Footnotes
Author Disclosure Statement
S.D.M.: Ascensia Diabetes Care, MOVI SpA, Roche Diabetes Care, and Theras Lifetech Srl (honoraria); Ascensia Diabetes Care, MOVI SpA, Menarini Diagnostics, Roche Diabetes Care, Sanofi Aventis, and Theras Lifetech Srl (participation on Advisory Boards). L.D.G.: Eli Lilly, Roche Diabetes Care, MOVI SpA, Sanofi, Theras (honoraria); Abbott, Eli Lilly, Novo Nordisk, and Sanofi (support for attending meetings or travels); Eli Lilly (participation on Advisory Boards). I.C.: Eli Lilly, Novo Nordisk, Guidotti SpA, AstraZeneca (honoraria); Eli Lilly, Novo Nordisk, Abbott (support for attending meetings or travels). M.C.: Eli Lilly, Novo Nordisk, Sanofi (support for attending meetings or travels). P.T.: nothing to disclose. A.N.: AstraZeneca, Novo Nordisk, and Sanofi Aventis (honoraria). S.P.: AstraZeneca, Eli Lilly, Novo Nordisk, Sanofi Aventis (honoraria). L.L.: Abbott, AstraZeneca, Boehringer-Ingelheim, Eli Lilly, Merck Sharp & Dohme, Medtronic, Menarini, MOVI SpA, Mundipharma, Novo Nordisk, Roche Diabetes Care, Sanofi Aventis, and Terumo (honoraria); Abbott, AstraZeneca, Boeringher-Ingelheim, Eli Lilly Italia, Medtronic, MOVI SpA, Novo Nordisk, Roche Diabetes Care, Sanofi Aventis, and Terumo (participation on Advisory Boards). F.G.: Eli Lilly, Roche Diabetes Care (grants); Eli Lilly, Novo Nordisk (consulting fees); AstraZeneca, Boehringer-Ingelheim, Eli Lilly, Lifescan, Merck Sharp & Dohme, Medtronic, Novo Nordisk, Roche Diabetes Care, Sanofi Aventis (support for attending meetings or travels); AstraZeneca, Boehringer-Ingelheim, Eli Lilly, Lifescan, Merck Sharp & Dohme, Medimmune, Medtronic, Novo Nordisk, Roche Diabetes Care, Sanofi Aventis (participation on Advisory Boards); EASD/EFSD, Fo.Ri.SIE (unpaid leadership); AstraZeneca, Eli Lilly, Novo Nordisk, Sanofi Aventis (support for medical writing and statistical analysis).
Funding Information
The authors received funding for this research from