
Abstract
Background:
Pancreatic diabetes (T3cDM) is a unique form of diabetes in the young characterized by dysfunction and marked loss of beta cells and alpha cells, as well as pancreatic exocrine insufficiency and poor incretin response. While most cases of T3cDM are insulin dependent, they are prone to hyperglycemic and hypoglycemic excursions and high glycemic variability (GV). There is a scarcity of data on continuous glucose monitoring (CGM) in T3cDM.
Objectives:
To compare glycemic patterns and variability in T3cDM and type 1 diabetes mellitus (T1DM) and assess the role of pancreatic enzyme replacement therapy (PERT) on GV.
Methods:
A total of 70 patients with DM on insulin (T3cDM = 35, T1DM = 35) underwent flash CGM for 14 days. CGM metrics were compared between T1DM and T3cDM and among T1DM, T3cDM receiving PERT, and T3cDM not receiving PERT.
Results:
T3cDM patients had significantly lower eA1c% (7.93 vs 10.08), higher TIR (40.69 vs 27.5), lower CV (37.07 vs 43.58), and lower TAR (47.57 vs 61.44) than T1DM (P < 0.05 for all). There were no differences in hypoglycemia indices like TBR between the groups. Compared to T1DM, higher TIR (46.55 vs 27.5) and lower CV (33.53 vs 43.58) were noticed in the T3cDM-PERT group but not in the T3cDM-no PERT group. However, postmeal hypoglycemia was also more common in T3cDM-PERT (35% vs 20% vs 6.3% for T3cDM-PERT, T3cDM-no PERT, and T1DM, respectively, P = 0.03).
Conclusion:
Patients with T3cDM on insulin have lower GV and hyperglycemia than T1DM, but similar hypoglycemia risk. PERT improves TIR and lowers postmeal hyperglycemic excursions but might increase postmeal hypoglycemia. However, the current study was underpowered to evaluate the role of PERT, necessitating larger studies in this field.
Introduction
Continuous glucose monitoring (CGM), which provides real-time insights into glycemic variability (GV) and glucose patterns across the day, has become an important tool in the management of DM, especially for patients on insulin and/or with wide fluctuations in glucose levels, as is seen in insulin-deficient states like type 1 diabetes or those with diabetes of pancreatic origin.1,2 While type 1 diabetes mellitus (T1DM) and pancreatic diabetes mellitus (DM), also known as type 3c DM (T3cDM), both require insulin therapy, their distinct etiologies pose unique challenges in glycemic management. T1DM results from autoimmune destruction of pancreatic beta cells, whereas pancreatic DM may arise from multiple diseases affecting the pancreas, including acute or chronic inflammatory diseases, surgical or nonsurgical trauma, and genetic etiologies, leading to both endocrine and exocrine dysfunction. 3 People with pancreatic DM have impaired counter-regulatory responses due to concurrent α-cell dysfunction, leading to an increased risk of severe hypoglycemia. Moreover, exocrine pancreatic insufficiency (EPI) in these patients can increase glycemic fluctuations by multiple mechanisms, including malabsorption of nutrients, altered incretin levels, reduced oxyntomodulin accompanied by reduced cholecystokinin and VIP, intraislet inflammation with exocrine–endocrine crosstalk alteration, and poor appetite due to steatorrhea and abdominal pain.4–6 Thus, correction of EPI using pancreatic enzyme replacement therapy (PERT) is expected to improve GV by correcting these dysfunctions, mainly through improvement in nutrient absorption and incretin levels. Prior studies using PERT have shown improvement in glycemic status and fluctuations in pancreatic DM, although its role in T1 or T2DM with EPI is not clear.7–12
CGM has emerged as a valuable tool in understanding glycemic patterns and variability in different forms of diabetes. GV, a measure of fluctuations in blood glucose levels, is increasingly recognized as a critical factor in diabetes management due to its association with oxidative stress, microvascular and macrovascular complications, and hypoglycemia risk.4,13,14 CGM metrics such as the coefficient of variation (% CV), mean amplitude of glycemic excursion (MAGE), continuous overall net glycemic action (CONGA), and mean of daily differences provide a more nuanced understanding of glucose fluctuations than traditional HbA1c measurements. 15 While there have been several studies on CGM in T1DM, there have been very few studies on CGM in T3cDM with contradicting results.4,15,16 Shivaprasad et al. reported higher CGM measures of GV and of hyperglycemia in T3cDM compared to T2DM, although hypoglycemia indices were not different. On the other hand, Lee et al., in their comparative study of T3cDM, T1DM, and T2DM, found the lowest GV in the T3cDM group.4,15
PERT is a cornerstone in the management of exocrine pancreatic insufficiency (EPI) in pancreatic DM. Beyond its role in improving nutrient absorption, recent evidence suggests that PERT may also influence glycemic control by modulating postprandial glucose excursions. While it has been shown to lower postprandial blood glucose and GV in T3cDM due to cystic fibrosis and FCPD, its precise impact on glucose metabolism remains an area of active research.7–9,15 Notably, up to 39% of individuals with T1DM could also exhibit lowered pancreatic elastase levels, a marker of EPI, which may contribute to glycemic instability.17,18
We hypothesized that though both T3cDM and T1DM are insulin-deficient states, T3cDM might have a greater risk of glycemic fluctuations than T1DM due to other associated factors like alteration of glucagon, incretins, components of insulin resistance, and malabsorption, but the GV might be reduced if EPI is corrected by PERT. This study aims to compare CGM-derived glycemic metrics between insulin-requiring T3cDM and T1DM, with a focus on assessing GV, hypoglycemia risk, and the potential impact of PERT. Additionally, we seek to elucidate the differential glycemic patterns across the day between T3cDM and T1DM. A deeper understanding of these factors may lead to a more personalized therapeutic approach, ultimately improving metabolic outcomes for individuals with insulin-requiring diabetes.
Methodology
Subjects and methods
A cross-sectional study was conducted among patients with DM requiring multiple daily insulins, presenting to the endocrinology clinic of three hospitals in Eastern India over a period of 3 years (March 2021–March 2024) who had either T3cDM or T1DM receiving a stable dose of insulin for at least 6 weeks prior to the study. We excluded patients with acute pancreatitis, pancreatic cancer, and cystic fibrosis-related diabetes, given that these patients will have multiple extra-pancreatic factors, which might contribute to raised GV, like stress, nutrient absorption from the gut, nutritional status, cachectic and pro-inflammatory states, and multiple medications.19,20 We also excluded patients with T2DM, monogenic DM, DM secondary to endocrinopathies or drug-induced DM, advanced-stage chronic kidney disease (G4, G5, or A3 albuminuria), decompensated chronic liver disease, ongoing glucocorticoid use, malignancies, pregnant or lactating women, and patients aged below 10 or above 60 years. For exclusion, a diagnosis of CFRD was made in patients with a preexisting diagnosis of cystic fibrosis as per their prior multidisciplinary medical records or the criteria laid down by Rosenstein et al. 21 Since genetic testing could not be done for all, the diagnosis of monogenic diabetes was made following standard guidelines in the presence of one or more of the following features HbA1c < 7.5% at diagnosis, history of diabetes in one parent, presence of features suggesting a specific monogenic cause like renal cysts, lipodystrophy, history of maternally inherited deafness or markers of severe insulin resistance, and a calculated monogenic diabetes prediction model probability of >5%. 3 Similarly, a diagnosis of type 2 diabetes was made either by exclusion of other forms or in subjects with body mass index (BMI) ≥23 kg/m2 without features of weight loss or ketoacidosis and with less marked hyperglycemia and/or in the presence of family history and prolonged duration and milder severity of symptoms prior to presentation, features of the metabolic syndrome, and absence of a family history of autoimmunity.
The participants underwent flash CGM monitoring using Abbott FreeStyle Libre Pro v.2 for a total duration of 14 days. During this period, they also monitored their capillary blood glucose (CBG) using a glucose meter (Accu-Chek Insta) before and 2 h after every meal and at 3 am and maintained a 7-point self-monitored blood glucose chart for the first 7 days. In the second week, they monitored CBG at different times of the day on alternate days and whenever they experienced hypoglycemic symptoms. Their insulin dose was not altered during this period except when they experienced symptomatic hypoglycemia documented by the glucose meter. In such cases, the immediately subsequent insulin dose was not administered, while the dose of insulin preceding the time of hypoglycemia was reduced by 2 units from the next day. We excluded participants with incomplete ambulatory glucose profile (AGP) data, defined as the availability of AGP readings for a duration <70% of the total time the sensor was worn. The authors obtained ethical clearance for the current project from the institutional ethical committees (reference no. HWH/IEC-BMHR/008/2022 and NRSMC/IEC/87/2021).
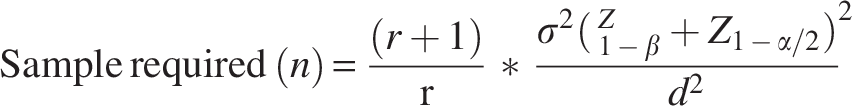
Sample size calculation
Sample size was calculated using the following formula for case–control size, where the data are on an interval/ratio (quantitative) scale.
22
Study definitions
T1DM was diagnosed when patients with diabetes had a history of diabetic ketoacidosis and/or tested positive for one or more islet cell autoantibodies and/or had C-peptide levels <200 pmol/L (1.8 ng/mL). 3 In all suspected cases of T1DM, pancreatic autoantibodies were tested sequentially, with glutamic acid decarboxylase (GAD) being the primary antibody measured in all subjects. If it was found to be negative, islet tyrosine phosphatase 2 (IA-2) antibodies were measured. Zinc transporter 8 (ZnT8) was measured in selected cases only if both the above were negative. GAD-65Ab was measured in serum using chemiluminescence (CLIA) with a cutoff of <10 IU/mL. Anti-IA-2 Ab was measured using CLIA with a cutoff of <10 U/mL. ZnT8 Ab was measured using enzyme immunoassay (EIA) using a cutoff of <15 U/mL.
T3cDM group was diagnosed in participants with diabetes who had a pancreatic condition before or up to 30 days since the diagnosis of their diabetes. 23 Patients with T3cDM were interviewed and evaluated clinically and biochemically for identifiable etiologies like chronic alcohol intake, presence of gall bladder or biliary tract stones, hypercalcemia, pancreatic resection, hypertriglyceridemia, and congenital anomalies of the pancreas.24,25 Chronic pancreatitis as the etiology for T3cDM was diagnosed in those with radiological (USG or CT abdomen) evidence of pancreatic atrophy or fibrosis with/without pancreatic intraductal calculi and/or parenchymal calcifications/or strictures and dilatations of the main pancreatic duct. Among patients with chronic pancreatitis, FCPD was diagnosed in patients with pancreatic fibrosis and intraductal calculi in the absence of any other identifiable etiology.26,27
FCPD was diagnosed using the criteria by Mohan et al. (1998) as diabetes occurring in a tropical country with evidence of chronic pancreatic disease in the form of pancreatic calculi seen on imaging or any three of—abnormal pancreatic morphology with ductal dilatation detected on imaging (sonography, CT scan, or ERCP), abnormal exocrine pancreatic function tests, history of chronic recurrent pain since childhood, or steatorrhea. However, we could not do pancreatic exocrine function tests for the majority of our patients and relied on the presence of the other criteria.
A patient-reported outcome questionnaire (PEI-Q) was used to assess PEI in the patients. It consists of 18 items across three domains related to abdominal symptoms, bowel movements, and impact on daily life and required the participants to recall PEI-related symptoms in the past 7 days. 28 Using a 5-point Likert scale for each item, the total symptom score for each domain was divided by the number of questions to get a domain-specific score, and the three domain-specific scores were averaged to get a mean PEI-Q score. Based on prior evidence and also as per the available version of the questionnaire leaflet, a score greater than or equal to 0.60 was considered to be consistent with a diagnosis of PEI in the absence of any other known gastrointestinal condition.28–30 Requirement of PERT in a patient was decided by the treating gastroenterologist based on the severity of symptoms of pancreatic exocrine insufficiency, and since existing guidelines recommend PERT for all patients with T3cDM having PEI, PERT was recommended for all patients having a score of >0.6 in the PEI-Q questionnaire.28,31 Following standard recommendations, the prescribed dose was 50,000 units of lipase with the large meals and 25,000 units with every snack in the day using pancreatin mini-microsphere gelatin capsules supplied by Abbott Laboratories, Germany. 31 However, although all except two patients with T3cDM had a PEI-Q score of >0.6 and were advised to take PERT, many of the patients did not initiate or discontinued taking PERT due to high cost or multiple daily doses. Thus, the T3cDM cohort was divided into two subgroups: users (T3cDM-PERT) and nonusers of PERT (T3cDM—no PERT). Participants who took pancreatic PERT thrice daily with every meal on a regular basis for at least 2 weeks prior to the initiation of AGP and during the 14 days of AGP were considered as users of PERT, whereas nonusers were those not having taken PERT at all or discontinued for at least 2 weeks prior to AGP. Those taking PERT irregularly or less than three times a day were excluded from the study.
Serum C-peptide was measured twice during the study. For diagnosis of type of DM, a random nonfasting sample was measured within 5 h of a meal with a cutoff of <200 pg/mL used for diagnosing T1DM.32,33 However, another sample of C-peptide was also measured at 90 min after a mixed meal following appropriate assay and analytic precautions, and the values of this stimulated C-peptide were used for statistical comparisons. 34 For this purpose, a standardized mixed meal comprising 30% of total daily calorie intake (with 50% carbohydrates, 33% fat, and 14% protein intake) was given to the participants. 34 The meal protocol or formulation followed by different studies for stimulated glucagon testing varies, and recent studies have shown that a random nonfasting C-peptide performs as well as glucagon or mixed-meal stimulated C-peptide for the detection of beta cell reserve. 32 To ensure uniformity between the centers, for the current study, all the participating institutes followed the common standardized meal prior to C-peptide testing, comprising white bread, butter, and boiled egg whites, the amount of each depending on the calorie intake of the individual. Blood sample for stimulated C-peptide was drawn after 120 min of the standardized meal at all centers and immediately centrifuged before storage.34,35 The MMCT testing was only conducted if the morning fasting blood glucose (BG) was between 70 and 130 mg/dL, and following protocols used in prior studies, the test was planned when the subjects had their morning BG between 70 and 200 mg/dL for at least 3 days.3,34 The usual dose of long-acting or premixed insulin on the night prior to the test was continued. None of our patients were using long-acting insulin in the morning; therefore, there was no need to discontinue the morning dose of insulin. Rapid-acting insulin injections were continued till 2 h before the test, and short-acting and premixed insulin till 6 h before the test.
Assays
HbA1c% measurement was done using HPLC via Bio-Rad D10 analyzer (Bio-Rad, India, CV: 2.8%) and expressed as HbA1c%. AGP was done using a factory-calibrated flash glucose monitoring device—Abbott FreeStyle Libre Pro1 FGMS sensor (FreeStyle Libre, Abbott, UK), which was securely affixed to the nondominant arms of participants for 14 days. All participants were provided with the same CGM device and scanner and received the same education.
The sensor assesses interstitial fluid glucose every 15 min and stores the data for up to 14 days, following which the glucose data are downloaded. Time-in-range (TIR) for the flash CGM was defined as the percentage of time in a day when the BG was between 70 and 180 mg/dL. Time-above-range (TAR) was calculated as time in a day when the BG was above 180 mg/dL (including glucose readings >250 mg/dL) and time-below-range (TBR) for BG below 70 mg/dL (including BG readings <54 mg/dL). 36 The flash CGM also gave values for mean glucose (mg/dL) and estimated HbA1c% (eHbA1c). The Abbott Freestyle Libre also gave an AGP graph of the median BG value of the 14 days for every 2-h intervals throughout a day in relation to different meals of the day. These values were used to identify pre- and postmeal hyperglycemic (median BG > 180 mg/dL) or hypoglycemic excursions (median BG <70 mg/dL) as well as late afternoon and nocturnal hypoglycemia. The AGP report also identified periods of high variability below the median (VBM), which makes it difficult to achieve the median BG in these periods without increasing the risk for hypoglycemia. The flash CGM-derived BG values were fed into the EasyGV Version 9.0 calculator to derive additional parameters of GV, which included MAGE, continuous overall net glycemic excursion (CONGA), SD, % coefficient of variance (CV), additional hyperglycemia indices like high blood glucose index (HBGI) and glycemic risk assessment diabetes equation of hyperglycemia (GRADE-Hyper) and additional indices of hypoglycemia, including low blood glucose index (LBGI) and glycemic risk assessment diabetes equation of hypoglycemia (GRADE-Hypo).37–39 The proportion of participants who achieved the recommended targets of TIR of >70%, TAR <25%, TBR <5%, and CV <36% was also calculated. 36
Statistical analysis
Relevant Statistical analyses were conducted using GraphPad v.7e for Mac. The quantitative parameters were expressed as mean ± SD for normally distributed and median [IQR] for non-normally distributed quantitative parameters, and qualitative parameters as number or n(%). Comparison between two groups was conducted using Student’s t-test or Mann–Whitney U-test for quantitative, and chi-square test for qualitative parameters with Fisher’s correction where appropriate. Pearson’s correlation coefficient was calculated for correlations. P value <0.05 was considered significant.
Post hoc and subgroup analysis
Comparison among the three groups—T1DM, T3cDM-PERT, and T3cDM-non-PERT was done using ANOVA with post hoc’s Tukey analysis. Since this was a subgroup comparison, a P value of <0.025 was considered significant for these tests.
Results
Demographic characteristics of the participants
Out of 247 patients with DM receiving insulin, after applying exclusion criteria, a total of 70 consecutive participants with T1DM or T3cDM were finally recruited for the study, but three AGP reports could not be analyzed due to incomplete data (Fig. 1). Thus, of the 67 participants included in the final analysis, 32 had T1DM while 35 had T3cDM. The mean age of the cohort was 32.8 years, and the mean duration of DM was 9.26 (7.22) years. While all the T1DM patients were receiving multiple daily subcutaneous insulin in a basal-bolus regimen, 18 (51.4%) of the participants with T3cDM were receiving premixed insulin in multiple daily doses. Out of the 35 participants with T3cDM, a total of 20 (57.1%) were receiving PERT (Table 1).
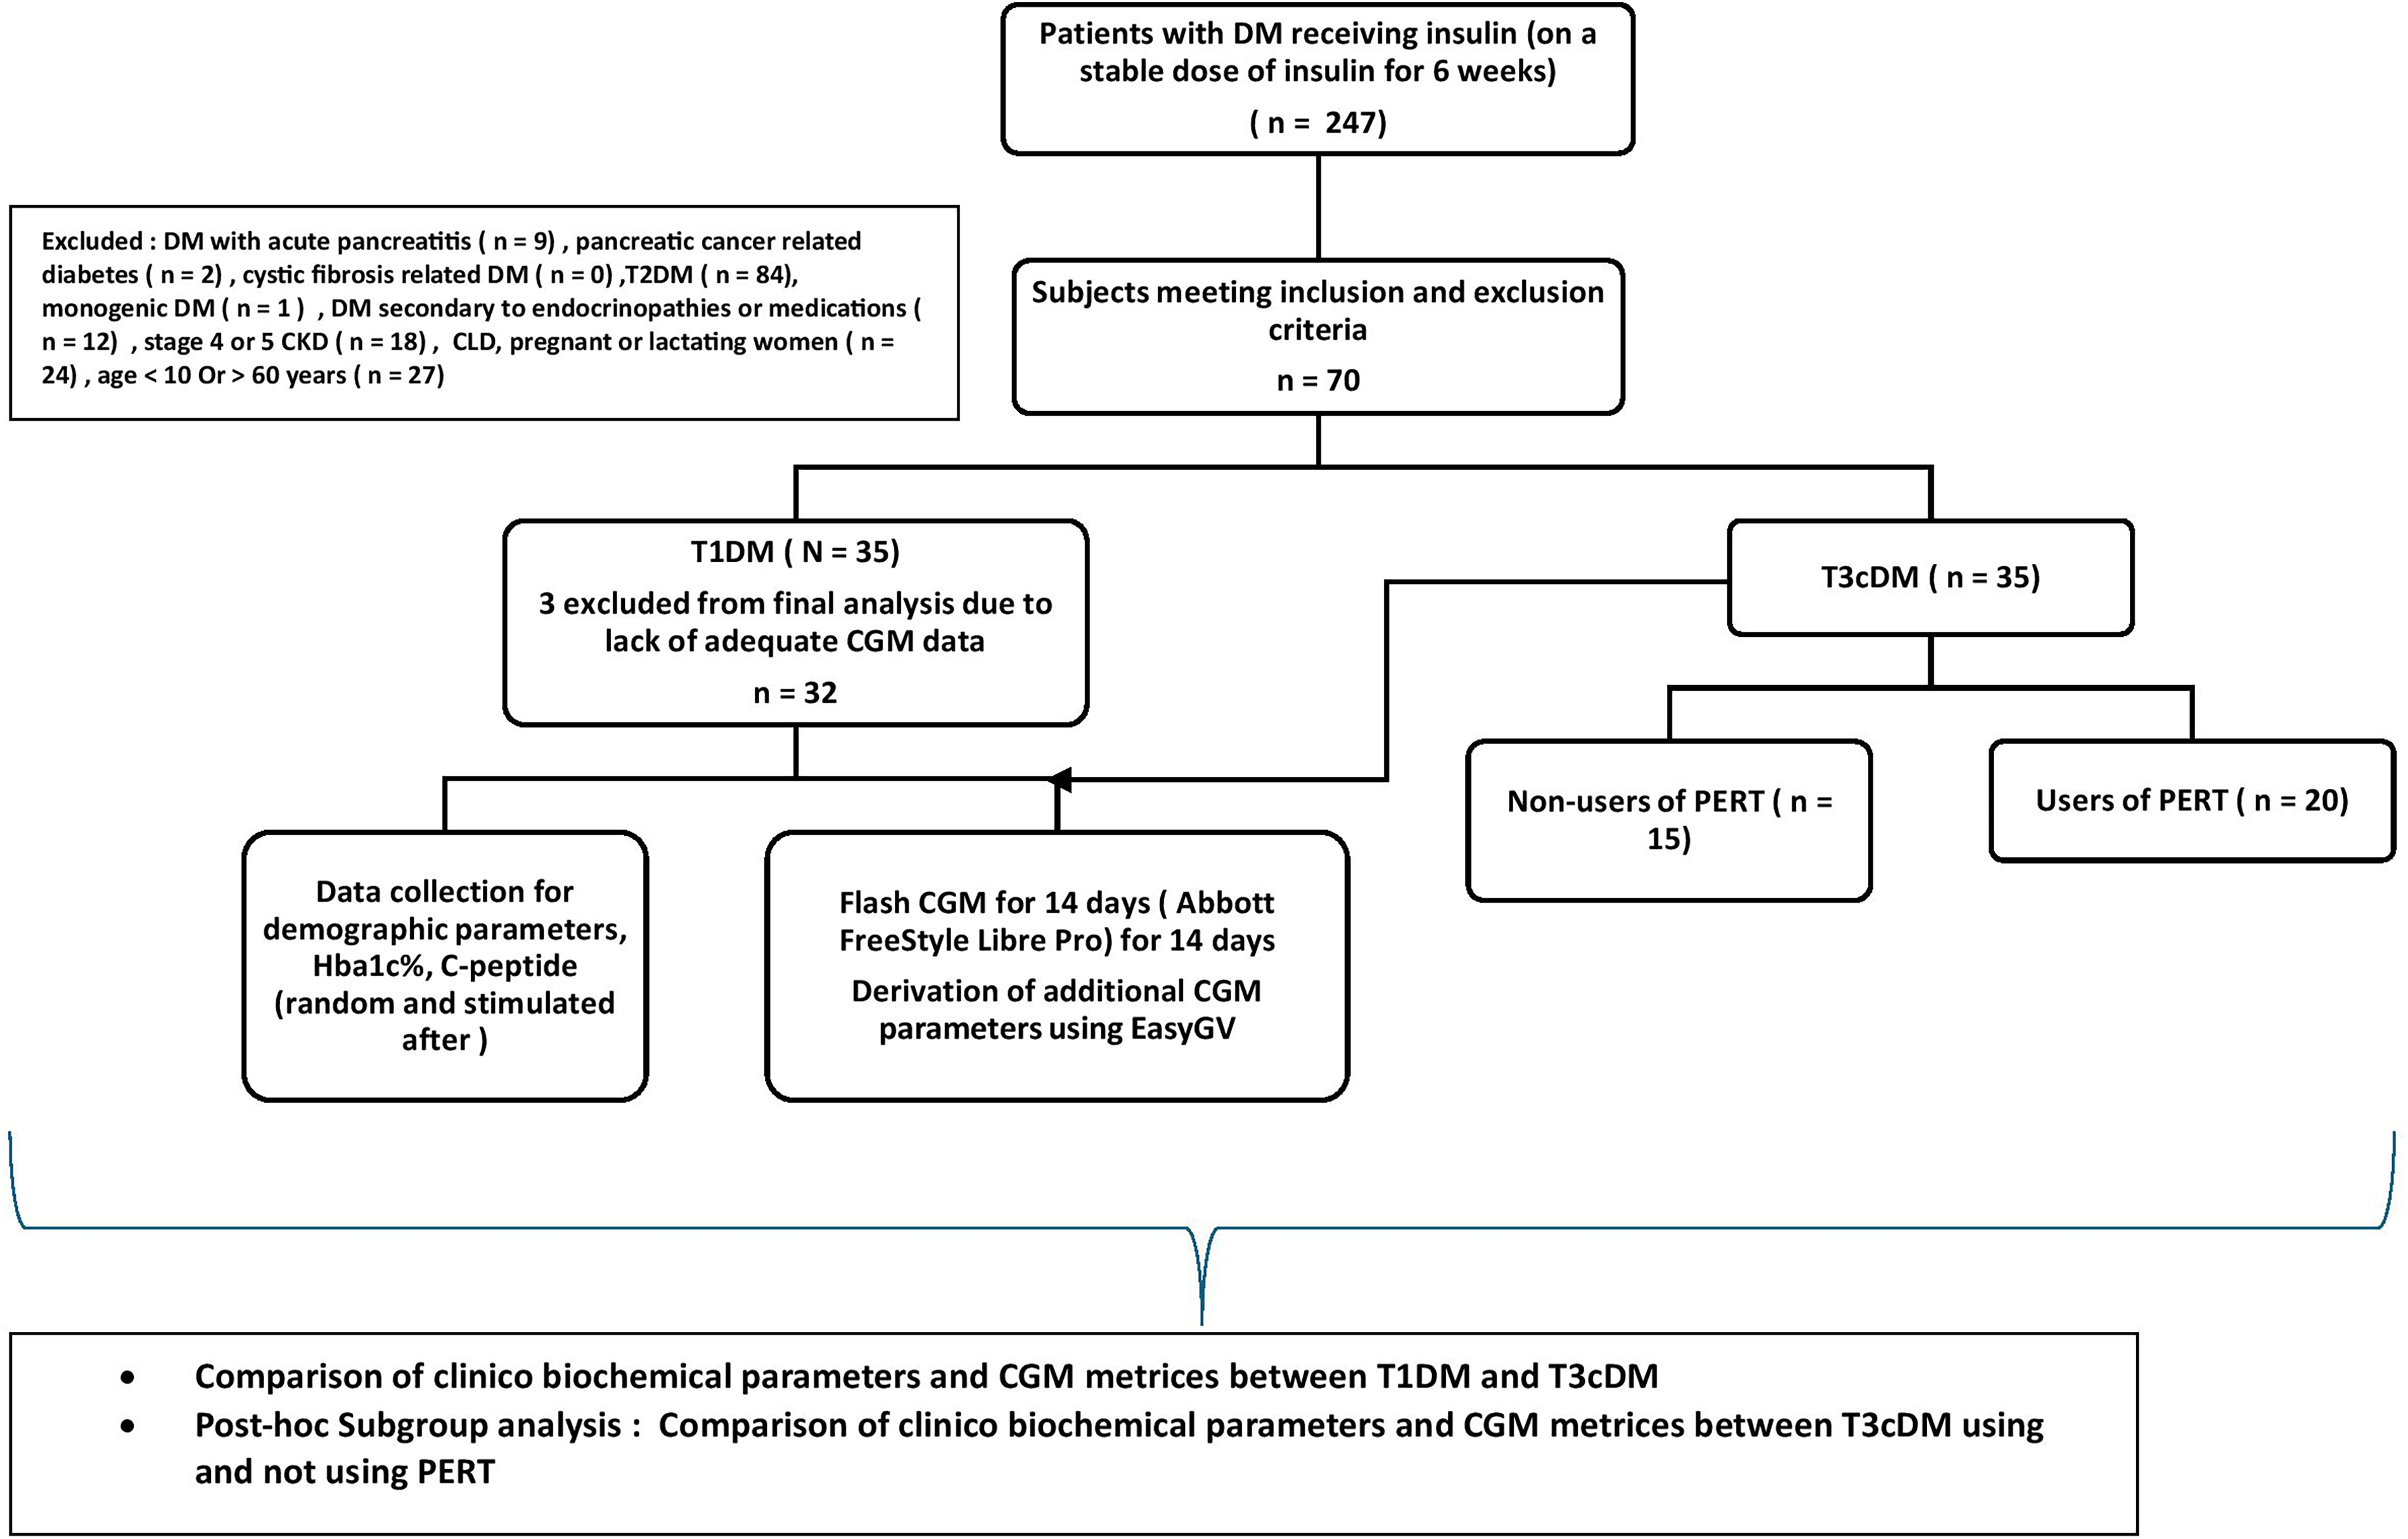
Study design.

Scatterplot with bar diagrams showing comparison of TIR (2a), TBR (2b), and CV (2c) between the three groups. CV, % coefficient of variance; DM, diabetes mellitus; T3cDM, pancreatic DM; PERT, pancreatic enzyme replacement therapy; T1DM, type 1 DM; TAR, time-above-range (% time in a day spent with blood glucose above 180 mg/dL); TBR, time-below-range (% time in a day spent with blood glucose below 70 mg/dL); TIR, time-in-range (% time in a day spent with blood glucose between 70 and 180 mg/dL).
Demographic Characteristics and Continuous Glucose Monitoring Parameters of the Study Population
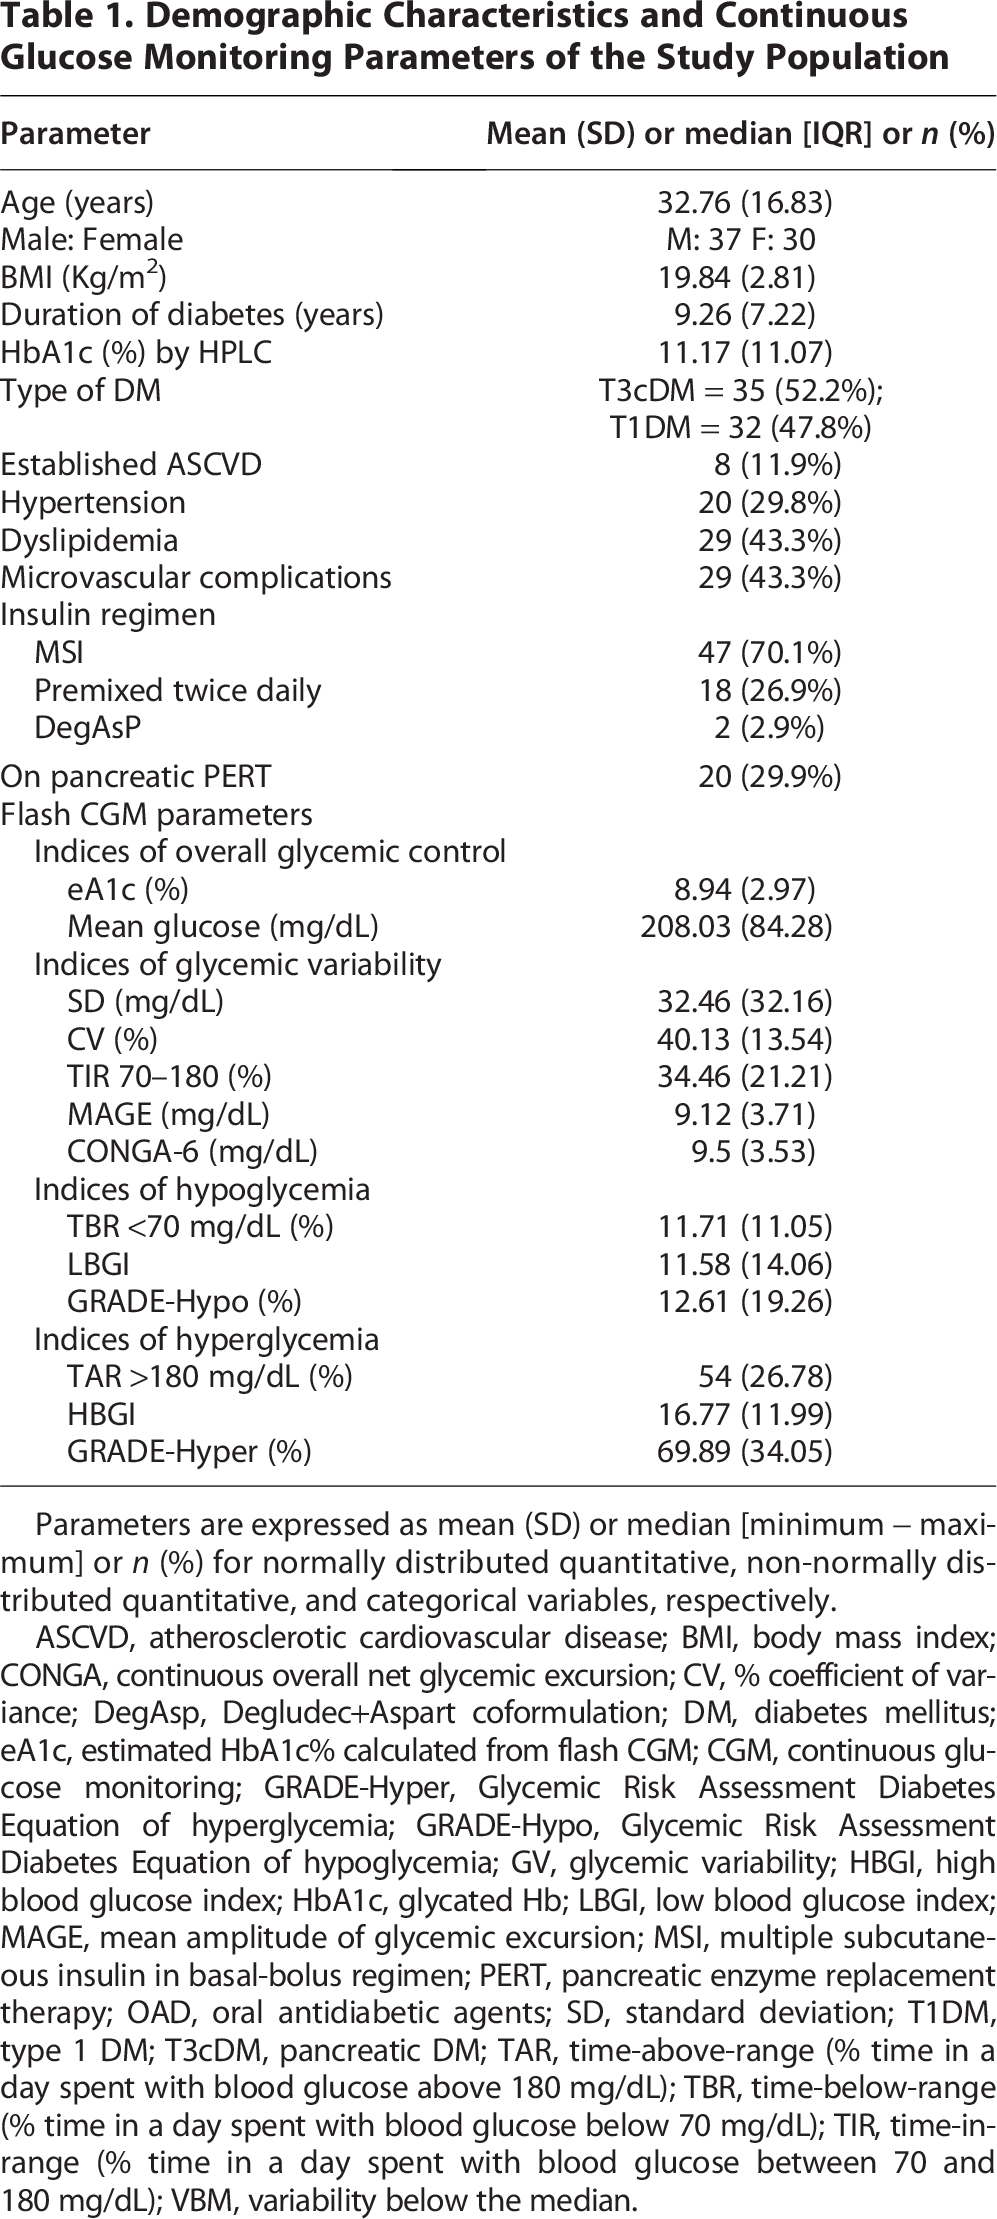
Parameters are expressed as mean (SD) or median [minimum − maximum] or n (%) for normally distributed quantitative, non-normally distributed quantitative, and categorical variables, respectively.
ASCVD, atherosclerotic cardiovascular disease; BMI, body mass index; CONGA, continuous overall net glycemic excursion; CV, % coefficient of variance; DegAsp, Degludec+Aspart coformulation; DM, diabetes mellitus; eA1c, estimated HbA1c% calculated from flash CGM; CGM, continuous glucose monitoring; GRADE-Hyper, Glycemic Risk Assessment Diabetes Equation of hyperglycemia; GRADE-Hypo, Glycemic Risk Assessment Diabetes Equation of hypoglycemia; GV, glycemic variability; HBGI, high blood glucose index; HbA1c, glycated Hb; LBGI, low blood glucose index; MAGE, mean amplitude of glycemic excursion; MSI, multiple subcutaneous insulin in basal-bolus regimen; PERT, pancreatic enzyme replacement therapy; OAD, oral antidiabetic agents; SD, standard deviation; T1DM, type 1 DM; T3cDM, pancreatic DM; TAR, time-above-range (% time in a day spent with blood glucose above 180 mg/dL); TBR, time-below-range (% time in a day spent with blood glucose below 70 mg/dL); TIR, time-in-range (% time in a day spent with blood glucose between 70 and 180 mg/dL); VBM, variability below the median.
Among those with T3cDM, n = 14 (40%) had FCPD, n = 15 had alcoholic chronic pancreatitis, two had past h/o pancreatic surgery, and four had idiopathic chronic pancreatitis. Among those with T1DM, n = 12 (37.5%) tested positive for anti-GAD 65 Ab, and n = 10 (31.3%) tested positive for anti-IA-2 Ab, whereas 4 (12.5%) patients tested positive for both.
While the mean lab HbA1c% was 11.17 (11.07), the mean eA1c calculated from the AGP was 8.94 (2.97). The mean TIR (%) was 34.46 (21.21). Only 5 (14.3%) of the participants had TIR >70%. The majority of the participants (n = 57, 83.5%) had TAR (%) higher than the recommended threshold of 25%. A large proportion (n = 51, 76.1%) of the cohort had high CV (>36%).
Comparison between participants with T3cDM and T1DM
Those with T3cDM (n = 35) were older than those with T1DM (n = 32), with the mean age being 43.51 ± 14.56 versus 19.59 ± 5.99 for T3cDM versus T1DM (P < 0.001). There were no differences in the laboratory-measured HbA1c%, BMI, duration of diabetes, or the presence of macrovascular or microvascular complications between the two groups. On analyzing their CGM data, those with T3cDM had significantly lower eA1c% and mean BG, higher TIR, lower indices of GV, including CV, MAGE, or CONGA, and lower indices of hyperglycemia, including TAR, HBGI, and GRADE-Hyper as compared with T1DM (Table 2). However, there were no differences in hypoglycemia indices (TBR, GRADE-Hypo, or LBGI) between the two groups.
Comparison of Clinical Parameters and Continuous Glucose Monitoring Metrics Between T3cDM and T1DM

Parameters are expressed as mean (SD) or median [minimum − maximum] or n (%) for normally distributed quantitative, non-normally distributed quantitative, and categorical variables, respectively.
*Significant differences between the two groups (P < 0.05).
CKD, chronic kidney disease; PeVD, peripheral vascular disease; SD, standard deviation.
Comparison of glycemic patterns across the day between T3cDM and T1DM
Upon analyzing the glycemic patterns across the day, those with T1DM had a higher incidence of premeal hyperglycemia (prebreakfast, prelunch, and predinner), while the rates of postmeal hyperglycemic excursions were similar between the two groups (Supplementary Table S1). Notably, episodes of postmeal hypoglycemia were numerically higher in the T3cDM group, though not statistically significant. Both groups had high VBM throughout the day and night, including postmeal and nocturnal periods.
Comparison between users and nonusers of PERT in the T3cDM group with T1DM
We conducted a subgroup comparison between T3cDM—regularly using PERT (T3cDM—PERT, n = 20), T3cDM—without PERT (T3cDM—NO PERT, n = 15), and the T1DM (n = 32) group. No patient in the T1DM group was on PERT. Both the T3cDM-PERT and T3cDM—no PERT subgroups had significantly lower HbA1c% and mean BG than T1DM (Table 3). Notably, however, TIR was significantly higher, and the indices of GV, including CV, M value, MAGE, and CONGA, were significantly lower in the T3cDM-PERT group than T1DM group, but these parameters were similar between the T3cDM-no PERT and T1DM groups (Fig. 2). The proportion of patients with TIR >70, TAR <25, and CV <36 was significantly higher in the T3cDM-PERT group than in T1DM. However, those with T3cDM and not on PERT had similar GV patterns as T1DM. The postmeal C-peptide values for T3cDM-PERT as well as T3cDM-non-PERT groups were significantly higher than T1DM. There were no significant differences in the median C-peptide levels between T3cDM due to FCPD (2.3, 0.4–4.3 ng/mL) and CCP due to other causes like chronic ethanol intake (1.4, 0.7–4.1 ng/mL) (P = 0.24).
Comparison Between Users and Nonusers of Pancreatic Enzyme Replacement Therapy Among Patients with T3cDM

Parameters are expressed as mean (SD) or median [minimum − maximum] or n (%) for normally distributed quantitative, non-normally distributed quantitative, and categorical variables, respectively.
Significant differences between the two groups (P < 0.05).
Upon analyzing the patterns of glycemia throughout the day, postmeal hyperglycemia and late afternoon hyperglycemia were the same in T3cDM-no PERT and T1DM groups but lower in the T3cDM-PERT group. However, postmeal hypoglycemia was higher in the T3cDM-PERT group. The VBM across different times of the day was also lower in the T3cDM-PERT group. Nocturnal hypoglycemia and nocturnal VBM in both the T3cDM groups (PERT and no PERT) were the same as T1DM.
Correlation
We found a positive correlation of TIR with eA1c (r = −0.76, P < 0.0001), stimulated C-peptide levels (r = 0.45, P = 0.0002), and duration of DM (r = −0.3, P = 0.01), but there was no correlation of TIR with age, BMI, laboratory-measured HbA1c, and CV%. Similarly, CV had a significant negative correlation with eA1c (r =-0.28, P = 0.02) and with C-peptide (r = −0.45, P < 0.0001). There was no correlation of C-peptide with PEI-Q scores.
Risk factor analysis for high CV and high TBR
On comparing those with high CV versus normal CV, those with high CV (CV >36%, n = 41) had lower C-peptide levels (0.9 vs 2.26, P < 0.001) and were less likely to be using PERT (14.6% vs 53.8%, P = 0.0006) (Table 4). However, comparing those with high TBR (TBR >4%, n = 44) and low TBR (n = 23), a significant difference was noted only in levels of stimulated C-peptide (1.17 vs 1.95 ng/mL, P = 0.02) (Supplementary Table S2).
Comparison Between Those with and without High Coefficient of Variance (CV >36%)

On using multiple logistic regression to find independent risk factors for high CV, only lower levels of stimulated C-peptide emerged to be an independent risk parameter for high CV (OR: 0.3, CI: 0.12–0.59, P = 0.002) (Supplementary Table S3).
Discussion
In the current study, we compared GV and patterns in patients with T3cDM with those of patients with T1DM. We found that only 14.3% had their TIR more than the recommended threshold of >70%. The eA1c based on their AGP data (mean 8.9%) was lower than the laboratory-measured HbA1c% (mean 11.17%). While this difference is expected due to differences in the assay methodology, a part of it could also be contributed to by greater motivation of the patients to follow lifestyle advice and better medication compliance when they are wearing the AGP device. More than three-fourths of the cohort had high GV assessed by CV > 36%.
We found that while the laboratory-measured HbA1c% were similar between T1DM and T3cDM, those with T3cDM had better TIR and lower GV indices like CV, MAGE, or CONGA, as well as lower hyperglycemia indices like TAR or HBGI than T1DM. However, the hypoglycemia-related indices were not different between the two groups. A previous study reported higher GV but also higher indices of hyperglycemia in T3cDM than in T2DM. 4 On the other hand, Lee et al. compared CGM metrics in three groups—T1DM, T2DM, and T3cDM and found that participants with T3cDM had the lowest GV and the majority with T3cDM had CV within the recommended target of 36%. 15 The T3cDM cohort in the former study comprised only patients with FCPD. The latter study by Lee et al. having been conducted in a nontropical country, possibly had very few FCPD patients. Also, in their cohort, patients with T3cDM were early in their disease course with reasonably good C-peptide levels. We did not have a T2DM control group, and the T3cDM group comprised both FCPD (14 out of 35, 40%) and non-FCPD patients (60%). In a previous study, it was shown that those with FCPD have higher GV with significantly greater hypoglycemia indices compared to non-FCPD T3cDM patients. 40 The possible reason behind this could be a more significant degree of pancreatic fibrosis and functional pancreatic mass loss in FCPD than in non-FCPD T3cDM.
Patients with T3cDM are prone to both hyperglycemic and hypoglycemic excursions. This is attributable to several mechanisms, including loss of beta cell mass and thus insulin secretory defects, insulin resistance as a result of insulin receptor and signal transduction defects, as well as diminished incretin effect.41–44 The mechanisms leading to hypoglycemia include a lack of decline in insulin as a first-line defense to hypoglycemia, as well as extensive pancreatic destruction causing lack of glucagon secretion, though there is some evidence suggesting a preserved or even exaggerated postmeal glucagon secretion. 45 We found fewer hyperglycemic excursions and GV but similar hypoglycemia in T3cDM as T1DM. Postmeal C-peptide levels were higher in the T3cDM cohort than T1DM, and there was a positive correlation between C-peptide levels with TIR and with lesser CV, thus indicating the protective role of some preserved pancreatic beta cell mass in T3cDM compared to T1DM. We found lower C-peptide to be an independent risk factor for high CV in our study. The stimulated C-peptide levels in our cohort were detectable and toward the normal range in some, indicating residual beta cell function, although the duration of DM was around 7 years. However, there have also been previous studies showing residual beta cell function several years after diagnosis of T1DM.35,46 Also, the differences in assay methods and the mixed meal used for stimulated C-peptide response could account for differences in C-peptide responses in different studies. Lee et al. also noted an association between lower C-peptide levels and high GV in T3cDM. It was interesting to note that many of the T3cDM patients had normal C-peptide levels above the standard cutoffs for beta cell reserve, yet most of them had symptoms suggesting EPI. We failed to find any correlation between C-peptide levels and the PEI-Q scores. This might be suggestive of exocrine–endocrine mismatch in disease progression in T3cDM, and further studies using more objective markers of EPI, like fecal elastase, might help in this regard.
We noted that while premeal hyperglycemia was more common in T1DM, postmeal hyperglycemic excursions were similar in both groups, and postmeal hypoglycemia was slightly more common in T3cDM. Nocturnal hypoglycemia rates were similar in both groups and not affected by PERT. There was high variability around the median across the day, including postmeal periods in T3cDM. These factors are important to consider in order to cautiously adjust insulin dose in relation to meal timings in patients with T3cDM. One important reason explaining the postprandial GV in patients with T3cDM could be poor incretin response from the gut in response to poorer nutrient absorption, which in turn is the result of EPI in these patients. 5 Thus, correction of EPI is particularly important in T3cDM.
Indeed, we found that T3cDM patients receiving PERT had significantly lower GV, better TIR, and lower postmeal hyperglycemia than T1DM, but for T3cDM patients not receiving PERT, these values were similar to T1DM. This was in spite of higher C-peptide levels in all T3cDM patients than in T1DM, irrespective of PERT. Thus, the effect of PERT in improving postmeal incretin response might be an important factor leading to the reduction of GV. Notably, however, postmeal hypoglycemia rates were also higher in T3cDM receiving PERT. In a prior study by Lewis et al., patients with T1DM and demonstrable EPI showed improvement in GV and TIR following PERT. 18 Another real-world study found improvement in postprandial hyperglycemia with PERT. 10 PERT has also been shown to improve incretin response and postprandial hyperglycemia in CFRD. 7 However, Lee et al. found no effect of PERT on GV in T3cDM. 15 In their study, PERT was given only to those with symptoms of EPI. Thus, the proportion receiving PERT is expected to have greater severity of EPI than those who did not receive PERT, a fact which might explain why PERT did not affect GV in their study. Almost all patients with T3cDM in this cohort experienced symptoms of EPI and were advised to undergo PERT. Unfortunately, only 57% took PERT regularly. The clinical implications of high GV beyond worsening of the quality of life are now well known, and GV is an important independent risk factor for macrovascular and microvascular complications in DM.55 We found those with high CV to be less likely to receive PERT than those with low CV (<36%). Therefore, PERT might have an important role in reducing GV and have important therapeutic implications in DM with EPI, especially in patients with T3cDM. 47 However, due to small numbers, our study is underpowered to confirm these findings, and there is a need for further larger studies in this regard. The fact that PERT might reduce postprandial glucose levels to the level of postprandial hypoglycemia was a unique finding in our cohort. Multiple factors could account for this. While this is one of the very few CGM-based studies to look at the role of PERT, thus enabling the detection of a milder degree of hypoglycemia occurring early after a meal. Also, the patients in our cohort were receiving PERT irrespective of the severity of the EPI, unlike in the other studies, where only patients with severe EPI documented by elastase below 100 µg/dL were using PERT. 10 Also, during the 14 days of AGP, the insulin dose was mostly kept unchanged except in cases of serious hypoglycemia. Our findings open a new area for further research on the role of PERT on the daily hyperglycemic as well as hypoglycemic excursions.
The current study has the strengths of studying multiple CGM parameters and assessing glycemic patterns across different times of the day and night in T3cDM, for which there is a paucity of CGM data, and comparing it to another group of DM patients requiring insulin. It has special relevance in the tropics, where FCPD is a common cause for young-onset DM, and despite having exocrine insufficiency, many do not take PERT routinely due to pill burden and cost constraints. Several older studies from developed countries have revealed poor adherence with discontinuation rates in real life ranging from 20% to 60% and inadequate dose of PERT in patients with chronic pancreatitis.48–50 Though data are lacking, the figures are expected to be higher in the developing nations, given the high cost of the tablets and lesser concerns about the QoL among patients.
The current study has several limitations. EPI was not documented or quantified by fecal elastase or stool fat estimation or direct tests of pancreatic secretion. The lack of any quantitative measurement of EPI limits the findings of the impact of PERT on GV in the current study. Incretin and glucagon levels were not measured. While all patients with T1DM were receiving multiple subcutaneous insulins in a basal-bolus regimen, some of the patients with T3cDM were on premixed insulin twice or thrice daily. Also, several of the CGM metrics were calculated from the flash CGM or AGP data using EasyGV software rather than direct machine-derived metrics. It has to be noted here that flash CGM measures interstitial BG every 15 min while most of the real-time CGM metrics are meant for BG readings measured at 5 min intervals. 36 It has been seen in several studies that EPI occurs in T1DM as well, though the effects and role of PERT in these patients are not clear. 18 The T1DM and T3cDM cohorts had similar laboratory HbA1c% at the time of inclusion in the study, but the groups were not matched for age, duration of diabetes, BMI, and renal function, and due to small sample size, statistical methods for adjustment, like covariate adjustment or propensity matching, could not be done. We did not quantify or assess pancreatic exocrine insufficiency in the cohort with T1DM. Another limitation was that those receiving PERT could not be assessed for adequate, overcorrection or undercorrection due to the lack of adequate cutoffs of the PEI-Q questionnaire to define the three. Few reports and studies have reported lower glucose readings and higher TBR with Librepro CGM compared to the Dexcom CGM and POC glucometers, and both of these have been less accurate than Eversense CGM.51–53 This might be one factor influencing the high TBR detected in our study. Radiological estimation of pancreatic volume was not done due to the possibility of subjective errors due to involvement of multiple radiologists, although the former might be a surrogate marker to assess correlation between the exocrine and endocrine dysfunctions. Another limitation of the study was the lack of data regarding insulin dose requirements and separate basal-bolus doses, which is one of the key factors determining hypoglycemia and glucose variability. The insulin dose was not changed during the 2 weeks of AGP monitoring except in the event of serious hypoglycemia. The patients were receiving different regimens of insulin, including basal bolus, premixed, and coformulations with or without one or more insulin sensitizers. Data regarding the proportion using newer generation analog insulin and older generation insulin were not available. Thus, interpreting the insulin dose requirement or basal: bolus ratios of insulin would be difficult and of questionable relevance.
Our results suggest that among patients with DM requiring multiple daily insulin injections, patients with pancreatic DM have lower GV and hyperglycemia than T1DM, but the risk for hypoglycemia is similar. Patients with T3cDM and not receiving PERT have a similar risk for hyperglycemia and GV as T1DM. TIR is significantly better in T3cDM receiving PERT with lower postmeal hyperglycemic excursions, but the risk for postmeal hypoglycemia is also increased in them. PERT could have an important therapeutic role in patients with T3cDM, not only in the management of exocrine insufficiency but also in reducing GV. Those receiving PERT might require appropriate premeal insulin dose adjustment.
Authors’ Contributions
S.G. was involved in conceptualization and fund acquisition. P.G. was involved in data curation, investigations, and resource allocation for the project. Sunetra M. performed data curation, visualization, and methodology, and wrote the first draft. A.S.C. and R.P. were involved in data curation, software acquisition, and supervision of the experiments. N.D. was involved in data curation, editing the draft, and critical updation. Soumita M., A.B., and N.S. were involved in supervision of the experiments and project administration and critically edited the first draft. All the authors approved of the final version of the draft and have no undisclosed conflicts of interest.
Footnotes
Acknowledgments
The authors acknowledge Eris Pharmaceuticals for financial aid in securing and monitoring sensors for a group of patients living in remote locations.
Author Disclosure Statement
Results of one part of the research have been published by some of the authors of this article (Sunetra M., A.M.C., R.P.), and the article has been cited in the text.
Funding Information
A research grant was received from the Research Society for the study of Diabetes in India (RSSDI)—West Bengal chapter.
Supplemental Material
Supplemental Material
Abbreviations
References
Supplementary Material
Please find the following supplemental material available below.
For Open Access articles published under a Creative Commons License, all supplemental material carries the same license as the article it is associated with.
For non-Open Access articles published, all supplemental material carries a non-exclusive license, and permission requests for re-use of supplemental material or any part of supplemental material shall be sent directly to the copyright owner as specified in the copyright notice associated with the article.