
Abstract
Background:
Thirty-nine percent of people with type 1 diabetes may have lowered pancreatic elastase levels, correlated with exocrine pancreatic insufficiency (EPI or PEI). EPI is treated with oral supplementation of pancreatic enzymes. Little is known about the glycemic impact of pancreatic enzyme replacement therapy (PERT) in people with diabetes. This article demonstrates a method of assessing glycemic variability (GV), glycemic outcomes, and other changes in an individual with type 1 diabetes using open-source automated insulin delivery (AID).
Method:
Macronutrient, PERT intake, and EPI-related symptoms were self-tracked; diabetes data were collected automatically via an open-source AID system. Diabetes data were uploaded via Nightscout to Open Humans and downloaded for analysis alongside self-tracked data (food, PERT). Glycemic outcomes, macronutrients, PERT dosing, and a variety of GV metrics following meals were evaluated for one month before and one month after PERT commencement. Breakfast was assessed independently across both time periods.
Results:
In an n = 1 individual using an open-source AID, time in range was already above goal and improved further after PERT commencement. Glucose rate of change and excursions >180 mg/dL were reduced; mean high blood glucose index was reduced overall and more so specifically at breakfast following PERT commencement.
Conclusions:
GV can aid in assessing response to new-onset medications, as was demonstrated in this article for n = 1 individual with type 1 diabetes (using an open-source AID) after commencing PERT for newly identified EPI. GV may be useful for evaluating the efficacy of new-onset medications for people with insulin-requiring diabetes.
Keywords
Introduction
Estimates indicate that around 39% 1 of people living with type 1 diabetes have lowered pancreatic elastase levels, which can be indicative of exocrine pancreatic insufficiency (EPI or PEI). EPI results in poor digestion of food which can lead to malnourishment and can increase morbidity and mortality due to osteopenia and osteoporosis. 2 Treating EPI involves oral supplementation of necessary pancreatic enzymes alongside nutrient ingestion, known as pancreatic enzyme replacement therapy (PERT). 3 However, despite PERT studies specific to the diabetes population, little is known specifically about the glycemic impact of improved digestion with the addition of PERT in people with diabetes (PwD) who also have EPI, and PwD are typically cautioned to watch for hypoglycemia or hyperglycemia. 4 With the advent of new diabetes technologies including continuous glucose monitors (CGM), connected insulin pumps and insulin pens, and automated insulin delivery (AID) systems, it is now possible to answer questions that have previously been left as gaps in the medical research. 5 PERT, in particular, may be well suited to study with an assessment of changes in post-meal glycemic variability (GV) in people with insulin-requiring diabetes. Alongside analyzing diabetes data and meal intake records from an individual with an open-source AID for a period of time both before and after using PERT, this article proposes a method for assessing GV and other related changes following the onset of new medication such as PERT.
Methods
Data Collection
Data regarding meals from the post-PERT timeframe were manually tracked by the individual in a spreadsheet, recording PERT intake and quantity, partial macronutrient (fat and protein) content, timing of the meal, and EPI-related symptoms as an outcome of the meal. Each meal or snack during this time period thus included the date, time, macronutrient estimate, enzyme supplementation type and quantity, the timing of symptoms, and any other factors perceived to have influenced the meal results.
In addition, as an open-source AID 6 user, all diabetes data from CGM, pump, and AID including blood glucose values, insulin dosing data, manual carbohydrate entries, and algorithmic decision making, were automatically uploaded to Nightscout, an open-source remote monitoring platform. 7 The same type of diabetes data were automatically recorded for both pre- and post-PERT time periods.
Data Retrieval and Cleaning
The post-PERT meal-related data were provided as a single .csv file for analysis. (No specific meal tracking data were collected during the pre-PERT timeframe, other than carbohydrate entries). To retrieve the diabetes-related data for analysis, the Nightscout Data Transfer tool 8 was used to pull data from the selected time frames (pre- and post-PERT) and store the data in Open Humans. 9 The data were downloaded and converted from JSON to CSV using the Unzip-Zip-CSVify-OpenHumans-data.sh script. 10 The resulting CSV files (entries, containing BG data and timestamps; profile, including profile data; treatments; and devicestatus, including algorithmic decisions and insulin dosing data) were then cleaned for analysis. In the process of cleaning the CGM data, the BG data for the individual was first compiled into one file (which was previously split during CSV conversion), timestamps were cleaned and consistency was ensured between the file types, and error codes were removed.
Data Analysis
Data were assessed separately for the pre- and post-PERT data. The post-PERT data were collected during a four-week period starting with the commencement of PERT in early January 2022, containing 13 975 glucose entries. Data were collected by an adult (early 30s) female with newly diagnosed EPI having an elastase level of 200 µg/g, discovered after more than 19 years of living with Type 1 diabetes. A similar, four-week timeframe (also containing 13 975 glucose entries) was selected in November 2021 for pre-PERT comparison purposes.
Since the data are a time series, we analyzed and plotted autocorrelation (ACF) and partial autocorrelations (PACF) of the sensor glucose values for 70 data points.
We then performed the following statistical and GV analyses:
Visual analysis of glucose profiles and calculation of glycemic outcomes including time in range (TIR, 70-180 mg/dL), above range (>180 mg/dL), and below range (<70 and <54 mg/dL). The number of hyperglycemic excursions >180 mg/dL was also calculated, where the first data point >180 mg/dL counts but the rest do not count for that excursion.
Calculation of total daily dose of insulin, average carbohydrate intake, and average carbohydrate entries per day.
Analysis of a variety of clinically approved GV metrics11-13 such as low blood glucose index (LBGI), high blood glucose index (HBGI), coefficient of variation (CV), standard deviation (SD), and J_index (which stresses both the importance of the mean level and variability of glycemic levels) 14 before and after meals for both pre- and post-PERT times, for one hour (0-60 minutes), two hours (0-120 minutes), and three hours (0-180 minutes) each. The time slices before and after meals were identified by selecting glucose entries after all carbohydrate entries >15 g (therefore excluding hypoglycemia-related treatment <15 g). The time slices were truncated when the onset of a high temporary target was detected, as that indicated exercise was forthcoming, or if another carbohydrate entry >15 g appeared during the time window. Each experiment was repeated for one, two, and three-hour slices before and after the meal.
Glucose outcomes and variability assessment (mean of LBGI, HBGI, CV, SD, J_index, as well as mean TIR/time out of range [TOR] metrics) 15 both for all meals overall, as well as breakfast-only (because it was an identical meal across both time periods).
Analysis of post-PERT data including total daily fat and protein intake, total daily PERT dosing, and additional lipase usage.
(Analysis scripts used for glucose outcomes and variability are open source.) 16
Results
A time in range exceeding recommended goals from ADA 2022 Standards of Care 17 (>70%) was observed in this pre-PERT data set, at 92.12% (70-180 mg/dL), and it further improved to 93.70% following PERT commencement. Time below 70 mg/dL decreased from 4.11% to 3.84%, and time above 180 mg/dL similarly decreased, 3.77% to 2.46%. The number of unique excursions >180 mg/dL dropped from 40 (pre-PERT) to 26 (post-PERT). Time below 54 mg/dL also exceeded the recommended goal (<1%) but did not change significantly between the two time periods (0.56% and 0.68%). These data were not further evaluated to exclude potential “compression lows.”
There is a positive autocorrelation found among the glucose data, which is an indication of the ability to conduct detailed time series analysis. Figure A (A and B) and Figure B (A and B) (Supplemental Appendix) demonstrate that patterns for both ACF and PACF among glucose profiles pre- and post-PERT remain the same.
Table 1 provides a comparison and summary of pre- and post-PERT data of both glycemic and macronutrient-related metrics. Total daily fat and protein intake were only recorded after PERT commencement and averaged 115 g of fat and 65 g of protein daily. Figure C (Supplemental Appendix) illustrates the breakdown of average daily energy intake in the post-PERT period, and Figure D (Supplemental Appendix) illustrates the daily totals of each macronutrient by day over the 28 days post-PERT period. The average daily carbohydrate intake slightly decreased from 183 g (pre-PERT) to 166 g (post-PERT), but continued returning to the previous average (Figure E, Supplemental Appendix directly compares the daily carbohydrate intake across 28 days both pre- and post-PERT). The average number of carbohydrate entries per day (6.03-4.89) decreased, whereas the average grams of carbohydrate per entry for entries >15 g (42-50) increased in the post-PERT time period.
Pre- and Post-PERT Metrics.
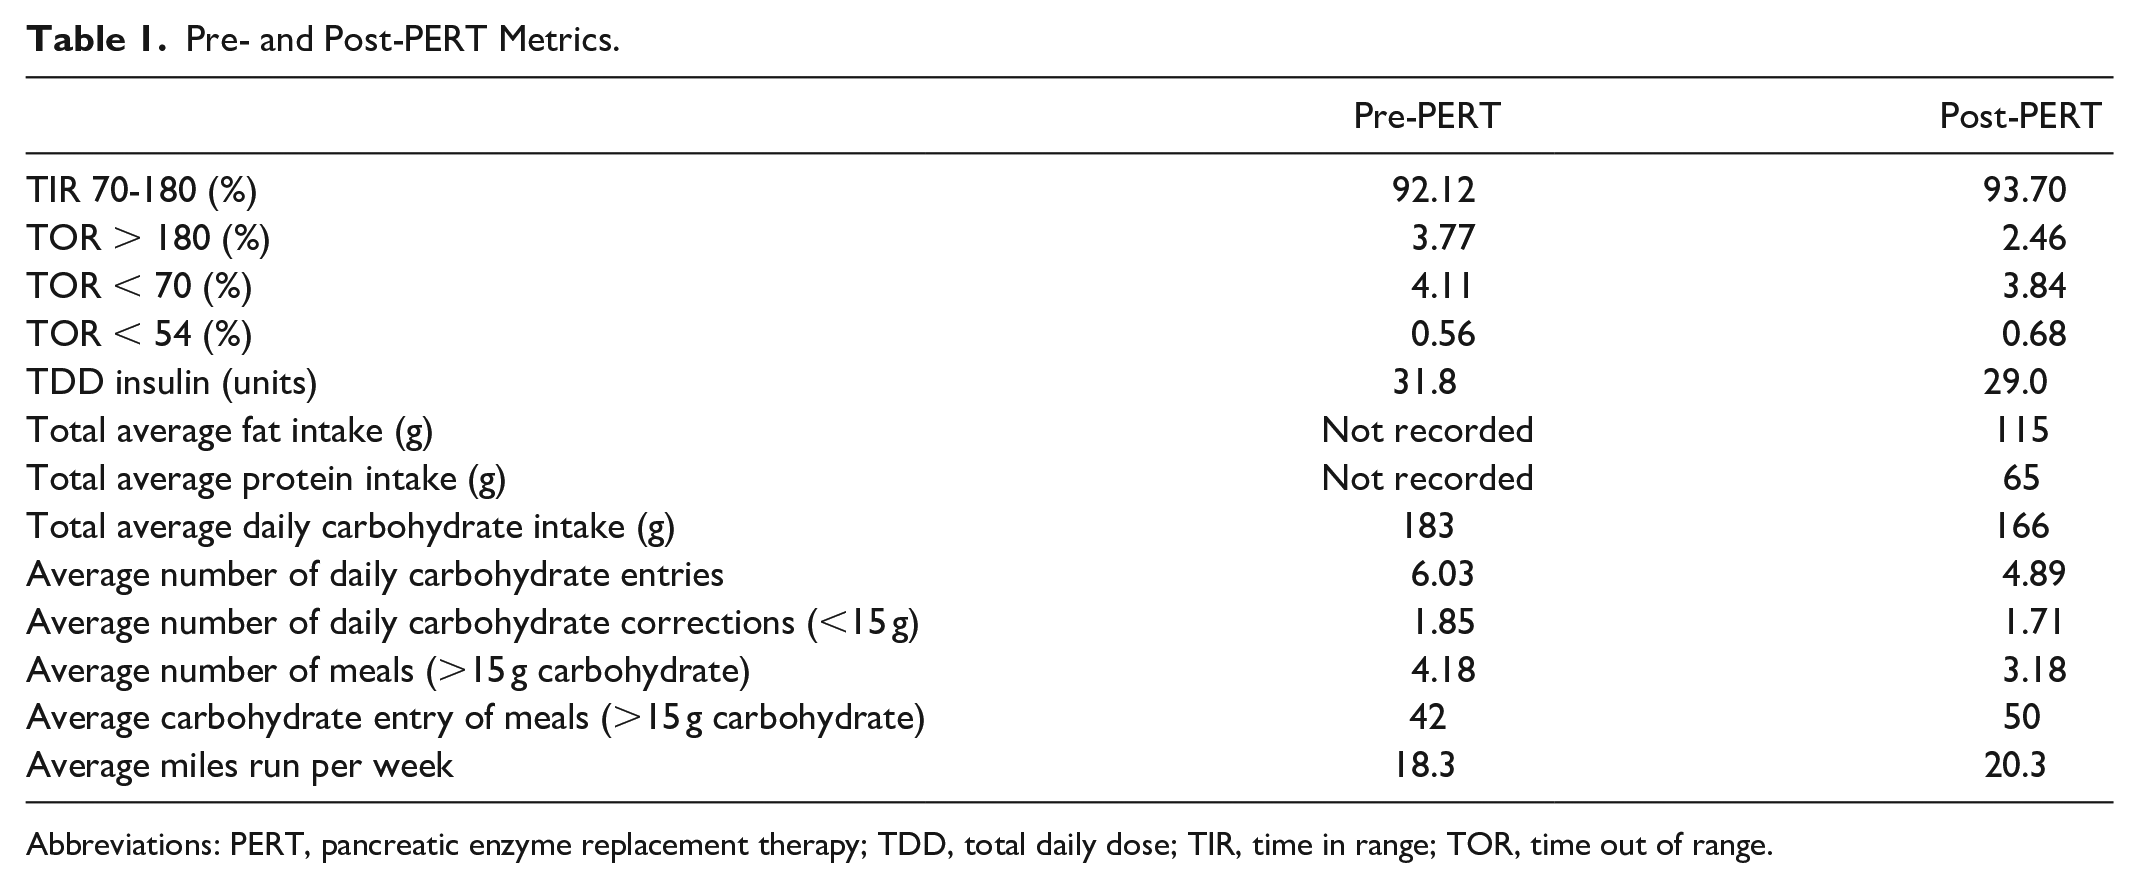
Abbreviations: PERT, pancreatic enzyme replacement therapy; TDD, total daily dose; TIR, time in range; TOR, time out of range.
Figure F (Supplemental Appendix) plots the amount of lipase taken per day, showing an increasing trend over time, compared with the number of PERT and standalone lipase pills consumed.
Table 2 provides all calculated GV-related variables. Figure 1 visualizes mean LBGI, HBGI, TOR > 180, TOR < 70, and TOR < 54 for both pre- and post-PERT time periods, for all meals and also for breakfast only. (All other data plots are available in Figure G in Supplemental Appendix). In Figure 2, the rate of change (RoC) in glucose (mg/dL/minute) is plotted with a visible difference for the reduction in glucose RoC per minute in post-PERT (ie, sigma = 0.91 post-PERT vs 1.03 pre-PERT), indicating less impact to glucose levels in meals with PERT. Figure 3 plots glucose data for the entire time periods of pre- and post-PERT with a visible reduction in the frequency of TOR > 180 mg/dL. The total daily dose of insulin decreased slightly (31.8-29.0 units), matching the decrease in carbohydrate intake during the commencement of PERT.
Mean CV, SD, TOR (<54, <70, >180), TIR, J_Index, HBGI, and LBGI Before and After PERT.
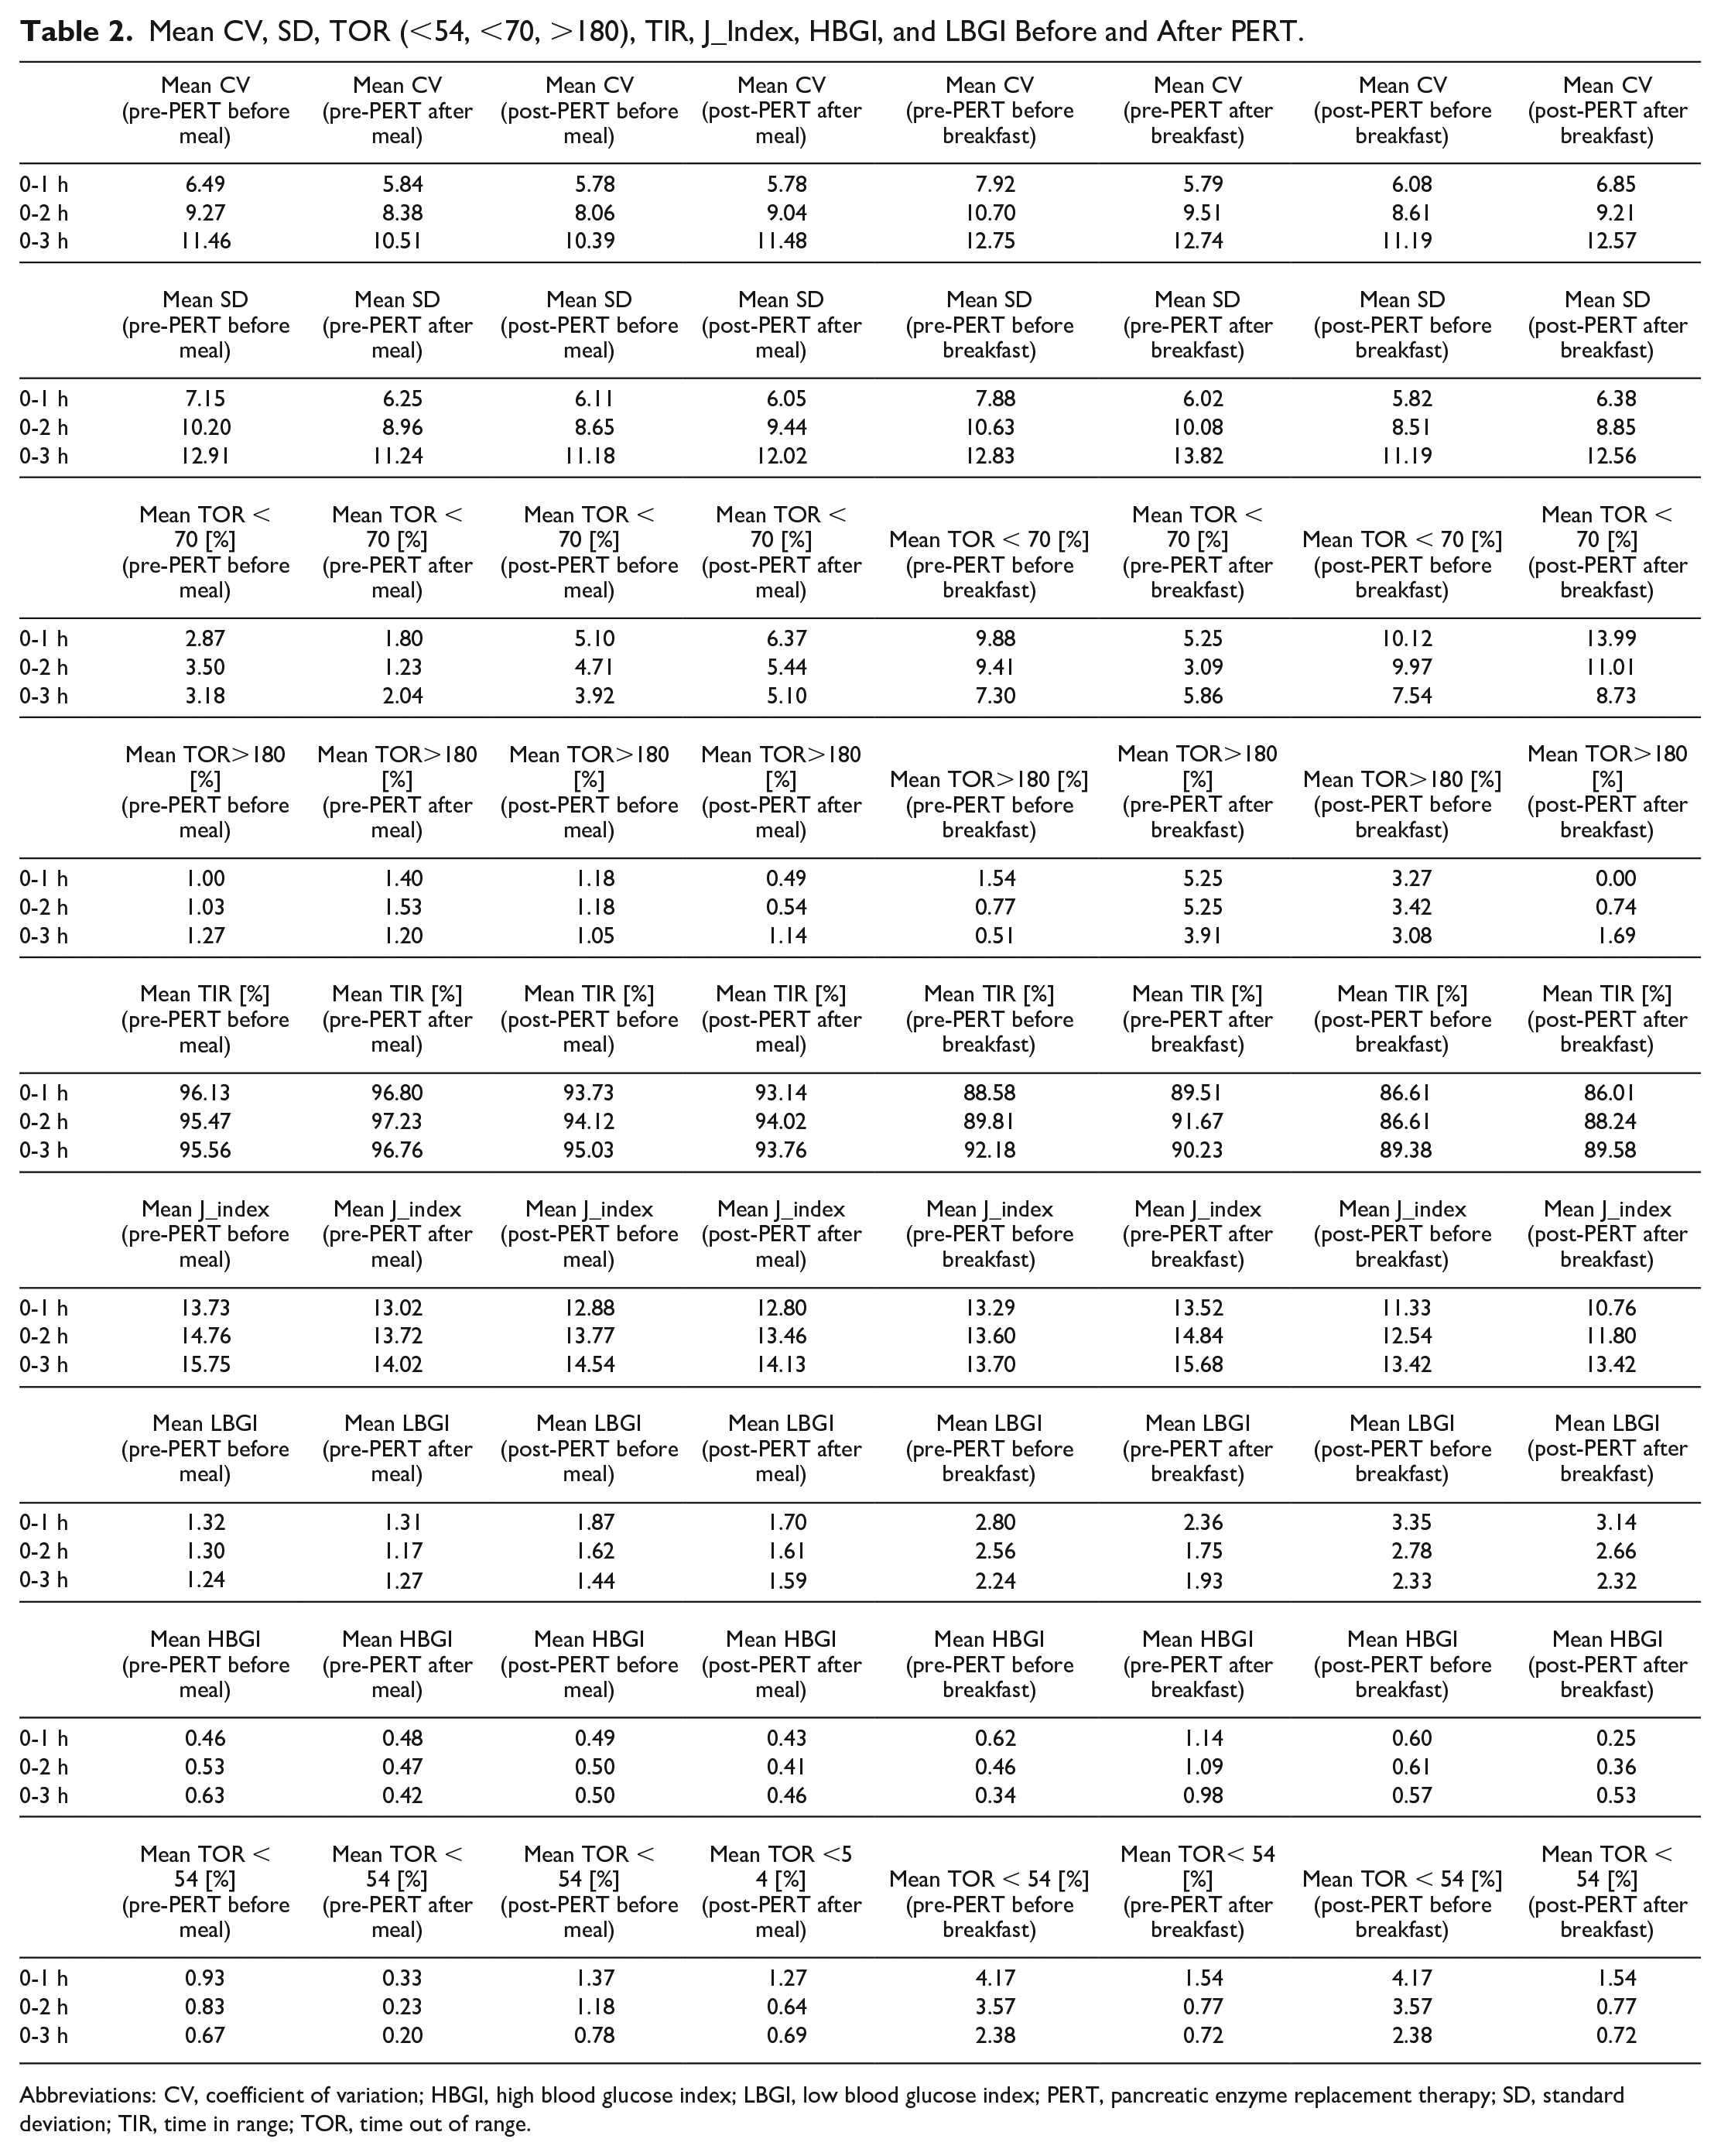
Abbreviations: CV, coefficient of variation; HBGI, high blood glucose index; LBGI, low blood glucose index; PERT, pancreatic enzyme replacement therapy; SD, standard deviation; TIR, time in range; TOR, time out of range.
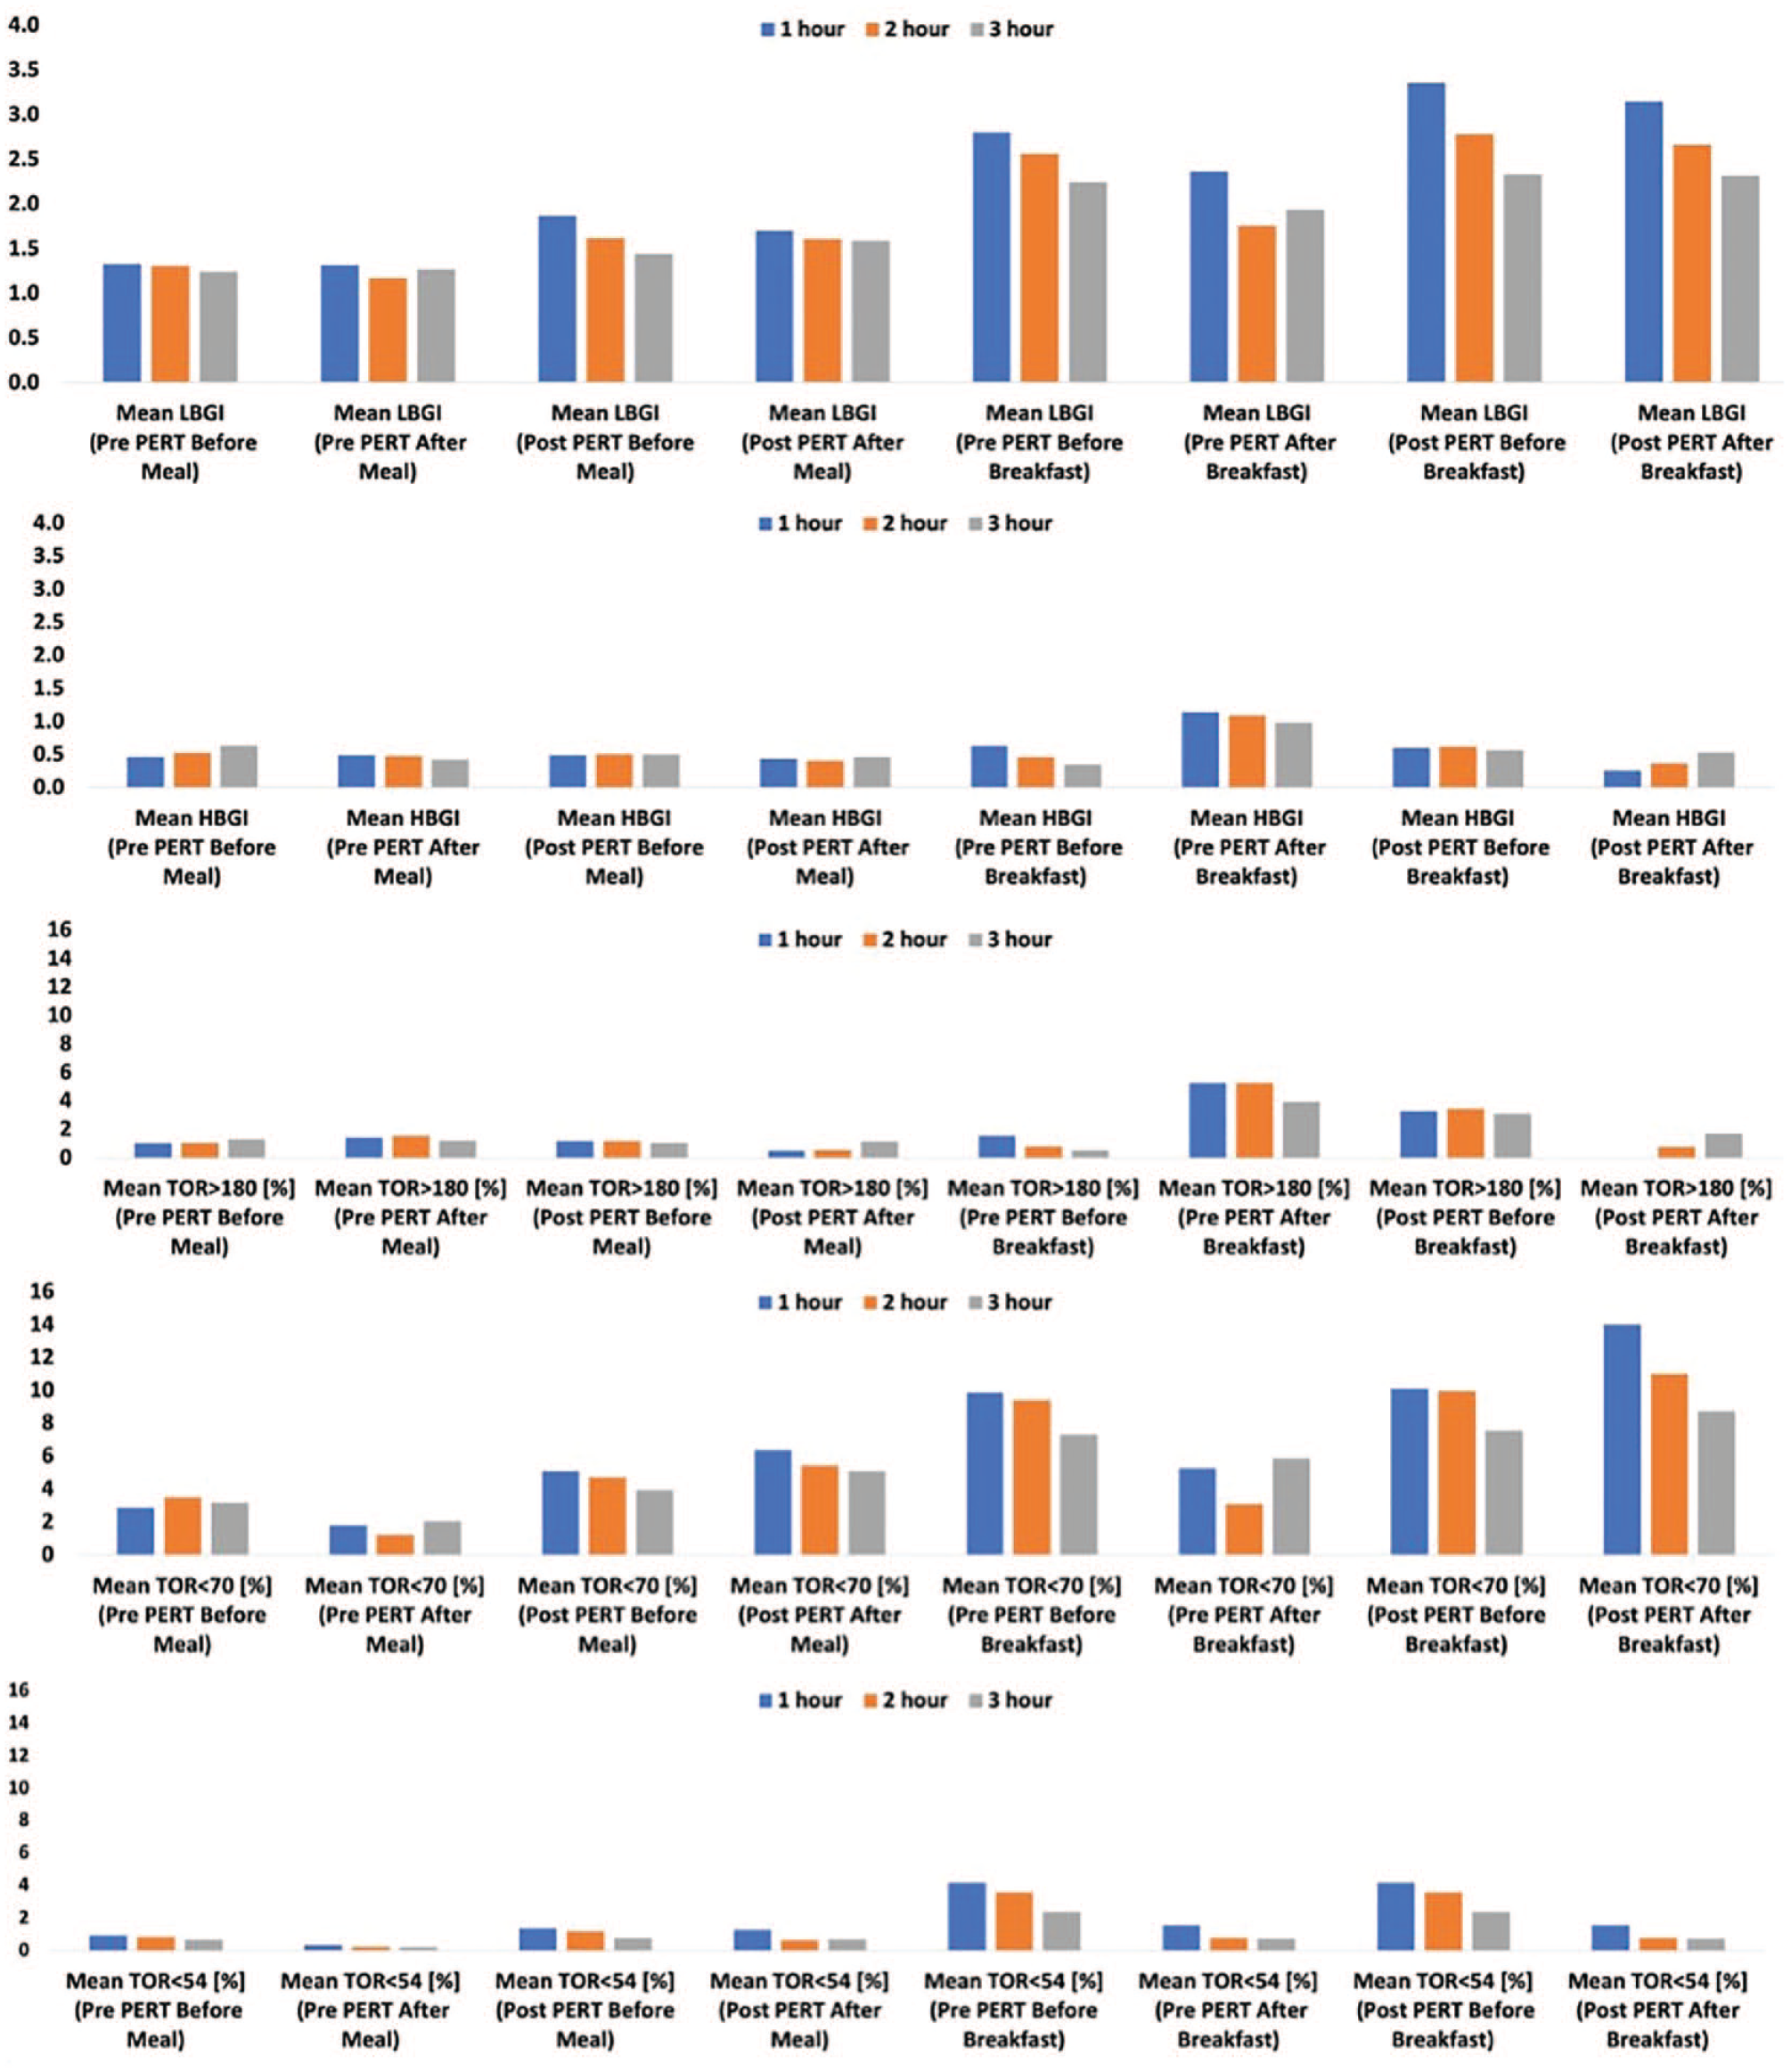
Plots of mean LBGI, HBGI, TOR > 180, TOR < 70, TOR < 54 before and after all meals and before and after breakfast only. Abbreviations: HBGI, high blood glucose index; LBGI, low blood glucose index; PERT, pancreatic enzyme replacement therapy; TOR, time out of range.
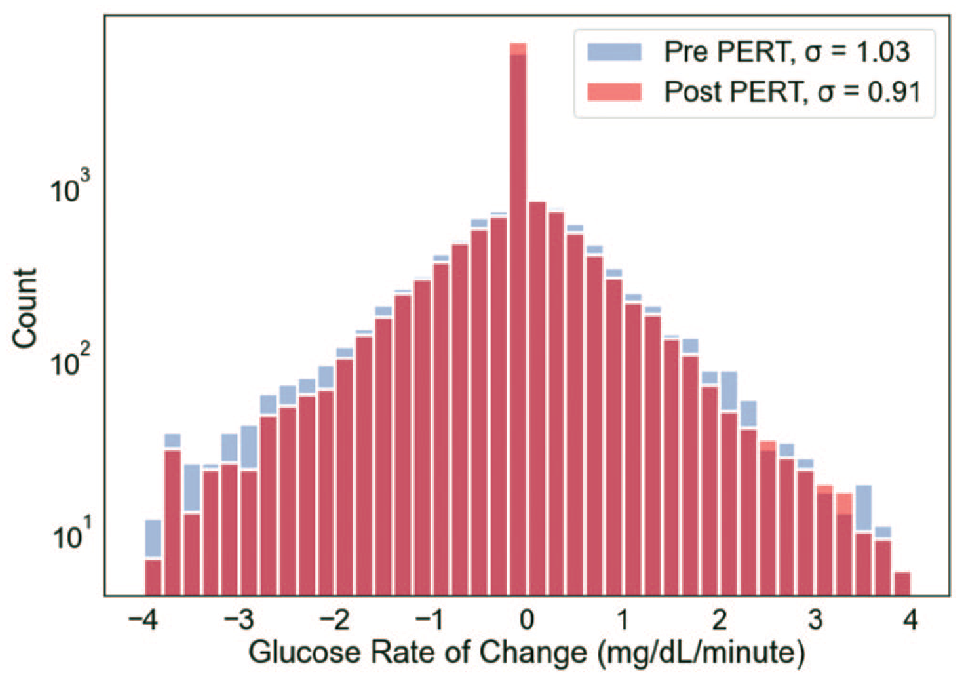
Illustration of glucose rate of change differences before and after PERT commencement, indicating less impact to glucose levels in meals with PERT. Abbreviation: PERT, pancreatic enzyme replacement therapy.
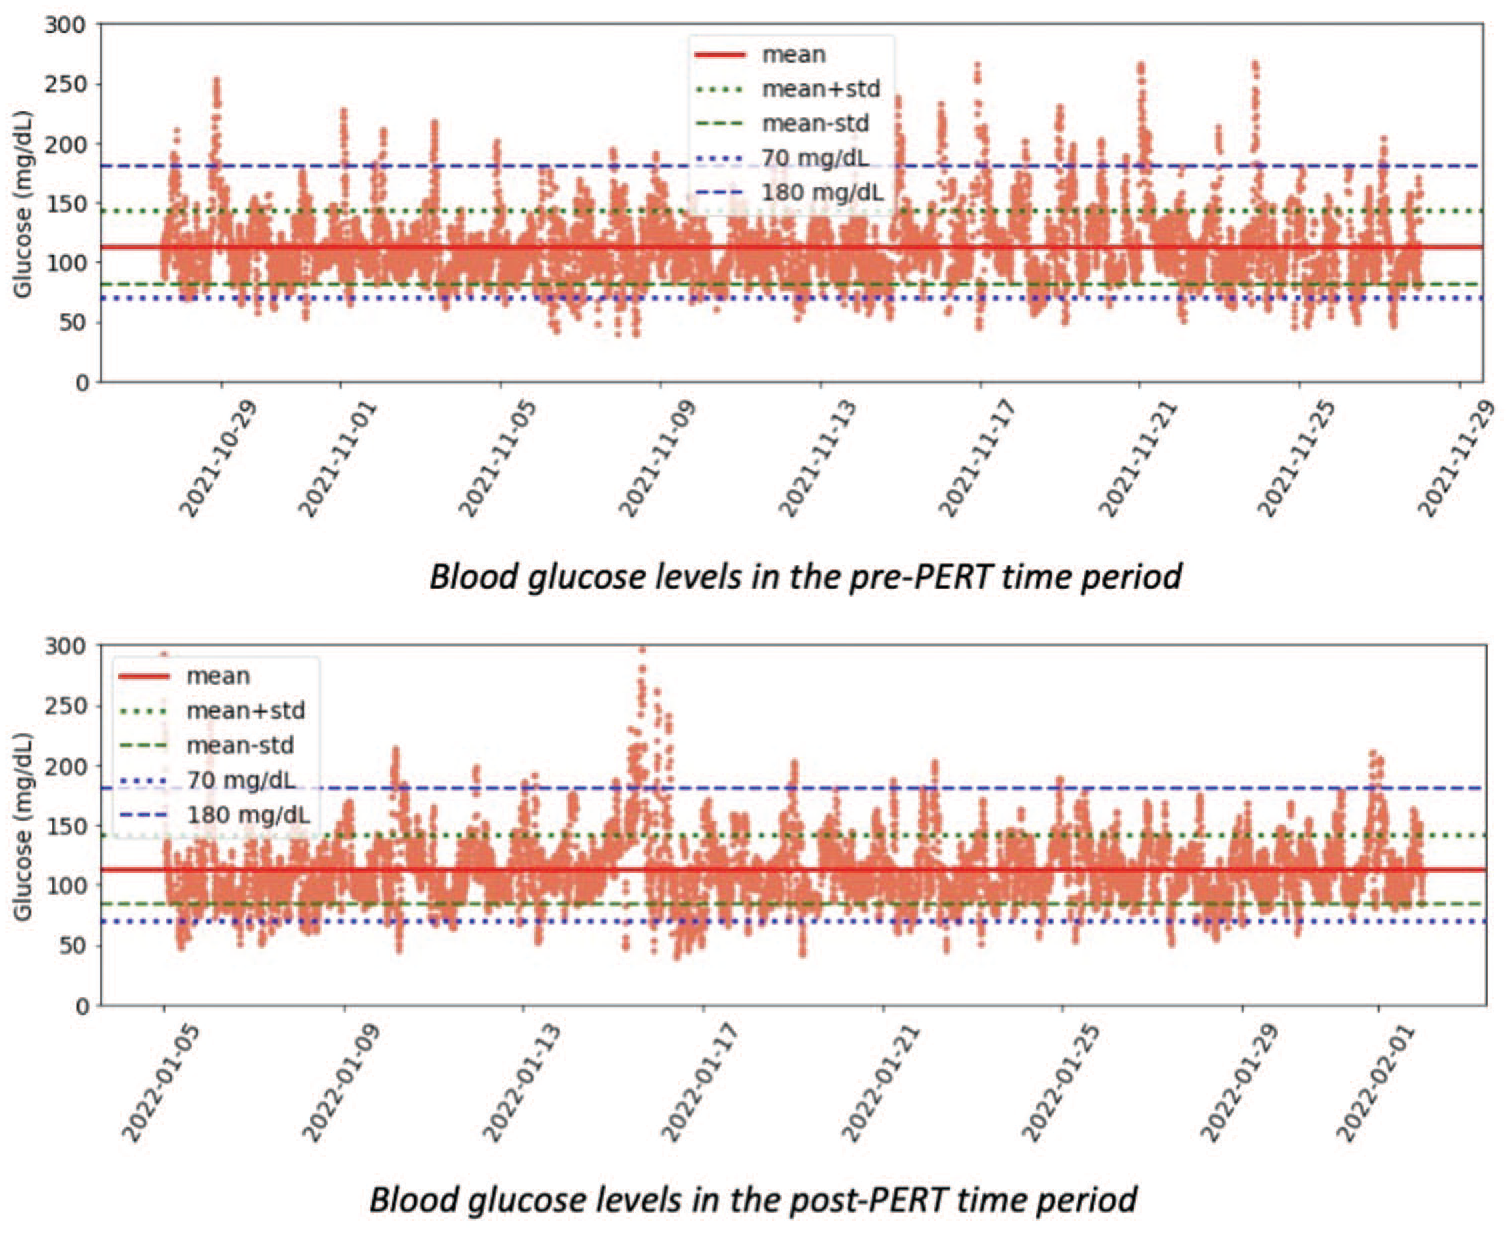
Plot of all glucose in each pre- and post-PERT time period, illustrating reduction in number of unique TOR > 180 excursions from 40 to 26 following PERT commencement. Abbreviations: PERT, pancreatic enzyme replacement therapy; TOR, time out of range.
Discussion
This article provides an opportunity to analyze glycemic outcomes and time in range improvements in an individual with type 1 diabetes using an open-source AID system with newly diagnosed EPI necessitating the commencement of PERT. The available real-world data for n = 1 enables a demonstration of a variety of methods of data analysis that could be used to design further studies in the population of people with insulin-requiring diabetes and EPI to address the knowledge gap that exists with regard to glycemic changes with the onset of PERT.
Although this n = 1 individual already has achieved time in range above recommended goals from ADA 2022 Standards of Care 11 (>70% TIR, <4% <70 mg/dL, <1% <54 mg/dL) before PERT, the commencement of PERT slightly improved glycemic outcomes further. Average daily carbohydrate intake was slightly reduced at the start of the post-PERT time period, likely as a result of needing to dose additional medication (pancrelipase) for all food consumed. This is also illustrated by the change in the number of total carbohydrate entries per day decreasing (6.03 pre-PERT; 4.89 post-PERT), but as seen in Figure E, carbohydrate intake was trending upward toward the previous levels. The average grams of carbohydrate per entry for entries >15 g (42-50) increased in the post-PERT time period, a metric that correlates with successfully using PERT to digest larger quantities of food than previously. As seen in Figure D, the intake of carbohydrates slightly increased throughout the post-PERT time period, indicating that the reduction in carbohydrate intake was likely a short-term change influenced by the adjustment to taking PERT. Fat and protein consumption trended slightly down throughout the post-PERT time period (protein R2 = 0.11; fat R2 = 0.097, carbohydrate R2 = 0.051).
Figure F (Supplemental Appendix) illustrates the relationship between the total number of units of lipase per day and the number of PERT-related pills consumed per day to the total number of units of lipase. It is possible to have different levels of pill burden depending on the choice for how to consume lipase as standalone, over the counter (smaller) lipase-only pills versus combination enzyme, prescription pancrelipase pills. PERT is similar to insulin in that it requires self-titration depending on the food consumed, so the quantity needed also varies at each meal. Some guidelines recommend starting at 50 000 lipase/meal, but symptom resolution drives the titration strategy of PERT. Given that this individual has moderate EPI and effective symptom reduction, these doses, despite being lower than guidelines, are currently perceived as optimal for this individual.
GV is useful for assessing post-PERT changes alongside symptom reduction, especially in an individual with already above-goal TIR. We assessed GV metrics for meals overall and specifically for breakfast only, since the meal was identical (estimated 54 g of fat, 16 g of protein, and around 50 g of carbohydrates) for both pre- and post-PERT time periods, providing a useful illustration of PERT-related impacts on glucose.
Mean HBGI was slightly reduced after meals with PERT compared with pre-PERT. However, there was a more noticeable reduction from HBGI before (eg 1.14 in the first hour) and after PERT commencement (0.25 in the first hour) in breakfast alone (Figure 1). The changes in post-meal glucose outcomes from the same meal with the same individual and AID behavior indicate a positive impact from PERT commencement. This PERT impact on breakfast is also illustrated by the mean TOR > 180 reductions after meals overall (1.40% in the first hour following meals before PERT and 0.49% in the first hour following meals with PERT). PERT essentially eliminates any first hour >180 excursions following breakfast (5.25% after breakfast without PERT to 0.0% in the first hour following breakfast with PERT). This may illustrate how PERT helps the body more effectively digest fat and protein, so carbohydrate absorption overall is more mediated than it was before PERT commencement.
The overall glucose metrics indicated a slight overall decrease in TOR < 70 and an even more slight increase in TOR < 54. Most of the increase in TOR < 54 may be attributed to the post-breakfast time versus other meals in the day (Figure 1). Breakfast was at a variable time each day, as early as 4
The overall interday glucose SD dropped from 30.68 to 29.28 mg/dL and CV dropped from 27.30 to 25.92. The mean SD and CV are lowest for one hour as compared with two and three hours following the meals with and without PERT, which reflects the fact day-to-day variation in postprandial blood sugar is larger than variability of blood sugar at mealtime. Without PERT, the SD is reduced with the overall meal intake for all periods. The pattern (decrease in SD) follows in the case of breakfasts for the first one and two hours following. However, there is a slight increase in SD after meals with PERT for the three hours following. Similarly, the CV without PERT is reduced with the meal intake but slightly increases in the case of PERT for each expanded time slice.
The autocorrelation (see Figure A, both A and B, in Supplemental Appendix) become statistically insignificant around 60 to 70 glucose data points, which may be illustrative of the duration of insulin activity (DIA) being more than five hours for this individual, with each data point representing five minutes.
The changes in GV and achieving high TIR without significant hypoglycemia provide another indicator of PERT success. PERT is typically assessed as successful based on reduction in malabsorption over time, which can be hard to measure, and symptom resolution as self-reported by patients. Thus, GV analysis in people with diabetes can be a useful and possible shorter-term indicator of PERT efficacy. It could also be useful for assessing the presence of EPI in someone with suspected insufficiency who commences PERT before elastase testing. Meanwhile, because it is common for PERT to be underdosed and because it can be hard to self-titrate, GV changes could be an earlier indicator of PERT efficacy and serve as encouragement for individuals with EPI to continue PERT titration and arrive at optimal dosing.
In this n = 1 example, the individual recognized and sought a diagnosis for EPI and treatment with PERT, but it took two years to identify EPI as the cause for new-onset gastrointestinal symptoms. There are high rates of EPI in diabetes, and many people go undiagnosed for long periods, as is true with other common gastrointestinal conditions that are frequently present in people with diabetes. This is yet another indicator that glycemic outcomes may be influenced by variables outside of an individual’s control 5 and ability to self-manage (eg someone with EPI can’t make more enzymes), and points to the need for further study of many of these GI-related conditions and their impact on glycemic outcomes and GV. The use of AID and CGM should be funded and encouraged for studies in such related gastrointestinal conditions to fill the knowledge gaps about glycemic impacts of medications such as those used in PERT.
Previous studies found that open-source AID effectively adjusts for a lot of “noise,” 18 and this n = 1 study adds the finding that it also responds effectively to variable digestion due to pancreatic insufficiency. This study demonstrates a viable method for improving the understanding of glycemic response to medications that influence digestion, such as PERT and many other medications commonly used by people with diabetes. Further studies should address glycemic change in response to PERT in a broader population of people living with insulin-requiring diabetes, and further studies should be done on other types of commonly used medications by people with insulin-requiring diabetes to improve the understanding of the glycemic impact of these medications.
Limitations
There are a few limitations specific to the design of this data analysis. Most importantly, this is an n = 1 retrospective analysis rather than a clinical study, and therefore definitively not meant to be representative of all PwD, people using AID, PwD with EPI, or people with EPI in general. Instead, it should be used as an example of the type of analyses that are possible, and to inform study design for future studies with larger populations. As an n = 1 study, it was also infeasible to estimate statistical significance of changes observed, which would require larger or longer studies.
The n = 1 example is also in someone achieving above-goal glycemic outcomes and time in range, so absolute glycemic and TIR changes with PERT are somewhat small, and also likely influenced by the level of severity of EPI, which is considered to be “moderate” in this individual. For someone with severe EPI, categorized by lower levels of elastase, different TIR and glycemic outcomes prior to PERT onset, or different levels of exercise or physical activity, the changes might be more distinct. In addition, the timing of regular running five days a week in the two to three hours following the breakfast meal likely influenced the after-breakfast GV metrics both pre- and post-PERT for this individual. Total daily fat and protein intake were only recorded after PERT commencement (as well as carbohydrate intake), whereas carbohydrate intake is the only dietary data available in the pre-PERT period.
Finally, this is not meant to purport to represent what should be done nutrition-wise, energy-wise, or PERT-wise, but solely as an example method of analysis for examining real-world behavior and glycemic-related changes in someone with type 1 diabetes following the initial commencement of PERT and throughout the first four weeks of PERT titration.
Conclusion
It is possible to use GV to assess changes in glycemic outcomes in response to new-onset medications, such as PERT in people with EPI and insulin-requiring diabetes. More studies should use AID and CGM data to assess changes in glycemic outcomes and variability to add to the knowledge base of how medications affect glucose levels for people with diabetes. Specifically, this n = 1 data analysis demonstrates that GV can be useful for assessing the response to PERT in someone with suspected or newly diagnosed EPI and provide additional data points regarding the efficacy of PERT titration over time.
Supplemental Material
sj-docx-1-dst-10.1177_19322968221108414 – Supplemental material for Glycemic Variability Assessment in Newly Treated Exocrine Pancreatic Insufficiency With Type 1 Diabetes
Supplemental material, sj-docx-1-dst-10.1177_19322968221108414 for Glycemic Variability Assessment in Newly Treated Exocrine Pancreatic Insufficiency With Type 1 Diabetes by Dana M. Lewis and Arsalan Shahid in Journal of Diabetes Science and Technology
Footnotes
Abbreviations
AID, automated insulin delivery; EPI or PEI, exocrine pancreatic insufficiency; GV, glycemic variability; PERT, pancreatic enzyme replacement therapy; TIR, time in range; TOR, time out of range.
Declaration of Conflicting Interests
The author(s) declared no potential conflicts of interest with respect to the research, authorship, and/or publication of this article.
Funding
The author(s) received no financial support for the research, authorship, and/or publication of this article.
Supplemental Material
Supplemental material for this article is available online.
References
Supplementary Material
Please find the following supplemental material available below.
For Open Access articles published under a Creative Commons License, all supplemental material carries the same license as the article it is associated with.
For non-Open Access articles published, all supplemental material carries a non-exclusive license, and permission requests for re-use of supplemental material or any part of supplemental material shall be sent directly to the copyright owner as specified in the copyright notice associated with the article.