
Abstract
Background:
Individuals with type 1 diabetes (T1D) require close glucose monitoring to prevent both short- and long-term complications. Physical activity (PA) is a significant source of variability in metabolic dynamics, leading to glycemic fluctuations that depend on the type, intensity, and duration of the exercise. Accurately monitoring and classifying the type of PA is crucial for optimizing glycemic control and minimizing the risk of hypoglycemia.
Method:
This study utilizes the largest clinical trial of PA in people with T1D to date, the Type 1 Diabetes and Exercise Initiative (T1DEXI), which included both structured and unstructured PA sessions, to develop an online classification approach for identifying the type of PA (aerobic, interval, resistance). A computationally efficient convolutional neural network (CNN) was trained on time–frequency representations (spectrograms) of step count and heart rate signals, readily available from wearable devices, from the structured PA sessions of the T1DEXI dataset. The proposed methodology presents an ad hoc process for designing the spectrograms based on the CNN architecture to optimize the classifier’s performance.
Results:
The CNN-based classification approach was implemented using spectrograms of 5- and 30-min signals, resulting in two classifiers that achieve high classification accuracy when evaluated on the structured PA sessions. The 5-min classifier was then applied to unstructured PA sessions, where the predicted distribution of glucose changes for the activity types was consistent with clinical evidence.
Conclusion:
These results demonstrate the potential of the proposed approach for its integration into decision support systems or automated insulin delivery systems, enabling improved glucose management during exercise in T1D.
Introduction
Type 1 diabetes (T1D) is a chronic condition characterized by the autoimmune destruction of pancreatic beta cells, leading to insulin deficiency. This results in elevated blood glucose levels that can cause severe long-term complications if not properly managed. The treatment of T1D involves the administration of exogenous insulin, which requires close monitoring of glucose levels to prevent hypoglycemic and hyperglycemic episodes. 1
The glycemic dynamics in T1D are strongly affected by various sources, mainly food intake and other factors such as physical activity (PA) and stress.2,3 Significant research has been dedicated to modeling and controlling glucose levels in response to food intake and insulin administration. 4 Nonetheless, the presence of PA also introduces an important source of variability in metabolic dynamics, leading to significant decreases or increases in glucose levels.5,6 This behavior depends on the type, intensity, duration, and specific conditions of the patients during exercise, between others.7,8 Therefore, it is essential to improve insulin administration and glucose prediction strategies by taking into account the specific type of physical exercise being performed.9,10 Currently, there is no consensus within the scientific community on how to model the effect of PA. As such, the ability to accurately monitor and classify the type of PA in patients with T1D in real time is crucial for optimizing glycemic control and compensating for dangerous fluctuations in glucose. This information could be integrated into clinical decision support systems (DSS) or automated insulin delivery (AID) systems, allowing for the adjustment of insulin administration based on the type of activity and its expected glycemic impact.
Numerous studies and clinical trials have been conducted to address the challenges associated with PA monitoring and classification in the context of T1D.11–14 Some works have explored the use of heart rate (HR) and/or accelerometer and gyroscope-based measures for classifying the type and intensity of PA.15–18 For example, Cho et al. 15 developed a random forest-based framework for real-time detection and classification of activity types and intensity in controlled environments, utilizing triaxial accelerometer, HR, and continuous glucose monitor (CGM) data. Others have incorporated additional physiological variables, such as skin conductance or skin temperature, to enhance the classification capabilities.19,20 In contrast, Abdel-Latif et al. 3 explored the classification of PA and acute psychological stress in T1D using portable sensor data. In that work, a recurrent neural network (RNN) with long short-term memory (LSTM) architecture and a decision tree-based strategy is employed, demonstrating the feasibility of a multitask classification approach. While some of these studies have provided valuable insights, they have primarily focused on evaluating their methods in structured and predefined exercise sessions within controlled environments. This approach, even though useful for initial validation, may not fully capture the complexities of real-world PA patterns encountered by individuals with T1D. In their daily lives, people often engage in a variety of unstructured and varied physical activities, which can introduce additional challenges for accurate monitoring and classification.
To address the previously mentioned limitations, the Type 1 Diabetes and Exercise Initiative (T1DEXI) clinical trial was designed to collect detailed data on glucose levels, PA, and other relevant factors in patients with T1D during their daily routines and structured exercise sessions. 21 By including a diverse range of activities and contextual information, the T1DEXI dataset enables the analysis of glucose dynamics in a more realistic, everyday setting. Researchers have used this rich dataset to conduct studies that estimate the probability of hypoglycemia risk during physical exercise and in the postexercise period using advanced statistical modeling techniques.22,23 Digital twin models have also been developed for the simulation of continuous glucose response.24,25 Additionally, associations between daily step count classifications and continuous glucose monitoring metrics have been analyzed. 26 As conclusions of the T1DEXI trial, the authors found that prolonged moderate-intensity aerobic activities have been found to present the greatest drop in glucose levels, followed by interval activities, while resistance activities show the smallest drop or even an occasional rise. 21 Therefore, differentiating among exercise types may be beneficial to determine the most appropriate insulin management or nutritional intake strategy for exercise in individuals with T1D. Building on this, Fushimi et al. 27 developed the first online classifier to identify the type of exercise using HR and triaxial accelerometer data from the T1DEXI dataset. Although their LSTM-based classifier achieved good accuracy in classifying both structured and unstructured exercise sessions, the use of RNN approaches can be computationally demanding and challenging to implement on low-power devices, such as wearable fitness trackers or insulin pumps.
The studies mentioned above and several others in the literature highlight the use of machine learning28,29 and deep learning (DL) techniques 30 in the field of healthcare. Within DL methods, convolutional neural networks (CNN) have emerged as a powerful tool, especially in image processing, due to their high effectiveness in extracting relevant features from visual data. This approach has been applied for the classification of biomedical signal spectrograms, which serve as an alternative representation of time-series data in the time–frequency domain. For instance, studies have exploited CNNs for the classification of electrocardiogram signals, 31 electroencephalogram data for epilepsy diagnosis, 32 and the early detection of diabetes based on skin impedance and HR variability 33 or from HR signals. 34 Finally, the work by Hsu et al. 16 proposes a DL algorithm that uses accelerometer and gyroscope data for the classification of sports (tennis, golf, volleyball, etc.) in only 10 healthy subjects without diabetes.
This article proposes an online classifier capable of accurately determining the type of PA (aerobic, interval, resistance) performed by individuals with T1D. Beyond classification, this work also seeks to validate the classifier’s performance by contrasting the results against the expected glycemic changes for each activity type, analyzing the distribution of these changes in real sessions versus the classifier’s outcomes. Differing from previous works, the methodological approach utilizes spectrogram representations of step count and HR signals from the T1DEXI dataset to train a CNN classifier, which is computationally more efficient than other neural network-based methods typically used for time-series analysis. Moreover, step count data were used instead of triaxial accelerometer data, a signal that is usually unavailable in practice. Conversely, step count is accessible from most commercial devices and also eliminates the need for additional preprocessing steps. Furthermore, the lower sampling rate of the step count signal (0.1 samples per second) compared with the accelerometer data (32 samples per second across three axes) results in fewer samples, further reducing the computational requirements. As a result, overall, the proposed method offers practical advantages for real-time and real-world scenarios where low-latency inference is crucial. Initially, a 30-min signals classifier was used to design and evaluate the spectrogram generation methodology. Then, to enable real-time applications for variable-duration and unstructured PA events, the methodology was extended to a computationally efficient 5-min CNN-based classifier. This adaptation makes it suitable for the dynamic nature of PA while facilitating its integration into clinical DSS or AID systems. This aims to improve glucose management during exercise in patients with T1D by offering a more precise understanding of the type of activity being performed.
T1DEXI Study
The dataset used in this work originates from the T1DEXI study, 21 which was conducted under real-life conditions and collected a wide variety of data related to exercise in individuals with T1D. This study involved a total of 497 adults diagnosed with T1D for at least 2 years prior to the start, with an age of 37 ± 14 years and a glycated hemoglobin (HbA1c) value of 6.6% ± 0.8%. The participants were under one of the three most common insulin administration treatments at the time of the study: commercially approved hybrid closed-loop, standard insulin pump, or multiple daily injections.
Each participant was randomly assigned with six structured exercise sessions based on videos that the participants followed at home. The exercise types include aerobic (
Additionally, the patients used the Verily Study Watch for the continuous collection of HR and movement data (from which step count is inferred). During the structured exercise sessions, the participants were asked to wear a Polar H10 chest strap HR monitoring system for a more accurate monitoring of the exercise relative intensity.
This valuable resource has been used in this work as the basis for generating a dataset, which was employed to train and evaluate exercise classification models. The use and analysis of this clinical dataset is highly relevant, as the data were collected under everyday life conditions over an extended period, unlike other studies conducted in controlled environments. This allows for the design and evaluation of machine learning methods in more challenging and realistic scenarios, where daily activities (diet, PA, sleep quality, etc.) and life events (stress, etc.) present an impact on the glucose level.
Methodology
The proposed classification approach was supported by a methodology comprising data analysis and preparation, signal processing and spectrogram generation, and the application of CNN for image classification, as detailed in the following subsections.
Data analysis and preparation
A data filtering process was carried out to ensure data consistency and the validity of the analysis and results. Only those days in which the participants recorded some PA were selected, considering participants with the three types of insulin administration treatment. It is important to note that the missing samples in CGM and wearable devices are a significant constraint when extracting information from the sampled signals.35,36 To address this limitation, only sessions with more than 90% of the available samples were selected from the Verily Study Watch, which recorded HR and step count at a sampling rate of 10 s. This requirement helps to maintain the signal integrity used for the analysis, minimizing the impact of missing data. 36 Interpolation was performed for any remaining missing values within the selected sessions.
After the data filtering process described earlier, a total of 462 participants were considered for the analysis. The participants had a mean age of 37 ± 14 years and had been diagnosed with T1D for an average of 19 ± 12 years. The mean HbA1c value of the study population was 6.6% ± 0.7%, indicating generally good glycemic control. The dataset included 1798 structured exercise sessions and 5121 unstructured PA sessions recorded by the participants.
The filtered dataset was divided into two parts for the training and validation process of the classification approach:
Dataset Structured Sessions (SS): This dataset is used for training and validation and consists of the structured exercise sessions labeled as aerobic, interval, and resistance. Dataset Unstructured Sessions (US): This dataset is only used for validation and concentrates on the daily life activities recorded by the participants, which are self-categorized at the time of recording.
The structured exercise sessions in Dataset SS were used for the training and initial evaluation of the developed classifier, as they provide a more controlled and well-defined set of physical activities, with a fixed duration of 30 min. In contrast, Dataset US, containing the unstructured daily life activities, was utilized for the validation of the classifier in a more realistic scenario. The unstructured sessions in Dataset US had a mean duration of 58.6 ± 47.2 min, with a median of 45 min and an interquartile range of 32–60 min, reflecting the variable nature of physical activities performed in daily life. This division of the dataset allows for a comprehensive evaluation of the classifier's performance with previously unused data, ensuring its robustness and applicability in both structured exercise settings and real-world daily activities.
To further characterize the exercise sessions, the change in CGM during each session was calculated as follows
27
:

The
Signal processing and spectrogram generation
The spectrogram is a powerful tool for analyzing nonstationary signals whose frequency components vary over time. Unlike the traditional Fourier transform, which assumes stationarity, the spectrogram provides a time–frequency representation that captures the temporal evolution of a signal's spectral content. This property makes it particularly suited for applications involving signals with time-varying characteristics, such as physiological time series.
The short-time Fourier transform (STFT) is used to compute the spectrogram representation. This signal processing technique serves to analyze the frequency and amplitude of localized waves. It is particularly useful for signals with time-varying characteristics, allowing the examination of changes in frequency and amplitude over time. For a discretized digital signal


The spectrogram is a two-dimensional representation where the columns represent time, the rows represent frequencies, and the element magnitude reflects the energy of the signal, represented with a color intensity scale. Each element of this matrix is obtained by calculating the STFT and converting it to the decibel scale as follows:

Here,
The window size (
CNN for image classification
CNNs are a specialized class of artificial neural networks designed to process grid-structured data, such as images. Figure 1 depicts a standard CNN architecture, consisting of multiple stages that analyze and transform input data. The process begins with convolutional and pooling layers, where learnable filters extract meaningful features from the input. These features are gradually refined through repeated convolutional and pooling stages, allowing the network to capture increasingly complex patterns.
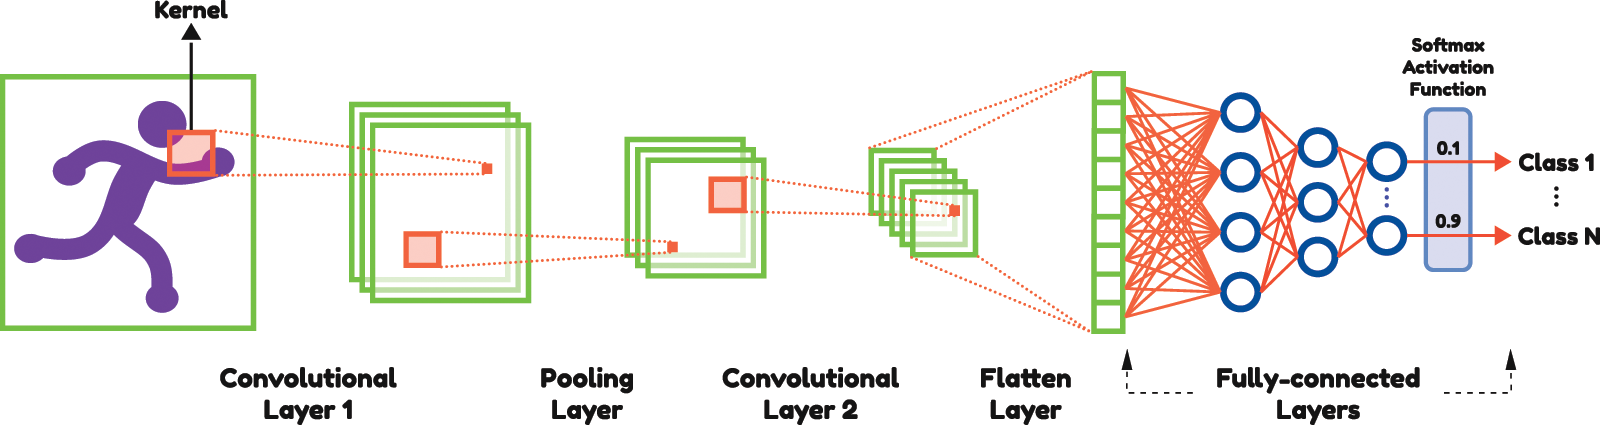
Typical convolutional neural network architecture for processing grid-structured data.
The key to their success lies in the convolutional layers, which act as powerful feature extractors by applying sliding filters across the input. These filters identify localized patterns and hierarchical features that are critical for classification tasks, making CNNs particularly effective for spatial data such as spectrograms. 37 In the final stage, the output of these layers is passed to a fully connected network, where weights are adjusted, and activation functions are applied to produce the final prediction or classification.
Convolutional layers perform the core operation by convolving the input with filter kernels to generate feature maps, enabling the network to identify and leverage patterns within the data. Mathematically, this operation can be expressed as follows
16
:
After the convolutional layers, the feature maps are flattened into a one-dimensional vector and passed through fully connected layers. These layers establish dense connections between all neurons in successive layers, enabling high-level feature integration for classification. The fully connected layer can be represented as follows:

The final layer of the CNN applies the softmax activation function to the last fully connected layer. This softmax function converts the output of the fully connected layer into a probability distribution over the target classes:

In this work, the design of the CNN architecture will focus on the optimal configuration of the convolutional layers and fully connected layers, without the use of pooling layers. Indeed, pooling layers are commonly used in CNN design to reduce dimensionality. However, in the current approach, the spectrogram dimensions are already small from their generation. Therefore, pooling layers are not employed to preserve spatial resolution and maintain a high resolution for the effective extraction of relevant features.
The specific selection of filter sizes, the number of filters, and other hyperparameters will be explored in the next section to adapt the CNN model to the dimensions of the input spectrogram images.
Classifier Design
This section details the design of the CNN-based classifier, including the spectrogram generation process, modifications for online operation, and the training and validation strategy.
Spectrogram generation process
Typically, the architecture of the CNN for the classification task is designed based on the input size. This is because the application of convolutional filters decreases the size of the image throughout the network when no padding (adding extra pixels around the leading edges to preserve their dimensions) is applied to the input arrays.
As mentioned in the “Signal Processing and Spectrogram Generation” section, the pair of parameters (


An ad hoc process is proposed for designing an effective parameter pair. This approach allows a CNN to adjust its first layer according to the input size while maintaining the structure and configuration of the subsequent layers unchanged, including their defined input and output dimensions. The proposed process will be detailed in the context of classifying 30-min signal spectrograms. Some network hyperparameters that define the architecture are fixed, while others remain variable depending on the model input. Figure 2 shows the CNN architecture along with the most important aspects of this design.

Convolutional neural network design for spectrogram generation process using 30-min signals.
In each convolutional layer

The kernel, input, and output sizes for each convolutional layer are defined as follows. For the second layer, a fixed output size of
With the CNN architecture defined, the ranges for
Finally, multiple network trainings and evaluations were performed to find the best combination of
Modifications for online classification
While the approach of using 30-min signal spectrograms proved to be straightforward for spectrogram generation, this classifier is not suitable for variable-duration real-time applications, as it can only provide a classification after 30 min of the PA session. This characteristic further restricts the proposal evaluation with unstructured PA, as seen in Dataset US.
To extend the methodology to a variable-duration approach, more appropriate for potential integration into real-life applications, a voting-based CNN classifier using 5-min spectrograms with a 2-min step between consecutive spectrogram calculations was developed. Therefore, after the initial 5-min classification, a probable class value will be obtained every 2 min. At any given time during the activity, the “current” classification will be based on the most frequently selected class by this classifier since the beginning of the session. The voting decision is determined as follows: if either the aerobic or resistance class receives more than 45% of the votes, that class is selected. Otherwise, the interval class is assigned. This process addresses the challenges inherent to the interval class, which often combines aerobic and resistance components depending on the exercise protocol. 7 Consequently, given its mixed nature, the session is classified as intervals if either the intervals class exceeds 45% of the votes or if neither of the remaining two options (aerobic and resistance) exceeds the 45% threshold for a definitive classification. Additionally, the initial period of 5 min is considered a warm-up and therefore discarded.
The design of the CNN architecture and the selection of the (
Training strategy
Both the 30- and 5-min spectrogram-based classifiers were trained following a structured scheme, with a 60/20/20% split for training, validation, and testing, respectively. Overall, 60% of the samples were used for adjusting the classifier’s weights or parameters, while the 20% validation set was used to monitor the model’s performance during the training process. Finally, the remaining 20% that the CNN had not seen during training was used for the final testing of the trained model. This training scheme was intended to avoid overfitting.
Due to class imbalance in the sessions, which included 591 aerobic, 590 interval, and 635 resistance exercise sessions, a class-weighted loss function was applied to address this issue. The class weights were defined as the inverse of the normalized training set counts.
The training was conducted using the TensorFlow/Keras framework in Python, employing the Adam optimizer and utilizing a loss function suitable for multiclass classification with sparse labels, specifically the Categorical Crossentropy. The models were trained for 100 epochs with a batch size of 16. Additionally, a “callback” function was implemented to stop the training when the validation performance started to decrease in order to avoid overfitting.
Results and Discussion
This section presents the performance evaluation of the developed CNN-based activity type classifiers. The results include their performance on structured exercise sessions using both the 30-min and the 5-min classifiers. Additionally, the variable-duration real-time 5-min classifier is validated using unstructured PA data.
Classifiers performance on structured sessions
The proposed classifiers performance is evaluated using the Dataset SS test subset. The overall accuracy, which is the percentage of correct predictions over the total number of samples, is reported. The “recall” for each class is also provided, representing the percentage of correct predictions for a given class according to the true label. Additionally, the confusion matrix is presented, displaying the counts of exercise sessions classified by the model versus the true labels of those sessions.
The confusion matrices for the 30- and 5-min spectrogram-based classifiers are presented in Tables 1 and 2, respectively. The 30-min classifier achieved an overall accuracy of 82.5%, with class-specific recalls of 80.5% for aerobic, 74.1% for interval, and 92.1% for resistance exercise. This demonstrates the model's ability to accurately identify the different exercise types from the 30-min spectrograms. When transitioning to the computationally efficient 5-min variable-duration online classifier, the recall for interval sessions remained consistent at 72.4%. Resistance sessions showed an improvement, achieving a recall of 94.4%. However, a slight decrease was observed for aerobic sessions, with a recall of 65.3%, resulting in an overall score of 77%.
Confusion Matrix Showing the Predicted Class by the 30-Min Spectrogram Exercise Type Classifier Versus the True Class on the Test Set

Confusion Matrix Showing the Predicted Class by the 5-Min Spectrogram Exercise Type Classifier Versus the True Class on the Test Set

Although the recall for aerobic sessions decreased compared with the 30-min case, the value remains comparable to those reported in other studies, while achieving higher recall for interval and resistance classes.15,27 Furthermore, aerobic sessions misclassified as nonaerobic are predominantly categorized as interval sessions, which have a similar impact on glucose levels, particularly in the T1DEXI case study, as shown in the previous subsections. Only 6.8% of aerobic sessions are misclassified as resistance, whose effect on glucose levels is expected to be either neutral or slightly elevating.
The analysis of the
Distribution of
Summary of

CGM, continuous glucose monitoring; SD, standard deviation.
It is important to highlight that even though the 5-min classifier provides useful information that has the potential to improve glucose control, considering the immediate effect of exercise, the 30-min classifier is also relevant due to the long-term effect of PA on glucose metabolism.
Validation for unstructured sessions
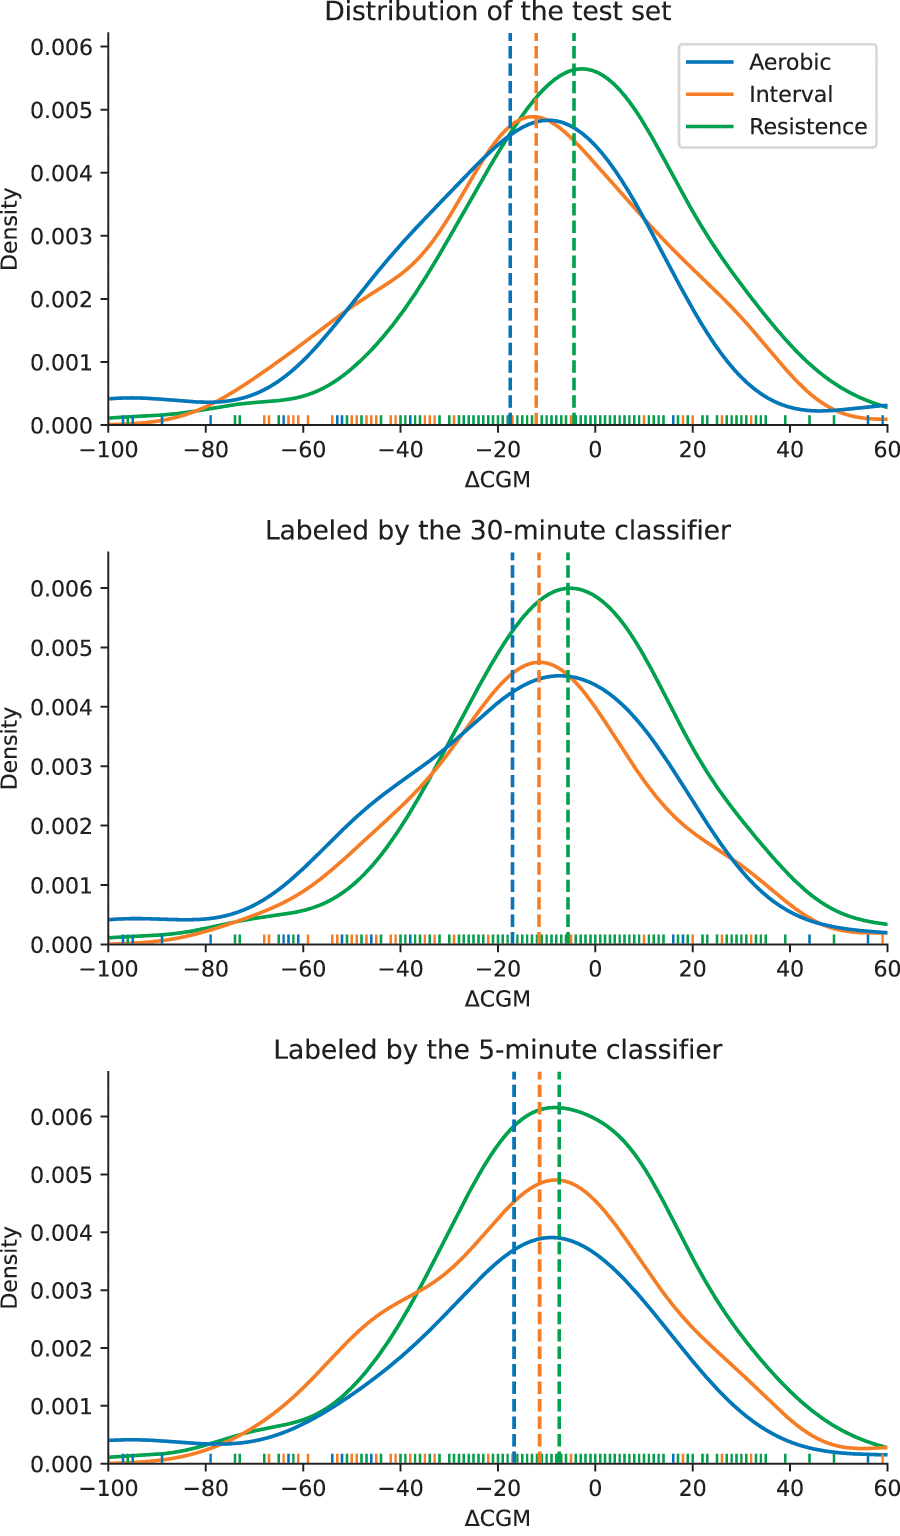
The 5-min online classifier is also validated on unstructured PA sessions using the Dataset US, which contains sessions of various durations. For these unstructured sessions, which were not used for training, the classification is based on the most frequently selected class by the CNN throughout the session. The unstructured sessions typically lack a predefined protocol and fixed duration, and they were labeled by the participants themselves based on the activity they performed. Examples of the self-categorized activities in Dataset US include Walking, Weightlifting, Biking, and various other daily activities or sports. These sessions inherently carry a higher degree of uncertainty due to variations in activity intensity (e.g., two individuals may walk or cycle at different speeds), regularity (the activity could be performed at a consistent intensity or include periods of higher and lower intensity), and, naturally, duration.
The mean glucose change and the statistical differences between the labeled activity classes are evaluated, in addition to the label provided by the patient. The distribution of

Distribution of
Table 4 presents data for various sessions based on the patients’ reported labels. For this analysis, only activities with at least 100 reported cases were selected to ensure a representative and consistent dataset. The table includes, from left to right, the total number of sessions, the number (and percentage) of sessions classified as aerobic, interval, and resistance, followed by the mean and SD of
Analysis of Self-Reported Activity Categories from Unstructured Sessions: Percentage of Sessions Assigned to Each Exercise Class by the 5-Min Online Spectrogram Classifier, and the Corresponding Mean ± SD of the Glucose Change (

The observed patterns in
It is reasonable to suppose that an announcement of the exercise event by the user with an activity category could aid the proposed method in providing a preliminary classification. That is, if the user reported Walking as the activity, a preliminary class could be aerobic. Nonetheless, Table 4 demonstrates that, for instance, 79.0% of the sessions labeled as Walking were actually classified as aerobic. Meanwhile, 17.9% of the Walking sessions were classified as resistance. The mean
It is worth noting that the choice between the 5- and 30-min classifiers depends on the application’s objectives and the activity duration being analyzed. The 5-min spectrogram-based classifier proves useful in the context of an AID, where online adjustments of insulin administration are needed, as well as for activities with indefinite durations. Conversely, the 30-min classifier, which demonstrated superior performance in the classification of fixed-duration sessions, could be more suitable for analyzing the long-term exercise effects. This is particularly relevant given that the residual exercise impact on glucose levels can persist for up to 24 h postactivity. 7 Moreover, considering the clinical recommendation of 150 min of PA per week, typically distributed as 30-min sessions on weekdays, 7 the 30-min classifier is better suited for these fixed-duration activities and postactivity evaluations.
It is important to note that the proposed classification approach offers practical advantages in terms of computational efficiency and real-time capabilities. Recent studies have demonstrated the feasibility of deploying CNN architectures on low-power computing devices for various applications, 38 including spectrogram-based audio classification tasks. 39 Compared with RNNs, like LSTMs, the feedforward structure of CNNs results in lower computational complexity, making them more suitable for deployment in practical, real-world scenarios where rapid, low-latency inference is crucial. Furthermore, the use of spectrograms as the input representation has been shown to be feasible on low-power devices. This suggests that the CNN-based activity recognition classifier, utilizing spectrogram-based feature extraction, can be effectively implemented in resource-constrained settings, such as sports wearable devices or insulin pumps, while maintaining real-time performance.
Conclusions
A CNN-based classifier capable of accurately identifying the type of PA (aerobic, interval, resistance) performed by individuals with T1D was proposed and validated with the largest clinical trial of PA in T1D to date. The 30-min spectrogram-based classifier achieved an overall accuracy of 82.5% on structured sessions, demonstrating the model’s ability to effectively distinguish between the different exercise modalities. To enable variable-duration real-time applications, the methodology was extended to a computationally efficient 5-min online classifier, which maintained a good global accuracy of 77% on the structured session test set. Additionally, when applied to unstructured PA sessions, the
The methodology for generating spectrograms and designing the CNN architecture constitutes a valuable contribution, serving as a foundation for optimizing performance and advancing the construction of spectrogram-based classifiers. Furthermore, the low computational requirements of the real-time classifier make it suitable for deployment in resource-constrained settings, such as wearable devices.
The observed consistency between the predicted activity types and their associated glycemic responses highlights the classifier’s potential impact on PA management, offering a step forward to enable real-time exercise guidance and control for individuals with T1D.
Nevertheless, the proposed methodology assumes prior announcement or detection of activity initiation, which could limit its applicability in unstructured settings. As a future direction, incorporating a “no PA” class could enhance the classifier's robustness and broaden its use in diverse contexts, or using an exercise detector.15,40
Next steps should prioritize the integration of this technology into real-time clinical systems, validating its performance across diverse populations and settings. These efforts will harness the potential of CNN-based activity classifiers to improve glucose management and advance care in T1D.
Authors’ Contributions
M.D.S.: Conceptualization, writing—original draft, methodology, validation, formal analysis, investigation, data curation, and visualization. F.A.I., E.F., and F.G.: Conceptualization, writing—review and editing, supervision, and funding acquisition. All authors read and approved the final article.