
Abstract
The aeropalynological investigations conducted across the trans-Gomti region of Lucknow provide a comprehensive understanding of the airborne pollen and fungal spores in an urban environment. Seasonal sampling revealed that arboreal taxa dominated during the summer, while non-arboreal elements, particularly grasses and fungal spores, were more prevalent during the post-monsoon period. The consistent detection of airborne pollen types such as Emblica officinalis, Madhuca indica, Moraceae, Pinus, Syzygium cumini and herbaceous taxa including Poaceae, Chenopodiaceae, Artemisia and Ageratum conyzoides, along with fungal spores, underscores the city’s high aeroallergen load. These findings highlight the significant influence of local vegetation, climatic factors and anthropogenic activities on airborne pollen distribution and concentration. The study establishes an important baseline for understanding the aeroallergen dynamics of Lucknow, which can aid in developing region-specific pollen calendars and allergy forecasting models. This research thus bridges aerobiology, environmental monitoring and public health, contributing valuable data for allergy management and ecological assessment.
INTRODUCTION
Palynology is the study of pollen and spores (Faegri & Iversen, 1989). It is an important discipline for fields ranging from forensic science to allergy research (Kamygina et al., 2021; Mildenhall et al., 2006; Stephen, 2014). Pollen consists of specialised microspores essential to plant fertilisation (Carrizo García et al., 2017). These microscopic, resistant structures enclose the male gametophyte of seed plants and are adapted for dispersal to ensure pollination and reproduction (Bush, 1989; Solomon, 1984). Airborne pollen and fungal spores constitute the most important allergen load in the air (Singh & Kumar, 2002), with their atmospheric presence strongly influenced by meteorological factors (Mandrioli & Negrini, 1991).
The growing incidence of pollen-associated allergic diseases remains an important public health issue (Ezikanyi et al., 2018; Ravindra, Singh, et al., 2021). Allergic asthma and seasonal allergic rhinitis (hay fever) are significant global health concerns (Kamygina et al., 2021), affecting approximately 400 million people worldwide (Nur Husna et al., 2022). It is estimated that 10%–30% of the global population is affected by seasonal allergic rhinitis (World Allergy Organization, 2013), and up to 40% is sensitised to at least one allergen (Pawankar et al., 2013). The interaction of airborne pollen with climatic variables and air pollutants is also correlated with asthma-related hospitalisations and overall allergic disease severity (Ghosh et al., 2012; Ravindra et al., 2022). This chronic burden severely impacts the quality of life and productivity (Melzer, 2016; Melzer et al., 2009).
India is also witnessing a marked escalation in allergenicity from ~10% to 30% over the past four decades (Sharma et al., 2006). Pollinosis in India is primarily caused by a diverse range of aeroallergens, often dominated by grass pollen (Poaceae) and specific weed pollen like Chenopodiaceae and Artemisia (Verma et al., 2024). Regional assessments in Uttar Pradesh further implicate grasses and major arboreal trees such as Azadirachta indica and Holoptelea integrifolia as primary sources of respiratory allergies (Agnihotri & Singh, 1971; Khandelwal, 2002). Despite these efforts, continuous long-term monitoring of airborne pollen in many Indian cities remains limited, emphasising the need for localised aerobiological investigations to better understand allergen dynamics and support effective public health management.
The primary causes of pollinosis exhibit distinct regional patterns. In Europe, grass pollen (Poaceae) represents the leading allergens, with its season extending from spring to autumn. Birch (Betula) pollen is also a major trigger across Northern and Central Europe, producing large amounts of pollen and causing rhinitis and asthma symptoms (Biedermann et al., 2019; D’Amato et al., 1998). In contrast, airborne pollen from Japanese cedar (Cryptomeria japonica) is predominant in Japan (Kishikawa et al., 2017). Rainfall seasonality, particularly in the tropics, has been identified as a major factor governing flowering and fruiting patterns (Borchert et al., 2004; Boulter et al., 2006; Singh & Kushwaha, 2006). The start and end dates of pollen peaks are driven by local environmental features, including meteorological and climatic factors, air pollutants and the local airborne spectrum (Aguilera et al., 2014; Bonofiglio et al., 2008; Lo et al., 2019). Additionally, urbanisation intensifies pollen-related challenges, as soil sealing and the resulting urban heat island effect significantly alter local aerobiological dynamics (Kabisch et al., 2017, 2023; Oke, 1982).
Pollen calendars vary widely across regions due to differences in climate and vegetation (D’Amato et al., 1991). Developing a comprehensive national pollen calendar for India remains challenging because of the country’s vast geographical extent and highly diverse vegetation. However, several regional pollen calendars have been established in major cities to support clinical practice (Ravindra, Goyal, et al., 2021). These regional efforts provide valuable information for allergy diagnosis and management to capture the spatial variability in aeroallergen distribution across the country.
Lucknow, a rapidly urbanising city with declining green belts and increasing vehicular emissions, faces several environmental challenges contributing to the rise of allergic diseases (Kumar et al., 2024). The loss of green belts often leads to the replacement of native vegetation and is thus occupied by weeds and grasses that produce large quantities of airborne pollen. In addition, urban climatic conditions and elevated particulate pollution enhance the dispersal and persistence of pollen grains and fungal spores in the atmosphere. One of the major concerns is the high load of airborne pollen and fungal spores, especially during the flowering seasons (Singh & Kumar, 2002). The presence of allergenic taxa such as Prosopis juliflora (Khandelwal, 2008; Singh & Mathur, 2017), members of Poaceae, Chenopodiaceae (Agnihotri & Singh, 1971; Khandelwal, 2002) and fungal spores like Nigrospora and Alternaria (Verma et al., 2008) are key contributors to respiratory allergies such as rhinitis, asthma and skin conditions. Moreover, urban expansion frequently promotes the unregulated introduction of exotic and highly allergenic ornamental trees such as A. indica, H. integrifolia, Ailanthus excelsa, P. juliflora and several grass pollen, thereby exacerbating the aeroallergen burden (Chakraborty et al., 2016). Lack of regular pollen monitoring and public awareness adds to the chronic burden, making it difficult for sensitive individuals to take adequate preventive measures (Khandelwal, 2008).
Considering these region-specific ecological challenges, the present study seeks to establish a foundational aerobiological framework to support future assessments of airborne pollen variability. The primary goal of the study is to document the diversity and density of seasonal airborne pollen and non-pollen palynomorphs (NPPs) to establish a comprehensive local aerobiological profile. By analysing airborne pollen assemblages during major pollination months, this study seeks to determine the clinical significance of specific local allergens by correlating their atmospheric concentrations with the reported incidence and severity of allergic symptoms among the local population. Furthermore, the research seeks to evaluate the underlying drivers of allergen distribution by analysing the influence of environmental factors, such as local climate, and by assessing how urban changes, including expansion and the introduction of new plant species, impact the overall allergen load and subsequent health burden on the people of Lucknow.
STUDY AREA
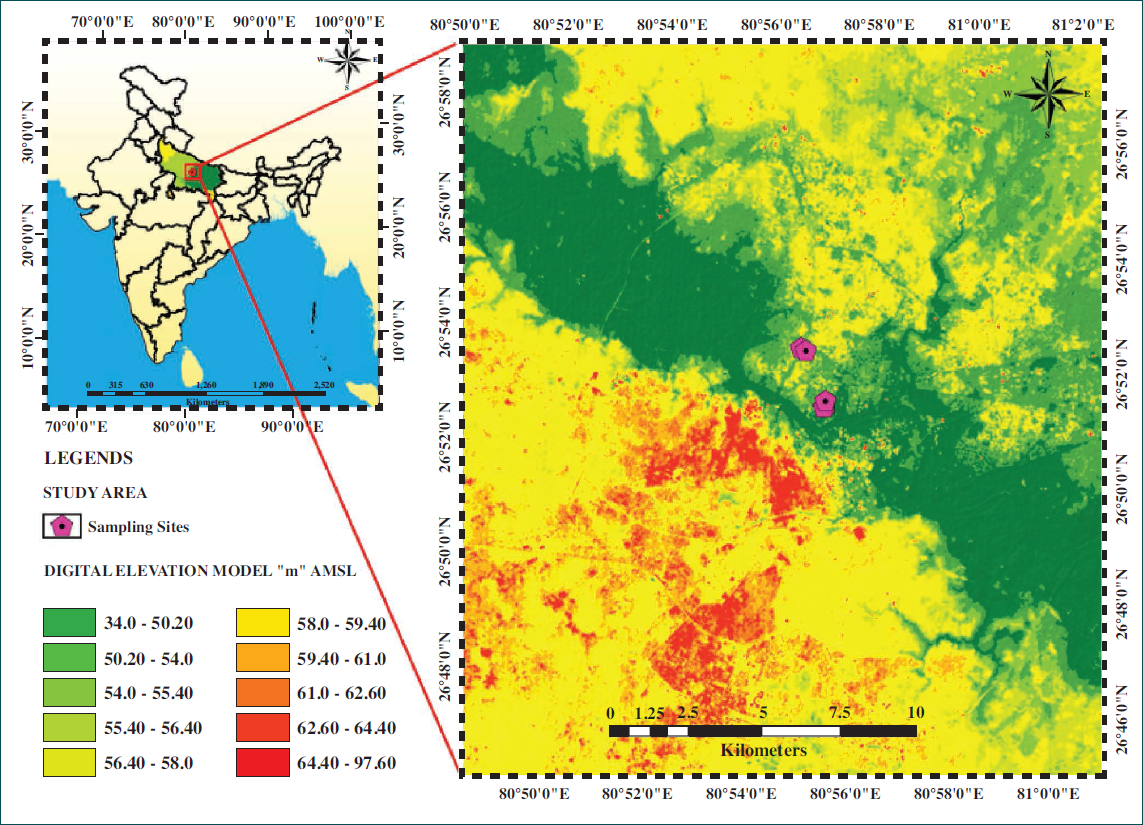
Lucknow is the capital and one of the largest cities of Uttar Pradesh, situated at approximately 26°30′ N to 27°10′ N latitude and 80°30′ E to 81°13′ E longitude (Bera et al., 2002; Government of Uttar Pradesh, 2023). Lucknow’s main geographic feature is the Gomti River, which flows through the city and divides it into the cis-Gomti and trans-Gomti regions (Krishan et al., 2022). The city lies at an elevation of 123 m above mean sea level (Yaseen et al., 2014). Geologically, Lucknow is situated in the central Gangetic Plain, characterised by thick Quaternary alluvial deposits with alternating layers of sand, silt and clay (Figure 1) (Singh et al., 2019; Yadav, 2012). The soil is dominantly Indo-Gangetic alluvium, characterised by high fertility and a sandy-loam texture (Dwivedi et al., 2025).
Digital Elevation Model (DEM) Showing the Locations of the Study Sites in Lucknow City, Central Ganga Plain, Uttar Pradesh, India.
CLIMATE
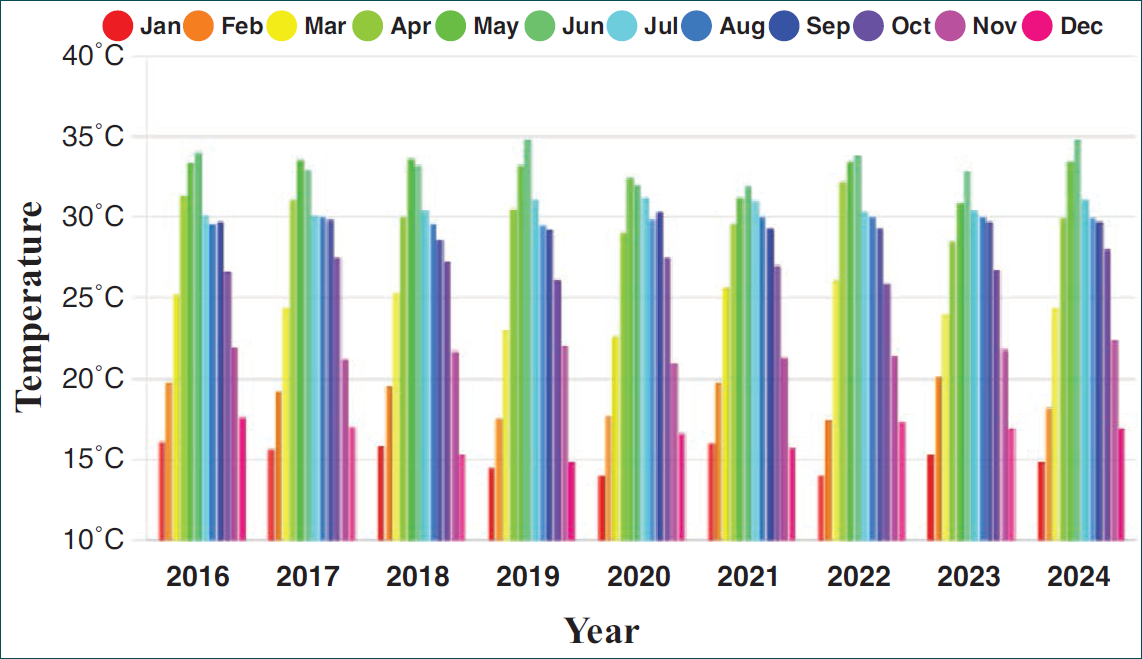
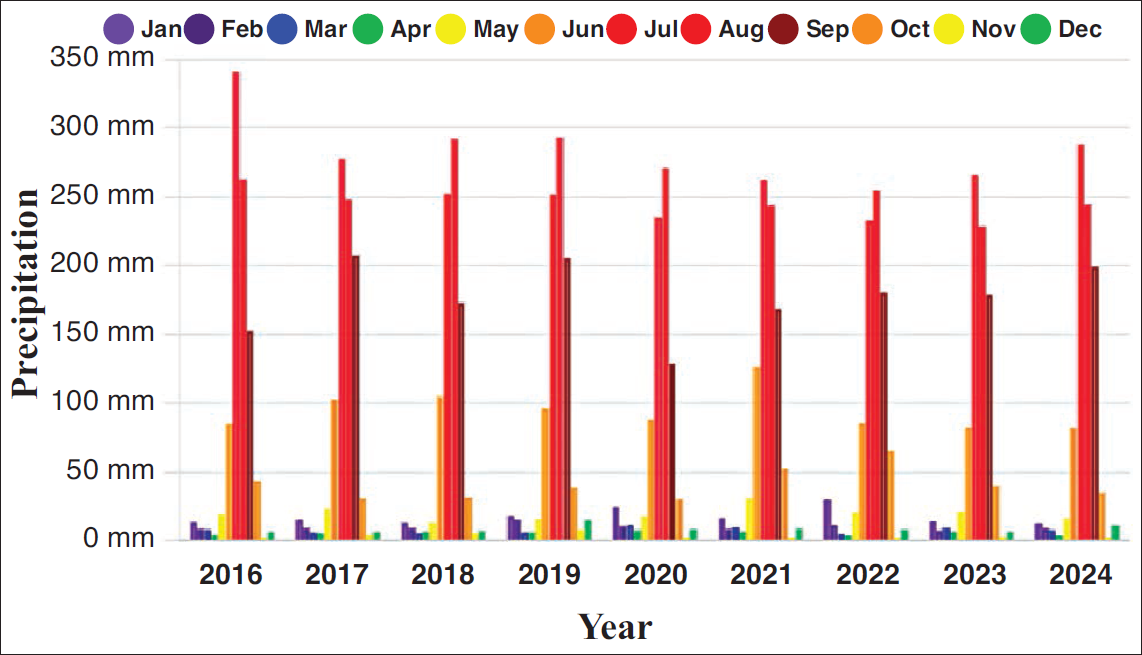
The climate of the study area is classified as humid tropical to subtropical, largely influenced by the southwest monsoon (Trivedi et al., 2016, 2019). The regional climate exhibits three distinct seasons, namely winter, summer and monsoon, each characterised by specific environmental conditions. The winter period, from November to February, is characterised by minimum temperatures averaging 3°C–7°C and maximum temperatures around 25°C, with the lowest temperature descending to 1°C in January (Bera et al., 2002; Pandey et al., 2012). Dense fog is a common meteorological phenomenon during the coldest months of December and January (Prathima & Satyanarayana, 2025). Summers, spanning from April to June, are extremely hot, marked by strong, dry, hot winds, often leading to temperatures averaging a minimum of 30°C and a maximum ranging from 40°C to 45°C (Bera et al., 2002; Pandey et al., 2012). The monsoon season begins in July and continues through mid-September, making the weather noticeably sultry. The mean annual rainfall for Lucknow is approximately 861.4 mm, with over 90% of the precipitation for agricultural and other water demands occurring during the peak monsoon months (June, July, August and September) (Prasanna et al., 2025). The nearest Climate Research Unit Time Series (CRU TS) 4.09, 0.5° × 0.5° gridded climate data set (2016–2024) was used to obtain mean monthly precipitation and temperature data for the study area, and the results are presented in Figures 2 and 3 (Harris et al., 2020).
Mean Monthly Temperature for Lucknow District, Uttar Pradesh, India, Derived from the Nearest Climate Research Unit Time Series (CRU TS) 4.09 Data Set (0.5° × 0.5° Spatial Resolution) for the Period 2016–2024.
Mean Monthly Precipitation for Lucknow District, Uttar Pradesh, India, Derived from the Nearest Climate Research Unit Time Series (CRU TS) 4.09 Data Set (0.5° × 0.5° Spatial Resolution) for the Period 2016–2024.
PRESENT VEGETATION
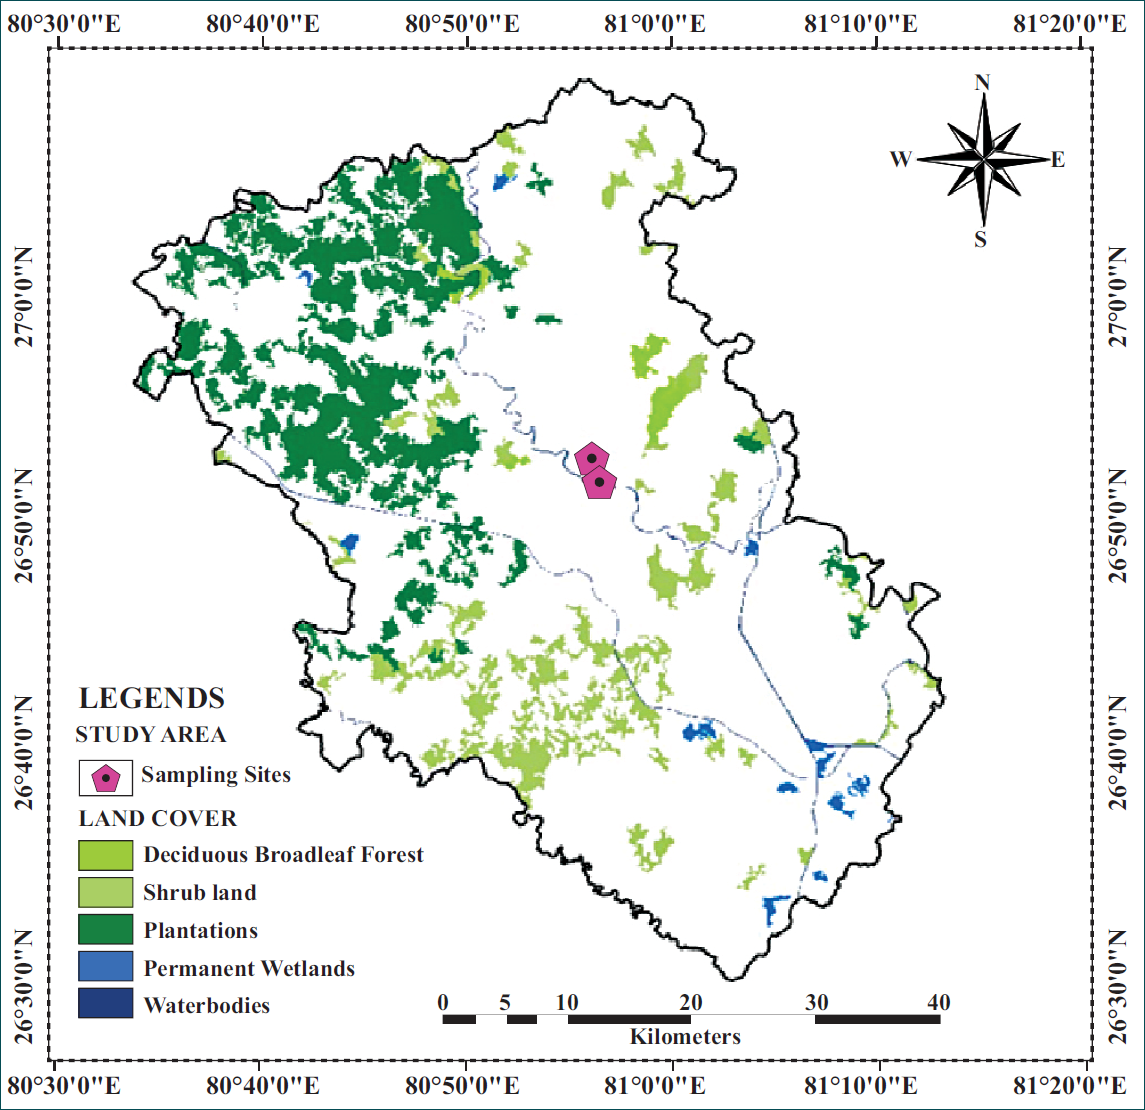
The vegetation of Lucknow primarily consists of tropical dry deciduous forest type, and fragmented scrub forests with open mixed savannahs, interspersed with extensive open grasslands (Champion & Seth, 1968) (Figure 4). Arboreal vegetation is scattered but taxonomically diverse, including species such as Acacia, Adhatoda vasica, Adina cordifolia, A. excelsa, Dalbergia sissoo, Eucalyptus, H. integrifolia, Moringa oleifera, Madhuca indica, Melia azedarach, P. juliflora and Syzygium cumini (Trivedi et al., 2014, 2016). Shrub species commonly distributed include Ziziphus mauritiana, Rhamnus sp., while Crotalaria juncea and Parthenium hysterophorus dominate the ground cover.
Vegetation and Land-cover Map of Lucknow District, Uttar Pradesh, India, Derived from Sentinel-2 Multi-spectral Instrument (MSI) Imagery with a 10 m Spatial Resolution.
Vegetation along the River Gomti is composed of thorny scrub communities with species such as A. vasica, Aegle marmelos, Capparis decidua, Calotropis gigantea, Carissa spinarum and Z. mauritiana. Within the urbanised parts of Lucknow, the natural vegetation has largely been replaced by planted and ornamental species also called Urban vegetation, including Acacia arabica, Emblica officinalis, Eucalyptus sp., M. azedarach, Parkinsonia sp., Pongamia pinnata, P. juliflora, S. cumini and Terminalia arjuna, which are commonly grown along roadsides, parks and residential colonies. In the peripheral areas of the city, vegetation is more heterogeneous and includes cultivated trees such as Artocarpus heterophyllus, M. indica, Mangifera indica and S. cumini. A significant portion of the surrounding landscape is occupied by agricultural fields. Additionally, the Kukrail Reserve Forest, located near the study area, represents a remnant patch of tropical deciduous broadleaf forest interspersed with scrub vegetation. The sampling sites used in the present study are therefore influenced by a mixture of urban plantation species, agricultural vegetation and remnant dry deciduous forest elements, which collectively contribute to the regional pollen assemblage. Herbaceous taxa are largely represented by Poaceae, along with additional members from Brassicaceae, Chenopodiaceae, Euphorbiaceae, Asteraceae, Solanaceae and Ranunculaceae (Saxena et al., 2017; Trivedi & Chauhan, 2011; Trivedi et al., 2012, 2013, 2024).
METHODOLOGY
Pollen Analysis
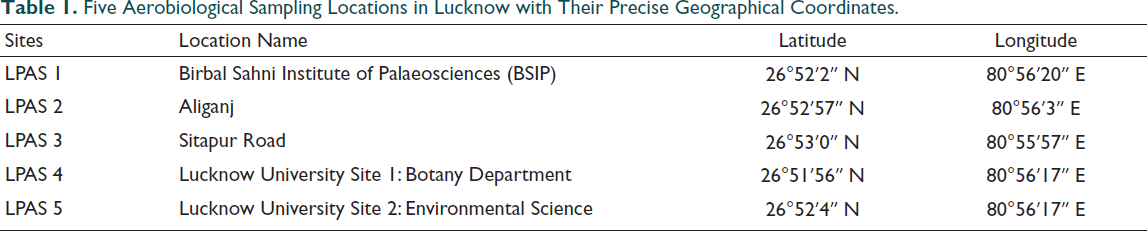
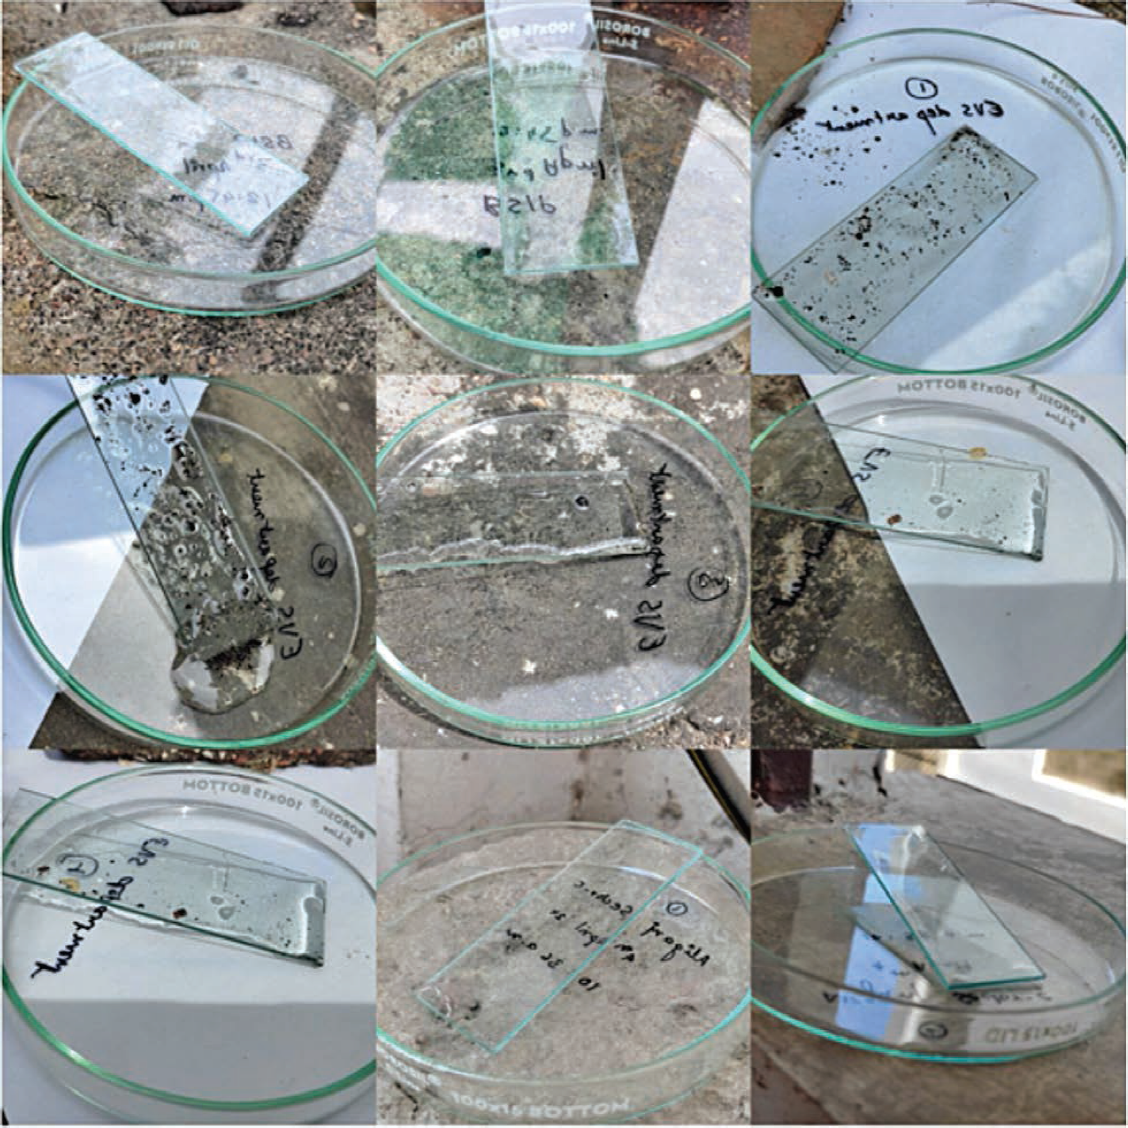
This study involved an aeropalynological seasonal dispersal study to evaluate the abundance and diversity of airborne pollen and NPPs across five sampling sites located within the trans-Gomti region of Lucknow city (Figures 1 and 5; Table 1). Sampling sites LPAS-1, LPAS-4 and LPAS-5 are situated within a few 100 m from each other, while LPAS-4 and LPAS-5 are located approximately 500 m apart. Sampling was carried out during the peak aeroallergen pollination seasons of April, May, June and September 2024. Airborne palynomorphs, including pollen and NPPs, were collected using the Petri dish method (Pang et al., 2025), which relies on gravity and wind impaction. Glass Petri dishes coated with pure glycerine, were exposed for a week on the open terrace (rooftop) of the respective buildings at each sampling site (Figure 6), positioned at approximately 1.5 m above the terrace floor to collect airborne particles. This systematic collection yielded a total number of 80 samples (5 sites × 4 weeks × 4 months).
Five Aerobiological Sampling Locations in Lucknow with Their Precise Geographical Coordinates.
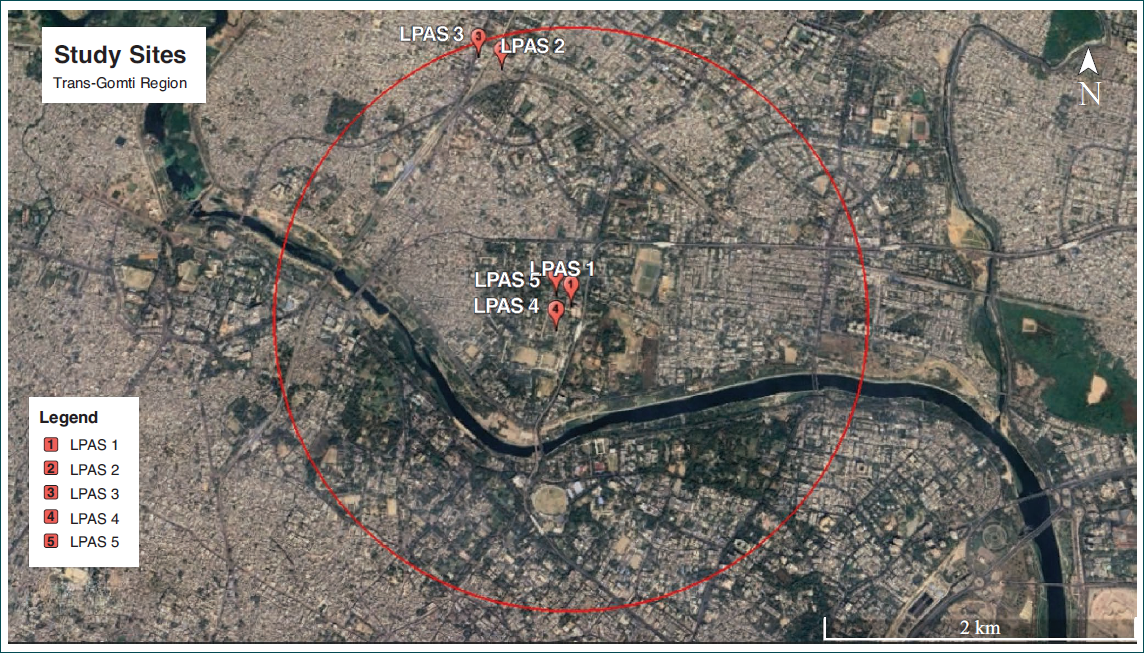
Google Earth Imagery Illustrating the Location and Spatial Distribution of the Sampling Sites in Lucknow District, Uttar Pradesh, India.
Photographs Illustrating the Aeropalynological Sampling and the Glass Petri Dish Coated with Glycerine Used for Airborne Pollen Collection During the Study in Lucknow District, Uttar Pradesh, India.
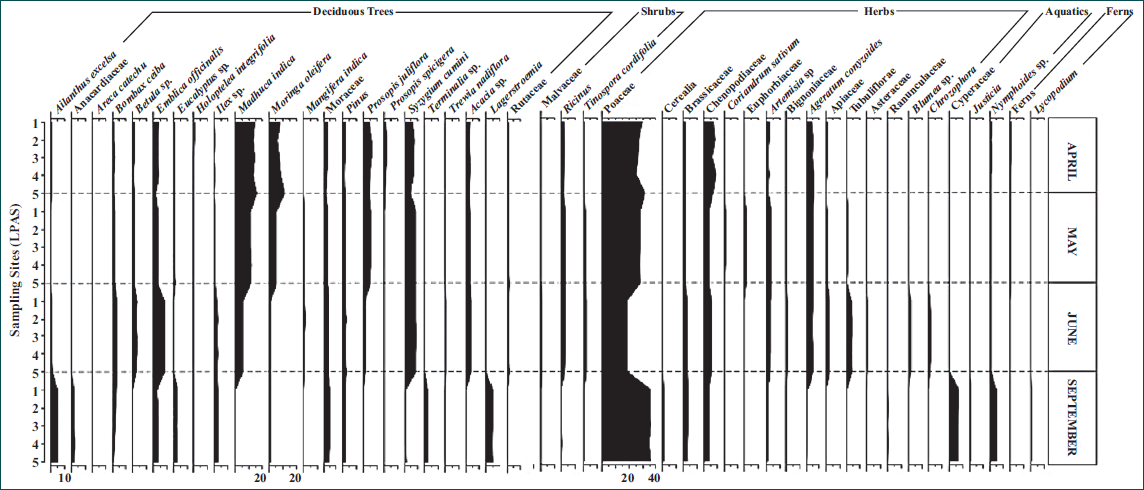
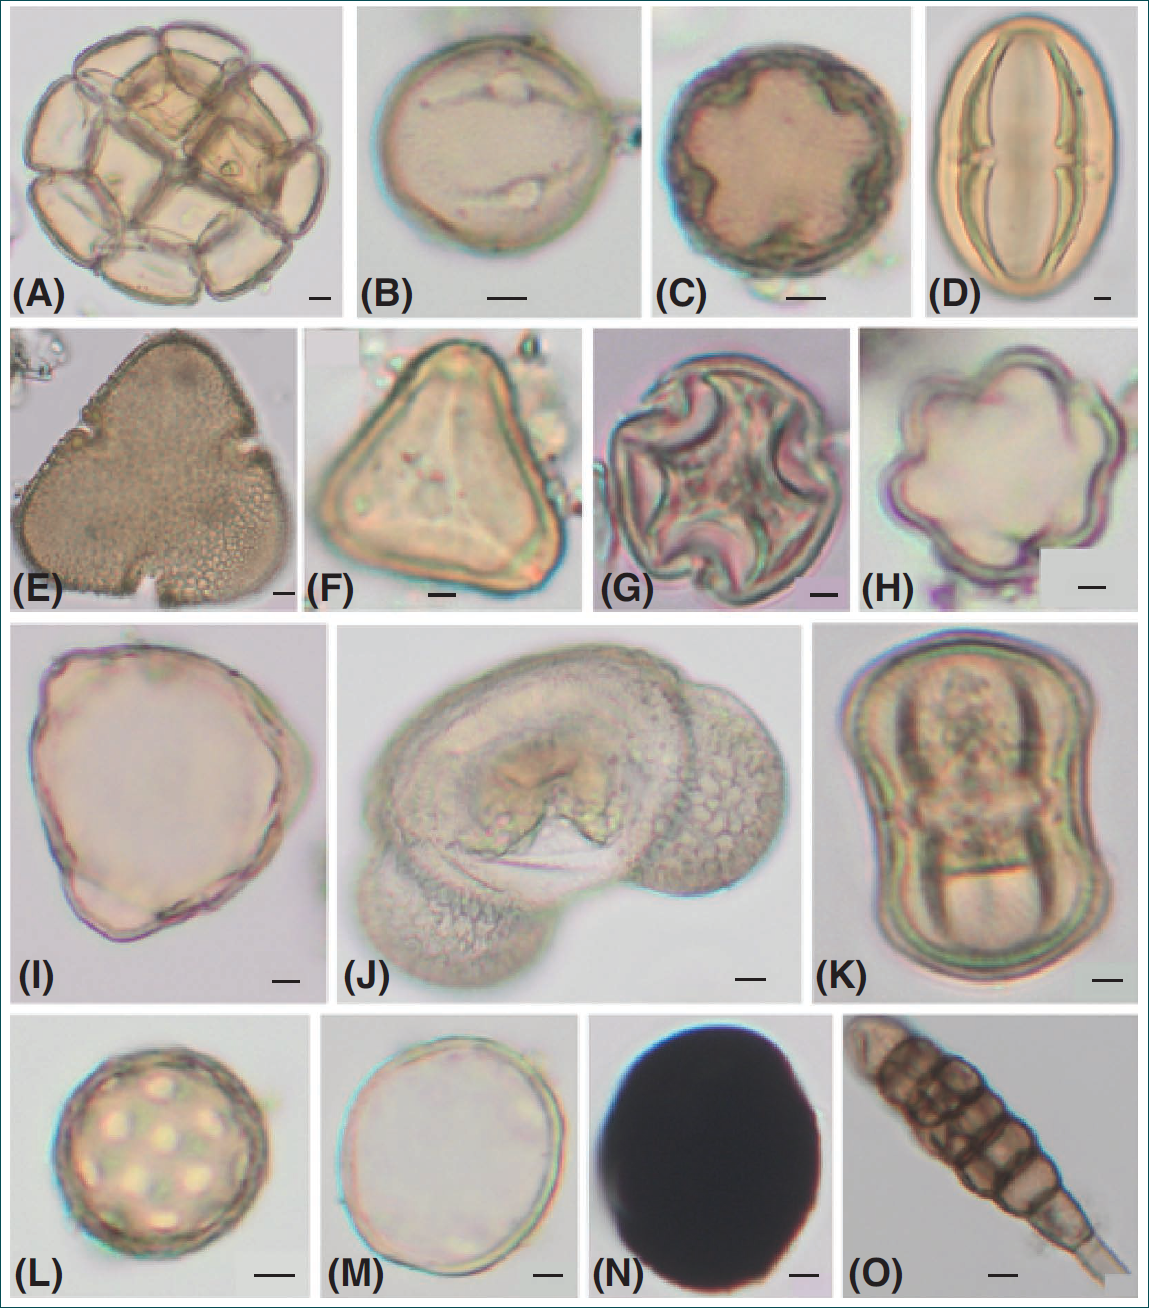
Post-exposure, the samples underwent acetolysis using a 9:1 mixture of acetic acid and concentrated sulphuric acid (Erdtman, 1954), followed by treatment with glacial acetic acid, and subsequently washed three times with distilled water through centrifugation and decantation to remove residual reagents. Samples were then preserved in a solution of glycerine and phenol to effectively inhibit microbial growth. Pollen and spore identification was performed under an Olympus BX52 microscope equipped with an Olympus DP23 camera at ×400 magnification (Plate 1). The pollen counts ranged between 300 and 500 grains per sample, depending on pollen productivity and preservation. Weekly samples collected from each site were combined to obtain a cumulative monthly representation for each site, resulting in 20 pollen spectra (5 sites × 4 months) (Figure 7). The pollen diagram was prepared using Tilia software (Grimm, 1993). Reference slides from the Birbal Sahni Institute of Palaeosciences (BSIP) sporothek, along with published literature, were used for identification (Chauhan & Trivedi, 2011; Saxena et al., 2017; Trivedi & Chauhan, 2011; Trivedi et al., 2013, 2023, 2024).
Frequency Distribution Diagram of Arboreal Pollen of the Study Sites in Lucknow City, Central Ganga Plain, Uttar Pradesh, India.
RESULTS
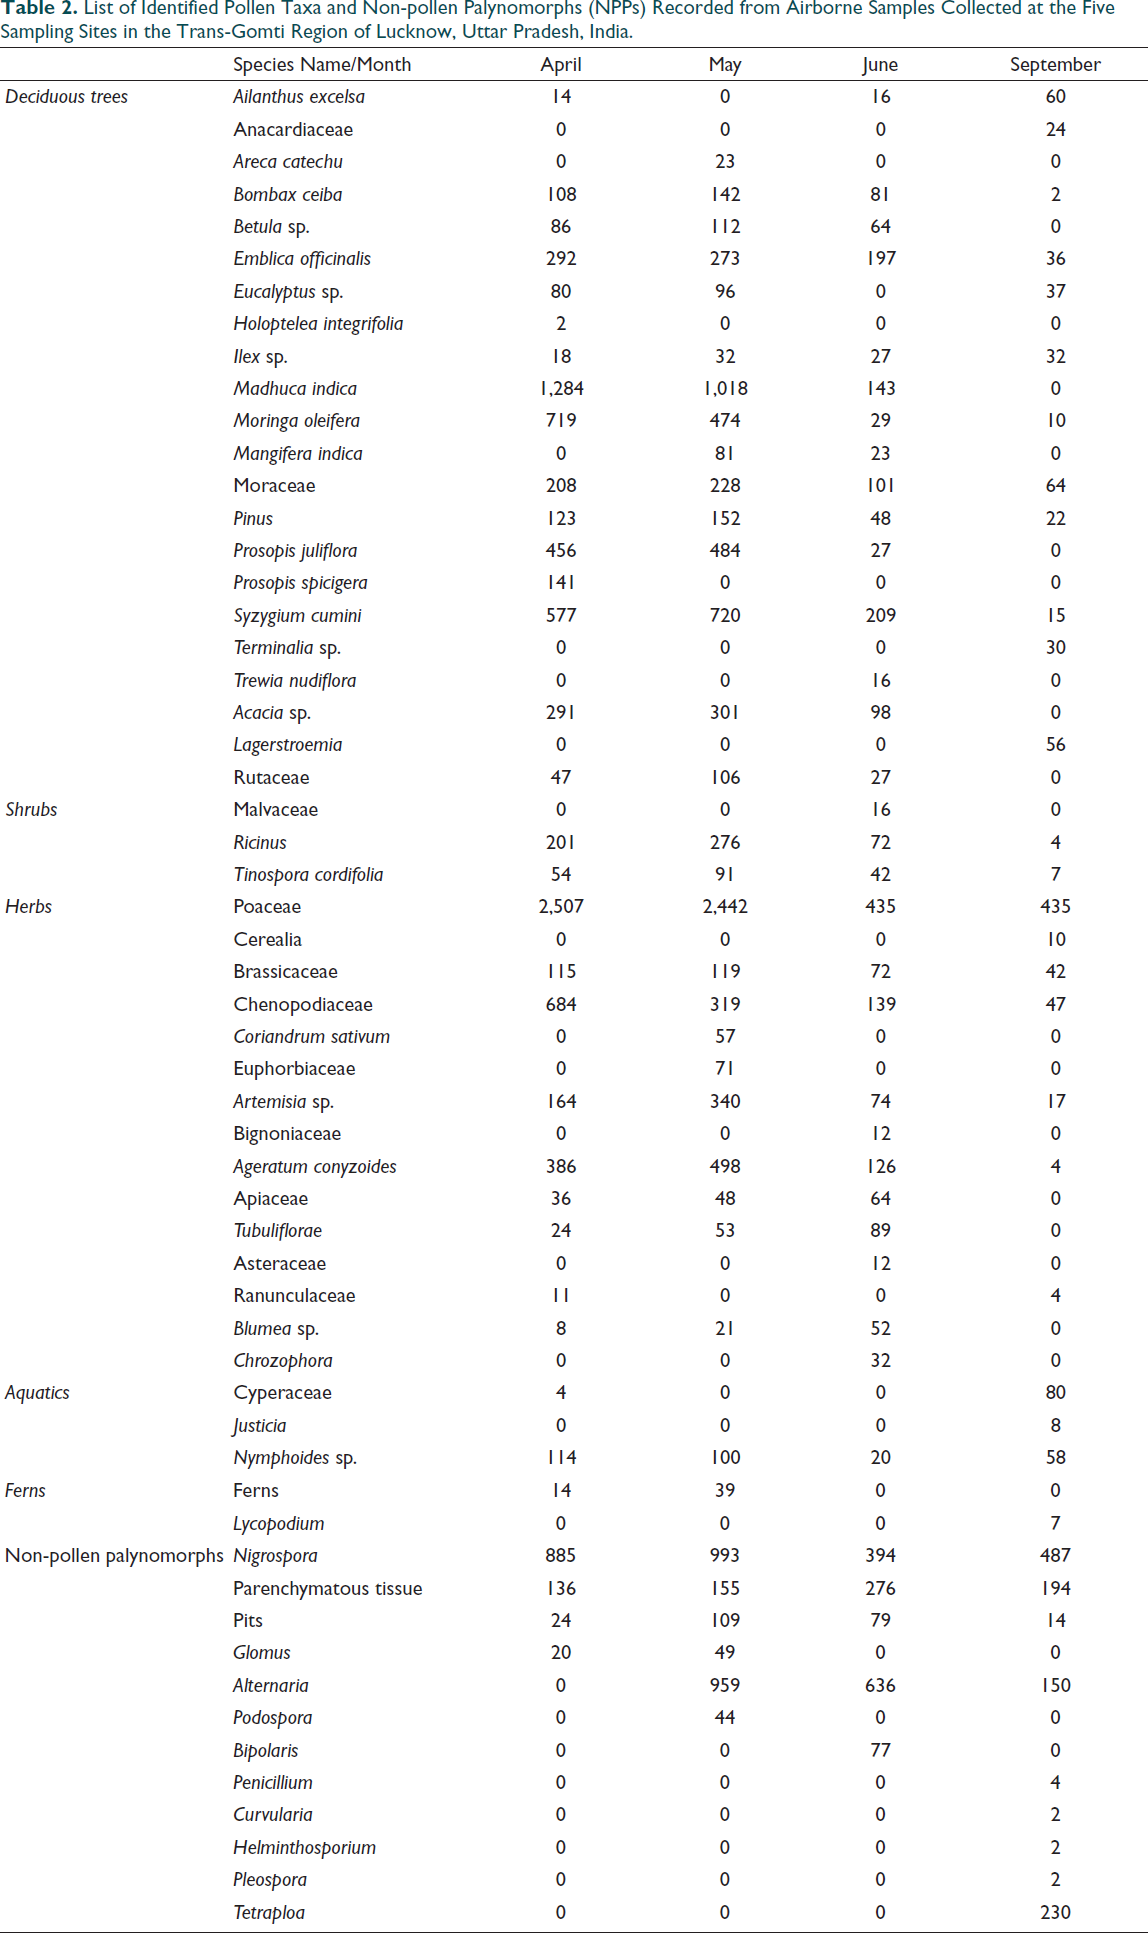
The aeropalynological analysis of airborne samples from five sites in the trans-Gomti region revealed the seasonal abundance and diversity of pollen and NPPs, providing insights into the local vegetation dynamics and aeroallergen spectrum across Lucknow city. The detailed distribution and representation of the identified pollen and NPP taxa across the sampling sites are summarised in Table 2.
List of Identified Pollen Taxa and Non-pollen Palynomorphs (NPPs) Recorded from Airborne Samples Collected at the Five Sampling Sites in the Trans-Gomti Region of Lucknow, Uttar Pradesh, India.
Distribution of Aeropalynological Profiles Across Different Seasons
April
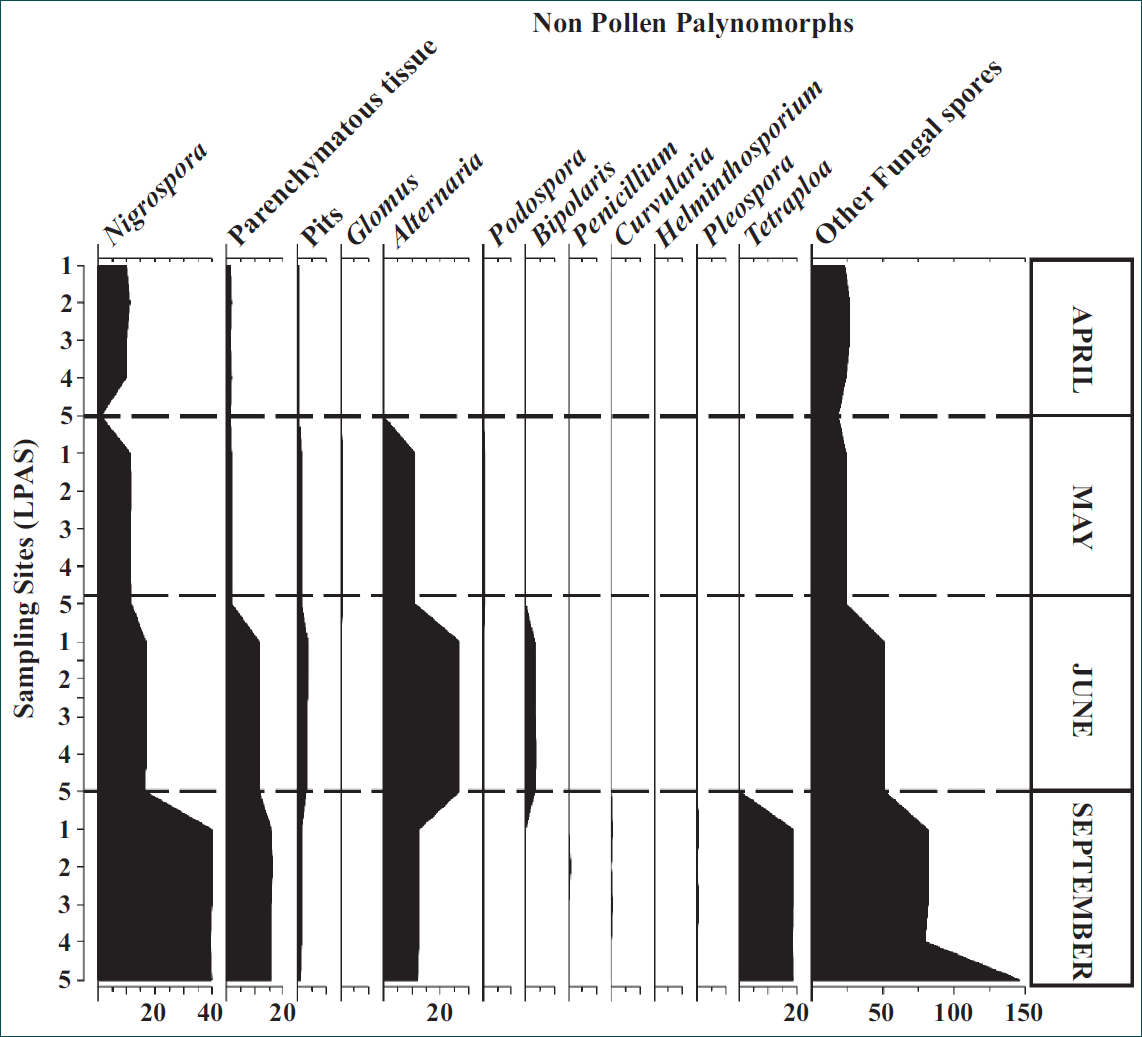
The palynological assemblage recorded across the study sites during April indicates a predominance of arboreal pollen (AP) (~52%) over non-AP (NAP) (~47%). Among the AP, deciduous taxa such as M. indica (14.3%), M. oleifera (8.2%), E. officinalis (3.2%), Moraceae (2.2%), P. juliflora (5.1%), Pinus (1.4%), Prosopis spicigera (1.5%) and S. cumini (6.3%) were the major contributors (Figure 7; Plate 1). Shrubby elements were represented mainly by Acacia (3.1%) and Ricinus (2.2%). Within the NAP, Poaceae was dominant (~28%), followed by Chenopodiaceae (7.7%), Brassicaceae (1.3%), Artemisia (1.8%) and Ageratum conyzoides (5.6%). Aquatic taxa such as Nymphoides (1.2%) and a minor representation of Cyperaceae were also noted. Fern spores constituted approximately 0.85%. Among fungal spores, Nigrospora (8.3%) was the most frequent type (Figure 8), accompanied by parenchymatous tissues (1.6%).
Frequency Distribution Diagram of Non-arboreal Pollen of the Study Sites in Lucknow City, Central Ganga Plain, Uttar Pradesh, India.
May
The palynological assemblage recorded during May exhibits values of AP (~52%) and NAP (~48%). Within the AP, dominant arboreal taxa include Bombax ceiba (1.6%), Betula (1.3%), E. officinalis (3.1%), Eucalyptus (1.1%), M. indica (11.7%), M. oleifera (5.4%), Moraceae (2.6%), Pinus (1.7%), P. juliflora (5.4%) and S. cumini (8.2%). Shrubby components are represented mainly by Acacia (3.4%), Ricinus (3.2%) and Rutaceae (1.2%). Among the herbaceous taxa, Poaceae remains dominant (~28%), followed by Brassicaceae (1.4%), Chenopodiaceae (3.7%), Tinospora cordifolia (1%), Artemisia (3.9%) and A. conyzoides (5.7%). Marshy taxa such as Nymphoides (1.1%) were also recorded, while fern spores contributed around 0.45% to the total assemblage. Within the NPPs category, fungal spores were well represented, with Nigrospora (11.4%) and Alternaria (11%) being the most frequent, accompanied by parenchymatous tissues (1.8%) and minor occurrences of Podospora and Glomus.
June
The palynological assemblage recorded during June shows a predominance of AP (~51%) over NAP (~49%). Among the arboreal taxa, B. ceiba (3.4%), Betula (2.7%), E. officinalis (8.3%), Ilex (2.1%), M. indica (6%), M. oleifera (1.2%), Moraceae (4.2%), Pinus (2%), P. juliflora (1.2%) and S. cumini (8.8%) were the principal contributors. The shrubby component comprised Acacia (4.1%), Ricinus (3%), Rutaceae (1.2%) and Malvaceae (0.6%). Poaceae remained dominant (18.3%) among herbs, followed by Brassicaceae (3%), Chenopodiaceae (5.8%), T. cordifolia (1.7%), Artemisia (3%), A. conyzoides (5.3%), Apiaceae (2.7%), Tubuliflorae (3.7%), Blumea (2%) and Chrozophora (1.3%). Aquatic taxa such as Nymphoides were present in trace amounts. Fungal spores, particularly Alternaria (27%) and Nigrospora (16.5%), along with parenchymatous tissues (11.6%) and Bipolaris (3.3%), are present in good amounts.
September
The pollen assemblage during September exhibited a marked dominance of NAP (~58%) over AP (~41%). Among tree taxa, A. excelsa (5%), Anacardiaceae (2%), E. officinalis (3%), Eucalyptus (3%), Ilex (2.5%), Moraceae (5.2%), Pinus (1.8%), S. cumini (1.3%) and Terminalia (2.5%) were represented. Shrubby taxa were characterised by Lagerstroemia (4.7%), whereas among herbaceous taxa, Poaceae (35.5%) dominated, accompanied by minor proportions of Cerealia (0.9%), Brassicaceae (3.4%), Chenopodiaceae (3.9%) and Artemisia (1.5%). Aquatic taxa included Cyperaceae (6.5%), Nymphoides (4.8%) and Justicia (0.7%), while Lycopodium spores occurred in trace amounts. Fungal spores such as Nigrospora (40%), parenchymatous tissue (16%), Alternaria (12%) and Tetraploa (18.7%) showing considerable representation.
DISCUSSION
The aeropalynological study from the trans-Gomti region of Lucknow shows clear seasonal changes in the diversity and concentration of airborne pollen and other microscopic particles, reflecting the combined influence of vegetation patterns, meteorological parameters and urban land-use dynamics. The wide range of pollen types recovered indicates that the city’s atmosphere receives inputs from multiple floral sources spread across its green spaces, gardens and surrounding areas.
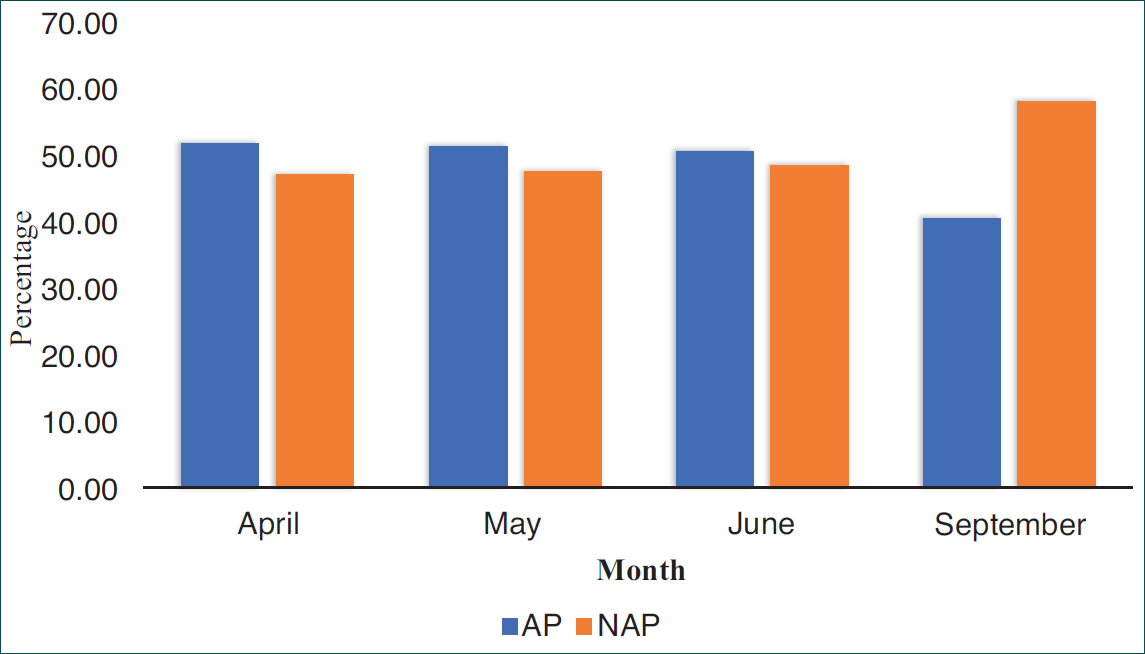
The pollen assemblage indicates a dominance of AP during the pre-monsoon months of April, May and June, whereas NAP became more prevalent in September, corresponding to the post-monsoon season (Figure 9). This shift is attributed to increased herbaceous vegetation cover following rainfall, along with the concurrent rise in fungal spore abundance. Notably, Poaceae pollen showed a relative decline during June but increased markedly in September, coinciding with the onset of monsoon-induced grass growth.
Arboreal Pollen (AP) and Non-AP (NAP) Percentages, Recovered from the Study Sites in Lucknow City, Central Ganga Plain, Uttar Pradesh, India.
(A) Acacia sp. (B) Rutaceae (C) Emblica officinalis (D) Prosopis juliflora (E) Bombax ceiba (F) Syzygium cumini (G) Mangifera indica (H) Terminalia sp., (I) Ricinus (J) Pinus (K) Apiaceae (L) Chenopodiaceae (M) Poaceae (N) Nigrospora (O) Alternaria.
At sampling sites LPAS-1, LPAS-4 and LPAS-5, which are located in close proximity, the dominant airborne pollen during April–June includes B. ceiba, Betula sp., E. officinalis, M. indica, M. oleifera, Moraceae, Pinus, P. juliflora, P. spicigera and S. cumini. In contrast, during September, taxa such as A. excelsa, Anacardiaceae, B. ceiba, E. officinalis, Eucalyptus sp., Ilex sp., Moraceae and Terminalia sp. show higher representation.
At LPAS-2 and LPAS-3, dominant pollen taxa during April–June include B. ceiba, E. officinalis, Eucalyptus sp., M. indica, M. oleifera, Moraceae, P. juliflora and S. cumini. During September, however, A. excelsa shows a notable increase, along with members of Anacardiaceae, B. ceiba, Eucalyptus sp. and Terminalia sp., while E. officinalis shows a marked decline.
Aeropalynological records from Uttar Pradesh and the Indian subcontinent remain relatively limited. However, several previous aerobiological investigations across India have also documented a wide range of allergenic pollen such as P. juliflora, A. conyzoides, A. excelsa, Amaranthus, Anogeissus pendula, Artemisia, Cassia siamea, Cenchrus ciliaris and Cedrus deodara as major allergenic pollen types prevalent in different parts of the country (Kasliwal & Solomon, 1958; Rawat et al., 2000; Shivpuri et al., 1979). Singh et al. (1987) recorded positive skin responses to Pinus roxburghii in patients from the Himalayan foothills. Studies from Northern India have further recognised Ricinus communis, Morus alba, Alnus, Quercus, Argemone mexicana, Amaranthus, Chenopodiaceae, Holoptelea and Poaceae as dominant contributors to seasonal allergic conditions (Agnihotri & Singh, 1971; Gupta et al., 1984). Comparable research from Kanpur reported Amaranthus, Chenopodium, Holoptelea and grass pollen as the leading sensitisers (Gupta et al., 1984; Singh & Dahiya, 2008). From Central India, Brassica, Cannabis, Asphodelus, Parthenium, Cassia, Azadirachta, Poaceae, Alnus and Betula have been reported as principal allergenic sources (MOEF, 2000). From Southern India, pollen allergens reported are Ricinus, Albizia lebbeck and Artemisia scoparia (Acharya, 1980; Agashe & Anand, 1982). Additionally, fungal spores, including Cladosporium, Alternaria, Aspergillus versicolor, Curvularia, Helminthosporium and Nigrospora, are frequently associated with allergic rhinitis and asthma across India (Agashe & Anand, 1982). High concentrations of airborne pollen belonging to Asteraceae, Amaranthaceae/Chenopodiaceae, Poaceae and Cyperaceae have also been reported from central India, indicating their significant role in the regional aerobiological spectra (Mishra et al., 2002).
The present study from the Lucknow region also identified several allergenic taxa, including H. integrifolia, A. excelsa, P. juliflora, Acacia, Ricinus, Rutaceae, Poaceae, Artemisia, A. conyzoides, Asteraceae and Chrozophora. In addition to pollen, several NPPs, particularly fungal spores such as Nigrospora, Glomus, Alternaria, Podospora, Bipolaris, Curvularia, Helminthosporium, Pleospora and Tetraploa, were also recorded and constitute significant aeroallergens in the region. The seasonal occurrence of these airborne pollen grains appears to be influenced by local vegetation composition and climatic conditions, particularly by temperature and rainfall patterns that regulate flowering and pollen release, and the abundance of these aeroallergens may have implications for respiratory health among the residents of Lucknow. Ongoing urban expansion appears to be influencing pollen composition, with herbaceous taxa, along with fungal spores, becoming increasingly dominant, while the relative contribution of arboreal taxa shows a gradual decline.
CONCLUSION
The aeropalynological investigation conducted in the trans-Gomti region of Lucknow revealed distinct seasonal variations in airborne pollen and fungal spore assemblages, influenced by local vegetation composition, climatic conditions and urban environmental influences.
AP taxa were dominant during the summer season, whereas NAP and NPPs, particularly grasses and fungal spores, were more abundant in the post-monsoon period.
Rapid urban expansion and increasing population pressure may contribute to changes in the aeroallergen spectrum by reducing indigenous tree taxa, while promoting herbaceous vegetation, fungal spores, and the introduction of exotic or alien plant species.
These observations highlight the necessity of regular pollen and spore monitoring, especially in rapidly urbanising environments, to aid in allergy forecasting and public health planning. The outcomes of this study provide an essential baseline for future research on vegetation dynamics, aerobiological patterns and climate–health linkages in Uttar Pradesh.
Footnotes
Acknowledgements
The authors express their gratitude to the Director, Professor M.G. Thakkar, Birbal Sahni Institute of Palaeosciences (BSIP), Lucknow, India, for providing the required resources for conducting this research. This research article is part of the MSc dissertation work undertaken by the second author, Ms Mamta (OM no.: बी.सा.पु.सं./वै.ग.//2023-24/L-2055/सी-773).
Declaration of Conflicting Interests
The authors declared no potential conflicts of interest regarding the research, authorship and/or publication of this article.
Funding
The authors received no financial support for the research, authorship and/or publication of this article.