
Abstract
While recent advances in machine learning and especially text analysis have already transformed empirical legal scholarship, previous work has mostly ignored some of the richest sources of legal data: images and audio. This article contributes to reducing this gap by introducing empirical legal scholars to computer-vision and computational-audio techniques that can be applied to the empirical legal domain. These techniques enable descriptive, causal, and predictive studies that were previously impossible due to scale and computational complexity. After reviewing general approaches to audio and visual machine learning, we illustrate the usefulness of these methods on a sample of videos from the United States Ninth Circuit Court of Appeals.
1. Introduction
Empirical legal scholarship has traditionally relied on quantitative data gathered through methods such as surveys, experiments, and the analysis of numerical datasets. More recently, computational text analysis has expanded the toolkit available to researchers, enabling the systematic study of large-scale textual corpora such as judicial opinions, statutes, and legal briefs (e.g., Frankenreiter & Livermore, 2020).
Yet law manifests itself not only in written form but also through rich audiovisual data. Police body camera footage, trademark image databases, courtroom video recordings, and audio from emergency calls (e.g., 911 calls) capture legal processes and interactions in nuanced ways that textual data alone cannot fully convey (e.g., Chen et al., 2020; Chugg et al., 2022; Dietrich, 2021; Dietrich, Enos et al., 2019; Dietrich, Hayes et al., 2019; Dietrich & Mondak, 2019; Haim & Kesari, 2023). These audiovisual materials promise deep insights into the dynamics, practices, and experiential dimensions of law.
While audiovisual data have begun to gain traction in other areas of social science (e.g. Ash et al., 2021; Brady, 2019; Caprini, 2023; Dell, 2025; Knox & Lucas, 2021), they remain largely underutilized within empirical legal studies. A key obstacle has been the sheer complexity and scale of audiovisual data. However, recent methodological advances in computer vision and audio analysis—driven by breakthroughs in machine learning—have dramatically reduced these barriers. These methods allow researchers to systematically analyze vast quantities of audiovisual information in ways that were previously infeasible, enabling descriptive, causal, and predictive inquiries about law and legal institutions.
This article introduces empirical legal researchers to the emerging methodological toolkit for audiovisual analysis, providing both conceptual grounding and practical guidance. We outline how key computational techniques from computer vision and audio processing can be adapted to empirical legal studies. We then illustrate the promise of these tools with a number of empirical examples using courtroom video recordings.
Comparison of Data Modalities in Legal Research
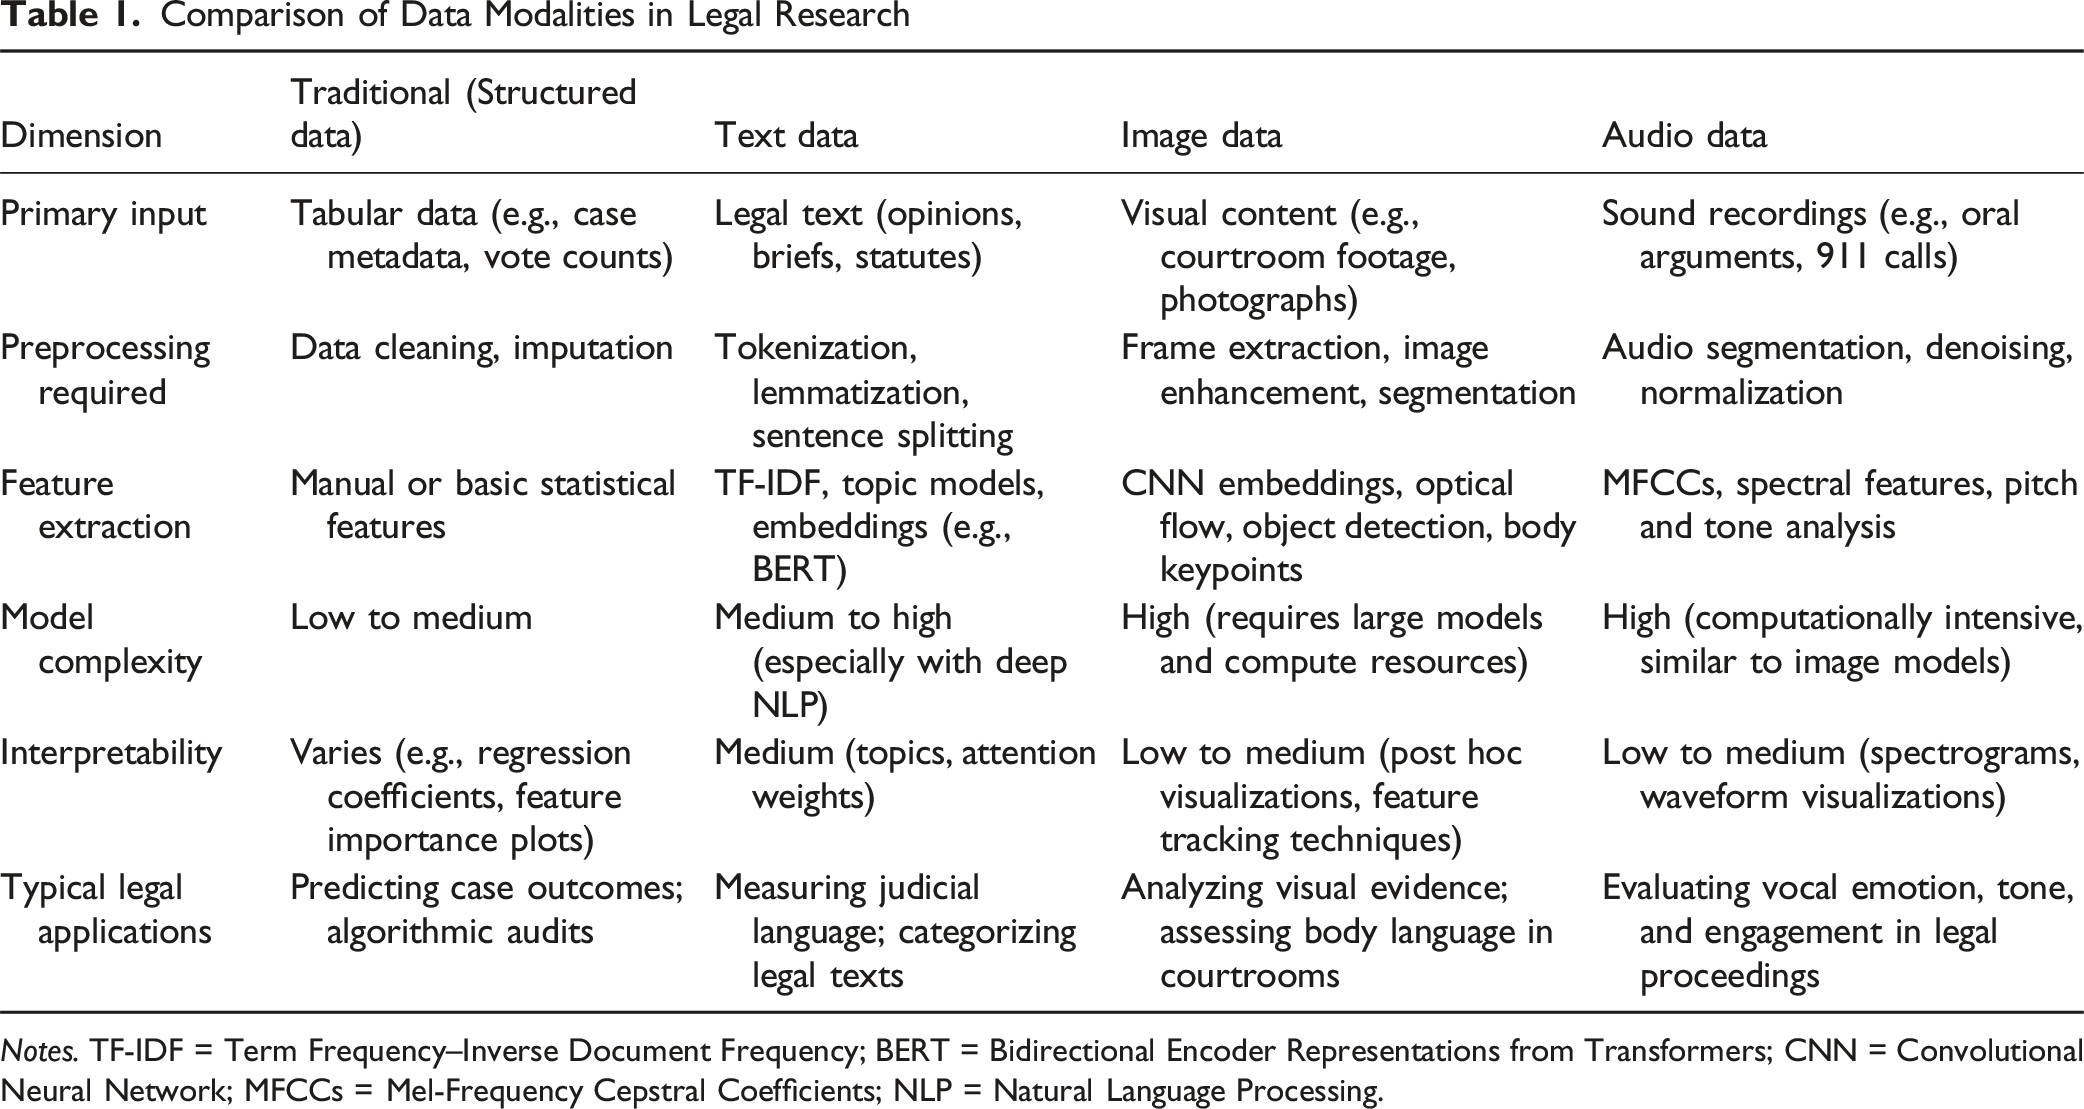
Notes. TF-IDF = Term Frequency–Inverse Document Frequency; BERT = Bidirectional Encoder Representations from Transformers; CNN = Convolutional Neural Network; MFCCs = Mel-Frequency Cepstral Coefficients; NLP = Natural Language Processing.
Yet audiovisual data also introduce distinctive methodological challenges beyond those encountered in textual analysis. First, the computational and storage demands of audiovisual datasets can be significantly higher than those with text datasets, necessitating more substantial computational resources for efficient storage, management, and analysis. We provide some practical advice on addressing these technical challenges.
Second, interpretability poses a greater challenge. Methods in computational text analysis—such as topic models, feature importance metrics, and decision trees—offer intuitive ways to interpret complex results. In contrast, machine learning models applied to audiovisual data often produce less interpretable features, complicating attempts to transparently validate or communicate findings. We provide an introduction to visualization techniques for both images and audio designed to enhance interpretability of the associated findings.
To illustrate these methods in context, we apply them to an original dataset of courtroom video recordings from the United States Ninth Circuit Court of Appeals. The above methods are deployed to extract features both from the video and audio feeds of these recordings. We then use these features to answer a version of a question posed by Dietrich, Enos et al. (2019) in a U.S. Supreme Court setting: Do judges telegraph information about their view of a case (and eventual vote) through audio and visual channels, in addition to the content of their questions?
2. Overview
This section provides an overview to set the stage for the subsequent sections. First, we describe the collection of videos which will be used as sample data to illustrate our methods. Second, we organize our contribution by comparing audiovisual methods to the standard approaches in empirical legal studies.
2.1. Courtroom Video Data
The primary dataset for the demonstrations in this paper consists of 50 videos of Ninth Circuit Court of Appeals oral arguments, downloaded from the court’s official YouTube channel. The Ninth Circuit Court has systematically archived video recordings of its oral argument proceedings since 2010, making it a particularly valuable resource for empirical research into judicial behavior, court dynamics, and advocacy practices. To construct our dataset, we randomly selected 50 videos from the full archive of available recordings using a random number generator to ensure representative sampling across different time periods and case types. Each video is approximately 40 minutes long, capturing the complete oral argument session.
Figure 1 illustrates a representative example of the camera setup employed by the Ninth Circuit during these recorded proceedings. The videos consistently feature a fixed two-camera system that simultaneously captures judges and advocates. One stationary camera is directed at the judicial panel, typically comprising three judges positioned side-by-side, enabling analysis of judicial non-verbal cues, interactions, and responses. A second stationary camera captures the attorney currently speaking at the podium, facilitating analysis of advocacy styles, speech characteristics, and attorney-judge interactions. Typical Video Frame: Ninth Circuit Oral Arguments. Notes. Illustration of the camera positioning and screen segmenting in the Ninth Circuit Videos collection
Additionally, the visual field of each video is split vertically. The top half of the video presents live video feeds of the courtroom proceedings, while the bottom half displays textual metadata. This metadata includes essential case details such as the docket number, names of the participating judges, courtroom location (chambers), argument date, and occasionally additional procedural context. The consistent presence of this textual information within the video frame aids in automated data extraction, labeling, and indexing for downstream analysis.
2.2. Methodological Overview
To help organize the rest of the material, we begin with a comparison of the broad methods used in empirical legal scholarship. Table 1 compares the main approaches that vary according to data modality. Across rows, we look at the main dimensions of data inputs, preprocessing, feature extraction, model complexity, interpretability, and typical applications in law. Across columns, we compare the different data modalities: structured numerical data (the traditional route), text data, image data, and audio data.
Each modality differs in both the type of data and the processing methods required. Traditional structured data involves numerical inputs such as case metadata and vote counts, with preprocessing steps centered around data cleaning and statistical analysis. In contrast, text data requires natural language processing techniques, including tokenization and embeddings, to handle the unstructured nature of legal opinions and briefs. Both image data and audio data depend on advanced machine learning techniques: images require methods like object detection and segmentation, while audio data relies on spectral analysis and feature extraction methods such as MFCCs. We omit methods like automatic speech recognition (ASR) and optical character recognition (OCR) from Table 1. These methods can be used to extract text from image and audio data, followed by applying the usual text data processing pipeline.
Next, the table underscores the varying levels of model complexity and interpretability across data modalities. Models based on structured and textual data tend to offer clearer, more straightforward interpretations through techniques like regression coefficients or topic analysis. On the other hand, image and audio analysis often involve highly complex models that demand significant computational resources, and their results are generally less immediately interpretable without specialized visualization techniques.
In the rest of the paper, we elaborate on these distinctions. Section 3 lays out tools for image data, while Section 4 does for audio data. Section 5 provides further discussion on applying both types of methods to legal data, while Section 6 offers a short demonstration of how these methods can answer the question of whether audio and visual features reveal information that basic case data or transcripts alone do not. Section 7 collects representative research questions for multimodal empirical legal studies, and Section 8 concludes.
3. Visual Analysis Methods
At a high level, computer vision for empirical legal studies shares many similarities with conventional machine learning and text analysis. In each case, numerical features must first be extracted from unstructured or unconventional data. Tasks typically involve supervised or unsupervised machine learning techniques, and evaluation commonly involves comparing predicted labels against human-annotated (usually considered ground truth) labels.
For those familiar with traditional machine learning methods, many aspects of computer vision will be conceptually familiar. The primary distinction arises from the inherent complexity and dimensionality of visual data. Similar to computational text analysis, computer vision relies on off-the-shelf techniques to extract meaningful features. However, visual features are often less directly interpretable than textual features, presenting unique challenges for analysis and validation.
3.1. Labeling
A crucial first step in most computer vision tasks is the creation of ground truth labels, which serve as the basis for training supervised machine learning models. For many common objects, pre-labeled datasets such as the Common Objects in Context (COCO) dataset (Lin et al., 2015) are available. COCO contains hundreds of thousands of labeled images covering categories like cars, bicycles, animals, and household items. Models such as the YOLO (You Only Look Once) family (Redmon et al., 2016; Redmon & Farhadi, 2018) of object detection networks are trained on COCO, making them effective for detecting and classifying common objects without additional training. For domain-specific data not covered by general-purpose datasets like COCO, researchers must create their own labeled datasets.
One effective and widely used tool for labeling custom visual datasets is the Computer Vision Annotation Tool (CVAT) (Sekachev et al., 2020). CVAT is an open-source, web-based annotation platform providing a comprehensive suite of labeling tools for both images and videos. It supports multiple annotation formats, such as bounding boxes, polygons, and keypoints. Additionally, CVAT offers robust management features that enable collaborative labeling workflows, including assignment of tasks to annotators, progress monitoring, and quality control. For legal researchers, CVAT can be used to annotate courtroom actors, identify evidentiary objects, or track behavioral events across video recordings. Figure 2 illustrates the CVAT labeling interface in action. CVAT Labeling. Notes. Computer Vision Annotation Tool (CVAT) labeling platform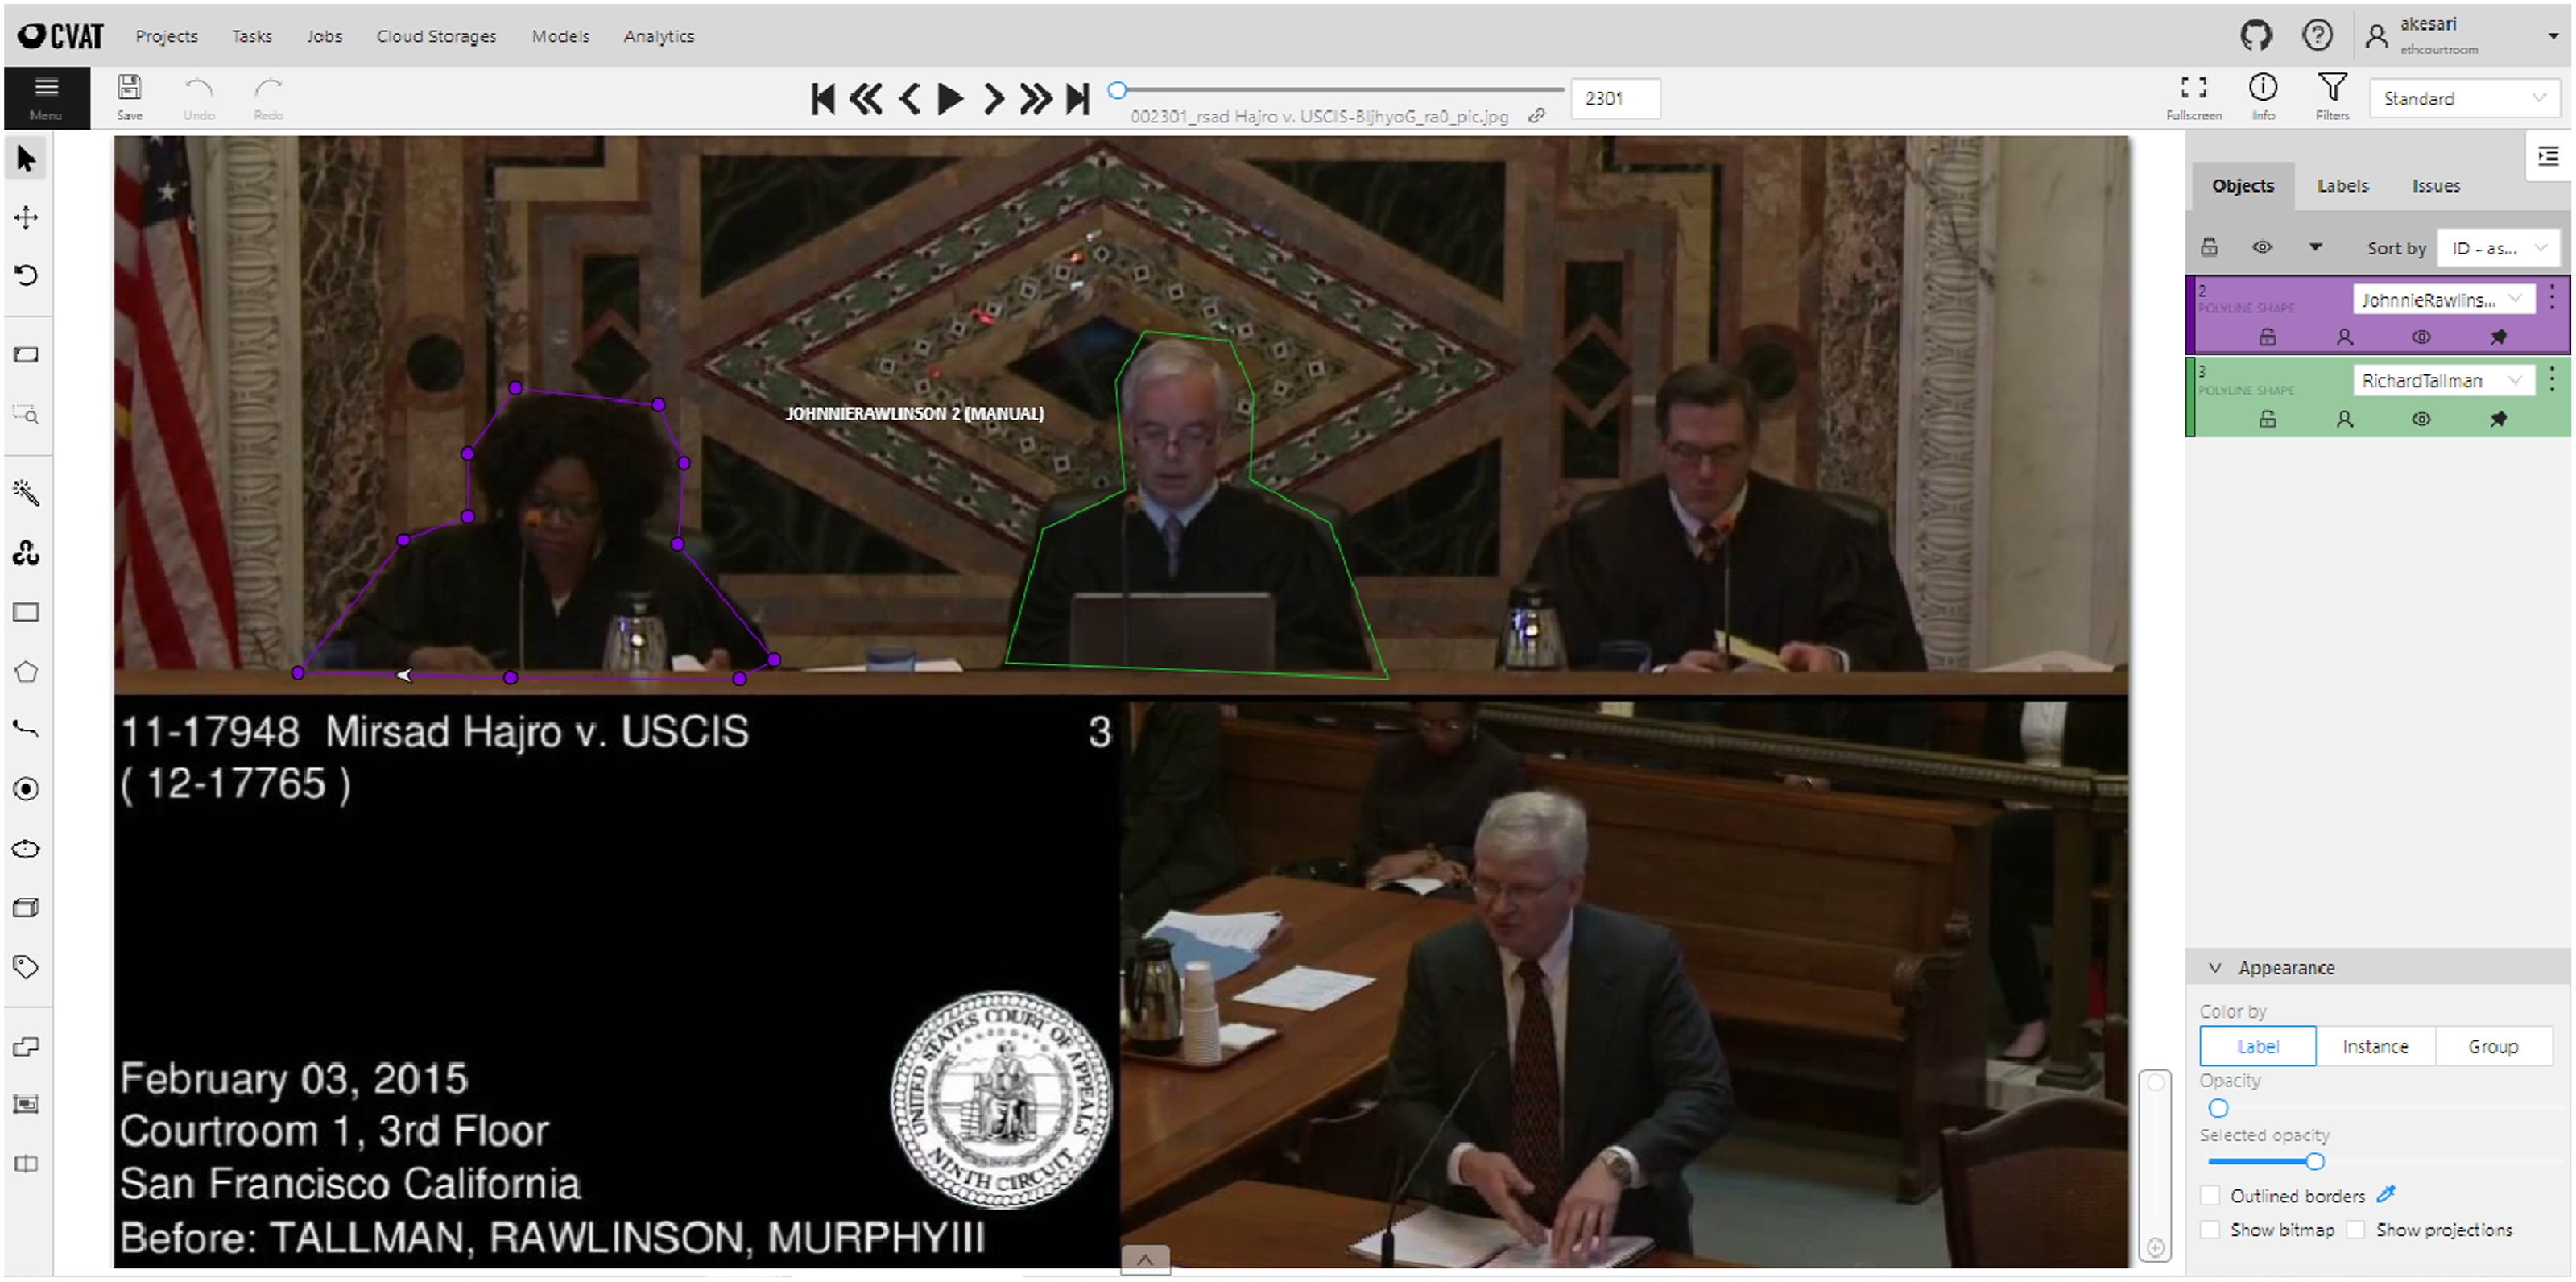
After labeling is complete, labeled images can be exported for use in downstream machine learning workflows. Tools such as the Python library
3.2. Visual Featurization
Once ground truth labels are available, the next step is visual featurization: transforming raw pixel data into numeric representations suitable for modeling. Feature extraction methods generally fall into two categories: manually designed features and automated, deep-learning features. Many of these methods are built on top of the OpenCV library (Bradski, 2000), which is a popular library for computer vision tasks.
Among manual feature extraction methods, Histogram of Oriented Gradients (HOG) (Dalal & Triggs, 2005) and Local Binary Patterns (LBP) (Ojala et al., 2002) are prominent. These methods extract structured numerical features from raw images, enabling traditional statistical models to analyze visual content. The HOG method operates by counting occurrences of gradient orientations within localized portions of an image. Specifically, it divides an image into small regions, calculates the gradient magnitude and orientation for pixels within each region, and summarizes these gradients into histograms. This technique captures shape and edge characteristics, making it particularly effective for object detection tasks. Figure 3 illustrates these lower-level features extracted by HOG. LBP, in contrast, characterizes textures by comparing pixel intensities with their surrounding neighbors, effectively capturing local patterns in an image. Both HOG and LBP generate compact numeric representations that can be efficiently processed by classical machine learning algorithms like Support Vector Machines (SVMs) or random forests. HOG model. Notes. A Histogram of Oriented Gradients (HOG) model applied to a grayscale image. In legal applications, HOG features can help identify whether a judge is present in the frame or detect the number of people visible during courtroom proceedings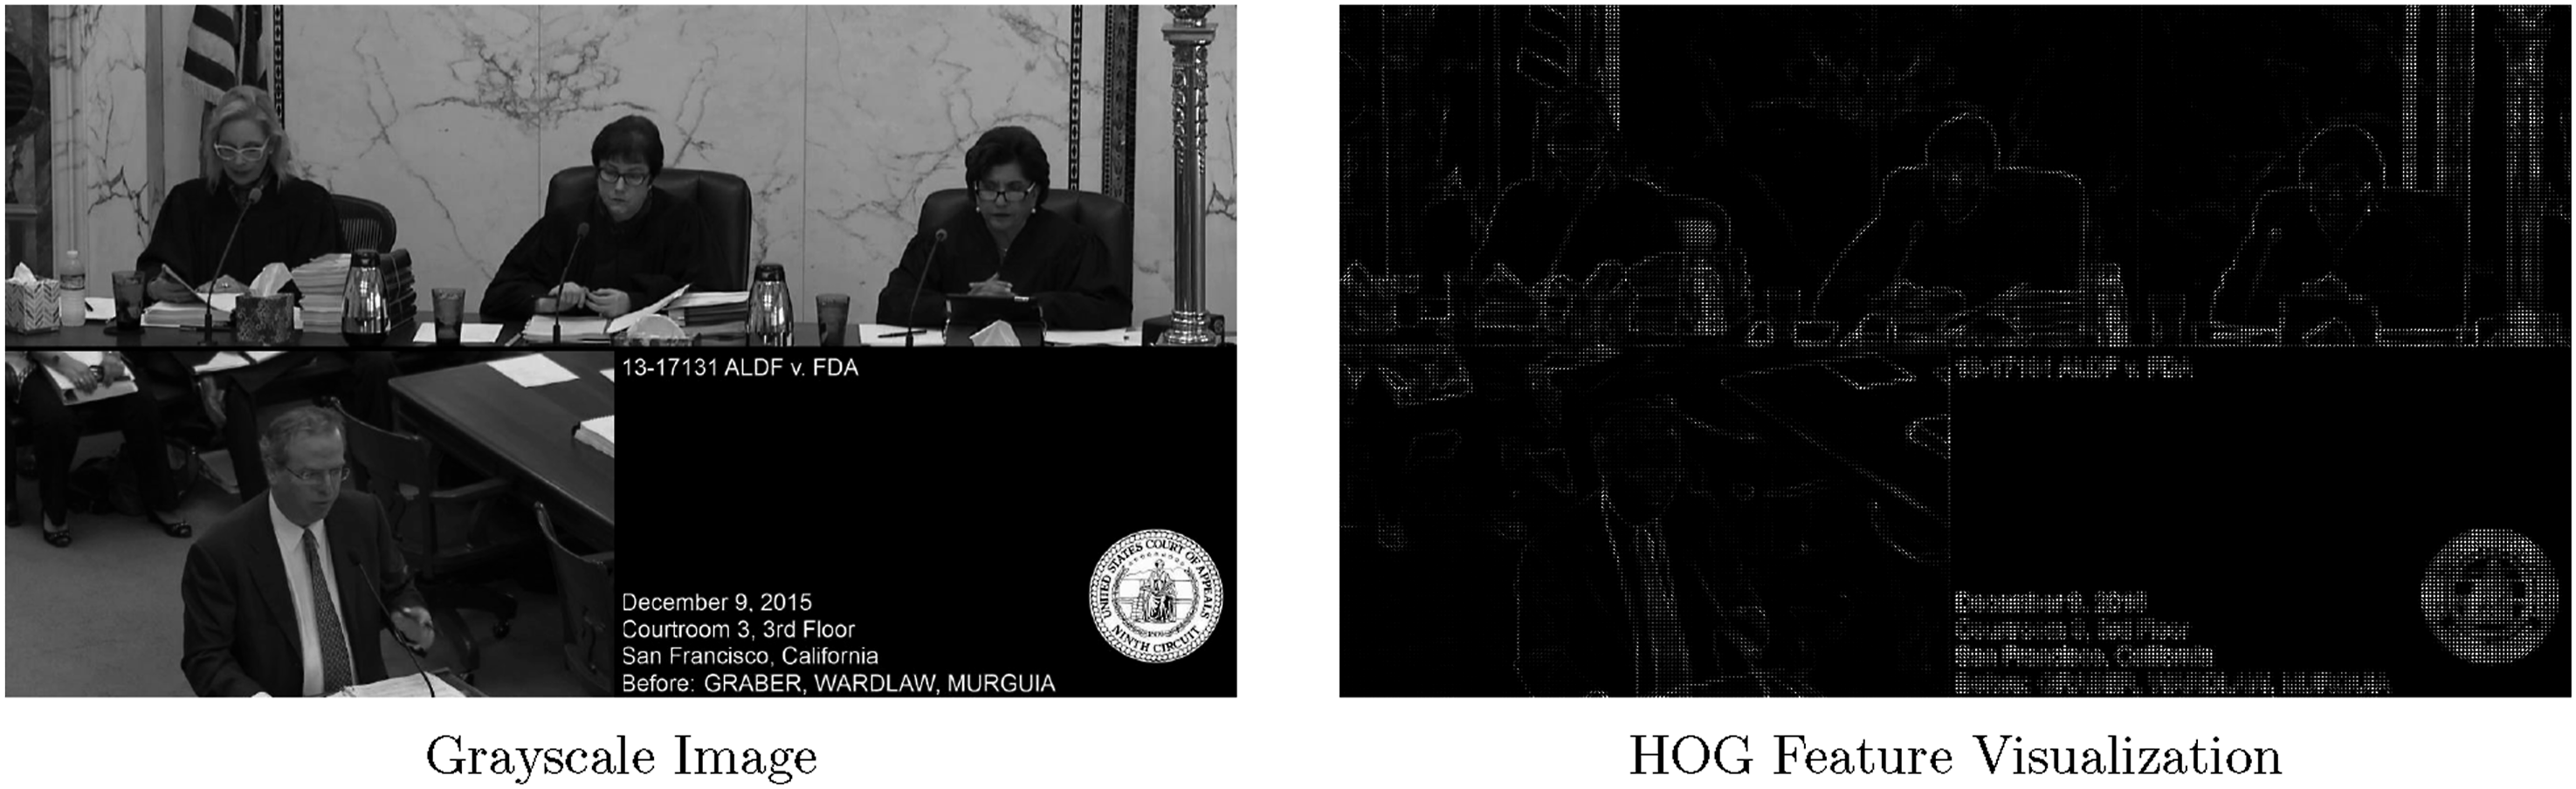
Another popular manual featurization technique is the Haar Cascade method (Viola & Jones, 2001), which isolates Haar-like features for efficient detection of objects such as human faces. Haar-like features represent contrasts in pixel intensities across rectangular image regions, effectively encoding information about edges, lines, and areas within an image. The fundamental idea behind Haar-like features is simple: by calculating the sum of pixel intensities within adjacent rectangular regions and computing their differences, one can rapidly capture characteristic patterns specific to certain objects, such as the contrast between eyes and cheeks or the edges surrounding facial contours. We will show below how these features can be used to identify human faces in courtroom videos (see Figure 7).
Deep-learning-based methods, notably convolutional neural networks (CNNs—a class of neural network architecture specifically designed for processing image data), represent a powerful alternative for automatic feature extraction (e.g., Bengio et al., 2016; Krizhevsky et al., 2012). CNNs are specialized neural networks designed explicitly for analyzing visual data, capturing complex hierarchical patterns directly from raw pixel values. At the core of CNNs are convolutional layers, which apply multiple learnable filters (also called kernels) across an input image. These filters systematically scan (or “convolve”) across the image, producing feature maps that highlight important local patterns such as edges, textures, shapes, and object parts. Each convolutional layer typically employs nonlinear activation functions (e.g., rectified linear units, or ReLU) that allow CNNs to capture intricate, nonlinear relationships in visual data.
Subsequent pooling layers (e.g., max-pooling or average-pooling) reduce the dimensionality of these feature maps, distilling the most salient features while reducing computational complexity. By stacking multiple convolutional and pooling layers sequentially, CNNs learn increasingly abstract visual representations, transitioning from simple edge detection in early layers to complex object recognition in deeper layers.
Beyond simple image classification, CNNs can also perform more granular tasks such as semantic segmentation. In semantic segmentation tasks, CNN architectures classify each pixel within an image individually, assigning pixels to specific categories (e.g., person, object, background) (Long et al., 2015). This fine-grained approach effectively partitions visual data into meaningful segments, enabling precise delineation of objects from their surroundings. The final output of a CNN is typically an embedding—a dense numeric representation of the visual content—that can be directly utilized by downstream classification or regression algorithms to generate predictions or insights. Figure 4 shows an example of segmenting people from the background in the courtroom videos. Semantic segmentation. Notes. Illustration of using a semantic segmentation model to separate people from other parts of a scene. This technique enables legal researchers to isolate judicial actors from their surroundings, facilitating focused analysis of facial expressions and body language without interference from background elements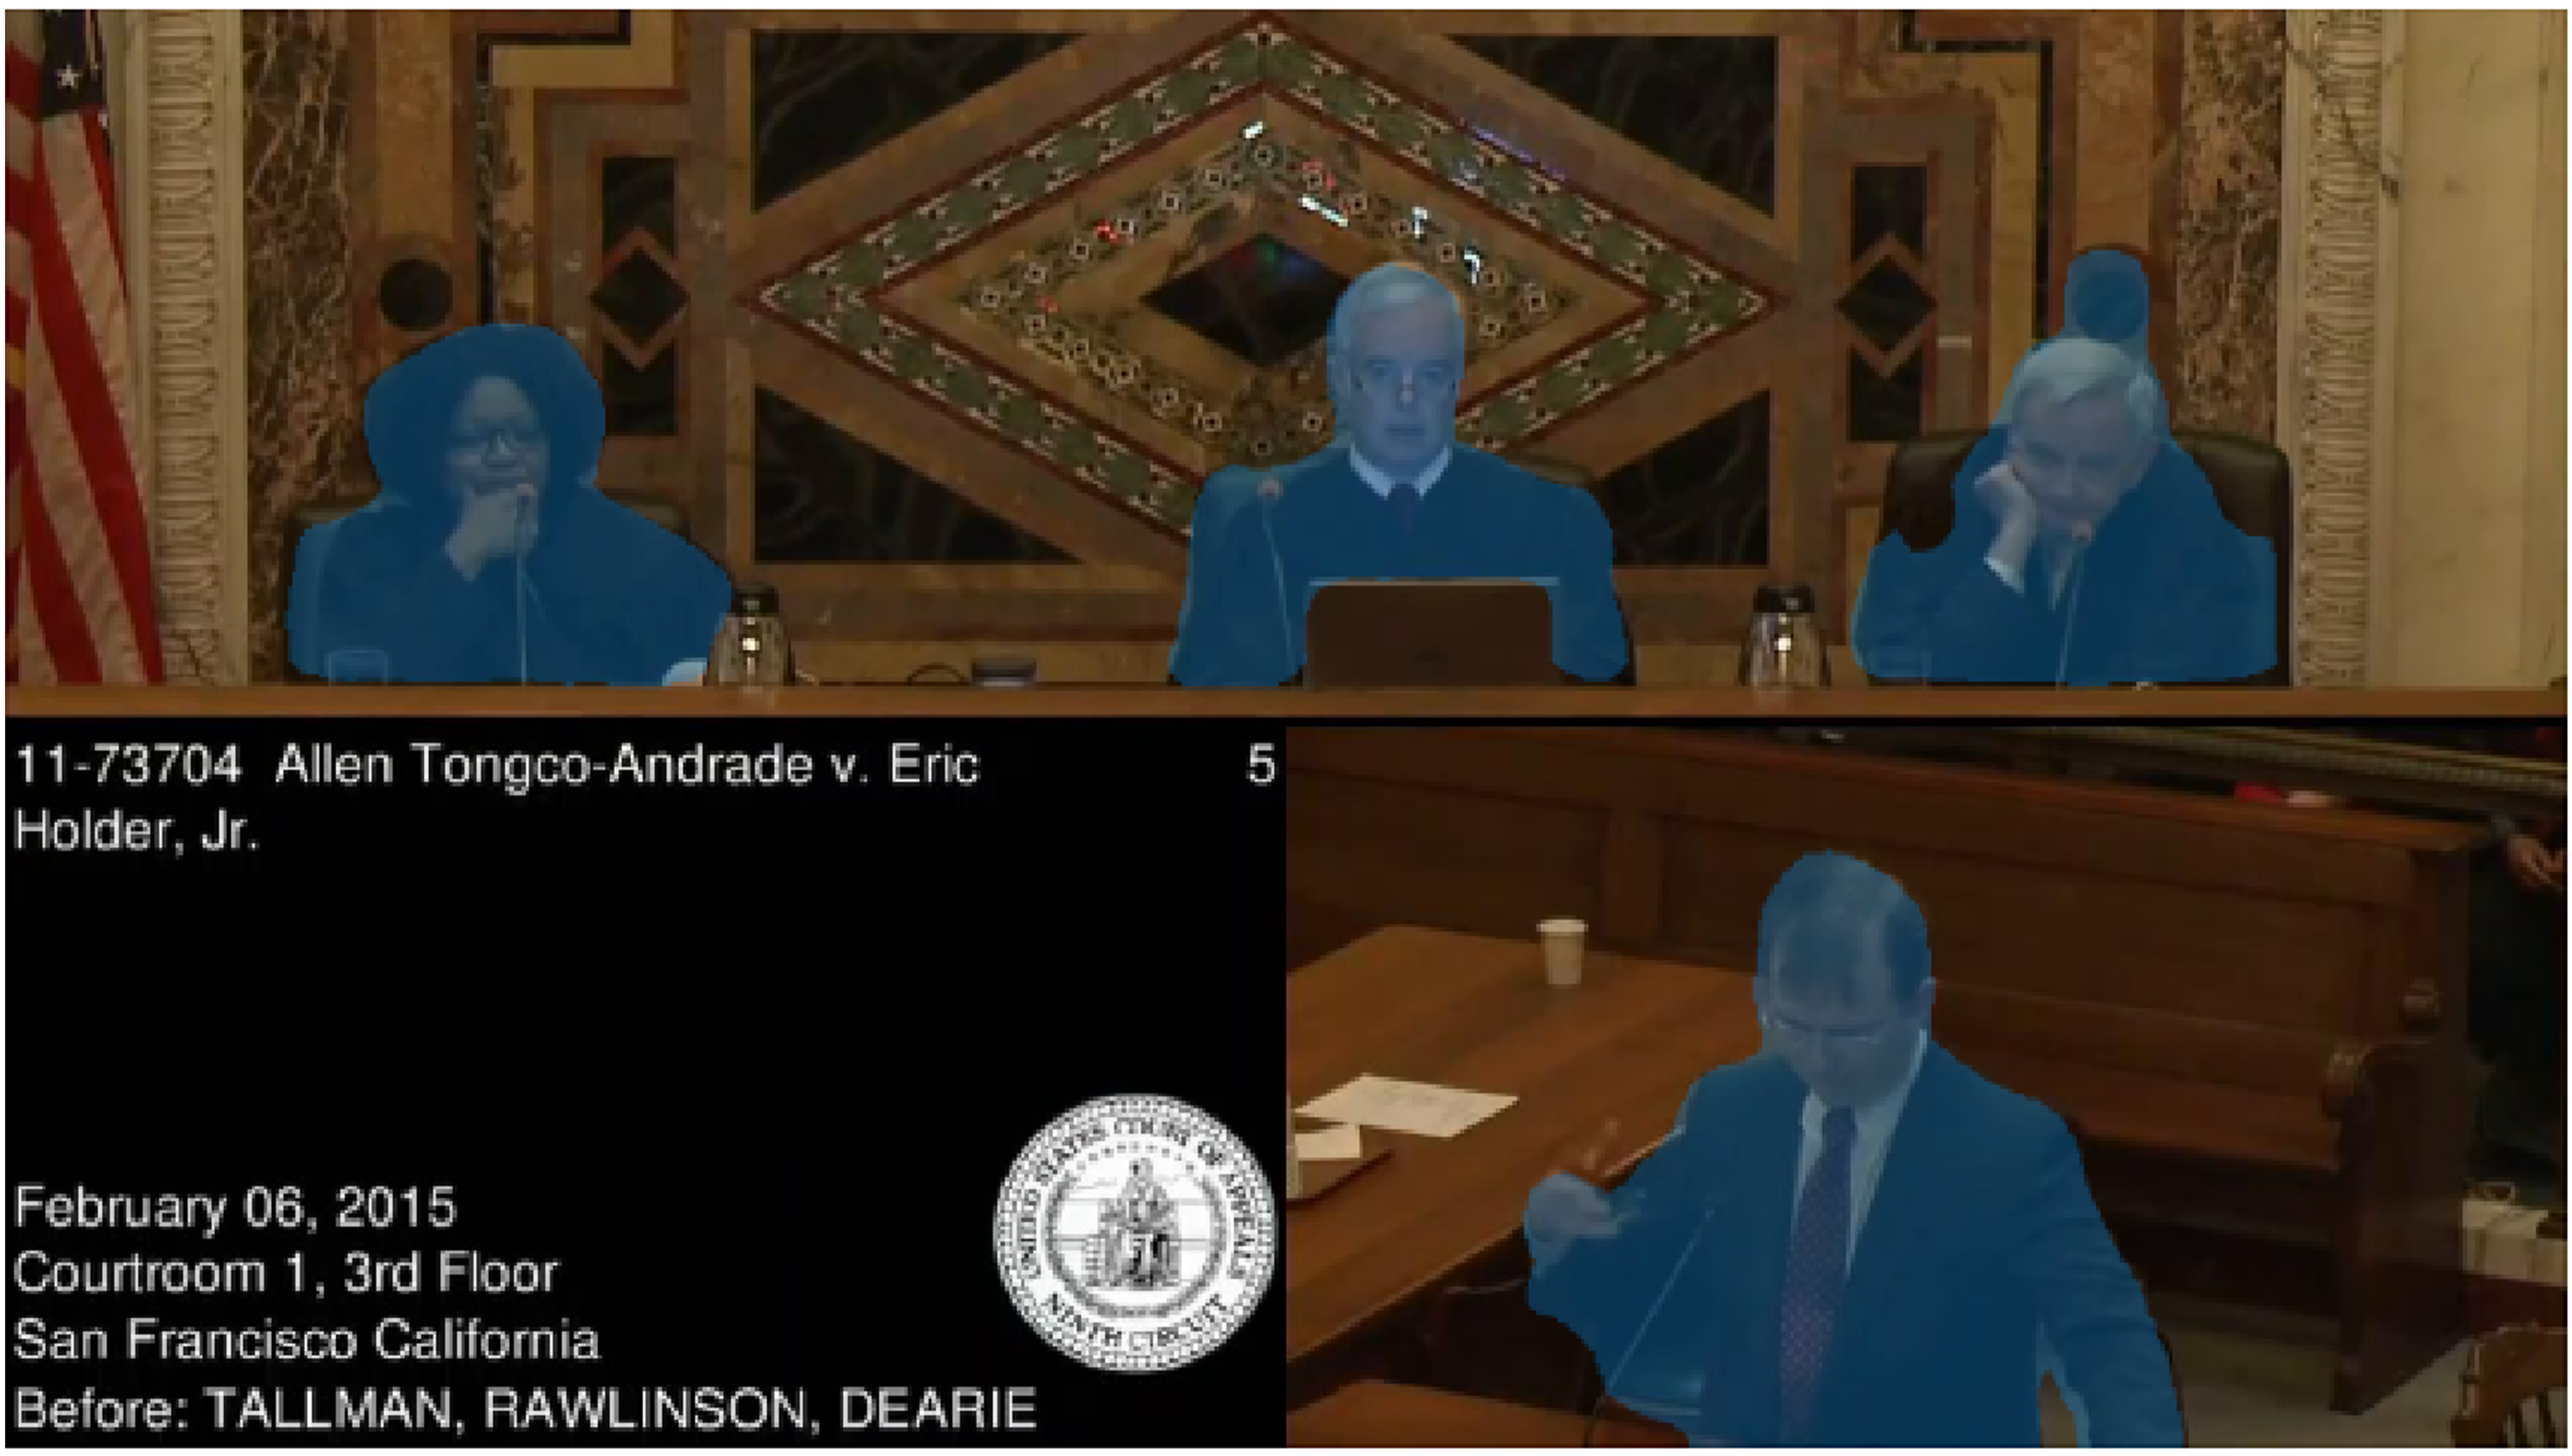
The choice between manual feature extraction methods (such as HOG, LBP, and Haar Cascades) and deep learning methods is specific to the setting and problem, typically balancing computational efficiency, predictive accuracy, interpretability, and data requirements. Manual feature extraction methods are often computationally efficient, easily interpretable, and effective even in environments with limited computational resources or relatively small datasets. For instance, HOG, LBP, and Haar Cascades compute features based on simple, predefined operations such as gradient orientation histograms or pixel intensity comparisons. As a result, these methods usually run quickly, enabling real-time or near-real-time performance, even on modest hardware.
Deep learning methods, such as convolutional neural networks, in contrast, typically provide superior accuracy and robustness, especially when working with large and diverse datasets. These methods automatically discover highly nuanced and abstract visual features from raw data, leading to models with stronger predictive performance and better generalization to new contexts. However, these gains come with increased computational demands, often requiring specialized hardware such as graphics processing units (GPUs) and substantial training time. Training convolutional neural networks from scratch typically requires specialized hardware such as GPUs and substantial labeled data. In practice, however, most empirical legal researchers will likely rely on transfer learning—starting from pretrained models (e.g., FER, OpenPose, wav2vec 2.0) and optionally fine-tuning them on domain-specific data. For many tasks (e.g., facial emotion recognition, pose estimation), pretrained models can be applied directly without additional training. Fine-tuning becomes more important when domain shift is substantial (e.g., courtroom norms suppress expressive behavior). Fine-tuning substantially reduces training time and data requirements, and can be implemented using widely available frameworks such as PyTorch, TensorFlow/Keras, or HuggingFace’s Trainer API. Cloud-based environments (e.g., Google Colab, AWS, or institutional GPU clusters) further lower the barrier to entry for small-to medium-scale projects.
Therefore, the choice between manual and deep-learning-based feature extraction must be informed by the specific empirical context and research goals. If interpretability, rapid prototyping, or real-time performance with limited computational resources are paramount, manual methods may be more appropriate. Conversely, if maximizing accuracy, generalization capability, and predictive performance are central objectives—and if sufficient computational resources and training data are available—deep-learning-based methods often present the best option.
Cloud-deployed general-purpose computer vision models such as Google’s Cloud Vision API, Amazon’s Rekognition, or OpenAI’s Vision can be viable alternatives to running models on own or rented infrastructure. Some of these vendors also support model customization or have free tiers—e.g., including 1000 API calls per day, which might be enough for a small-scale project to run on.
For legal researchers, the practical implication is that pilot studies exploring the feasibility of visual analysis can often begin with simple, interpretable methods like HOG or Haar Cascades before investing in more complex deep learning pipelines. For example, a researcher interested in whether judges look at attorneys during oral arguments might start with basic face detection (Haar Cascades) and head pose estimation (HOG features) before building a custom CNN-based attention-tracking system.
3.3. Facial Emotion Recognition
A particularly rich but methodologically challenging form of visual data involves human emotions, which represent inherently high-dimensional phenomena. Emotional states are characterized by a complex combination of facial expressions, subtle muscle movements, and contextual interactions, making them challenging to quantify accurately. Emotions are not merely categorical (such as happy or angry) but exist along continuous and multidimensional spectrums, often subject to substantial variability across individuals and contexts. The high-dimensionality of emotional data thus introduces both analytical complexity and interpretative challenges, yet also offers valuable insights into underlying human behaviors and interactions that purely textual or numerical data cannot easily capture.
To demonstrate the potential of computational methods in addressing these challenges, we illustrate the use of an automated facial emotion recognition algorithm on courtroom video data. Specifically, we use the Facial Emotion Recognition (FER) library developed by Arriaga et al. (2019), a widely-used off-the-shelf emotion classifier trained on the FER-2013 dataset (Dumitru et al., 2013). The FER algorithm employs a two-step process. First, it detects and locates human faces within video frames, generating bounding boxes around them. We match these bounding boxes to previously identified judges’ faces using an Intersection-over-Union (IoU) approach—a metric that quantifies the overlap between two bounding boxes, with higher values indicating better alignment between predicted and actual face locations. Second, the FER algorithm classifies facial expressions into one of seven discrete emotional categories: happy, angry, disgusted, fearful, neutral, sad, or surprised, assigning each category a probability score.
Off-the-shelf algorithms like FER are typically trained and evaluated on benchmark datasets such as FER-2013, which consists of facial images manually labeled into discrete emotion categories by human annotators. The reported accuracy of approximately 66% reflects performance relative to these human-coded ground truth labels. Accuracy may decrease when these models are applied to specialized domains such as judicial settings, where facial expressions are subtler or contextually constrained. Additionally, the “ground truth” reflects the subjectivity of the human labelers and perceptions of facial emotions can and do vary between people, as well as across institutional and cultural contexts.
Importantly, the role of ground truth varies depending on the research application. For studies focused on measuring aggregate behavioral patterns or comparing relative differences across conditions—such as tracking how judicial emotional displays vary between case types—perfect classification accuracy may not be essential, provided that measurement error is approximately random and consistent across observations. However, for applications requiring precise identification of specific emotional states or individual-level inferences, researchers should validate model performance on domain-specific samples and potentially fine-tune models using annotated legal data. Open-source frameworks such as PyTorch and HuggingFace Transformers provide accessible tools for fine-tuning pre-trained emotion recognition models on custom datasets when greater accuracy is required.
Second, the interpretation of emotional expressions is inherently subjective and context-dependent, introducing biases and inconsistencies in both automated classifications and human-labeled ground truth data. For example, courtroom norms or professional expectations might compel judges to maintain neutral or controlled expressions, complicating the inference of genuine emotional states. Finally, there is an inherent gap between observable emotional expressions and underlying cognitive states or attitudes relevant to judicial decision-making, such as agreement, skepticism, or attention. Thus, researchers must approach analyses involving facial emotion recognition carefully, considering these methodological caveats and employing complementary data sources whenever possible.
3.4. Motion Detection and Body Posture
Beyond facial expressions, body language provides valuable complementary insights into how judges react to courtroom interactions and arguments. Subtle physical behaviors—such as maintaining eye contact, consulting notes, or shifting posture—can reflect levels of engagement, attention, agreement, or skepticism, which may be difficult to detect solely through facial expressions or textual transcripts. For instance, a judge leaning forward during an attorney’s argument may signal heightened attention, while looking down at documents might indicate reference to case materials or disengagement. Accurately quantifying and interpreting body language thus enhances empirical research into judicial behavior and courtroom dynamics, enabling researchers to test hypotheses about how physical comportment relates to decision-making or varies across judge characteristics and case types.
Unlike methods such as facial recognition that analyze individual frames, analyzing body language typically requires tracking movements across multiple sequential frames. To accomplish this, we batch video frames into sequences of five frames each, then apply computational methods designed specifically for motion analysis.
One widely used family of motion-detection techniques is known as “optical flow,” which estimates how objects move between consecutive video frames. Because a video is simply a sequence of still images, motion can be inferred by examining how pixel patterns change from one frame to the next. If a judge leans forward, for example, the pixels corresponding to the judge’s face and torso shift position slightly across successive frames. Optical flow algorithms quantify these shifts, producing estimates of both the direction and magnitude of movement.
Different optical flow methods make different assumptions about how much of the scene is moving. Sparse approaches assume that most of the background remains static and track only selected distinctive points—such as corners or edges—across frames. The classic Lucas-Kanade algorithm follows this strategy, efficiently tracking a limited number of features (for example, a judge’s hand or head) and working well for detecting discrete gestures. In contrast, dense approaches estimate motion at nearly every pixel in the frame, providing richer detail about how the entire scene evolves. The Dense Pyramid Lucas-Kanade algorithm extends sparse tracking to a dense setting, while the Farneback algorithm uses mathematical approximations to estimate motion for all pixels with high accuracy (Lucas & Kanade, 1981; Farnebäck, 2003). Motion detection is also not limited to analyzing body language, and can be easily adapted to other sources such as traffic.
A second approach we employ for detailed analysis of body language involves human pose estimation using the OpenPose framework (Cao et al., 2021). OpenPose leverages deep neural networks pre-trained on extensive datasets of human poses to accurately detect and map individual body parts, such as heads, arms, torsos, and legs. The principal advantage of OpenPose is its fine-grained anatomical detail, allowing researchers to classify specific behaviors or postures—for example, determining whether judges are sitting upright or slouched, actively gesturing, or consistently maintaining eye contact toward speakers or other participants.
Figure 5 illustrates the application of OpenPose to our courtroom video data. In this example, OpenPose accurately identifies and visualizes the line of sight for the judge on the left, providing insights into attentiveness and direction of focus. Additionally, the framework captures arm positioning and overall posture of the judge in the center, facilitating more nuanced analyses of engagement or physical comportment. Such detailed visual outputs enable researchers to systematically quantify subtle but meaningful behavioral cues that would otherwise remain challenging to document or analyze manually. OpenPose detects line of sight and posture. Notes. Illustration of OpenPose outputs, demonstrating detection of judges’ arm positions, posture, and lines of sight. These body language indicators can reveal judicial attention and engagement—for example, whether judges maintain eye contact with counsel or turn away, whether they lean forward attentively or sit back, and whether they gesture during questioning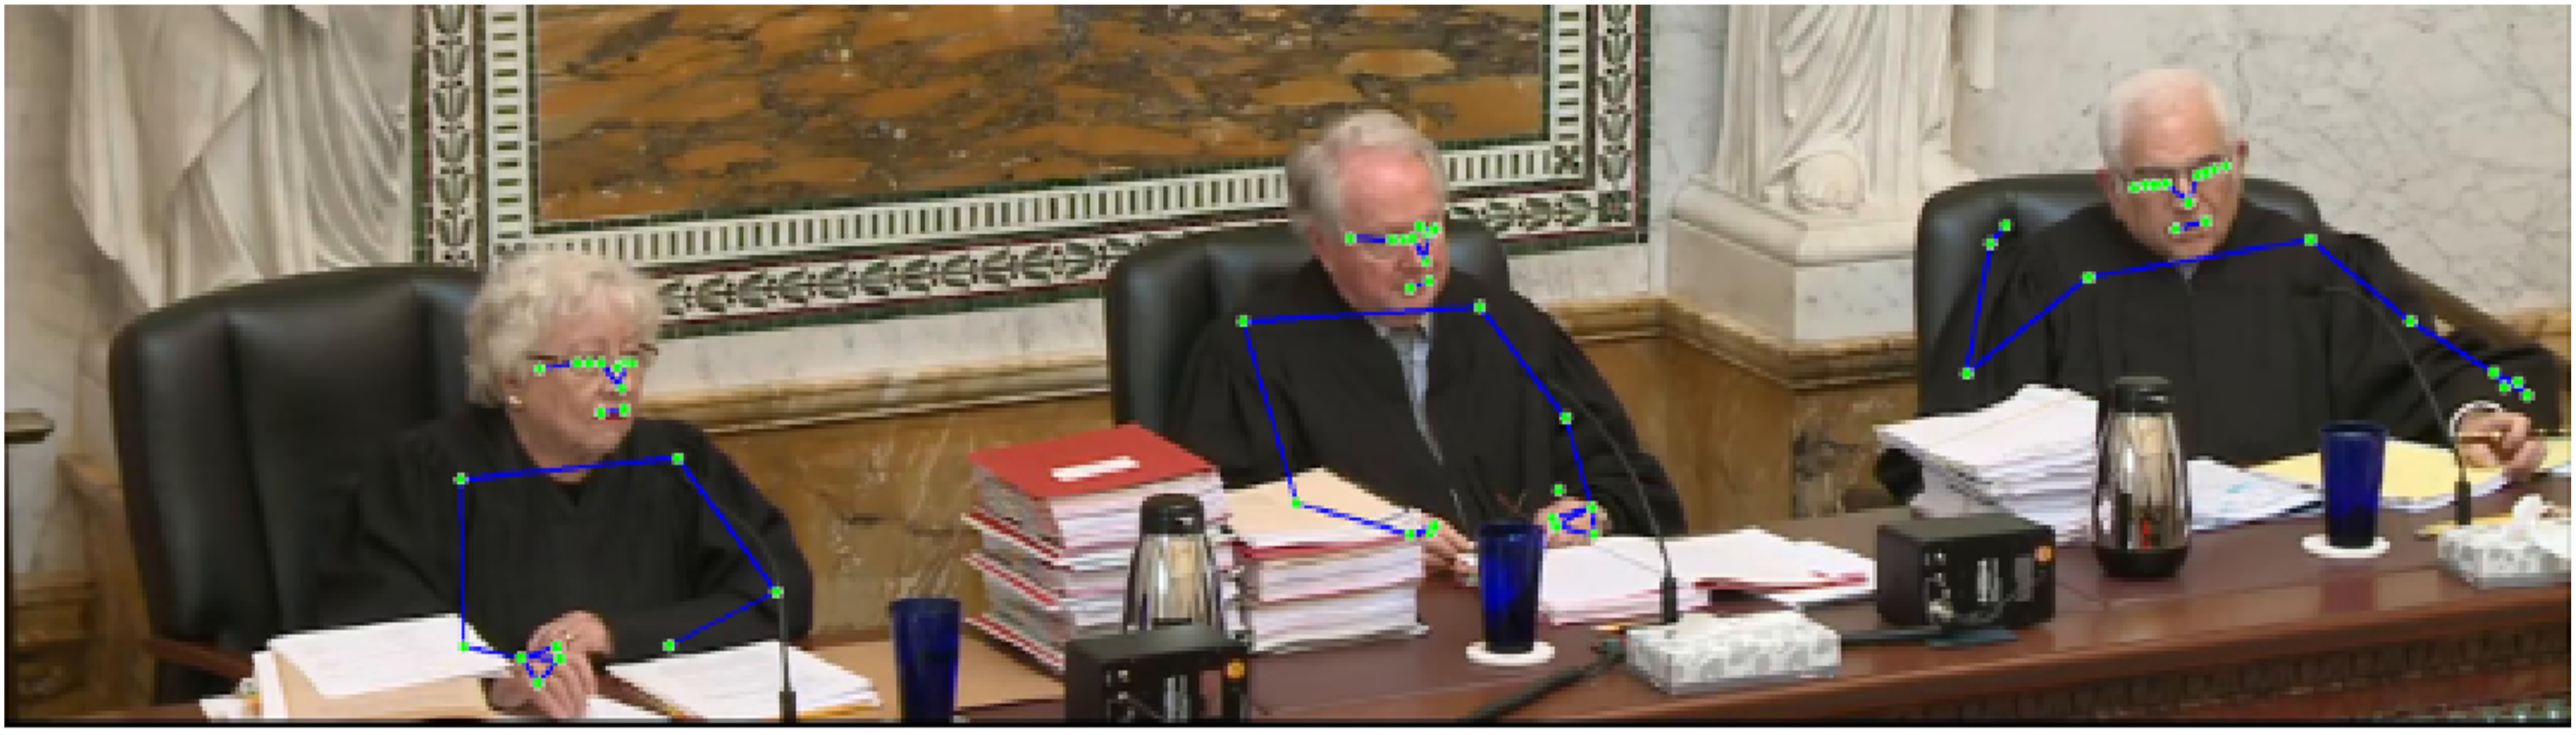
4. Audio Analysis
Audio data presents rich opportunities for empirical legal research, as vocal signals often capture subtle but meaningful aspects of communication not easily discerned from textual or visual information alone. Legal interactions—such as courtroom arguments, police interrogations (Horvath et al., 2013), or emergency calls—often contain vocal indicators of emotional state, stress, confidence, and emphasis. For example, a judge’s vocal pitch may rise when expressing skepticism toward an argument, or an attorney’s speech rate may accelerate under pressure during cross-examination. These paralinguistic cues—features of speech beyond the literal words spoken—can reveal interpersonal dynamics, power relations, and affective states that shape legal outcomes. Analyzing these audio characteristics systematically can provide empirical scholars with valuable insights into the social and psychological dynamics inherent in legal contexts.
Notably, off-the-shelf audio analysis is much less developed than image analysis, both in general and in social science in particular. While video files are larger than audio files, the meaning in audio is more subtle and dynamic, and more difficult to measure. This is because visual information typically contains relatively stable spatial structures—such as consistent face shapes or body outlines—that can be detected reliably across frames using spatial features like edges, gradients, and color contrast. In contrast, audio signals unfold over time in ways that encode information through fluctuations in pitch, tone, rhythm, and emphasis. Additionally, many meaningful vocal cues—such as sarcasm, hesitation, or emotional arousal—lack standardized acoustic signatures and are sensitive to speaker-specific, cultural, and situational nuances. As a result, while the data size may be smaller, extracting interpretable features from audio often requires more nuanced modeling and greater domain-specific knowledge, with fewer pre-trained options available.
4.1. Audio Feature Extraction
A core methodological challenge in audio analysis is representing sound in a quantitative and analytically tractable format. To address this challenge, researchers commonly rely on several established audio feature extraction techniques that quantify pitch, frequency, and amplitude—core components of vocal audio signals. There are three widely used methods, which we discuss in turn.
4.1.1. Mel-Frequency Cepstral Coefficients (MFCCs)
MFCCs capture frequency-related information in audio data by decomposing complex sound waves into a set of frequency bands mapped onto a perceptual scale approximating human hearing. This makes MFCCs particularly effective for analyzing human speech, allowing researchers to quantify subtle vocal qualities related to emotional intensity, stress, or speaker identity.
4.1.2. Chroma Features
Chroma features represent the pitch content of audio signals by mapping audio frequencies into discrete pitch classes. While originally developed for musical analysis, chroma features are useful in spoken communication to detect variations in pitch that might indicate rhetorical emphasis or shifts in emotional arousal.
4.1.3. Waveform Amplitude
The waveform directly measures sound intensity or loudness by tracking amplitude changes over time. Amplitude analysis allows researchers to capture variations in speaker volume, which often correspond to heightened emotion, emphasis, or assertiveness in speech.
Each of these methods can be implemented using libraries such as
4.2. Deep Learning Approaches to Audio
While traditional audio features like MFCCs, chroma, and amplitude provide interpretable and computationally efficient representations, recent advances in deep learning have enabled more sophisticated modeling of raw audio waveforms. These approaches allow for automatic feature learning, potentially uncovering richer and more abstract representations of speech and sound that are difficult to hand-engineer. For legal researchers, these deep learning tools offer significant advantages: they can handle noisy courtroom recordings, accommodate speaker variability, and detect subtle vocal patterns that correlate with legal outcomes or behaviors.
Several state-of-the-art models and toolkits have emerged that offer pre-trained capabilities and extensibility for use in legal contexts. We highlight four prominent approaches: PANNs, wav2vec 2.0, openSMILE, and Whisper.
4.2.1. PANNs (Pretrained Audio Neural Networks)
PANNs are convolutional neural networks trained on large-scale audio tagging datasets (such as AudioSet), which contain millions of labeled audio events from diverse acoustic environments (Kong et al., 2020). Rather than relying on hand-engineered features, these models learn abstract acoustic representations directly from raw audio. In practice, PANNs capture patterns such as voice timbre (the distinctive quality or texture of a voice), speech rhythm and cadence, tonal variation, and background acoustic context. Technically, they encode information about the spectral envelope (overall frequency distribution), temporal dynamics (how sound evolves over time), and harmonic structure (relationships among frequency components).
Importantly, PANNs output fixed-length numerical vectors—often referred to as embeddings—that summarize these acoustic characteristics in a compact form. These embeddings can then be used as input features for downstream classification tasks, including emotional state recognition, speaker verification, or conversational dynamics analysis.
PANNs are well-suited for empirical legal contexts where pre-training on large corpora is valuable but labeled legal audio is scarce. For example, a researcher might use PANN embeddings to study how judges’ vocal characteristics differ when presiding over criminal versus civil cases, or to detect ambient courtroom sounds (such as audience reactions or background noise) that might indicate heightened tension during controversial proceedings. Because PANNs produce consistent embeddings across diverse audio inputs, they enable comparative studies even when researchers lack extensive labeled legal audio datasets.
4.2.2. wav2vec 2.0
Wav2vec 2.0, developed by Facebook AI, is a transformer-based model that learns representations of raw speech audio in a self-supervised manner, without relying on labeled data (Baevski et al., 2020). The model is trained to predict masked portions of the input signal, akin to masked language modeling in text. Once trained, wav2vec 2.0 can be fine-tuned for tasks such as speech recognition, speaker identification, or emotion detection.
The key advantage of wav2vec 2.0 is that it operates directly on raw waveform data, bypassing the need for manual feature extraction like MFCCs. This makes it particularly attractive in legal domains where vocal content (what was said) and vocal characteristics (how it was said) may both matter. For researchers planning to fine-tune wav2vec 2.0 on domain-specific legal audio, the amount of labeled data required depends on the target task and assumes starting from a publicly available pretrained checkpoint rather than training the model from scratch. Empirical studies suggest that speech recognition tasks typically benefit from approximately 10–100 hours of transcribed audio to achieve strong domain adaptation, while simpler downstream classification tasks (such as speaker identification or binary emotion detection) may achieve reasonable performance with as little as 1–10 hours of labeled examples. Pre-trained wav2vec 2.0 models can also be applied directly—without fine-tuning—to extract general-purpose audio embeddings for use in downstream statistical analysis.
4.2.3. openSMILE
openSMILE (Speech and Music Interpretation by Large-space Extraction) is a robust open-source toolkit for extracting thousands of acoustic features from audio recordings (Eyben et al., 2010). Originally developed for emotion recognition and paralinguistic analysis, openSMILE supports a wide range of feature sets, including MFCCs, pitch contours, voice quality measures, jitter, shimmer, and more. These features are widely used in fields like affective computing and forensic phonetics.
openSMILE is especially useful in empirical legal research due to its interpretability and flexibility. It enables researchers to extract predefined sets of psychologically or physiologically relevant vocal features, making it ideal for studying emotional arousal, speaker stress, or behavioral cues in high-stakes legal interactions. For example, a researcher could use openSMILE to quantify vocal tremor or pitch variability in 911 calls to study caller distress, analyze jitter (voice instability) in witness depositions to explore anxiety or deception, or measure vocal energy in appellate arguments to compare attorney assertiveness across different types of cases. The tool’s extensive feature sets allow researchers to test specific hypotheses about the relationship between vocal characteristics and legal phenomena.
4.2.4. Whisper
Whisper, developed by OpenAI, is a general-purpose speech recognition model trained on a large multilingual and multitask dataset of diverse audio (Radford et al., 2022). Unlike traditional automatic speech recognition (ASR) systems, Whisper is designed to be robust to noise, accents, and varying audio quality—making it especially well-suited for real-world legal audio data, which often suffers from overlapping speakers, courtroom noise, or poor recording conditions.
Whisper can be used to transcribe spoken content from legal proceedings, including courtroom arguments, depositions, or administrative hearings. Accurate transcription is often a necessary first step for integrating audio analysis with natural language processing (NLP) techniques, such as sentiment analysis, speaker turn-taking analysis, or question-response mapping. In addition to producing text transcripts, Whisper also provides word-level timestamps, enabling researchers to synchronize speech content with facial expressions, gestures, or pitch changes for multimodal analysis. For example, a researcher could use Whisper timestamps to identify precisely when a judge asks a particular question, then align that moment with facial emotion data to examine whether the judge’s expression shifted during the attorney’s response.
Because Whisper is open-source and runs efficiently on consumer-grade GPUs, it offers a practical transcription solution for researchers who wish to scale up the analysis of large audio corpora without relying on proprietary platforms. This is particularly valuable for legal researchers who may face confidentiality concerns about sending sensitive audio to commercial transcription services. When combined with downstream tools like wav2vec 2.0 or openSMILE, Whisper enables a fully integrated audio pipeline from transcription to feature extraction and inference, supporting truly multimodal legal research that bridges text, audio, and visual analysis.
Each of these deep learning and hybrid toolkits offers distinct strengths. PANNs and wav2vec 2.0 excel at automatic feature learning and generalization to new domains, while openSMILE provides a highly interpretable and customizable framework for extracting known behavioral correlates from vocal data. Researchers should choose the appropriate method based on the availability of labeled data, the need for interpretability, and the complexity of the target task. As with all machine learning applications, these models should be validated carefully—ideally with human-coded benchmarks—to ensure they perform reliably within the legal domain.
4.3. Audio Demonstration
To demonstrate the practical utility of these audio methods, we apply them to courtroom video recordings from the Ninth Circuit Court of Appeals. This demonstration shows how abstract audio concepts translate into concrete visualizations that legal researchers can use to measure and compare vocal behaviors across proceedings. Figure 6 illustrates the extraction and visualization of audio features from these courtroom videos. Panels (a) and (b) display chroma spectrograms, visualizing the distribution of pitch over short and long video segments, respectively. Panel (c) presents a mel spectrogram, visualizing the distribution of sound frequencies on the perceptually meaningful mel scale over time. Panel (d) shows a waveform plot, clearly capturing amplitude variations indicative of vocal intensity and dynamics during oral arguments. Extracted audio features. Notes. Illustration of audio features extracted from Ninth Circuit courtroom videos. How to interpret: Because video audio unfolds over time, all panels use the horizontal axis to represent time. In panels (a) and (b), chroma spectrograms display pitch distributions, with the vertical axis showing pitch classes (C, C#, D, etc.). Brighter colors indicate stronger presence of specific pitches; concentrated vertical bands often correspond to sustained vocal emphasis or heightened pitch during questioning. Panel (c) presents a mel spectrogram, where the vertical axis represents frequency mapped to the perceptually weighted mel scale and color intensity indicates energy at each frequency band. Shifts in color concentration reflect changes in vocal quality or emotional intensity. Panel (d) shows the waveform, which plots amplitude (volume) over time. Larger oscillations indicate louder speech, while flatter segments indicate pauses or silence. Together, these representations allow researchers to identify moments of vocal escalation (waveform spikes), pitch modulation (chroma changes), and shifts in vocal timbre (mel patterns). When aligned with transcript timestamps, these features can be connected to specific courtroom events such as interruptions, emphasis, hesitation, or changes in affect during oral argument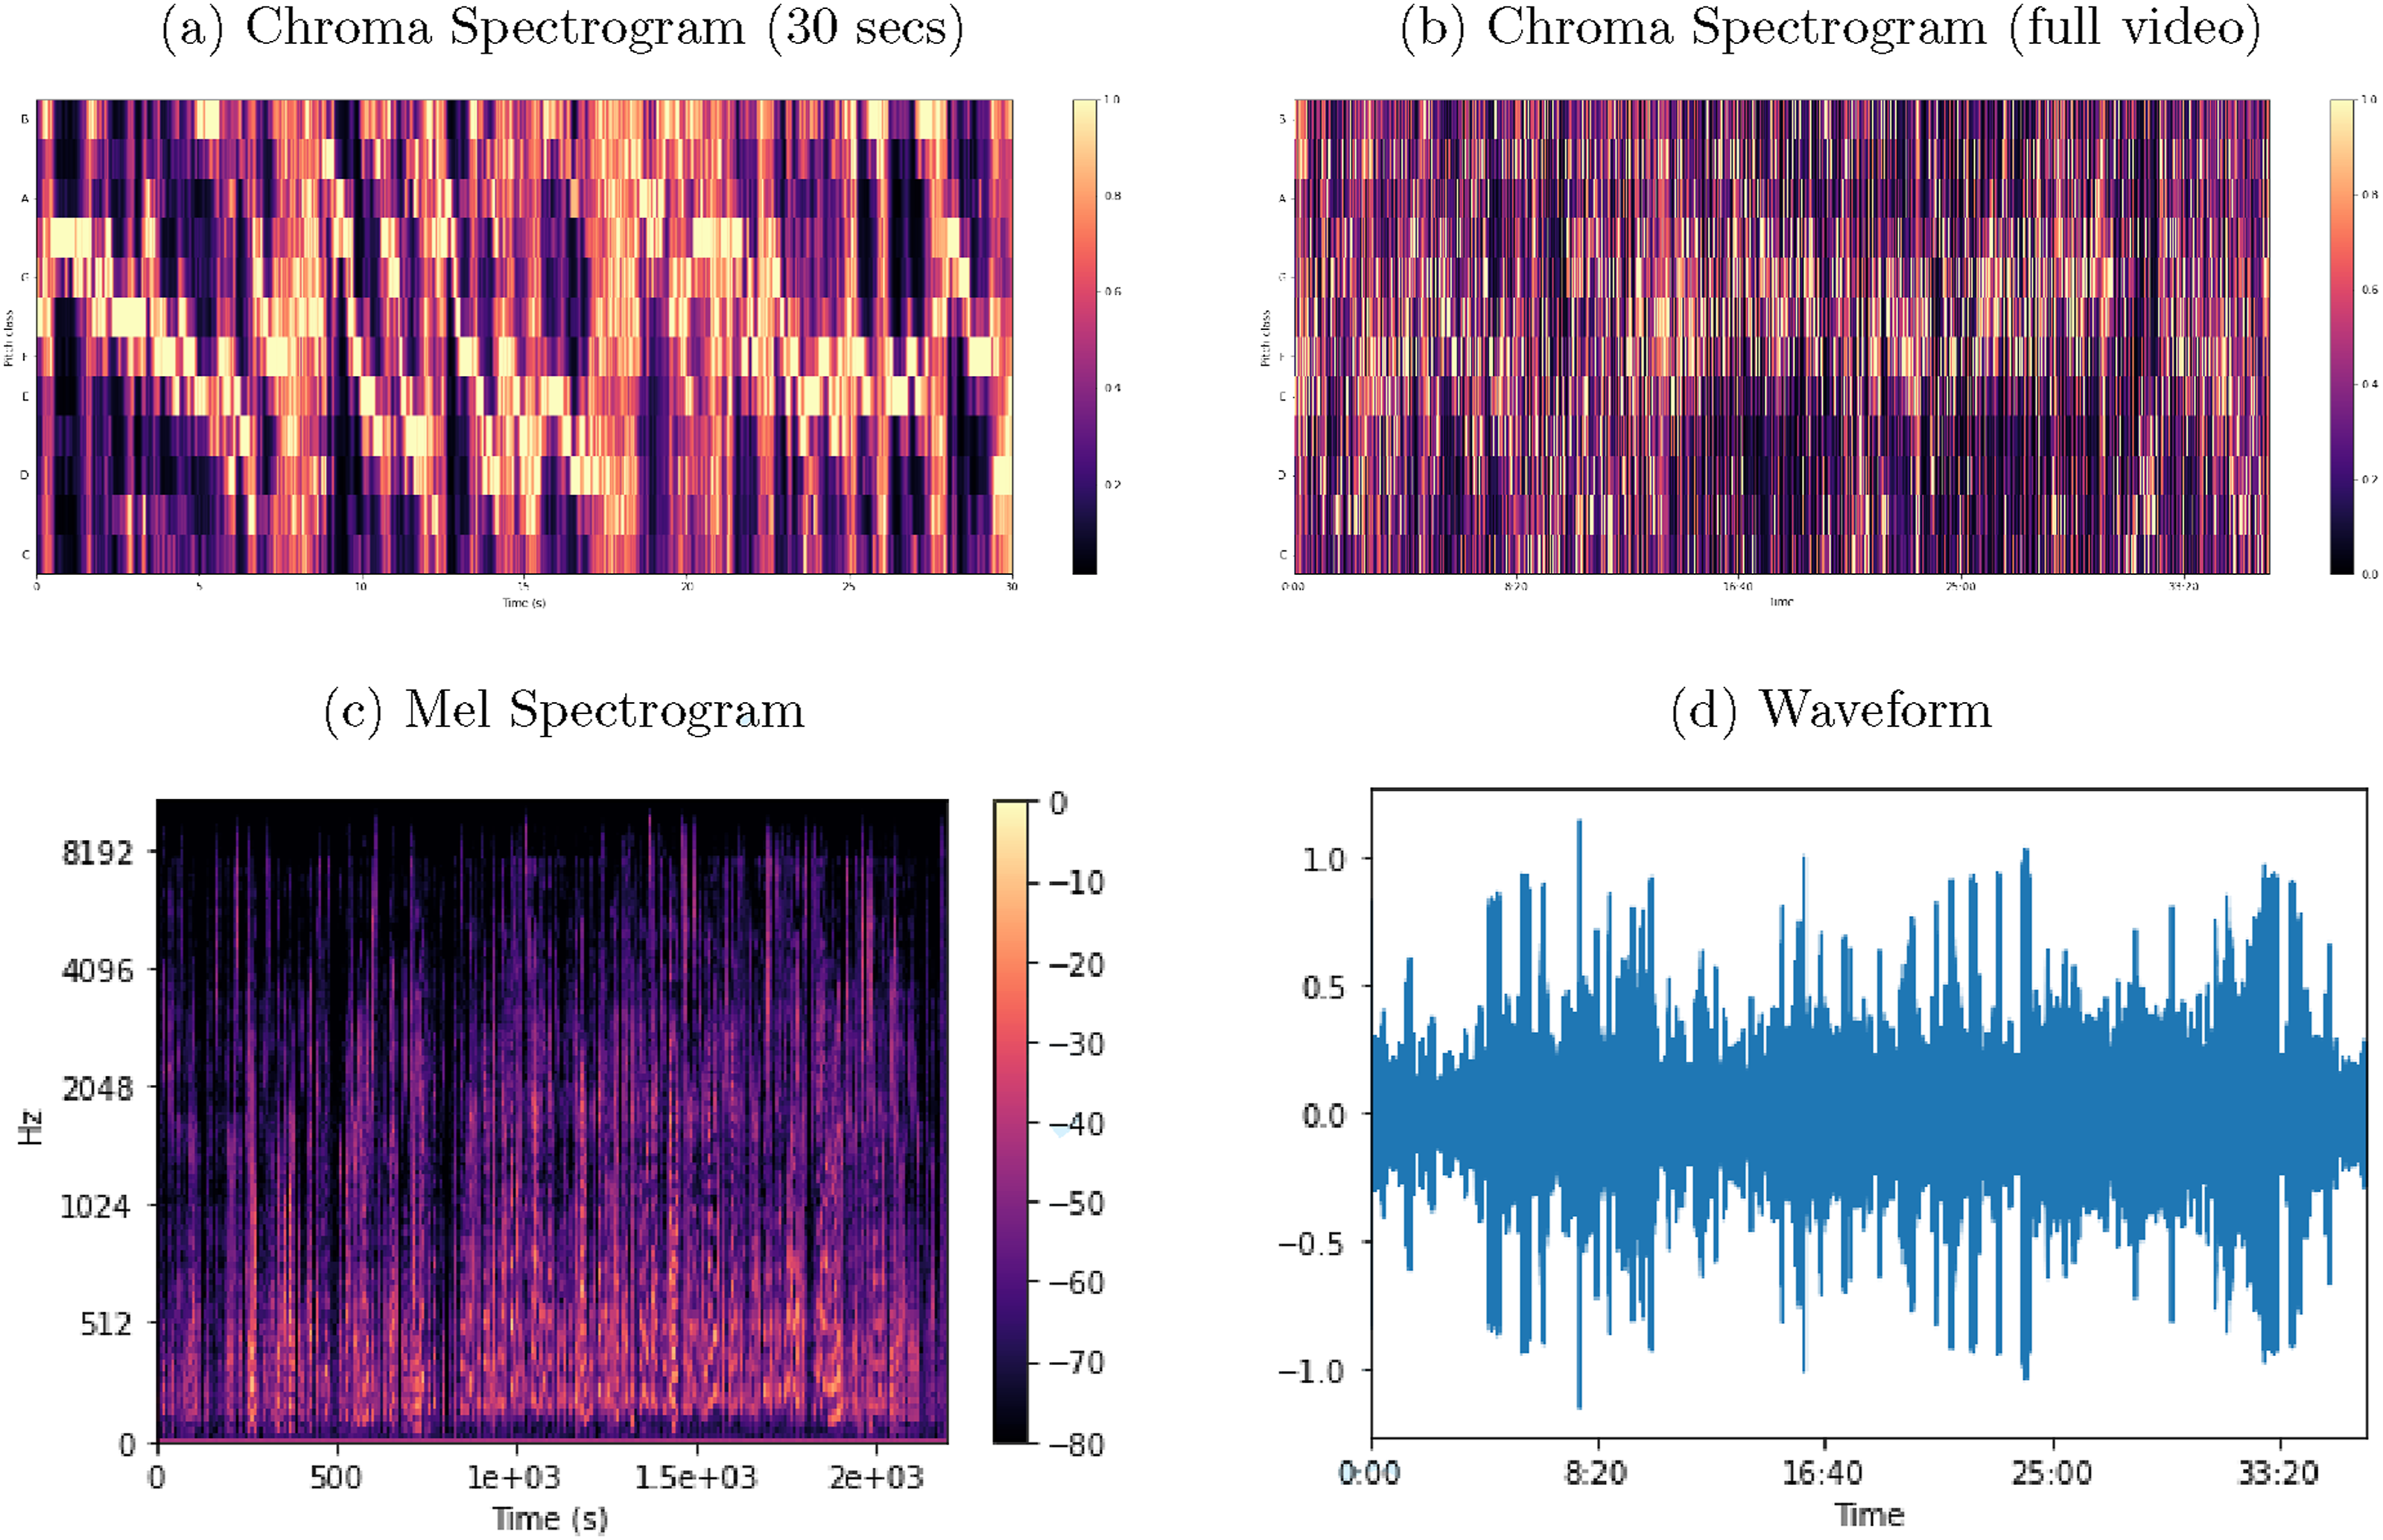
By systematically extracting and analyzing these audio features, empirical legal researchers can quantify and interpret nuanced vocal behaviors across diverse legal contexts, facilitating deeper insights into communication dynamics, speaker affect, and behavioral responses within legal proceedings.
Turning to deep learning approaches, we also demonstrate the usefulness of these methods for extending audio analysis. In legal contexts where significant amounts of audio data constitute speech, there are also clear connections to computational text analysis. For example, using the Whisper transcription model can yield high-fidelity transcripts like the following exchange from a courtroom proceeding, enabling researchers to combine automated transcription with traditional text analysis methods:
The automatic transcription of audio data such as oral arguments, legislative hearings, police interrogations, and public meetings allows researchers to incorporate computational text analysis into audiovisual workflows. Once transcripts are generated, standard text analysis techniques—such as topic modeling, sentiment analysis, or named entity recognition—can be applied to analyze the substance of legal speech.
Moreover, the alignment between speech and visual or linguistic cues (e.g., tone, volume, facial expressions) enables truly multimodal analysis. For example, researchers could analyze whether attorneys exhibit vocal hesitation or lowered volume when making weaker arguments, whether judges interrupt attorneys more frequently on certain topics (combining transcription with turn-taking analysis), or whether vocal pitch correlates with case outcomes (linking audio features to case metadata). Transcription tools like Whisper serve as a bridge between the traditionally separate domains of computational text analysis and audiovisual machine learning, enabling a more holistic analysis of law as it is practiced and performed. In Section 6, we demonstrate how these audio methods can be combined with visual analysis to provide rich, multidimensional insights into judicial behavior during oral arguments.
5. Guidelines for Audiovisual Empirical Legal Analysis
Having introduced the core computational methods for visual and audio analysis, this section provides guidance for empirical legal scholars seeking to apply these techniques in their own work. We begin with four practical considerations: data quality and preparation, model validation and reproducibility, interpretability and contextualization, and the selection of appropriate tools given the research question. We then provide a systematic overview of research questions that audiovisual data uniquely enable across five legal domains, and conclude with a discussion of legal and ethical considerations for audiovisual empirical legal research.
5.1. Data Quality and Preparation
Audiovisual analysis relies critically on the quality of the underlying data. Unlike text corpora, which are often relatively clean and compact, audiovisual materials are high-dimensional, noisy, and heterogeneous. Researchers should anticipate investing substantial time in curating and preprocessing the data. For video, this includes ensuring sufficient resolution, frame rate, and lighting to support tasks such as face or gesture detection. For audio, it involves denoising, standardizing volume levels, and possibly segmenting long recordings into meaningful units.
Annotation is equally essential. Supervised machine learning methods for visual or audio classification depend on high-quality labeled data. Manual labeling can be supported by tools such as CVAT for video or Audacity for audio segmentation. Researchers should develop clear annotation protocols, conduct intercoder reliability checks when multiple annotators are involved, and document all labeling decisions for reproducibility.
5.2. Supervised Learning
With labeled audiovisual features and associated numeric features in hand, researchers proceed by training supervised machine learning models. Commonly employed classifiers for visual data include Support Vector Machines (SVM), random forests, and neural networks (particularly CNN-based classifiers). Prior to model training, the dataset is typically partitioned into training and testing sets—often through random splitting (e.g., 80% for training and 20% for testing)—to enable unbiased evaluation of predictive performance on unseen data (e.g., Hastie et al., 2009).
During the training phase, hyperparameter tuning is an essential step for optimizing model performance. Hyperparameters—such as the number of trees in a random forest, kernel parameters and regularization strength in SVMs, or learning rates and layer configurations in neural networks—should be tuned to maximize prediction accuracy without overfitting. Common hyperparameter tuning approaches include grid search, random search, and Bayesian optimization, typically combined with cross-validation methods like k-fold or stratified cross-validation to reliably estimate performance.
After training and hyperparameter tuning, model performance is assessed using classification metrics that quantify predictive accuracy and reliability. Standard metrics include accuracy (the proportion of correctly classified instances), precision (the proportion of predicted positives that are true positives), recall (the proportion of actual positives correctly identified by the model), and the F1-score (the harmonic mean of precision and recall, particularly useful in cases of class imbalance). Additionally, confusion matrices provide valuable insights into the specific types of errors the model makes, allowing researchers to pinpoint areas of weakness or bias. These classification metrics provide critical information for model selection, comparison, and iterative improvement, ensuring that the final model meets empirical objectives and generalizes effectively to new audio and visual data.
For an accessible and more extensive introduction to machine learning hyperparameter tuning and performance metrics, we refer to Géron (2023).
Figure 7 provides an illustrative example of automated facial recognition with courtroom video data, using a neural network classifier. First, faces in the video are identified using bounding boxes generated from Haar Cascades. The neural network is then trained on labeled examples of specific judges’ faces, extracting distinctive face embeddings for each judge. At prediction time, the model assigns each detected face to a known judge label. Automated face recognition. Notes. Illustration of automated face recognition from video segments. This image shows a three-judge panel from the Ninth Circuit, with recognition done by the Haar Cascades method combined with a neural network classifier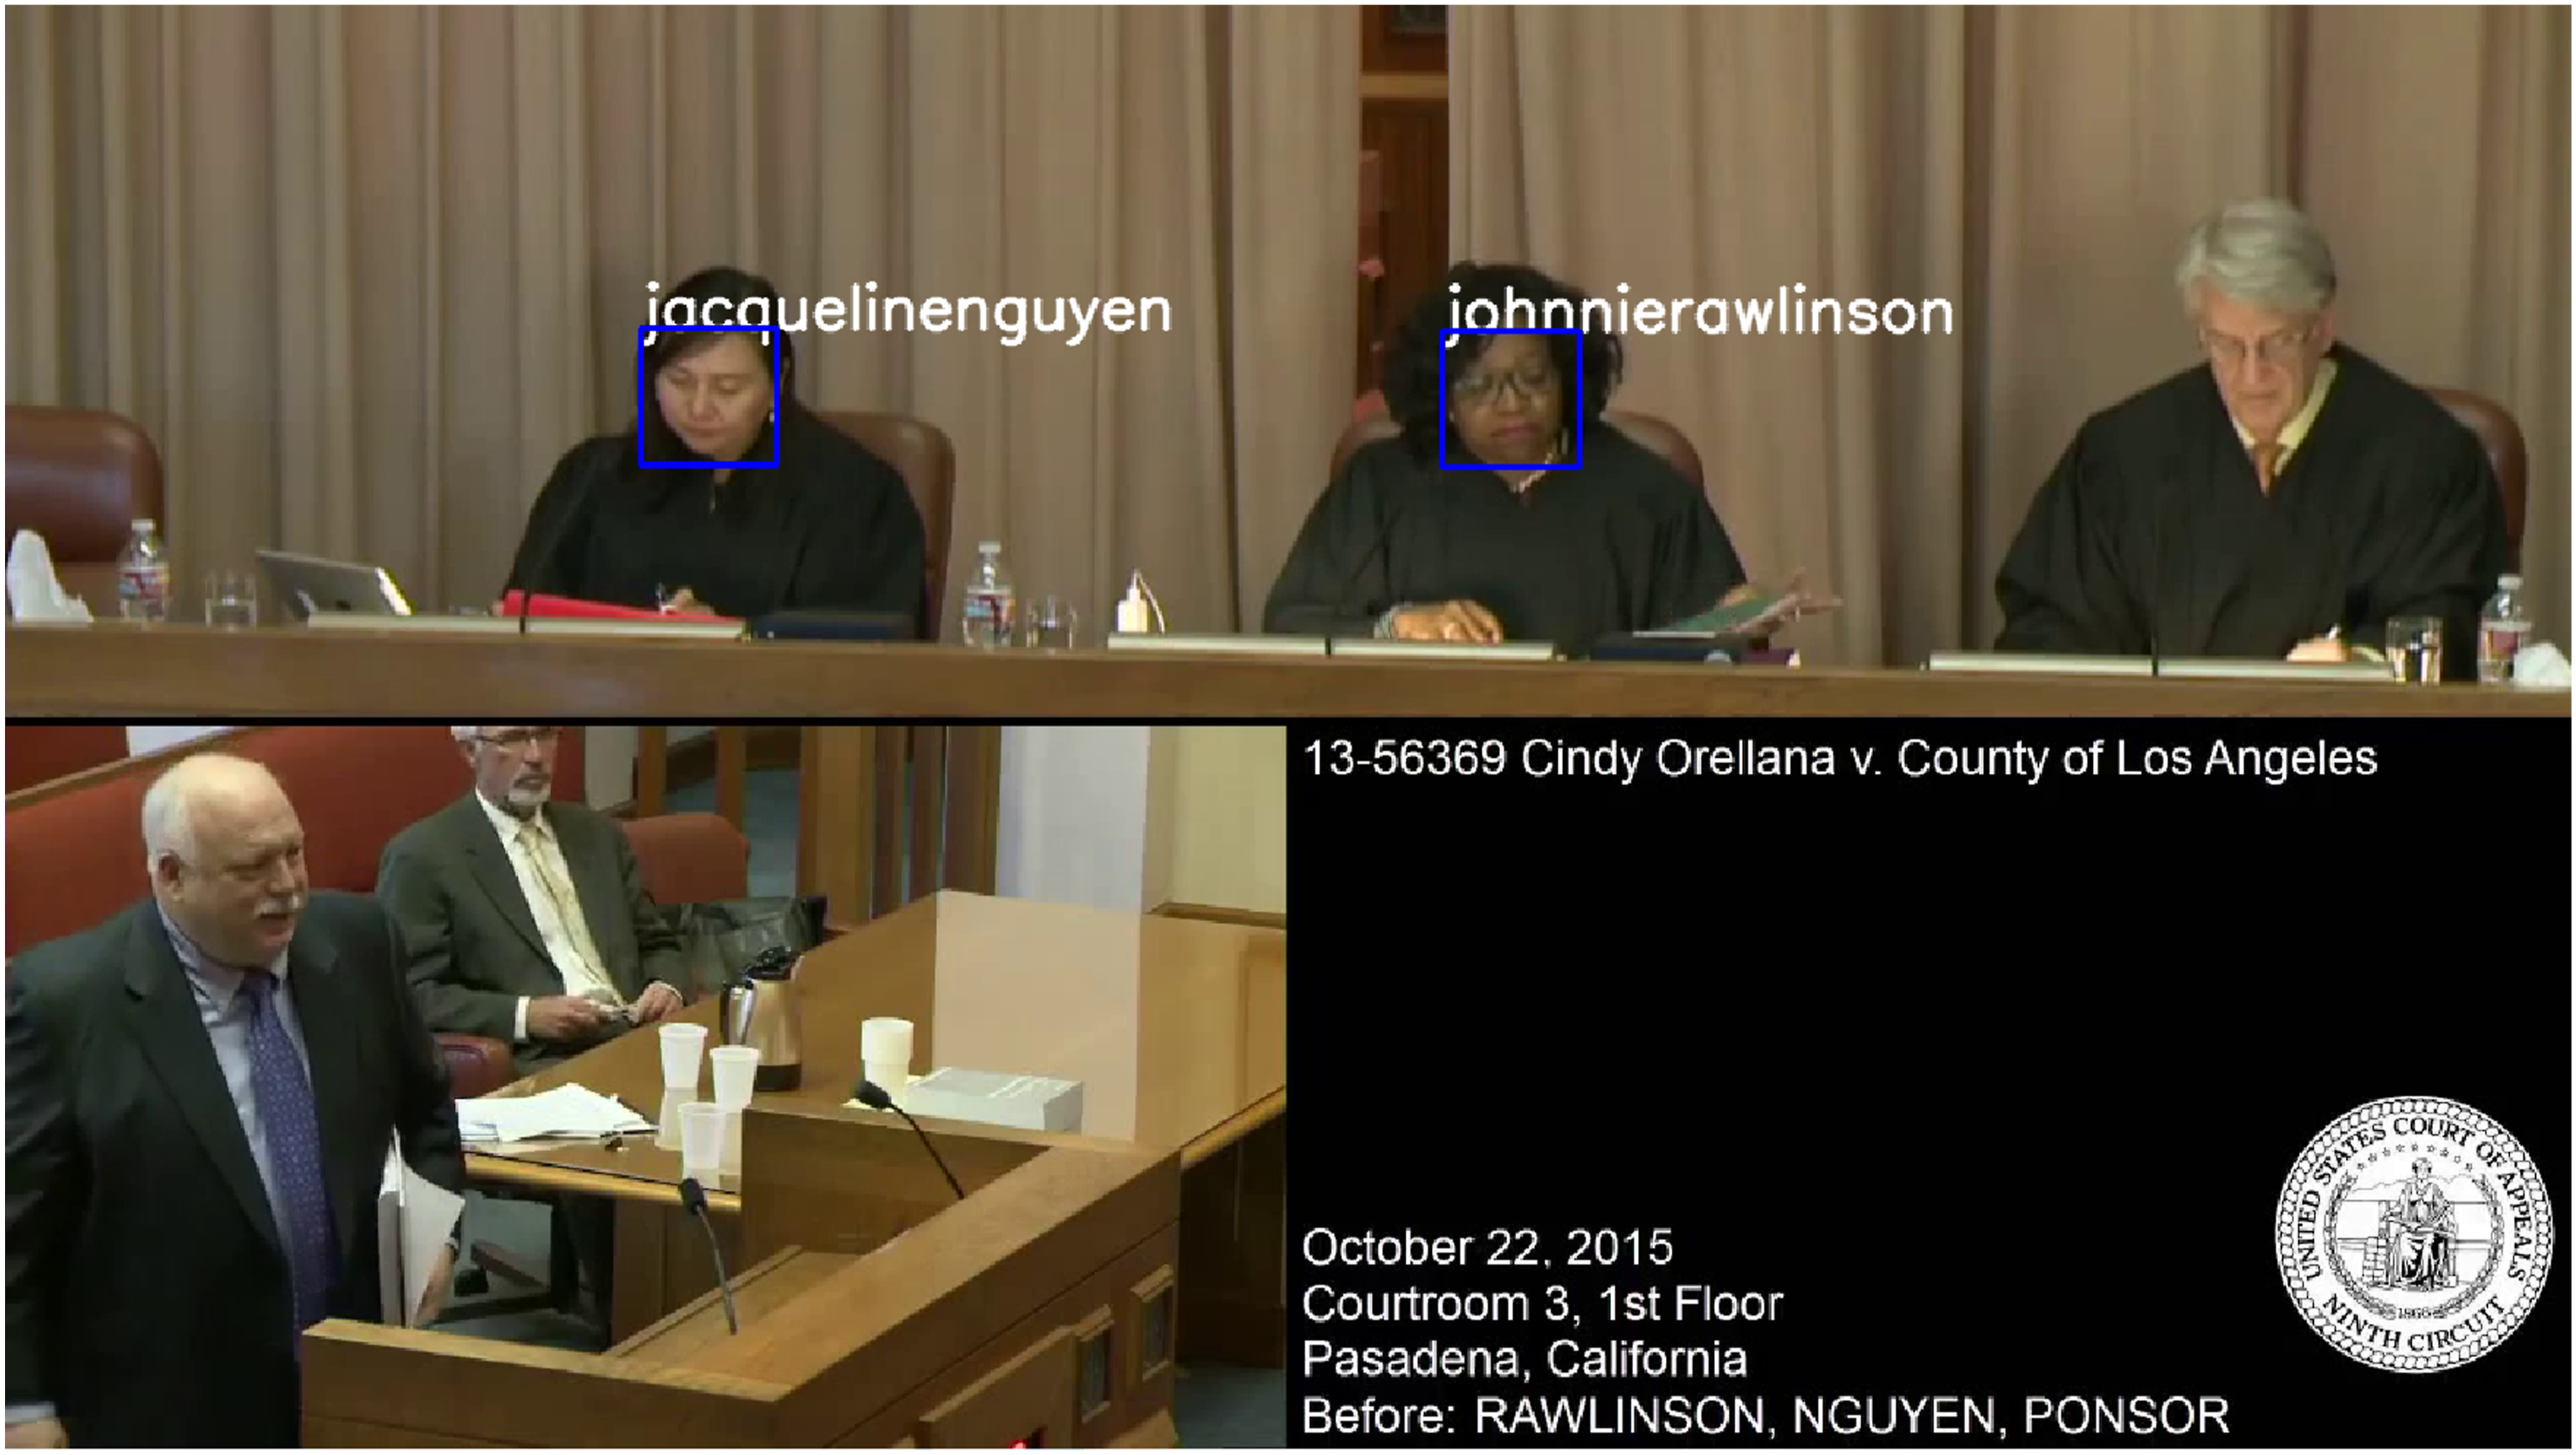
This general supervised learning approach is highly adaptable across a wide range of audiovisual tasks. In the visual domain, common applications include facial recognition, gesture classification, and pose estimation; in the audio domain, tasks may involve speaker identification, emotion detection, or sound event classification. The key to success in these applications lies in extracting relevant, high-quality features and pairing them with appropriately tuned models. Researchers can build on established machine learning frameworks to implement these workflows efficiently. By combining domain knowledge with robust model training and validation practices, empirical legal scholars can use supervised learning to uncover patterns and behaviors within legal data that would be difficult or impossible to detect through manual analysis alone.
5.3. Validation and Reproducibility
As with any empirical analysis, validation and reproducibility are core concerns. Scholars should adopt standard machine learning practices such as partitioning data into training, validation, and test sets, and reporting performance metrics (e.g., accuracy, precision, recall, F1-score) on held-out data. When possible, k-fold cross-validation or bootstrapped resampling can provide more robust error estimates.
Particular attention should be paid to domain shift. Pretrained models—for example, facial emotion classifiers trained on entertainment industry datasets—may perform poorly in legal settings, where facial expressions are subtler and more constrained. Researchers should validate model performance on a representative sample of their own data before drawing substantive conclusions.
Code, models, and subsets of annotated data should be shared—paired with the corresponding execution environment (e.g., conda virtual environments or Docker images)—whenever possible, subject to legal and ethical constraints. Projects built with open-source libraries and frameworks (e.g., OpenCV, librosa, TensorFlow, PyTorch) facilitate replication by other scholars and support the accumulation of knowledge across studies.
5.4. Interpretability and Contextualization
Many audiovisual models—particularly those based on deep learning—produce outputs that are difficult to interpret. This can limit their utility for empirical legal studies, where the goal is often to generate transparent, theory-driven insights about behavior and institutions.
To address this, we recommend two strategies. First, whenever possible, extract intermediate features that are easier to understand (e.g., frequency of specific facial expressions, speech rate, or head movements). These can often be derived from model outputs or raw data with relatively simple post-processing. Second, contextualize the features within the legal setting. For example, changes in vocal pitch or facial affect should be interpreted relative to courtroom events, such as a judge responding to a particular argument.
Researchers should remain cautious about over-interpreting affective states or inferred intentions. The outputs of emotion recognition or prosody models are best viewed as behavioral signals that may correlate with, but do not directly measure, internal mental states.
5.5. Matching Methods to Research Questions
The appropriate methodological choice depends heavily on the legal question of interest, the available data, and computational resources. Simple classification or detection tasks can often be addressed with off-the-shelf models or basic feature extraction. More complex tasks—such as modeling interaction dynamics or identifying latent behavioral patterns—may require custom model development and larger annotated datasets.
Audiovisual Methods, Tools, and Use Cases
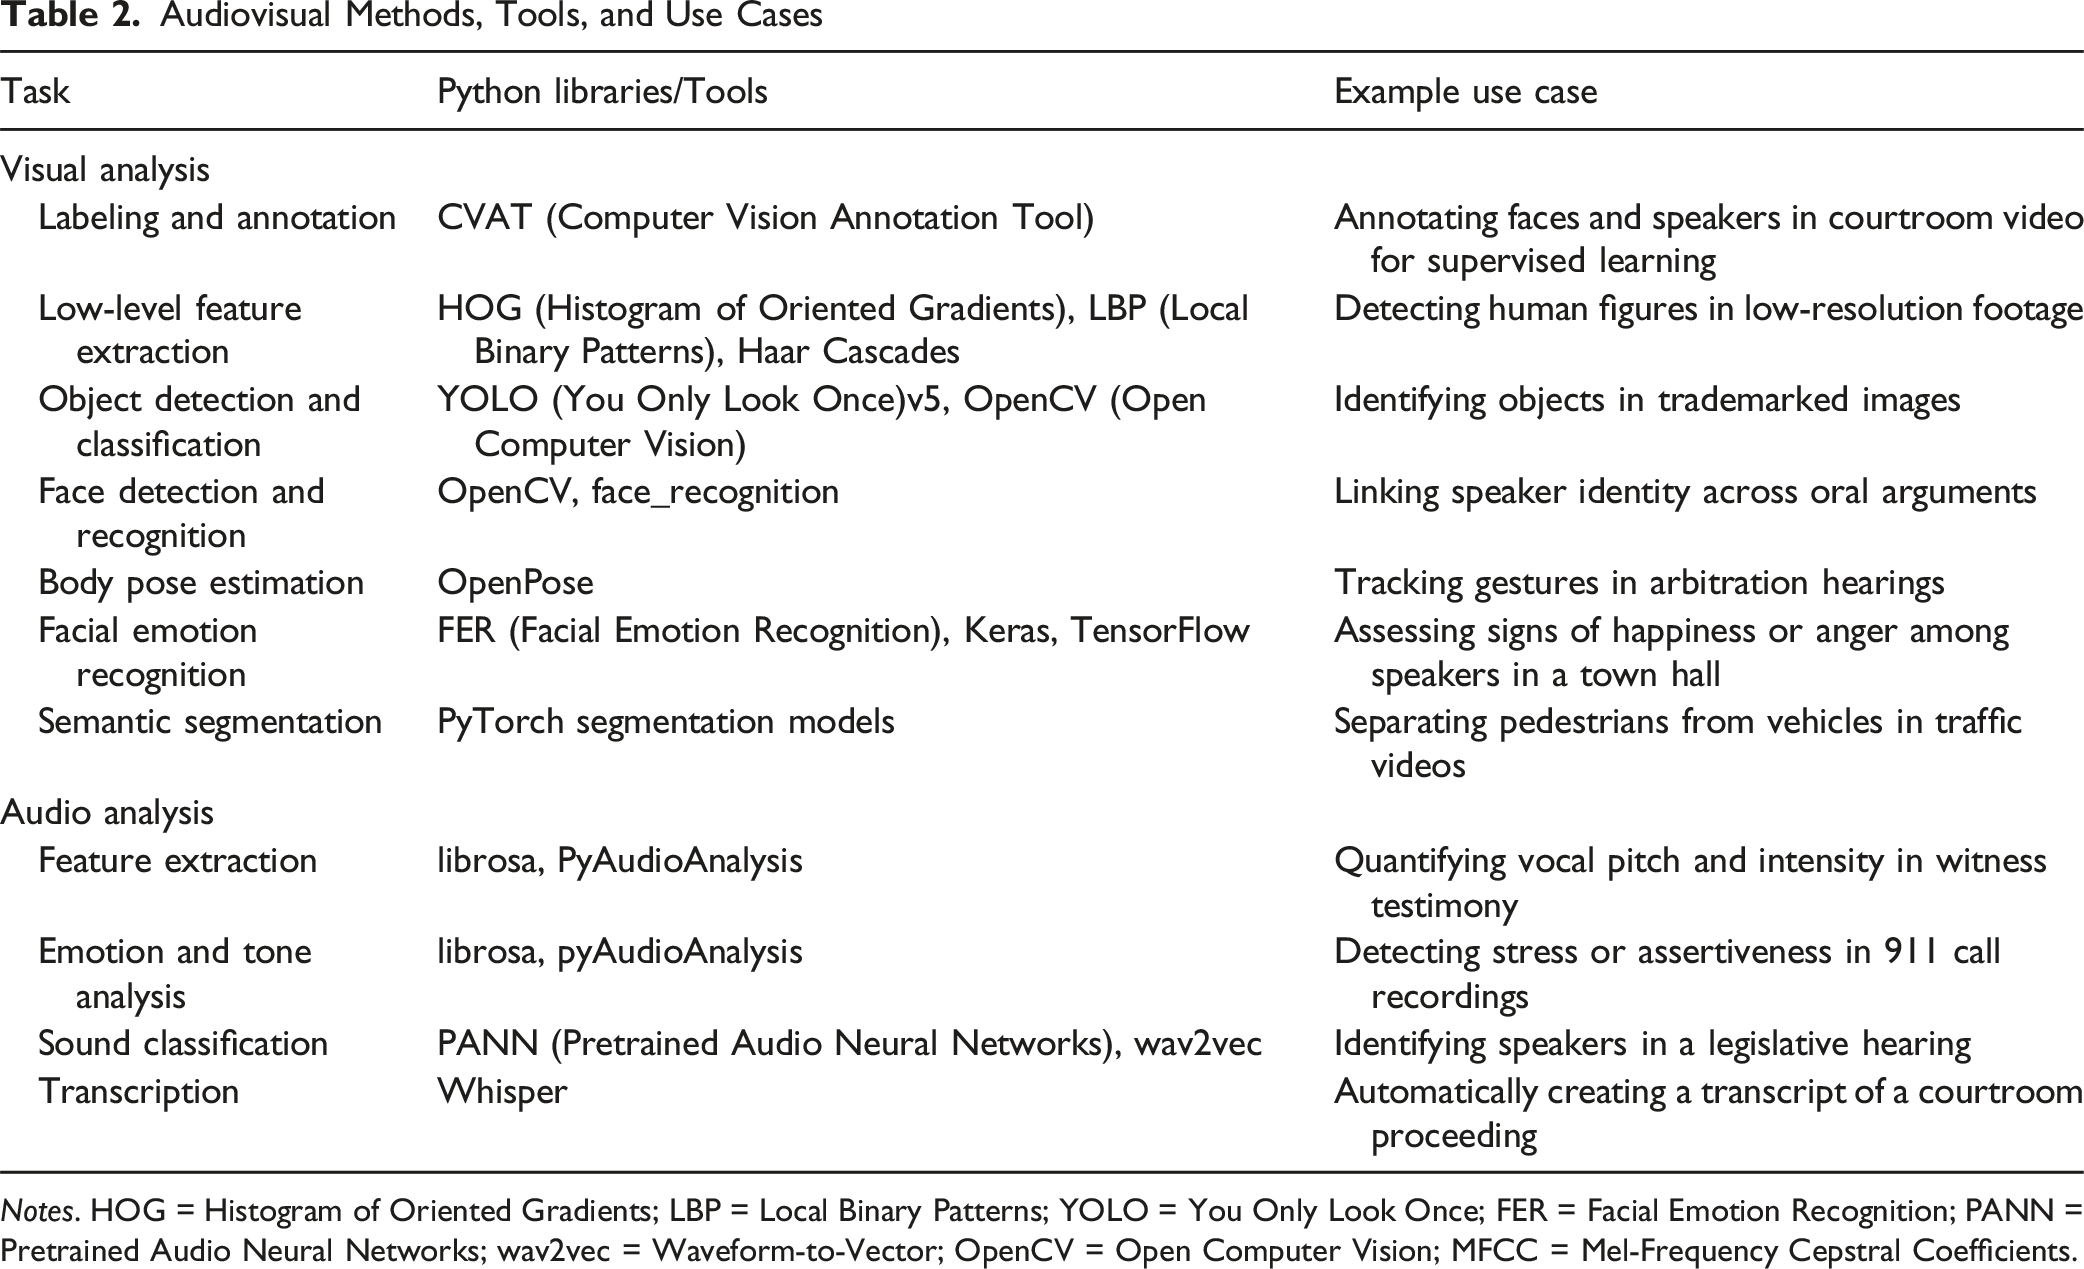
Notes. HOG = Histogram of Oriented Gradients; LBP = Local Binary Patterns; YOLO = You Only Look Once; FER = Facial Emotion Recognition; PANN = Pretrained Audio Neural Networks; wav2vec = Waveform-to-Vector; OpenCV = Open Computer Vision; MFCC = Mel-Frequency Cepstral Coefficients.
6. Empirical Analysis
Having introduced the methodological toolkit in Sections 3–5, we now demonstrate its application to our dataset of Ninth Circuit Court of Appeals oral arguments. This section presents empirical findings from applying facial emotion recognition (Section 3.3) and audio analysis (Section 4) methods to courtroom video data. We emphasize that this analysis serves primarily as a methodological demonstration rather than a causal study. Our goal is to illustrate what these methods reveal in practice, establish proof-of-concept for their application in legal contexts, and demonstrate the analytical possibilities they create for future research.
Our dataset consists of 50 randomly selected videos of Ninth Circuit oral arguments spanning 2010–2025. We link these videos to demographic and outcome data (judge votes) for this demonstration. We explore the basic question asked in Dietrich, Enos et al. (2019) (“does emotional arousal predict U.S. Supreme Court voting”), but slightly modify it to look at whether emotional and visual arousal can predict votes in a circuit court. We also specifically look at whether audio and visual features add information relative to text-only measures.
6.1. Predicting Case Outcomes With Audiovisual Features
A natural first question for audiovisual empirical legal research is whether audio and visual signals contain information about case outcomes beyond what is available from case metadata alone. We investigate this by training a series of prediction models with progressively richer feature sets and evaluating whether each additional modality improves out-of-sample predictive accuracy.
We link each of the 50 oral argument videos in our sample to its case outcome—specifically, whether the panel affirmed or reversed the lower court’s decision. We then construct three nested model specifications: • • •
Each model is estimated using gradient boosted trees and evaluated with leave-one-out cross-validation (LOO-CV), which is well-suited to our small sample because it maximizes training data while providing an unbiased estimate of out-of-sample performance for each held-out case.
Figure 8 presents the results. The baseline model achieves 64% accuracy and an AUC of 0.60, reflecting little more than the underlying rate of affirmance in our sample—effectively, the predictive floor against which richer models should be compared. Adding audio features substantially improves performance: accuracy rises to 80% and AUC to 0.87. Incorporating visual features from judicial facial expressions yields a further, though more modest, improvement to 82% accuracy and 0.89 AUC. Predicting case outcomes from oral argument signals (a) Accuracy and AUC by Model (b) ROC Curves. Notes. Panel (a) displays leave-one-out cross-validation accuracy (left) and AUC (right) for three nested model specifications estimated with gradient boosted trees. The baseline model (M1) uses only case metadata and primarily reflects the base rate of affirming. M2 adds audio features (voiced fraction, pitch, RMS energy); M3 further adds judicial facial expression features. Panel (b) displays the corresponding ROC curves. The dashed diagonal represents chance performance (AUC = 0.50)
The ROC curves in Figure 8(b) make the incremental gains visually apparent. The baseline model’s ROC curve hugs the diagonal, reflecting near-random discrimination. Adding audio features shifts the curve sharply toward the upper-left corner, and the full audiovisual model traces the highest curve overall. The separation between M1 and M2 is particularly striking, suggesting that vocal characteristics during oral argument—such as pitch variation, speech energy, and the proportion of voiced versus unvoiced segments—carry substantial predictive information about case outcomes.
These results should be interpreted as illustrative of the notion that audio and visual features can add useful information, and not a definitive study of Ninth Circuit dynamics. Our sample of 50 cases is small, and we cannot rule out overfitting even with LOO-CV, particularly given the relatively high-dimensional feature space in the audiovisual models. We do not claim that these features cause particular outcomes, nor that prediction performance would generalize to other courts or time periods. What these results do demonstrate is that audiovisual signals contain meaningful information about judicial proceedings that is absent from case metadata alone. The large jump in predictive accuracy from M1 to M2 suggests that how participants sound during oral argument—not just the formal characteristics of the case—is systematically related to how judges vote. The additional contribution of visual features in M3 suggests that judicial facial expressions capture a further dimension of the proceeding that audio alone does not fully reflect.
This aggregate analysis provides an initial affirmative answer to the motivating question of whether audiovisual features add predictive power above baseline measures. In the next subsection, we complement this cross-case perspective with a within-case analysis that illustrates the temporal richness of multimodal data.
6.2. Within-Case Dynamics
Beyond aggregate prediction, audiovisual methods enable detailed temporal analysis within individual cases. To illustrate, we examine In Ara Hovanesyan v. Eric Holder Jr., 595 F. App’x 706 (9th Cir. 2015), an immigration appeal in which the petitioner argued that an immigration judge exhibited bias during removal proceedings. The Ninth Circuit panel heard approximately 35 minutes of oral argument, with roughly the first half devoted to the petitioner’s presentation and the remainder to the government’s response, with a short rebuttal from the petitioner in the last few minutes.
Figure 9 presents a multimodal time series of the proceeding across four panels, each capturing a different modality. Together, they illustrate how text, audio, and video signals can diverge in revealing ways. Multimodal case study: Hovanesyan v. Holder. Notes. Four-panel multimodal time series for Ara Hovanesyan v. Eric Holder, Jr. Panel (A) shows the speaker timeline from diarization; the dashed line marks the transition from petitioner to respondent. The red-shaded region highlights a tense exchange in which the petitioner’s attorney struggles to answer a question about whether the petitioner has been released (see here for the clip); the green-shaded region highlights a moment where Judge Wardlaw is visibly laughing (see here for the clip). Panel (B) plots text sentiment (VADER compound scores, rolling window). Panel (C) plots voiced fraction (pYIN algorithm); lower values indicate more pauses and disfluency. Panel (D) plots facial happiness probability (FER library), renormalized over happy, neutral, and angry classifications for each judge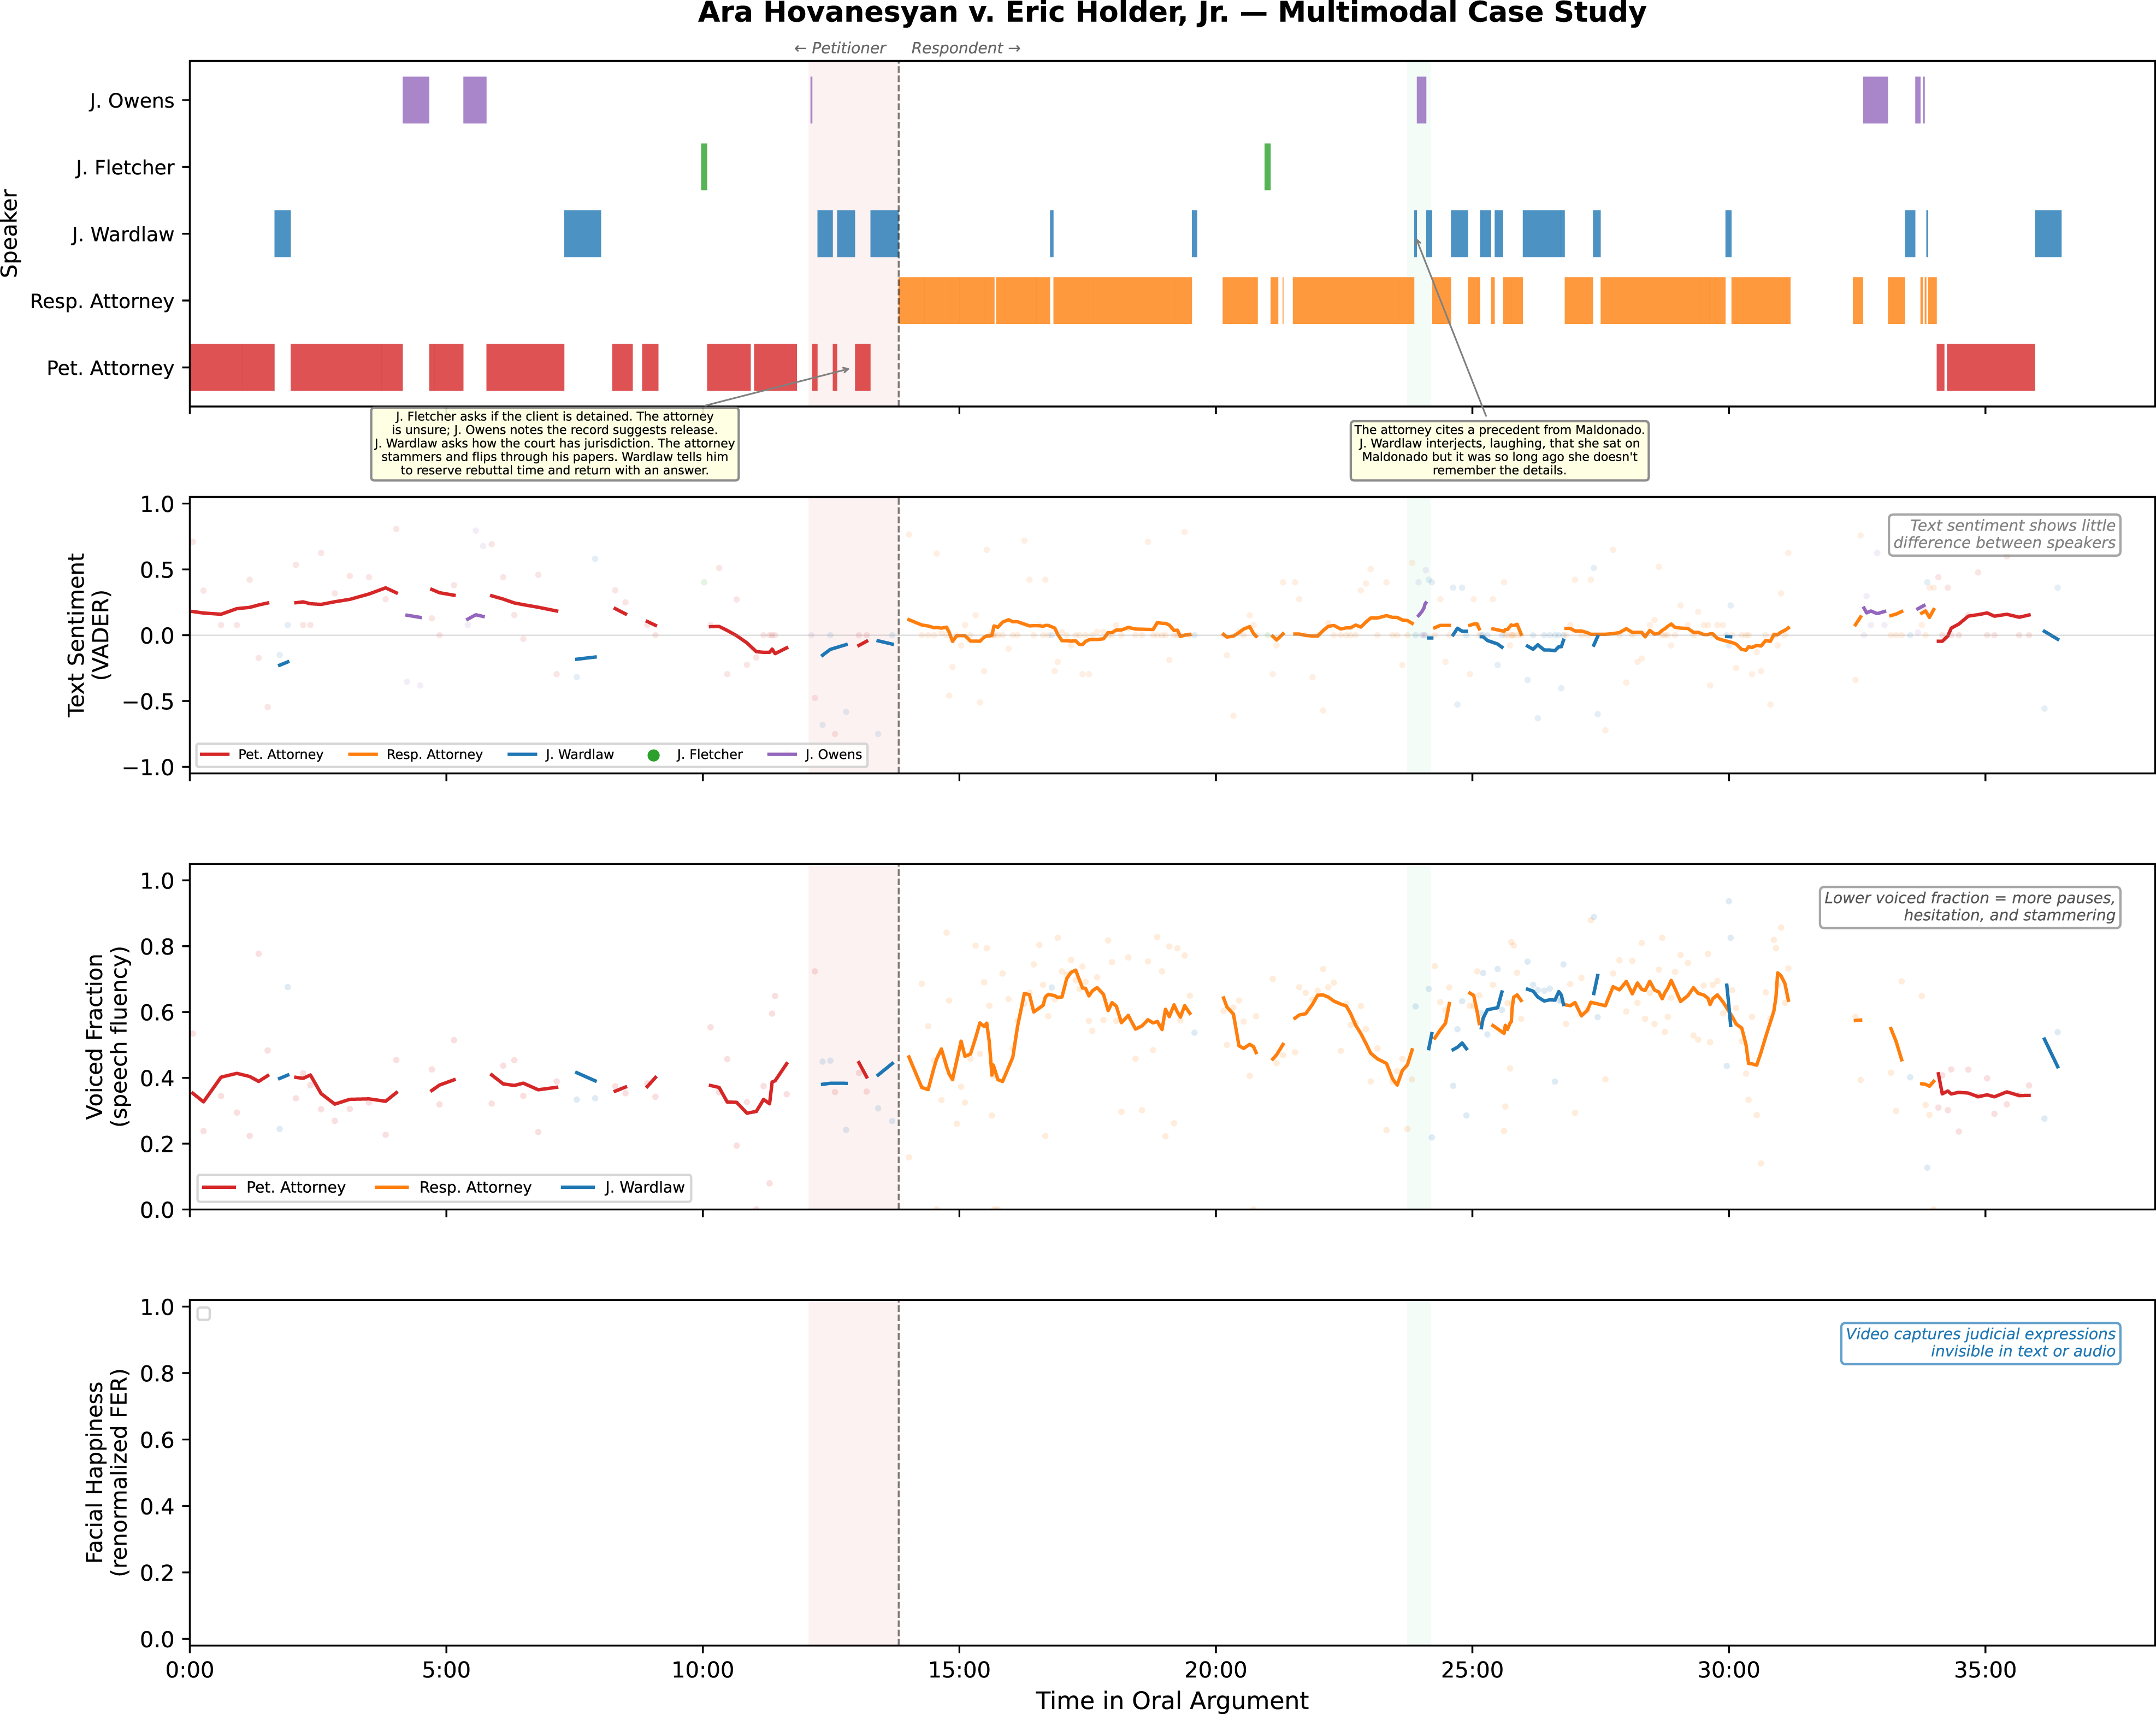
Panel (A) shows the speaker timeline derived from automated diarization. The petitioner’s attorney dominates the first half; the respondent’s attorney takes over after approximately the 15-min mark, with Judge Wardlaw interjecting frequently throughout the second half. Two annotated regions highlight key moments. The first red-shaded region in which the petitioner’s attorney struggles to answer basic questions from the panel about whether the petitioner is still detained. The second is a green-shaded region where the government attorney mentions a previous precedent (“you’re most likely familiar with this from the Maldonado case”), and Judge Wardlaw interjects with laughter saying, “I was on Maldonado, but it was so long ago I don’t remember it”.
Panel (B) plots text sentiment using VADER compound scores smoothed over a rolling window. Notably, text sentiment suggests the petitioner’s attorney is more positive than the respondent’s attorney on average. This masks the actual courtroom dynamic: the petitioner’s attorney is struggling while the government’s attorney speaks with confidence. Text sentiment, in other words, captures the valence of the words spoken but misses how they are delivered.
Panel (C) plots voiced fraction—the proportion of audio frames in each speech segment with a detected audio pitch, estimated using the pYIN algorithm (Mauch & Dixon, 2014). Lower voiced fraction indicates more pauses, hesitation, and disfluency. During the red-shaded exchange, the petitioner’s attorney exhibits noticeably lower voiced fraction, consistent with the stammering and paper-shuffling visible in the video. This audio feature captures what text sentiment cannot: the petitioner’s attorney is not calmly making positive statements but haltingly searching for answers.
Panel (D) plots facial happiness probability from the FER library (Arriaga et al., 2019), for each of the three judges. During the tense exchange (red region), all three judges’ happiness scores decline. By contrast, during the Maldonado exchange (green region), Judge Wardlaw’s happiness probability rises sharply, consistent with her visible laughter in the video.
The key insight from this case study is the divergence across modalities. A researcher relying on transcripts alone would see a petitioner’s attorney using relatively positive language and might infer a competent presentation. Audio analysis reveals a different story: hesitation, disfluency, and low voiced fraction suggest the attorney is struggling. Video analysis adds yet another layer: judges’ facial expressions track the quality of advocacy in real time, declining during weak moments and rising during lighter exchanges. No single modality captures the full picture; each contributes incremental information.
We emphasize that this analysis is necessarily descriptive and illustrative. We cannot make causal claims about the relationship between these behavioral signals and the panel’s ultimate decision. But the Hovanesyan case demonstrates that audiovisual methods reveal dimensions of courtroom interaction—attorney fluency, judicial affect, the temporal arc of engagement—that are invisible in text alone. With larger samples, researchers could investigate whether such patterns occur systematically across cases and whether they correlate with outcomes, raising questions about argument quality, judicial engagement, and potential bias.
This within-case approach complements the aggregate analysis in Section 6.1. Where the prediction exercise shows that audiovisual features carry information across cases, this analysis shows what that information looks like within a single proceeding—offering two distinct but compatible modes of audiovisual legal research.
7. A Research Agenda for Audiovisual Empirical Legal Studies
Illustrative Research Questions Where Audiovisual Data Provide Incremental Value
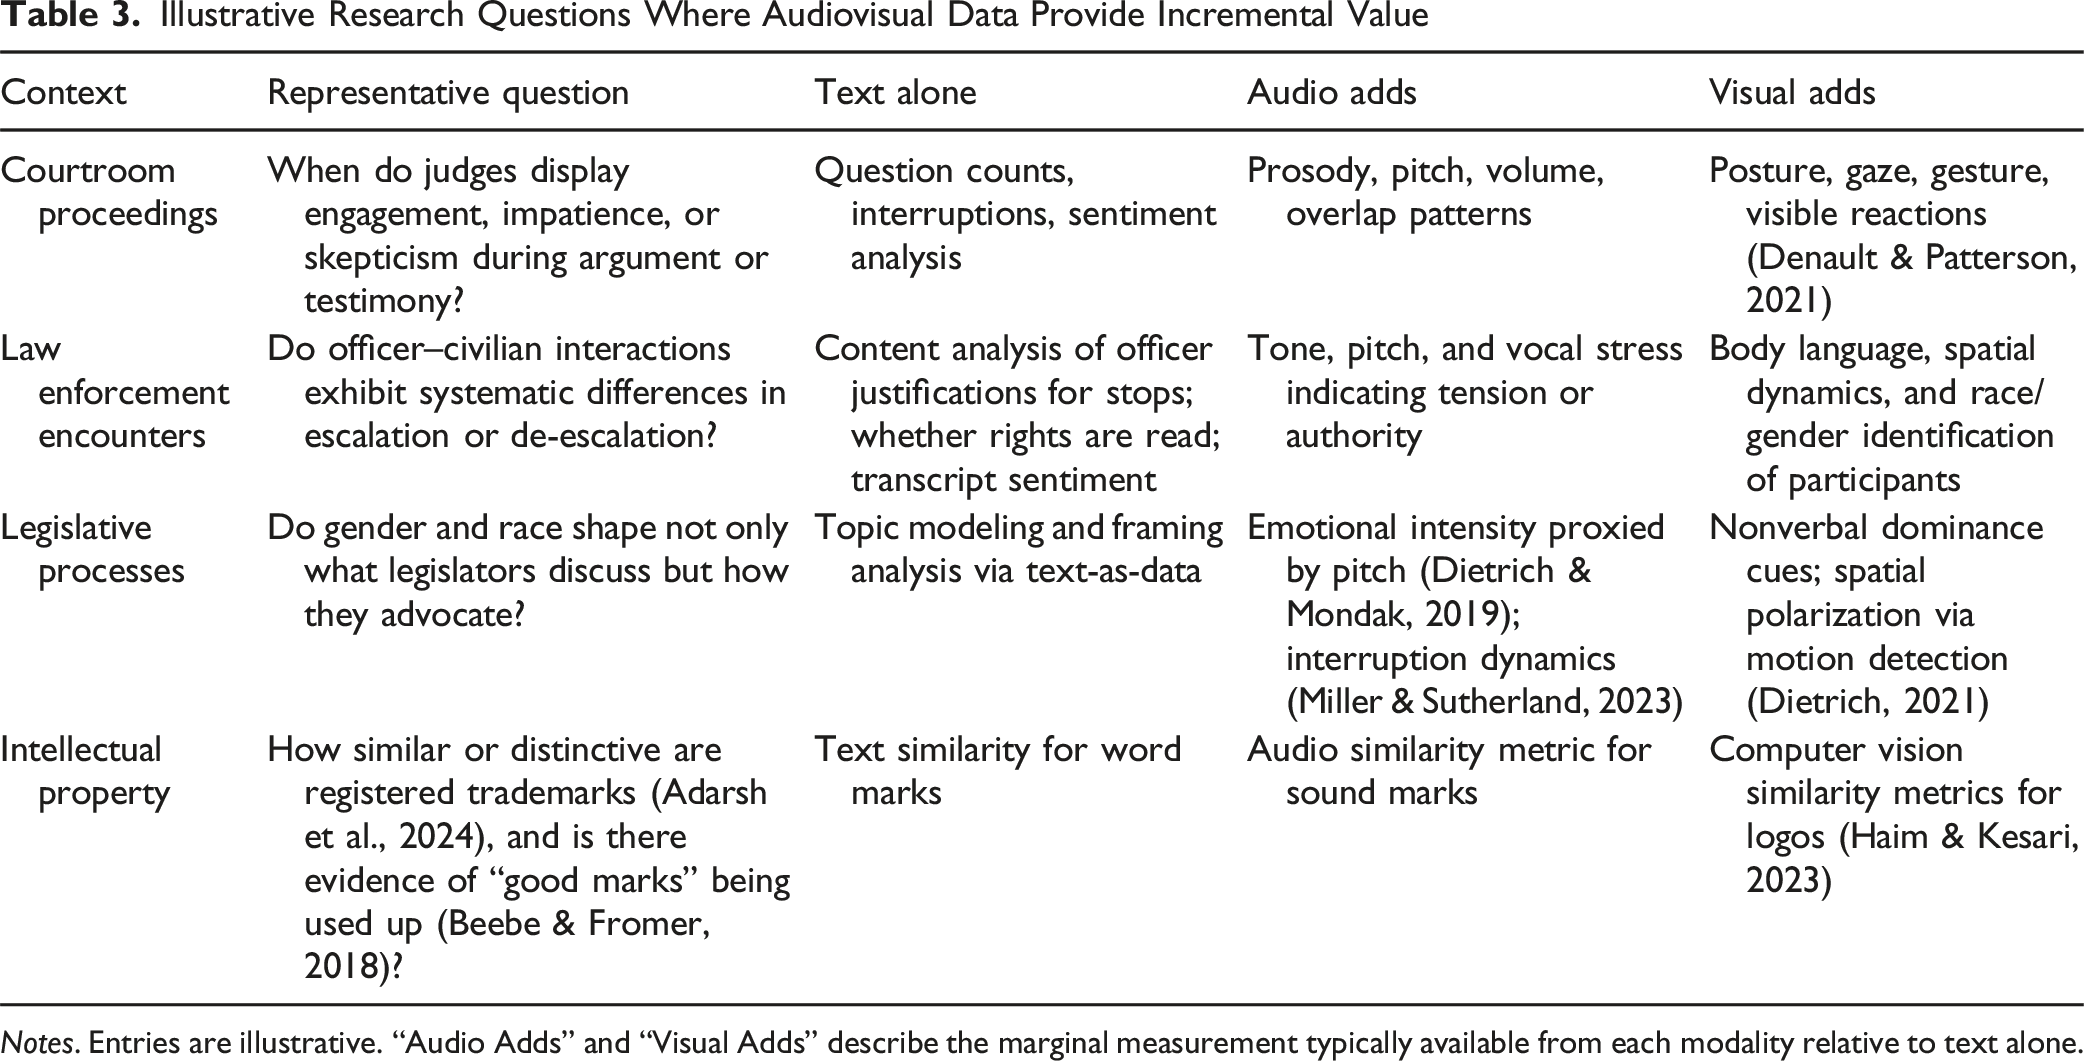
Notes. Entries are illustrative. “Audio Adds” and “Visual Adds” describe the marginal measurement typically available from each modality relative to text alone.
Two general principles emerge. First, audiovisual methods are most valuable when the construct of interest cannot be fully captured in text. This includes paralinguistic phenomena—vocal intensity, pitch dynamics, hesitation, interruption patterns—as well as visual signals such as facial expressions, posture, spatial positioning, and image similarity. In legislative settings, vocal pitch predicts behavioral dynamics even after controlling for textual content (Dietrich & Mondak, 2019), and interruption patterns reveal gendered interaction differences not fully visible in edited transcripts (Miller & Sutherland, 2023). In intellectual property, the visual similarity of logos and the acoustic similarity of sound marks are inherently non-textual constructs that require image and audio analysis to measure at scale.
Second, multimodal analysis enables triangulation. Text, audio, and visual data each contain distinct sources of measurement error. Transcription conventions can obscure overlap; camera framing can hide gestures; speaker-specific vocal baselines can confound pitch-based measures. Combining modalities helps distinguish robust patterns from artifacts of any single signal channel and clarifies mechanisms—for example, whether shifts in outcomes coincide with changes in conversational flow, vocal intensity, or visible attention. As the Hovanesyan case study in Section 6.2 illustrated, text sentiment, audio fluency, and facial expressions can each tell a different story about the same proceeding.
Audiovisual data also raise distinctive ethical considerations. Audio and visual records often increase identifiability and sensitivity relative to text-only data. Researchers should adopt secure storage practices, consider aggregation or de-identification where feasible, and treat affect labels as behavioral indicators rather than direct measures of internal mental states. Because models for facial expression and vocal emotion are imperfect and may perform unevenly across demographic groups, validation on domain-specific samples is essential.
8. Conclusion
Audiovisual data—encompassing images, videos, and audio recordings—represent a rich but still underutilized resource for empirical legal scholarship. As computational tools in computer vision and audio analysis have matured and become more accessible, empirical legal researchers are now able to measure dimensions of legal behavior that transcripts alone cannot capture. These tools complement traditional qualitative and textual approaches while expanding the range of observable phenomena within legal institutions.
This article introduced a practical methodological framework for incorporating audiovisual data into empirical legal research. We emphasized the parallels between audiovisual and textual analysis—feature extraction, validation, and interpretive caution—while also identifying distinctive challenges, including multidimensional measurement, model performance, and computational demands. Through demonstrations drawn from courtroom proceedings, we showed how audiovisual methods can quantify facial expressions, body language, vocal characteristics, and affective trajectories—behavioral signals that remain invisible in written records.
The broader implication is not limited to courts. Legislative hearings, law enforcement encounters, emergency communications, and disputes involving visual evidence all involve performative and interactional dimensions that are only partially reflected in transcripts or structured datasets. In these settings, audiovisual analysis enables empirical scholars to examine delivery, reaction, escalation, and engagement alongside textual content. The systematic framework presented here is intended to help researchers identify when such methods offer meaningful marginal value and how to deploy them responsibly.
Law is not solely a textual enterprise; it is enacted through speech, gesture, tone, and interaction. By incorporating audiovisual data into empirical inquiry, legal scholars can develop more complete accounts of how legal processes unfold in practice. The tools are now sufficiently mature for broader adoption. The next step lies with the empirical legal community: to apply, test, refine, and critically evaluate these methods across diverse institutional contexts.
Footnotes
Acknowledgements
We thank Anton Boltachka, Vitor Goergen, Laura Kesten, and Nianyun Li for helpful research assistance.
Funding
The authors received no financial support for the research, authorship, and/or publication of this article.
Declaration of Conflicting Interests
The authors declared no potential conflicts of interest with respect to the research, authorship, and/or publication of this article.