
Abstract
U.S. law requires the Attorney General to collect data on hate crime victimization from states and municipalities, but states and localities are under no obligation to cooperate by gathering or sharing information. Data production hence varies considerably across jurisdictions. This paper addresses the ensuing “missing data” problem by imputing unreported hate crimes using Google search rates for a racial epithet. It uses two alternative benchmarks for which jurisdictions more effectively collect hate crime data: all states that were not part of the erstwhile Confederacy, and those states with statutory provisions relating to hate crime reporting. We regress rates of racially-motivated hate crimes with African-American victims on Google searches and other relevant variables over 2004–2015 at the state-year level for each group of benchmark states. Adding the Google search rate for the epithet substantially enhances the model’s predictive power among benchmark states. We use the results of these regressions to impute hate crime rates, out-of-sample, to non-benchmark jurisdictions that do not robustly report hate crimes. The results imply a substantial number of unreported hate crimes, concentrated in particular jurisdictions. It also illustrates how internet search rates can be a source of data on attitudes that are otherwise hard to measure.
Introduction
Under the 1990 Hate Crimes Statistics Act (“HCSA”), the Attorney General of the United States is mandated to collect and publish annual data on the occurrence of hate crimes (Pub. L. 101-275). The HCSA defines hate crimes as “crimes that manifest evidence of prejudice based on race, gender and gender identity, disability, sexual orientation, or ethnicity.” 1 It also enumerates a non-exclusive class of covered offenses, including “murder, non-negligent manslaughter; forcible rape; aggravated assault, simple assault, intimidation; arson; and destruction, damage or vandalism of property.” The Attorney General has delegated statutory responsibility under the HCSA to the Federal Bureau of Investigation (“FBI”) as part of its obligations under the Uniform Crime Reporting (“UCR”) system (Ahuja, 2016).
The FBI solicits information from law enforcement agencies in the fifty states. Federal law, however, imposes no mandate on states to collect or report hate crime data: states’ and municipalities’ cooperation under the HCSA is voluntary. Nor does federal law provide funding for this purpose. In 2016, 1,776 (11.6 percent) of the 15,254 participating state and local law enforcement agencies reported 6,121 incidents. The remaining 88.4 percent of agencies reported none (FBI, 2017).
To what extent does this overwhelming pattern of non-reporting rest on the absence of relevant crimes, and to what extent does it reflect a failure on the part of participating state and local agencies to acquire and pass on information? One analysis estimates that a third of zero-report agencies had investigated at least one relevant bias-motivated crime within a calendar year (Cronin et al., 2007). This apparent “false zero” problem has attracted some academic attention (e.g., Lantz et al., 2024; Piatkowska et al., 2019). However, no comprehensive study estimates the extent (if any) or the geographic distribution of missing hate crimes data. Data from the National Crime Victimization Survey (“NCVS”) on bias-motivated offenses reported by victims represent a partial exception to the unavailability of hate crimes data in many localities, although (as discussed below) it is a quite limited one.
We present in this article a new method for estimating state-specific rates of hate crimes to address this missing data problem. The method allows us to calculate (at best lower-bound) estimates for the rate of predicted anti-Black hate crimes for all states, and in particular states for where underreporting seems acute. Our method arguably represents an important step toward filling present gaps in otherwise incomplete victimization data. In practical terms, it provides guidance as to where and how resources to prevent and address hate crimes might be best deployed. In addition, the method also has more general application to impute aggregate rates of otherwise unobserved attitudes or victimization.
Our method of imputation relies on a measure of racial animus first constructed by Stephens-Davidowitz (2014). This measure is based on data generated by the web search engine Google. The Google Trends data, which has been available publicly since 2006, provides a time-series index of the queries that users enter into the Google search engine in a given geographic area in a given time period. Google Trends calculates an index value for the relative prevalence of a given search query within a particular state during the relevant time period (Choi & Varian, 2012). Following studies in financial economics, public health, and social sciences, we follow earlier research in using Google search data derived from the Trends app as a proxy for the roughly contemporaneous preferences and behaviors of internet users (see, e.g., Choi & Varian, 2012; Jun et al., 2017; Stephens-Davidowitz & Varian, 2015). Specifically, the Stephens-Davidowitz (2014) measure is the rate of Google searches for the racial epithet “n______”.
Hate speech (or online searches for racial epithets) and hate crimes, of course, do not necessarily correlate: not everyone who engages in the former acts violently. The purpose of this study is rather to determine, at an aggregate population level, whether the frequency of search for hateful terms is correlated with — and hence can be used as a proxy for - unobserved hate-based victimization. Thus, the aim here involves imputing values for missing data, not causal inference. We are not making the causal claim that Google searches for racial epithets cause hate crimes to be committed. Nor do we claim that the people carrying out such searches are necessarily involved in committing hate crimes. Rather, we hypothesize that the aggregate Google search rate serves as a proxy for the ecological prevalence of racial animus within a particular jurisdiction at a particular time. Building on this hypothesis, we further postulate that this search rate separately correlates to the extent to which residents of a particular state in a given year commit hate crimes targeting African-Americans.
There are, we emphasize, several inferential steps in the chain of reasoning that posits a correlation between Google searches for the epithet to actual hate crime rates. First, internet users’ choice of search terms must track underlying attitudes at least at an ecological level. More specifically, our claim rests on the premise that aggregate rates searches for the racial epithet must reflect racial animus not necessarily at the level of the individual internet user, but at a broader geographical level—a claim that is fundamental to the Stephens-Davidowitz (2014) measure. Second, these attitudes (as measured by Google searches) must be related to behavioral choices. Again, this is not a claim about correlations at the individual level, but rather at a broader demographic and geographical level.
In contrast to this claim about correlations at an ecological level, the attitude-behavior nexus at the individual level is the subject of a large literature in social psychology (e.g., Ajzen & Fishbein, 1980), some of which finds this relationship to be relatively weak. It is important to caution that we do not make any general theoretical claims about the relationship between individual attitudes and Google searches, nor about the attitude-behavior nexus. Rather, we treat these ecological correlations as open empirical questions. That is, we test whether in our particular context (within a subsample of states in which we have reason to believe that hate crime reporting is relatively more reliable) Google searches for the epithet significantly enhance the predictive power of the model with respect to hate crime rates. These tests are described and discussed in detail below.
We also use a measure of reported hate crimes from the FBI data. We obtain this from the Inter-university Consortium for Political and Social Research (ICPSR) at the University of Michigan, at the state-year level for 2004–2015. To correspond to the epithet on which we collect Google search data, we focus on racially-motivated hate crimes with African-American victims. There is substantial variation in reported hate crime rates across states and longitudinally. Several states in the south and southeast that have historically been the locus of intense racial conflict and violence report exceptionally low rates of hate crime. These states also have Google search rates for the racial epithet that are substantially above the national average.
There are two interpretations of this difference. A first is that jurisdictions in which online expressions of animus are higher have lower levels of actual hate crimes. This hypothesis is undermined by evidence that, at the national level and in jurisdictions with robust reporting mechanisms, the rate of Google searches for racial epithets and the rate of reported hate crimes are significantly positively correlated. A second hypothesis is that where history and current search activity suggest higher levels of racial animus, this difference reflects gaps in reporting hate crime incidents. For reasons explained below, our analysis broadly supports this second hypothesis.
Our analysis further aims to generate estimates of the number and rate of hate crimes for those jurisdictions in which underreporting is likely acute. To estimate the relationship between search rates and reported crime rates, however, we need to identify on a priori grounds a subset of states that we have reason to believe are relatively comprehensive in their reporting. To do this, we follow two alternative approaches. These ultimately yield similar results—which provides support for our approach.
First, as many of the anomalously low-reporting states were historically part of the erstwhile Confederacy, we use all other states (i.e., all states and the District of Columbia (DC), apart from the 11 formerly Confederate states) as a first set of benchmark ‘robust reporting’ jurisdictions. Second, and alternatively, we use the presence of training programs for law enforcement officers on hate crimes and other relevant factors to identify 13 “good reporters” (consisting of 12 states and the District of Columbia).
We construct regression models to predict hate crime rates using a set of demographic, economic and general crime variables (but not the Google search measure) for each of our baseline sets of states. Then, we add the Google search rate variable to the model. We thus can show that doing so substantially enhances the model’s ability to predict hate crime rates relative to a model consisting only of the other independent variables. 2 In particular, we show that the model’s R2 increases substantially (especially in relation to the impact of adding other independent variables) when the Google search rate variable is added. An F-test and a likelihood ratio test both indicate that the Google search rate variable significantly improves model fit. We also compare Akaike’s Information Criterion across the models with and without the Google search rate variable; this indicates that the model with the Google search rate variable is substantially preferable to the baseline model without this variable. These tests offer evidence of the contribution of our imputation strategy.
We then use regression results for our benchmark jurisdictions over 2004–2015 to generate predicted values of the hate crime rate for all states (using the Google search rate variable along with the other independent variables). The out-of-sample element of this analysis relates to the states excluded from the benchmarking regression (i.e., the formerly Confederate states for our first analysis, or else the states that are not identified as “good reporters” for our second analysis). We use these predicted values to impute hate crime rates for all states in each year, including states excluded from the benchmarking regression.
The intuition underlying this approach is that if, for instance, Florida is subject to the same relationship between Google search rates (conditioning on other independent variables) and related hate crimes as the baseline states (such as California), then the predicted hate crime rate we calculate for Florida tells us how many reported hate crimes we would counterfactually have observed in Florida if its reporting had been as robust as that in the benchmarking states. The premise that different states are subject to the same underlying relationship between these variables may appear to be a quite strong assumption. However, it should be borne in mind that the relationship is conditioned on a number of demographic, economic and crime-related characteristics at the state-year level. In addition, the most likely departures from this assumption would entail that our estimates of unreported hate crimes are biased downwards rather than upwards. In particular, it appears reasonable to think that in a state such as Florida with a history of racial violence (as evidenced, for instance, by a history of lynchings), a given level of racial animus would result in more (rather than less) violence (relative to other states) due to the salience and relative social acceptability of this violence. If that is correct, then the assumption that different states are subject to the same underlying relationship between these variables may be conservative in terms of estimating unreported hate crimes.
Another important limitation of our method is that we are unable to control for cross-state variation in victims’ reporting behavior. If victims of hate crimes were less willing to report such crimes in our baseline states than in the former Confederate states, this would generate inflated estimates of reported hate crime rates. We cannot rule this out. But it seems to us more likely that reporting levels will be higher in states with more robust approaches to tracking and measuring hate crimes than in states where anti-Black hate crime is not a priority concern.
The limited nature of the resulting estimates also needs to be stressed. They are not estimates of the “true” rate of hate crimes. Rather, they are likely to be lower-bound estimates of the expected reported rate of hate crimes in a jurisdiction assuming high rather than low quality reporting by local law enforcement agencies. They primarily illuminate the problem of relative underreporting. 3 They do not address the distinct problem of underreporting by victims to local law enforcement agencies. Reported rates, given currently available data from victimization surveys, appear to be around one half of experienced crimes. They also do not address generalized failures on the part of law enforcement agencies to recognize certain acts as hate crimes even in benchmark jurisdictions.
Nevertheless, the reported hate crime rates that we impute beyond our benchmark sample suggest substantial underreporting among many states, especially (but not exclusively) those in the southeast. Nationally, the mean number of African-American victims of hate crimes reported at the state-year level is about 57 per year in our sample of data from 2004–15. Florida reports a number very similar to this national average: 56. Yet, using the methodology described above, we find that the imputed number of reported hate crimes to be on average about 340 per year between 2004 and 2015. Thus, we impute an average of 284 unreported hate crime victims in Florida per year over 2004–2015.
We also impute substantial numbers of unreported hate crime victims in other states – on average, for example, 259 per year in Texas and 146 per year in Georgia over the same time period. Lest it is thought this analysis merely reiterates conventional wisdom about a north-south racial divide, we note that several non-southern states also appear to experience substantial underreporting. For instance, we impute that Illinois had about 89 unreported hate crime victims per year, while Pennsylvania had about 95. Aggregating across the United States, our estimates imply about 1075 unreported hate crime victims per year.
The next part provides background on the definition and measurement of hate crimes, identifying the contours of the missing data problem addressed here. The following part describes the data used in the analysis. It focuses primarily on the Google Trends data, identifying the assumptions upon which reliance on that data is predicated. We then present our central analysis and imputed lower-bound estimates. It also identifies limitations of the analysis. We conclude with a discussion of implications and possible extensions.
Defining, Measuring, and Analyzing Hate Crime
Defining Hate Crimes
There is no single, unified definition of hate crime in the U.S. The HCSA’s definition encompasses “crimes that manifest evidence of prejudice based on race, gender and gender identity, disability, sexual orientation, or ethnicity,” but does not precisely define which substantive offenses count. In respect to relevant motivation, the scope of federal practice has changed subtly over time. 4 Statutory amendments have extended the boundaries of the textual definition of hate crimes, and may have altered, at least at the margins, the kind of data collected.
The HCSA definition, moreover, is not adopted by all fifty states in their own criminal law. Within constraints imposed by the First Amendment, 5 states use different terminology, such as “bias-related crimes” (D.C. Code §22-3703 (2012)) or “discrimination in public places” (N.D. Cent. Code § 12.1-14-04 (2017)). Some local law extends to crime motivated by the “political affiliation” of a person (D.C. Code §22-3701 (2012)), while other states do not enumerate protected classes (Utah Code Ann. § 76-3-203.4)). States’ regulatory approaches to hate crimes also vary. Sentencing enhancements for bias-related crimes were adopted by most states starting in the 1970s (Grattet et al., 1998). Today, in addition, twenty-nine states and the District of Columbia have a reporting mandate of some kind (Anti-Defamation League, 2017). States with no reporting mandate can nevertheless participate in federal reporting efforts under the HCSA (Gillis, 2012).
Measuring the Frequency of Hate Crimes
Variance in state-law understandings of the term “hate crime” is relevant because it is state and local actors, not federal ones, who collect data on-the-ground. The HCSA does not empower the Department of Justice to collect information directly. Rather, it allows the Attorney General to solicit such information from the states. But the federal government cannot command state officials in their official capacity to take actions, and the HCSA appropriates no funds to support state data collection efforts. The Act instead relies on states’ voluntary efforts to gather information on hate crimes.
Hate crime data is reported by states as part of their submission to the Uniform Crime Reports (“UCR”) data. In 2016, agencies in 49 states 6 and the District of Columbia, covering almost 89.7 percent of the nation’s population, formally participated in federal efforts to gather hate crimes data through the UCR (FBI, 2016). But many agencies within states either did not report anything or reported zero hate crimes for a given year. One journalistic estimate is that 88 percent of participating agencies did not report any hate crimes (Schwencke, 2018).
The NCVS also collects data on crimes “motivated by an offender’s bias against them for belonging to or being associated with a group largely identified by [enumerated characteristics]” (Department of Justice, 2017b). 7 Unlike the UCR, which focuses on state and local law enforcement, the NCVS collects information from a nationally representative sample of households on a nationwide basis. In 2016, the sample was redesigned to produce reliable estimates for the 22 most populous states and metropolitan areas (Department of Justice, 2017a). This more granular data, however, is not available for the historical period we study here. The publicly-available NCVS data permits estimation of aggregate undercounting of hate crime reporting. However, it does not allow estimation of state- or locality-level variation in undercounting (Gillis, 2012), although researchers with access to the restricted use NCVS data may in the future be able to obtain more granular estimates. The publicly-available NCVS data can be used, though, to obtain self-reported NCVS victimization data for large regional groupings of states (such as the South), and we discuss how these relate to our estimates below.
Undercounting and Variance in Federal Hate Crime Data
There are several reasons to believe first, that UCR estimates of hate crimes undercount actual rates, and second, that the undercount is not evenly distributed across (state) jurisdictions.
To begin, net undercounting occurs primarily because the UCR captures only crimes reported to police or other responsible state entities (e.g., state universities). In 2016, however, the NCVS estimated that 48.7 percent of serious violent crimes and 57.9 percent of violent crimes were not reported to police (Department of Justice, 2017a). 8 Between 2011 and 2015, approximately 54 percent of hate crimes (including 54 percent of violent hate crimes) identified in the NCVS sample were not reported. Even this might under-estimate the hate crime undercount because some victims of hate crimes may be unwilling to provide details of their experiences even in the context of a survey such as the NCVS, or may themselves not classify a qualifying experience as a hate crime.
Larger variation in the quality of state and local data may arise because of differences in the institutional arrangements whereby local police and other state agencies collect hate crime data. Even in jurisdictions where police have an explicit reporting mandate under state law—and hence are not merely unfunded contributors to a federal project—the zeal with which they pursue their task will vary depending upon institutional leadership and culture. Grattet and Jenness (2005a and b) analyzed the practices of 397 Californian police and sheriffs’ offices. They found local practices varied greatly. Different departments relied on different definitions of hate crimes and engaged in different practices to acquire information, and also had differing priorities depending on the local ecology of violent crime. Other studies find similar variation in other jurisdictions (Boyd et al., 1996). Agencies with community policing policies also appeared to be correlated with increased compliance with hate crime mandates (Grattet & Jenness, 2008; Jenness & Grattet, 2005). Jurisdictions in which there is a history of lynching and a large African-American population are less likely to be characterized by cooperation with federal data-collection efforts and less likely to prosecute anti-black hate crimes (King et al., 2009).
The absence of any reliable way to estimate the degree of underreporting by jurisdictions creates a problem of missing data: How can we know how many hate crimes occur in a given state that are either not reported to authorities, or alternatively are reported but not recorded in federal data for one reason or another? The publicly-available NCVS provides one answer—but only at the national level, and does not permit state-to-state comparisons. Given that rates of hate crimes vary between jurisdictions, and that therefore any policy response must also be localized, this fails to provide needful guidance for public policy.
Prior Literature
Notwithstanding these limitations, there is a small but significant empirical literature on measuring the frequency of hate crimes. 9 For instance, Medoff (1999) uses an economic framework to analyze the determinants of hate crime, using cross-sectional data. He finds support for market wage and law enforcement activity as determinants of hate crime. Gale et al. (2002) use state-level UCR data to analyze the determinants of hate crimes. Their analysis employs a panel dataset, and they control for unobserved state effects. They too find that economic variables such as unemployment are significantly associated with the incidence of hate crimes.
Particularly noteworthy here is Chan et al. (2016). Using UCR hate crime data, they construct a panel dataset at the county-year level over 2001–2008 to analyze the impact of the spread of internet usage on racially-motivated hate crimes. With instrumental variables based on geographical features of the local terrain that affect the introduction of broadband internet service, they find evidence that broadband availability increases the incidence of hate crimes. They also use Google searches for racially offensive terms as a measure of racial animus. Their aim (which is quite distinct from ours) is to show that the positive impact of broadband availability on hate crimes exists only in areas with higher levels of racial animus.
Also related to this study are papers that recognize and seek to address the missing data (or “false zero”) problem with hate crime statistics. Piatkowska et al. (2019, p. 1079) address this issue by treating as false zeros instances where the number of racially motivated hate crimes is reported as zero and all other categories of hate crime are also zeros for that local jurisdiction. On the other hand, they treat as true zeros instances where the number of racially motivated hate crimes is reported as zero but one or more other categories of hate crime have nonzero values in a given local jurisdiction. Lantz et al. (2024) use a similar approach. Once they apply this adjustment to the hate crime data, they find that the presence of Confederate memorials in a locality is associated with higher rates of anti-Black hate crime. They also find, consistent with the results of our paper, that compliance with HCSA reporting is substantially lower in southern states.
Data
Google Search Data
This study uses the frequency of Google searches for the word “n_____” in a jurisdiction as a proxy for the extent of racial animus directed towards African-Americans within that jurisdiction, following the pioneering work of Stephens-Davidowitz (2014). He documents a correlation between search trends and voting behavior, and in particular identifies a relationship between a higher frequency of searches for the term “n____” over 2004–2007 and a depressed vote share for an African-American presidential candidate in 2008. A substantial subsequent literature has used the Stephens-Davidowitz (2014) measure of racial animus to study various other outcomes. 10
Google Trends generates an index of search activity for a certain search term within a defined geographic area and specific time period. More formally, an ideal search rate measure
It is not possible to obtain from Google Trends the absolute number of searches
Here, B is the search rate for an arbitrary benchmark term. Typically, this is the maximum monthly value of
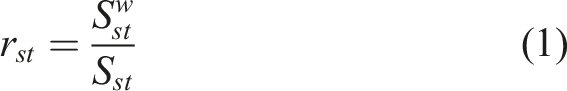
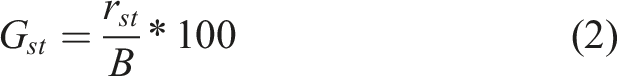
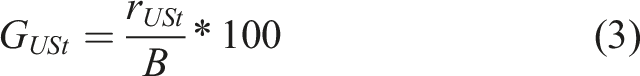
We construct a measure of racial animus towards African-Americans, denoted by
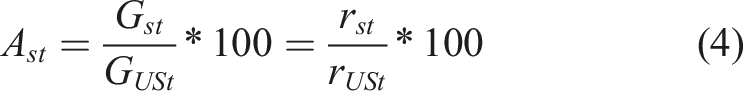
This measure has a simple interpretation: it is the search rate for the word “n_____” in state s in year t relative to the search rate for the same word in year t in the US as a whole. Note that if Google users in state s search for the word more frequently than US Google users on average in a particular year t, then
In this study, we use only one search term (and variants). Following Stephens-Davidowitz (2014), we treat searches for the word “n____” as a measure of racial animus. According to Stephens-Davidowitz (2014), the most common searches using that term were for ‘n___ jokes’ and ‘I hate n___s.” The racial epithet is also known to be used in hate crimes (Parks & Jones, 2008), although in practice its usages have changed subtly over time (Kennedy, 2003). One potential concern is that the term has been “reclaimed” by some in the African-American community, implying that some searches for the term may reflect motivations unrelated to racial animus. However, most uses of the term within the African-American community involve a variant (“n____a”) that is treated in Google Trends as a distinct search term (Stephens-Davidowitz, 2014, p. 28). We specifically exclude searches for “n____a” from our construction of search rates for the more standard term “n_____”.
Of course, the use of this search term allows us to analyze only anti-Black animus, and hence to focus only on anti-Black hate crimes. However, this constitutes a substantial component of all hate crimes. According to the FBI: “Anti-Black or African American hate crimes continue to be the largest bias incident victim category” in the (admittedly imperfect) hate crime data. 12
Summary Statistics.
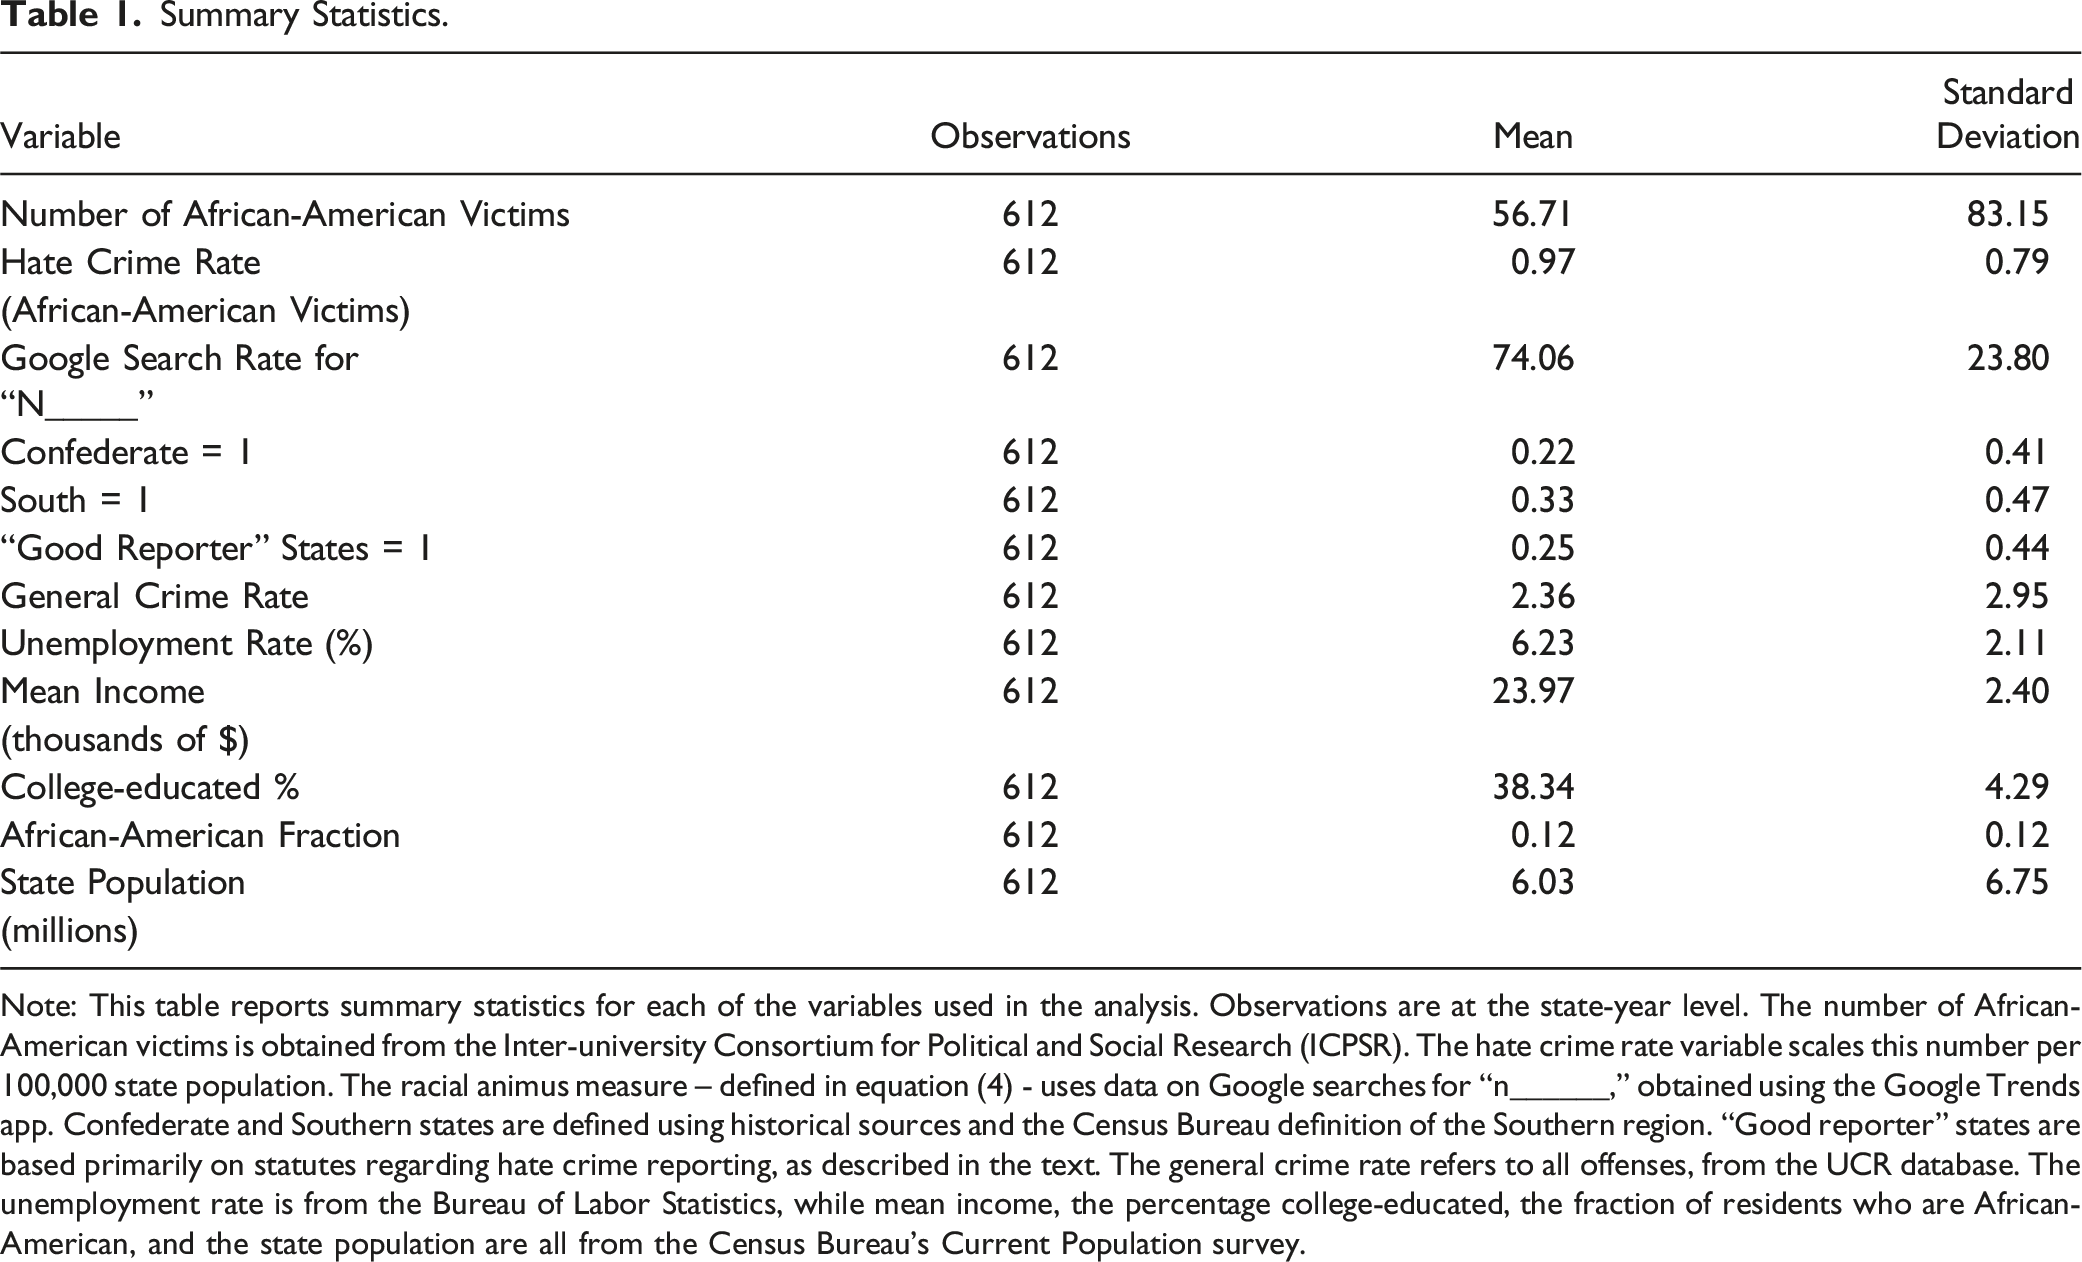
Note: This table reports summary statistics for each of the variables used in the analysis. Observations are at the state-year level. The number of African-American victims is obtained from the Inter-university Consortium for Political and Social Research (ICPSR). The hate crime rate variable scales this number per 100,000 state population. The racial animus measure – defined in equation (4) - uses data on Google searches for “n______,” obtained using the Google Trends app. Confederate and Southern states are defined using historical sources and the Census Bureau definition of the Southern region. “Good reporter” states are based primarily on statutes regarding hate crime reporting, as described in the text. The general crime rate refers to all offenses, from the UCR database. The unemployment rate is from the Bureau of Labor Statistics, while mean income, the percentage college-educated, the fraction of residents who are African-American, and the state population are all from the Census Bureau’s Current Population survey.
It is important to identify four reasons for treating the Stephens-Davidowitz (2014) measure with caution. First, there is an unreported privacy threshold. When the use of a term falls below a certain proportion of total searches, Google Trends will report zeros. Second, the index reported by Google Trends is calculated based on a sample of searches from a particular jurisdiction and time period. 13 That sample is changed each day. Hence, multiple samples can be drawn, but one must wait a calendar day before drawing a new sample (Stephens-Davidowitz, 2014; Stephens-Davidowitz & Varian, 2015).
Unfortunately, this sampling process implies that it is impossible for the data obtained from Google Trends by one team of scholars to be precisely replicated by another team; even if the latter were to enter identical search terms for the same jurisdictions and time periods, it would obtain slightly different samples. Nevertheless, we verified that the Google search rates we obtain for our terms of interest (averaged by state over 2004–2015) are very closely related to the state averages (over 2004–2007) reported in Stephens-Davidowitz (2014). The scaling of the variable in Stephens-Davidowitz (2014) is also somewhat different, with the state with the highest search rate (West Virginia) being normalized to 100. However, if we regress our measure (over 2004–2015) on the Stephens-Davidowitz (2014) measure (over 2004–2007), the regression coefficient is 0.99. 14 This suggests that the measure reliably captures a fairly stable attribute across different sampling contexts.
Third, because the Google Trends index provides a measure of relative frequency of different searches, it is necessarily sensitive to changes in the demographic composition of Internet (and Google) users over time. 15 This suggests that time trends should be inferred with extreme caution from Google search data. In our regression analysis, we take account of these types of changes at the national level by the inclusion of year fixed effects. Fourth, search behavior is not just exogenously determined. It also reflects endogenous changes by Google’s search algorithm (Lazer et al., 2014). Those changes might influence the relative frequency of searches over time.
Accordingly, while Google search data provides insight into attitudes likely to be correlated with related off-line behavior, this inference is unreliable as to any given internet user. This study, like earlier ones using Google Trends, leverages the fact that the large aggregation of data captured by Google Trends can illuminate population-level behavioral trends as a simple consequence of the law of large numbers.
UCR and ICPSR Data
The data on reported hate crimes used in our analysis is ultimately derived from the reports of state and local law enforcement, voluntarily provided to the FBI under the terms of the HCSA (as described above). This data is publicly available through the FBI’s Uniform Crime Reporting (UCR) system for each year since 1996. 16 It divides reported hate crimes into five categories based on the type of hate motivation – namely, by bias relating to race, ethnicity, religion, sexual orientation, and disability.
Reports under the HCSA are also available through the Inter-university Consortium for Political and Social Research (ICPSR). 17 In addition to the type of motivation, this records the race or other relevant characteristics of the victim. Thus, it enables us to calculate the number of African-American hate crime victims (within the category of victims of racially-motivated hate crimes), aggregated to the state-year level. As some incidents have multiple victims, this variable differs slightly from the number of hate crime incidents at the state-year level with African-American victims. Nevertheless, using the latter variable instead leads to very similar results. While the hate crime data is available (albeit with the limitations that have already been discussed) since the 1990’s, we only use data for 2004–2015, as the Google Trends data is only available from 2004. We end our sample period in 2015 because of the possibility that the 2016 election created a new and different environment for hate crimes (e.g., Bursch, 2017). Potentially, divergent changes in online searches and behavior may create noise that renders the proposed imputation measure less precise.
As shown in Table 1, there are about 57 African-American victims of reported racially-motivated hate crimes in the typical state-year, though there is also a quite large standard deviation (and by implication considerable variation across states and years). In our benchmarking analysis, we scale the number of African-American hate crime victims by the total state population in that state-year, to obtain a reported hate crime rate (for African-American victims) per 100,000 state population. State population is obtained from the Census Bureau’s intercensal estimates of population for states, 18 and is measured in millions (with a mean of about 6 million people in our sample). The mean of the hate crime rate is about 0.97 African-American victims of racially-motivated hate crimes per 100,000 state population.
An alternative approach would be to scale by the African-American population rather than by the total state population. This leads, however, to a highly skewed variable due to the fact that some states have a relatively small African-American population share. Thus, we use for our primary analysis a hate crime rate that is scaled by overall state population (as described above). We also control in the regression analysis for a polynomial function of the African-American fraction of the state population. This takes account in a flexible manner of any effects of racial contact, competition, or other factors (such as the presence of potential victims, the influence of interracial contact on attitudes, and the effect of racial threat (Bobo & Hutchings, 1996)) that may influence the rate at which hate crimes are committed and reported.
The UCR system also reports more general crime statistics by law enforcement agency and year. 19 We collect from the UCR database a large number of crime rate variables for the period 2004–2015. In our baseline analysis, we use an aggregate measure of all offenses as a proxy for the general crime rate. 20 The mean rate of such offenses is 2.36 per 100,000 state population. We also use a number of other variables, summary statistics for which are provided in Table 1. Unemployment rates at the state level are obtained from the Bureau of Labor Statistics. 21 Mean income (in thousands of dollars) at the state-year level, the percentage of the state population that is college-educated, and the fraction of African-American residents are all obtained from the Census Bureau’s Current Population Survey (CPS). 22
Empirical Approach and Results
Partitioning States Based on Expected Reporting Behavior: Benchmarking Jurisdictions
We start by identifying on an a priori basis a class of jurisdictions to generate an initial estimate of the relationship between Google search rates for “n____” and reported hate crime rates. This assumes that there exists an identifiable subset of jurisdictions in which reporting practices are reasonably robust. But there is no single objective way to draw this distinction because there is no reliable data comparing the quality of reporting between states (and because actual hate crime rates are of course unobserved).
We construct two sets of jurisdictions to serve as benchmarks using proxies that are relatively simple and robust to manipulation. We first propose a distinction between former Confederate and all other states to identify as a first approximation, states in which the quality of reporting may be low, but the level of racial animus high. Historical members of the Confederacy (Alabama, Arkansas, Florida, Georgia, Louisiana, Mississippi, North Carolina, South Carolina, Tennessee, Texas, and Virginia) account for about 22% of our observations. We also use the Census definition of the South 23 to construct a broader category consisting of the former Confederate states plus five additional (“border”) states (Delaware, Kentucky, Maryland, Oklahoma, and West Virginia). Southern states, defined in this way, comprise about a third of our observations.
We readily concede that we could begin with a number of other distinctions, such as black shares of the voting-age population to jurisdictions that have not passed any regulation of hate crimes. We rely on former Confederacy status because it is not a quantitative measure. It therefore does not require us to make contestable judgments about what ‘counts’ as evidence of likely underreporting. Its insensitivity to manipulation binds our hands. There is, in addition, evidence to suggest that the historical status of a geographic unit continues to have influence today. Acharya et al. (2016) demonstrate that the density of slave-holding within a county in 1860 correlates to levels of racial resentment within that county today. King et al. (2009) demonstrate that the historical rate of lynching influences various current metrics of reporting and prosecuting hate crimes. As noted, Lantz et al. (2024) find that the presence of Confederate memorials in a locality is associated with higher rates of anti-Black hate crime, and that compliance with HCSA reporting is substantially lower in southern states.
A second and alternative set of benchmarking jurisdictions is a category of states for which there exist a priori reasons to believe that they are better reporters of hate crimes to the FBI under the HCSA. The primary criterion that we use is the existence of a state statute mandating training for police on hate crime reporting. Such legislation is directly relevant to the quality of reporting, and again, is a measure that is not amenable to our manipulation. According to a 2016 survey conducted by the Anti-Defamation League (ADL, 2017), such laws exist in the following states: California, Connecticut, Illinois, Kentucky, Massachusetts, Minnesota, New Jersey, New Mexico, Oregon, Rhode Island, and Washington. Notably, this category includes one border state (Kentucky). In addition, scholarly commentary suggests that New York has an effective reporting system (Gilles, 2012). Finally, DC is the only jurisdiction in our data with an African-American majority, and so reporting of hate crimes directed at African-Americans may be particularly salient there. These 12 states and DC constitute a second and alternative benchmarking subset of jurisdictions that we use in some of the analysis below. As shown in Table 1, they constitute about a quarter of our observations.
Anomalous Patterns in Reported Hate Crimes: Descriptive Statistics
Figure 1 depicts the average reported hate crime rate by state. Here, the annual data on the number of African-American victims of racially-motivated hate crimes (scaled by state population) is averaged by state over the entire sample period (2004–2015) to obtain an average reported hate crime rate for each state. This map shows considerable variation across states. One particularly striking pattern is that several states in the southeast that have historically been the locus for racial conflict and violence report among the lowest rates of hate crime. Given what is known about the history of these states, this is striking. Rates of Reported Hate Crime (African-American Victims), Averaged by State over 2004–2015. Note: This map depicts the average reported hate crime rate for each state. Annual data on the number of African-American victims of racially-motivated hate crimes (scaled by state population) is averaged by state over the 2004–2015 period to obtain the average reported hate crime rate for each state. The data on reported hate crimes is from the Inter-university Consortium for Political and Social Research (ICPSR).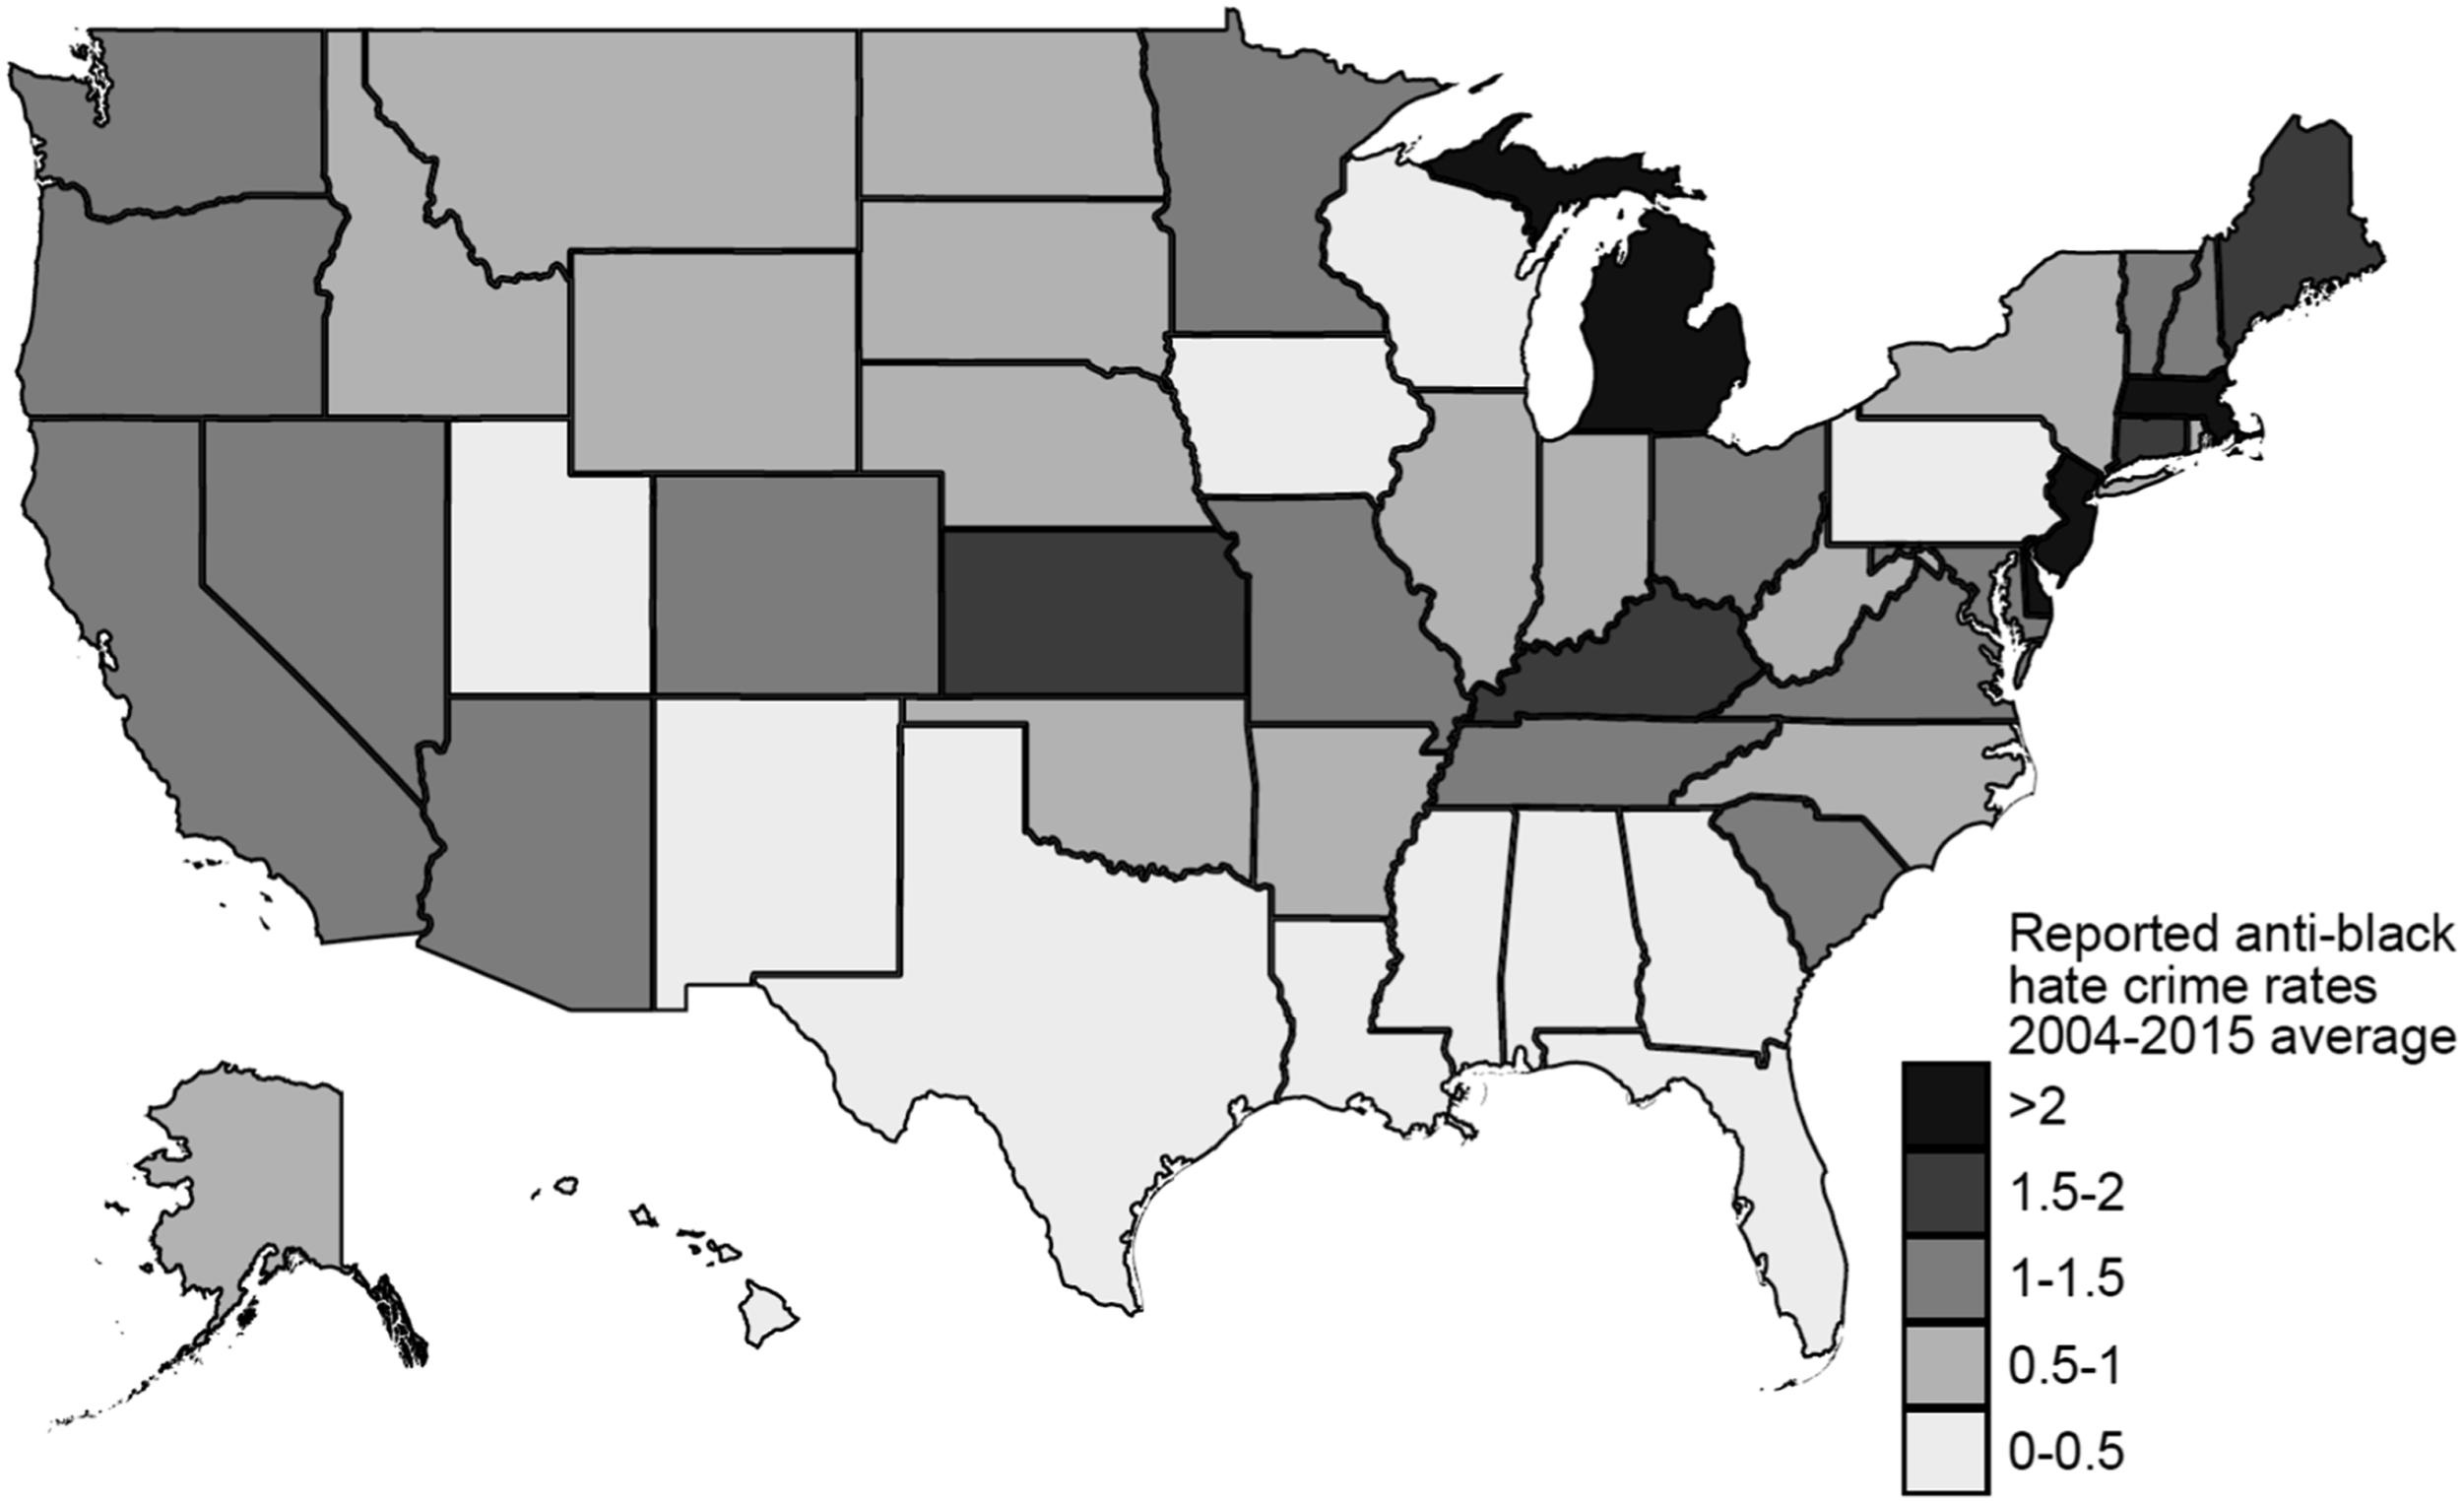
The intuition that underreporting rates may systematically vary across states is supported by Figure 2. This depicts the average value for each state of the racial animus measure Google Search Rates for “N_____”, Averaged by State over 2004–2015. Note: This map depicts the average value for each state of the racial animus measure defined in equation (4). Annual data on this measure is averaged by state over the 2004–2015 period to obtain an average level of racial animus for each state. The racial animus measure uses data on Google searches for “n______,” obtained using the Google Trends app.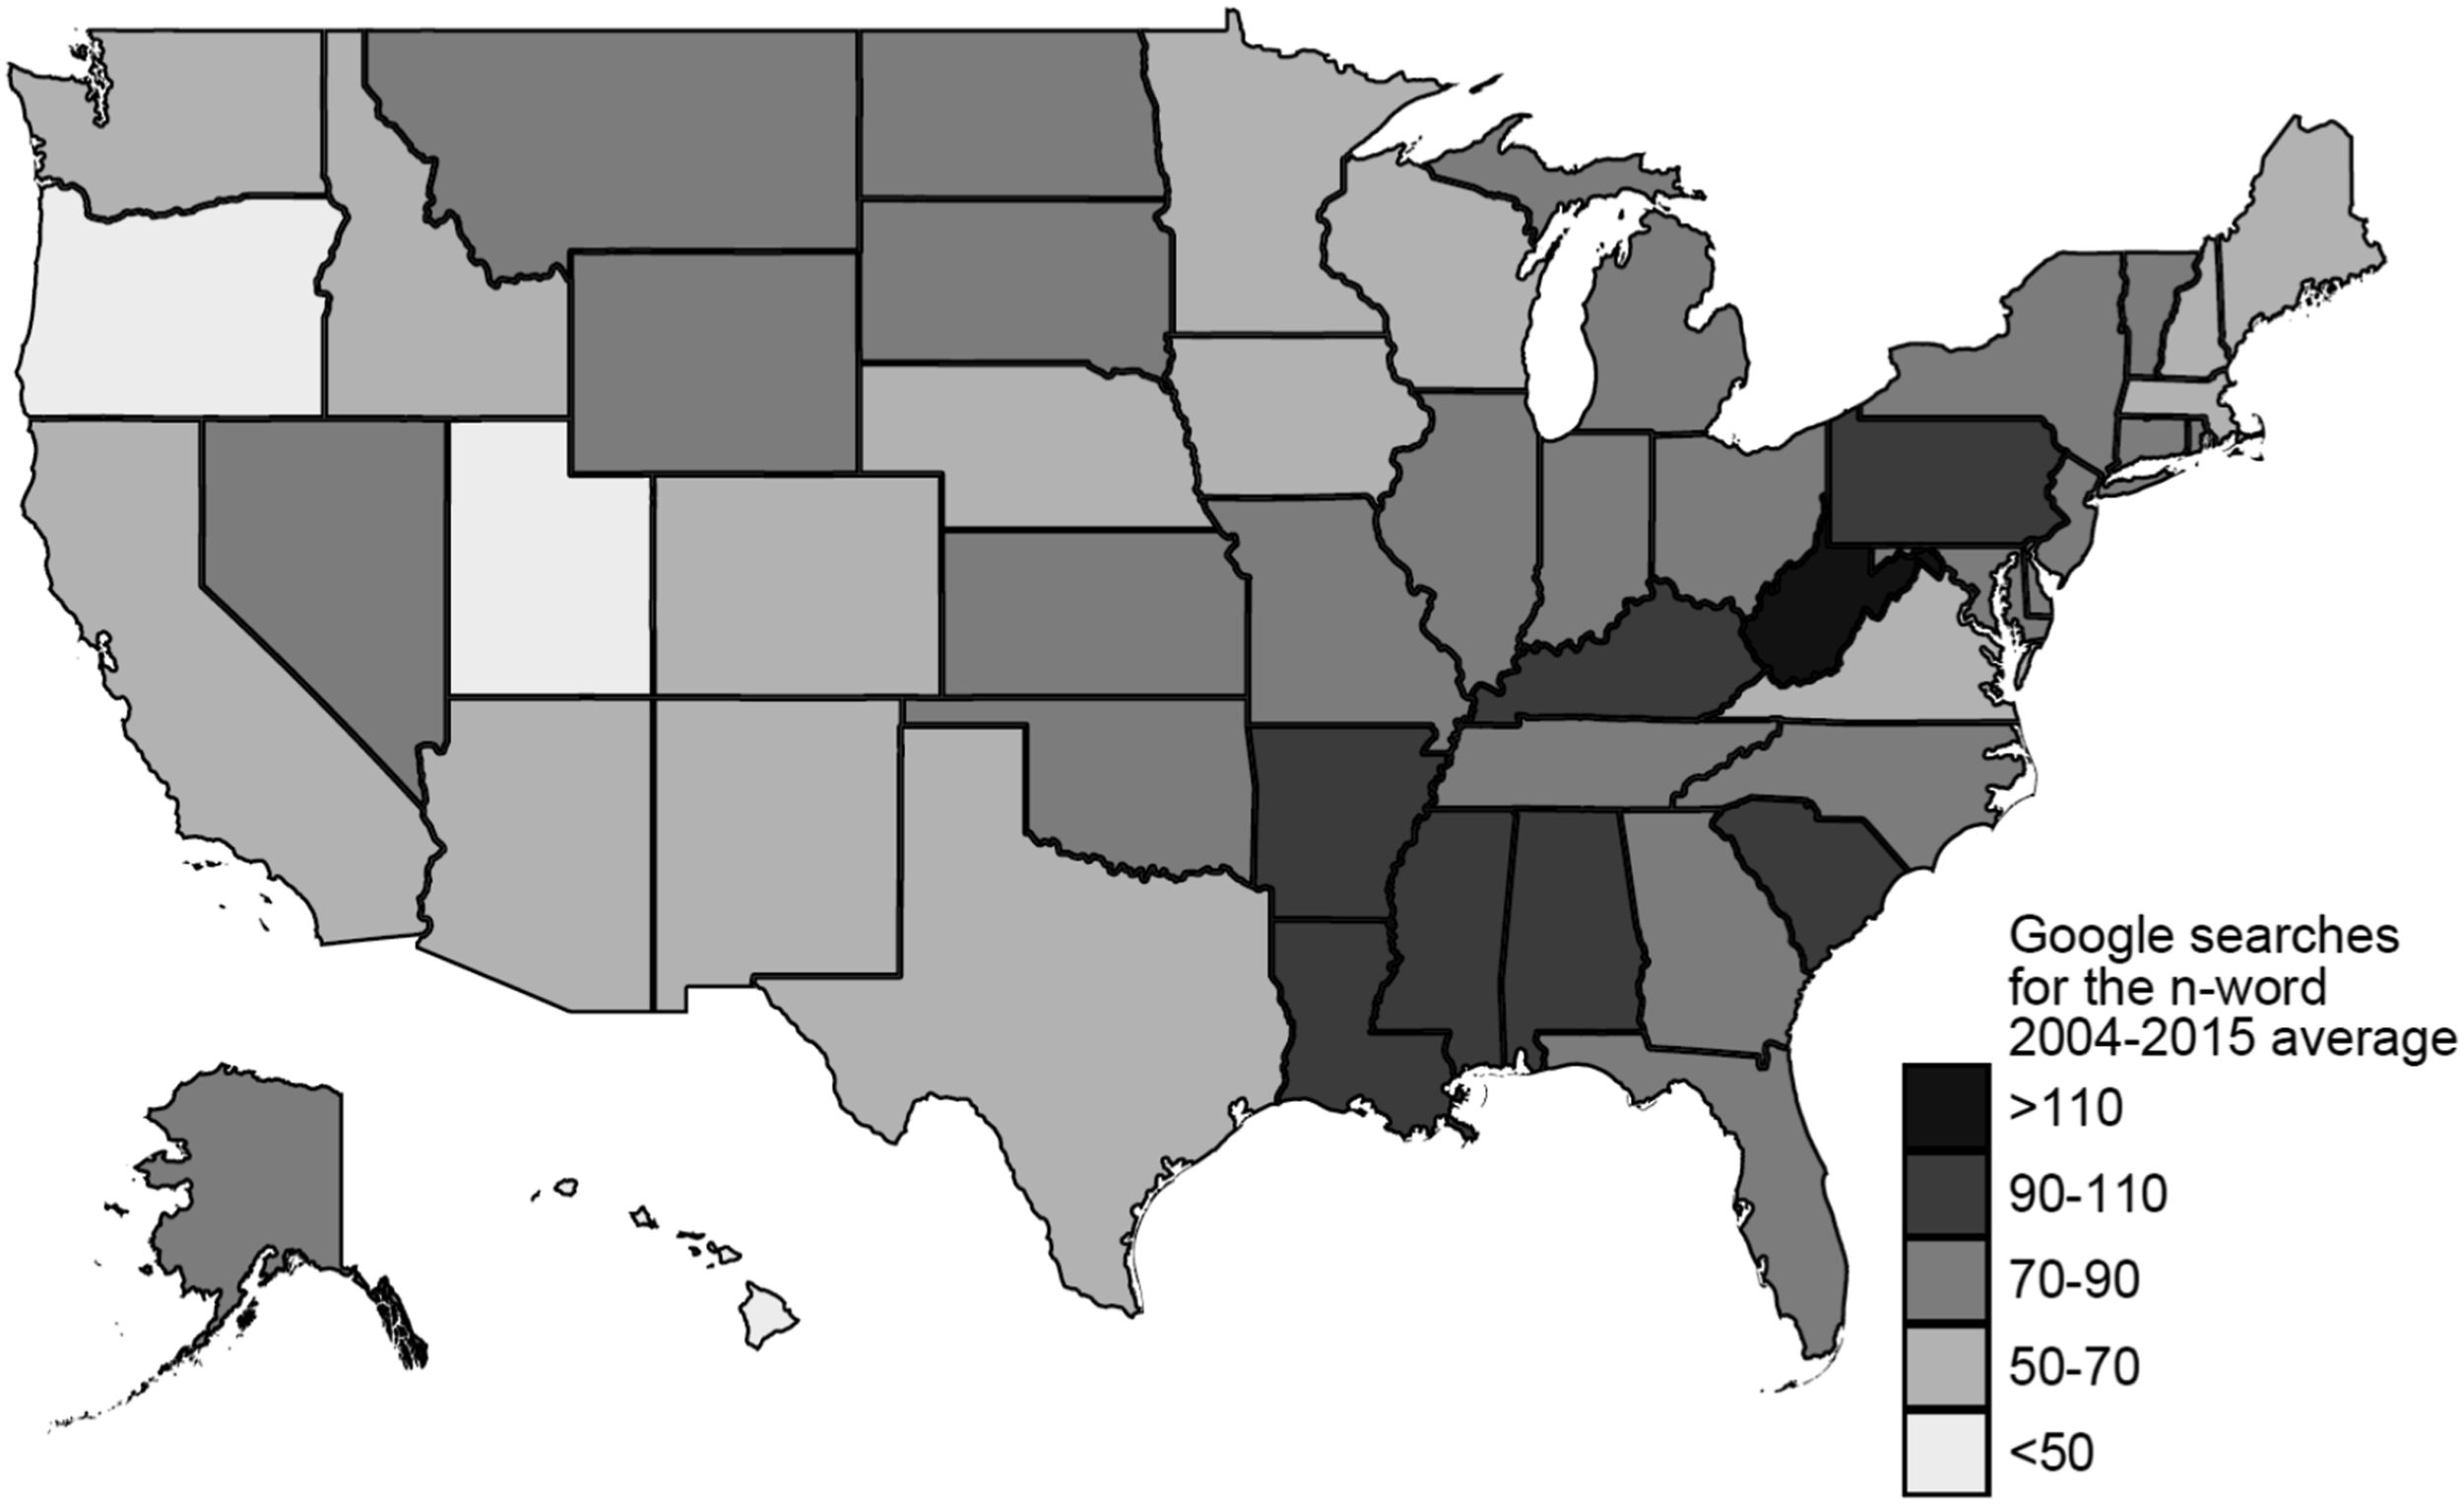
A more targeted comparison is provided in Figure 3. This figure compares reported hate crime rate for California (again, for anti-Black crimes only) for each year in our sample period (2004–2015) to the corresponding rate for Mississippi. California has a relatively low level of racial animus, as measured by the prevalence of Google searches for “n_____”; its value of Rates of Reported Hate Crime (African-American Victims) in California and Mississippi, 2004–2015. Note: This figure depicts the reported hate crime rates for two states - California and Mississippi. In particular, it uses annual data for each of these states on the number of African-American victims of racially-motivated hate crimes (scaled by state population) for each year in our sample period (2004–2015). The data on reported hate crimes is from the Inter-university Consortium for Political and Social Research (ICPSR).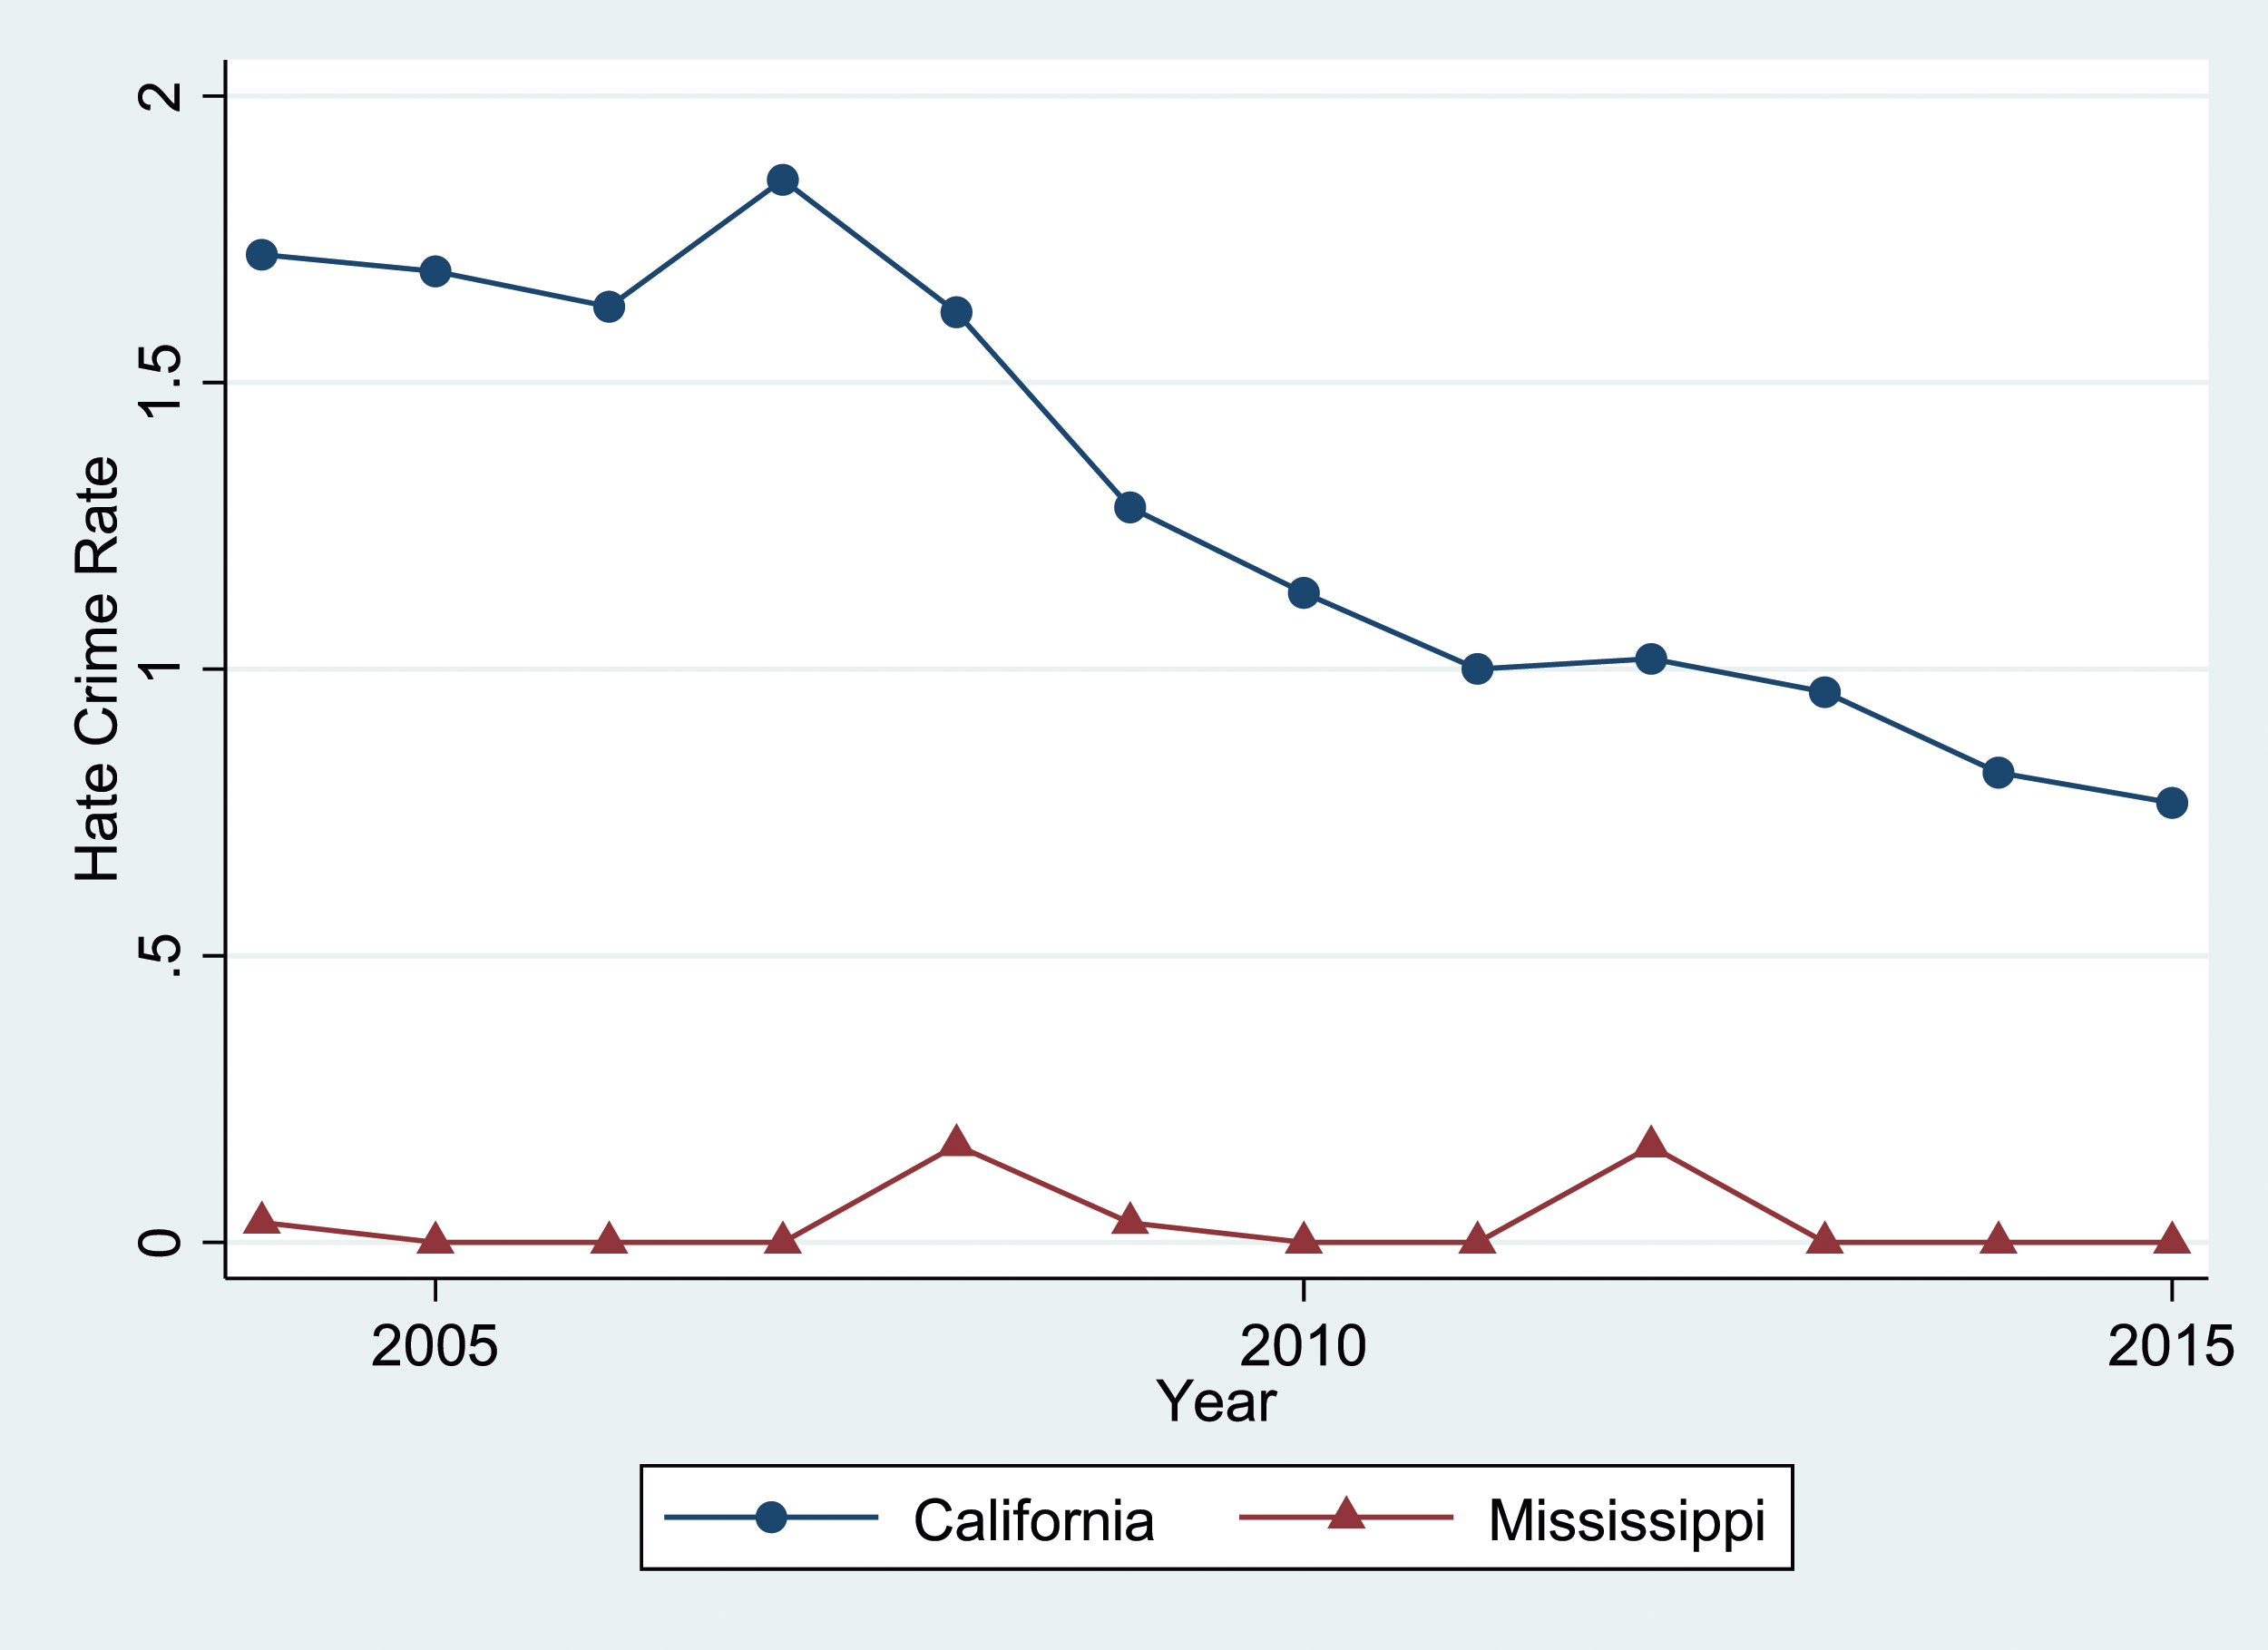
A third, more general comparison suggests that there are similar predictable differences between our first set of benchmarking jurisdictions on the one hand, and the 11 former Confederate states on the other. Figure 4 shows a comparison between reported hate crime rates against African-Americans for the 11 former Confederate states and the corresponding rates for the other 39 states and DC. The reported hate crime rate for each year is averaged over states separately for Confederate and non-Confederate states. Reported hate crime rates are substantially and consistently higher for non-Confederate states. At the same time, the two groups of states seem to follow similar time trends. In both categories, hate crime rates decline over the 2004–2015 period, with a sharp increase against the declining trend in 2008. More recently, reported rates appear to have stabilized, or started to increase at the end of this period. Rates of Reported Hate Crime (African-American Victims), 2004–2015. Note: This figure depicts reported hate crime rates for the 11 former Confederate states and for the other 39 states and DC. Data on the number of African-American victims of racially-motivated hate crimes (scaled by state population) is averaged over states separately for Confederate and non-Confederate states, for each year in our sample period (2004–2015). The data on reported hate crimes is from the Inter-university Consortium for Political and Social Research (ICPSR).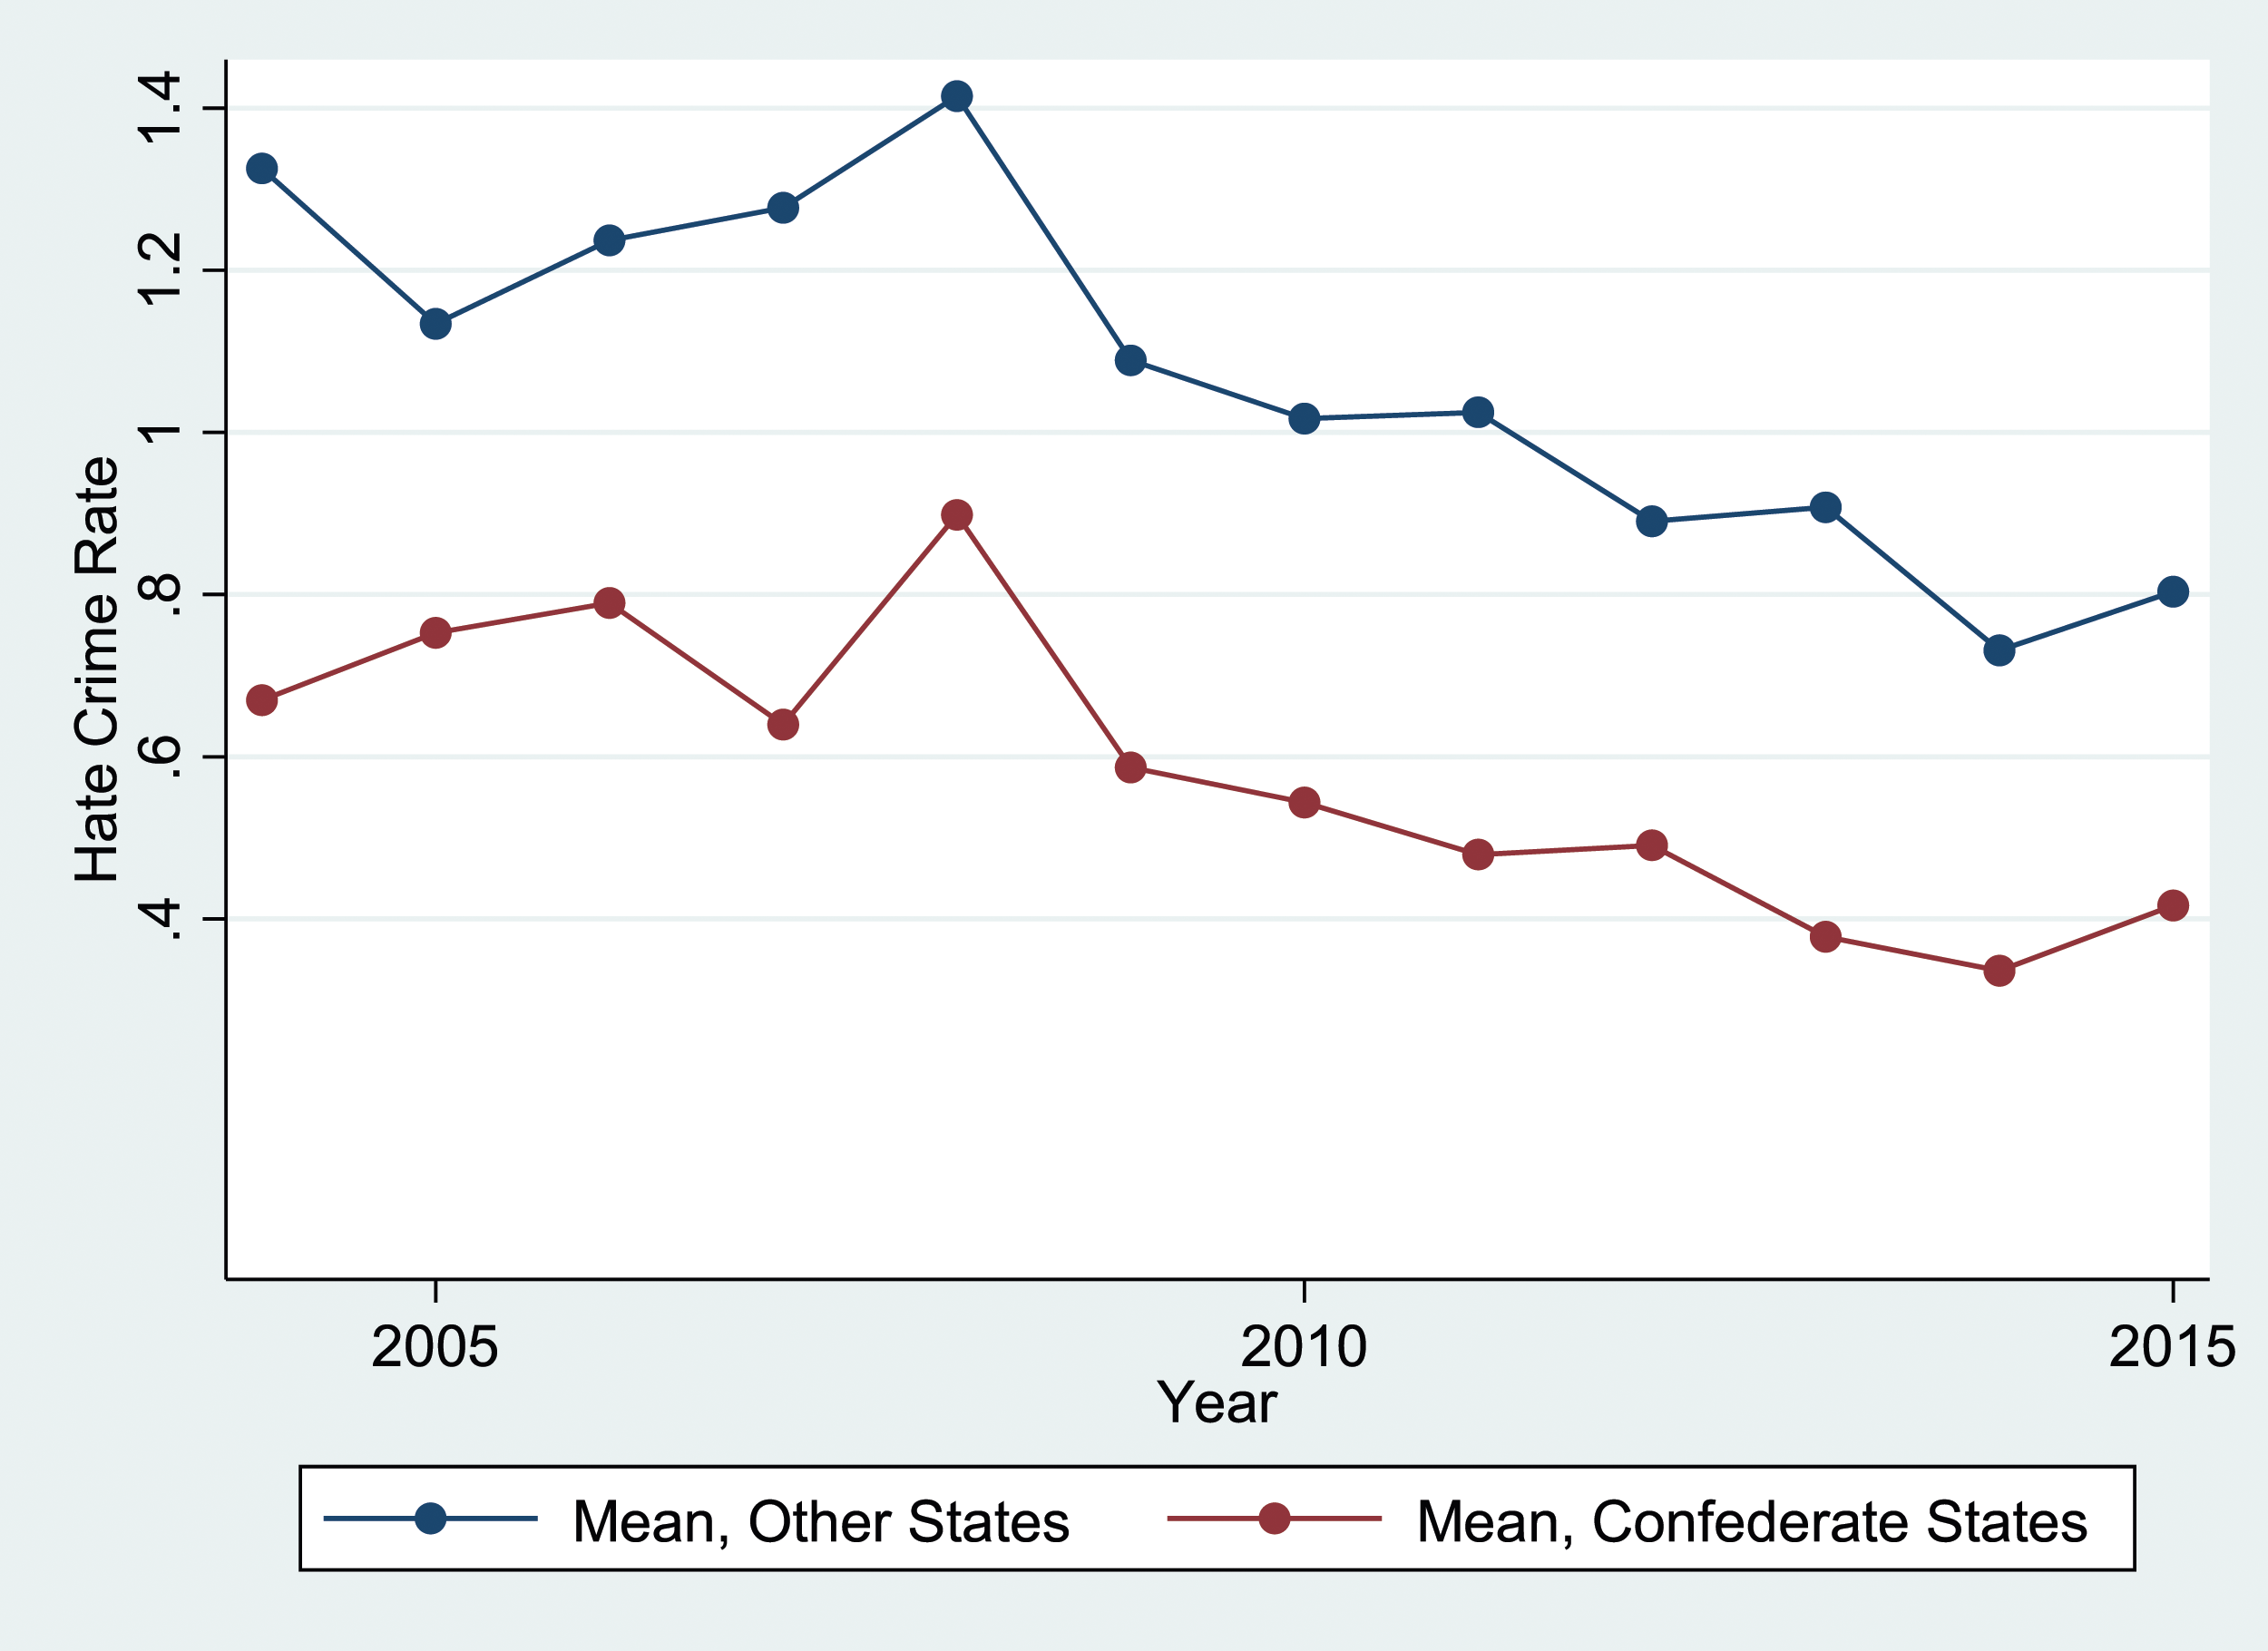
Figure 5 shows the analogous time-series variation for Google Search Rates for “N_____” 2004–2015. Note: This figure depicts the racial animus measure defined in equation (4) for the 11 former Confederate states and for the other 39 states and DC. Data on this measure is averaged over states separately for Confederate and non-Confederate states, for each year in our sample period (2004–2015). The racial animus measure uses data on Google searches for “n______,” obtained using the Google Trends app.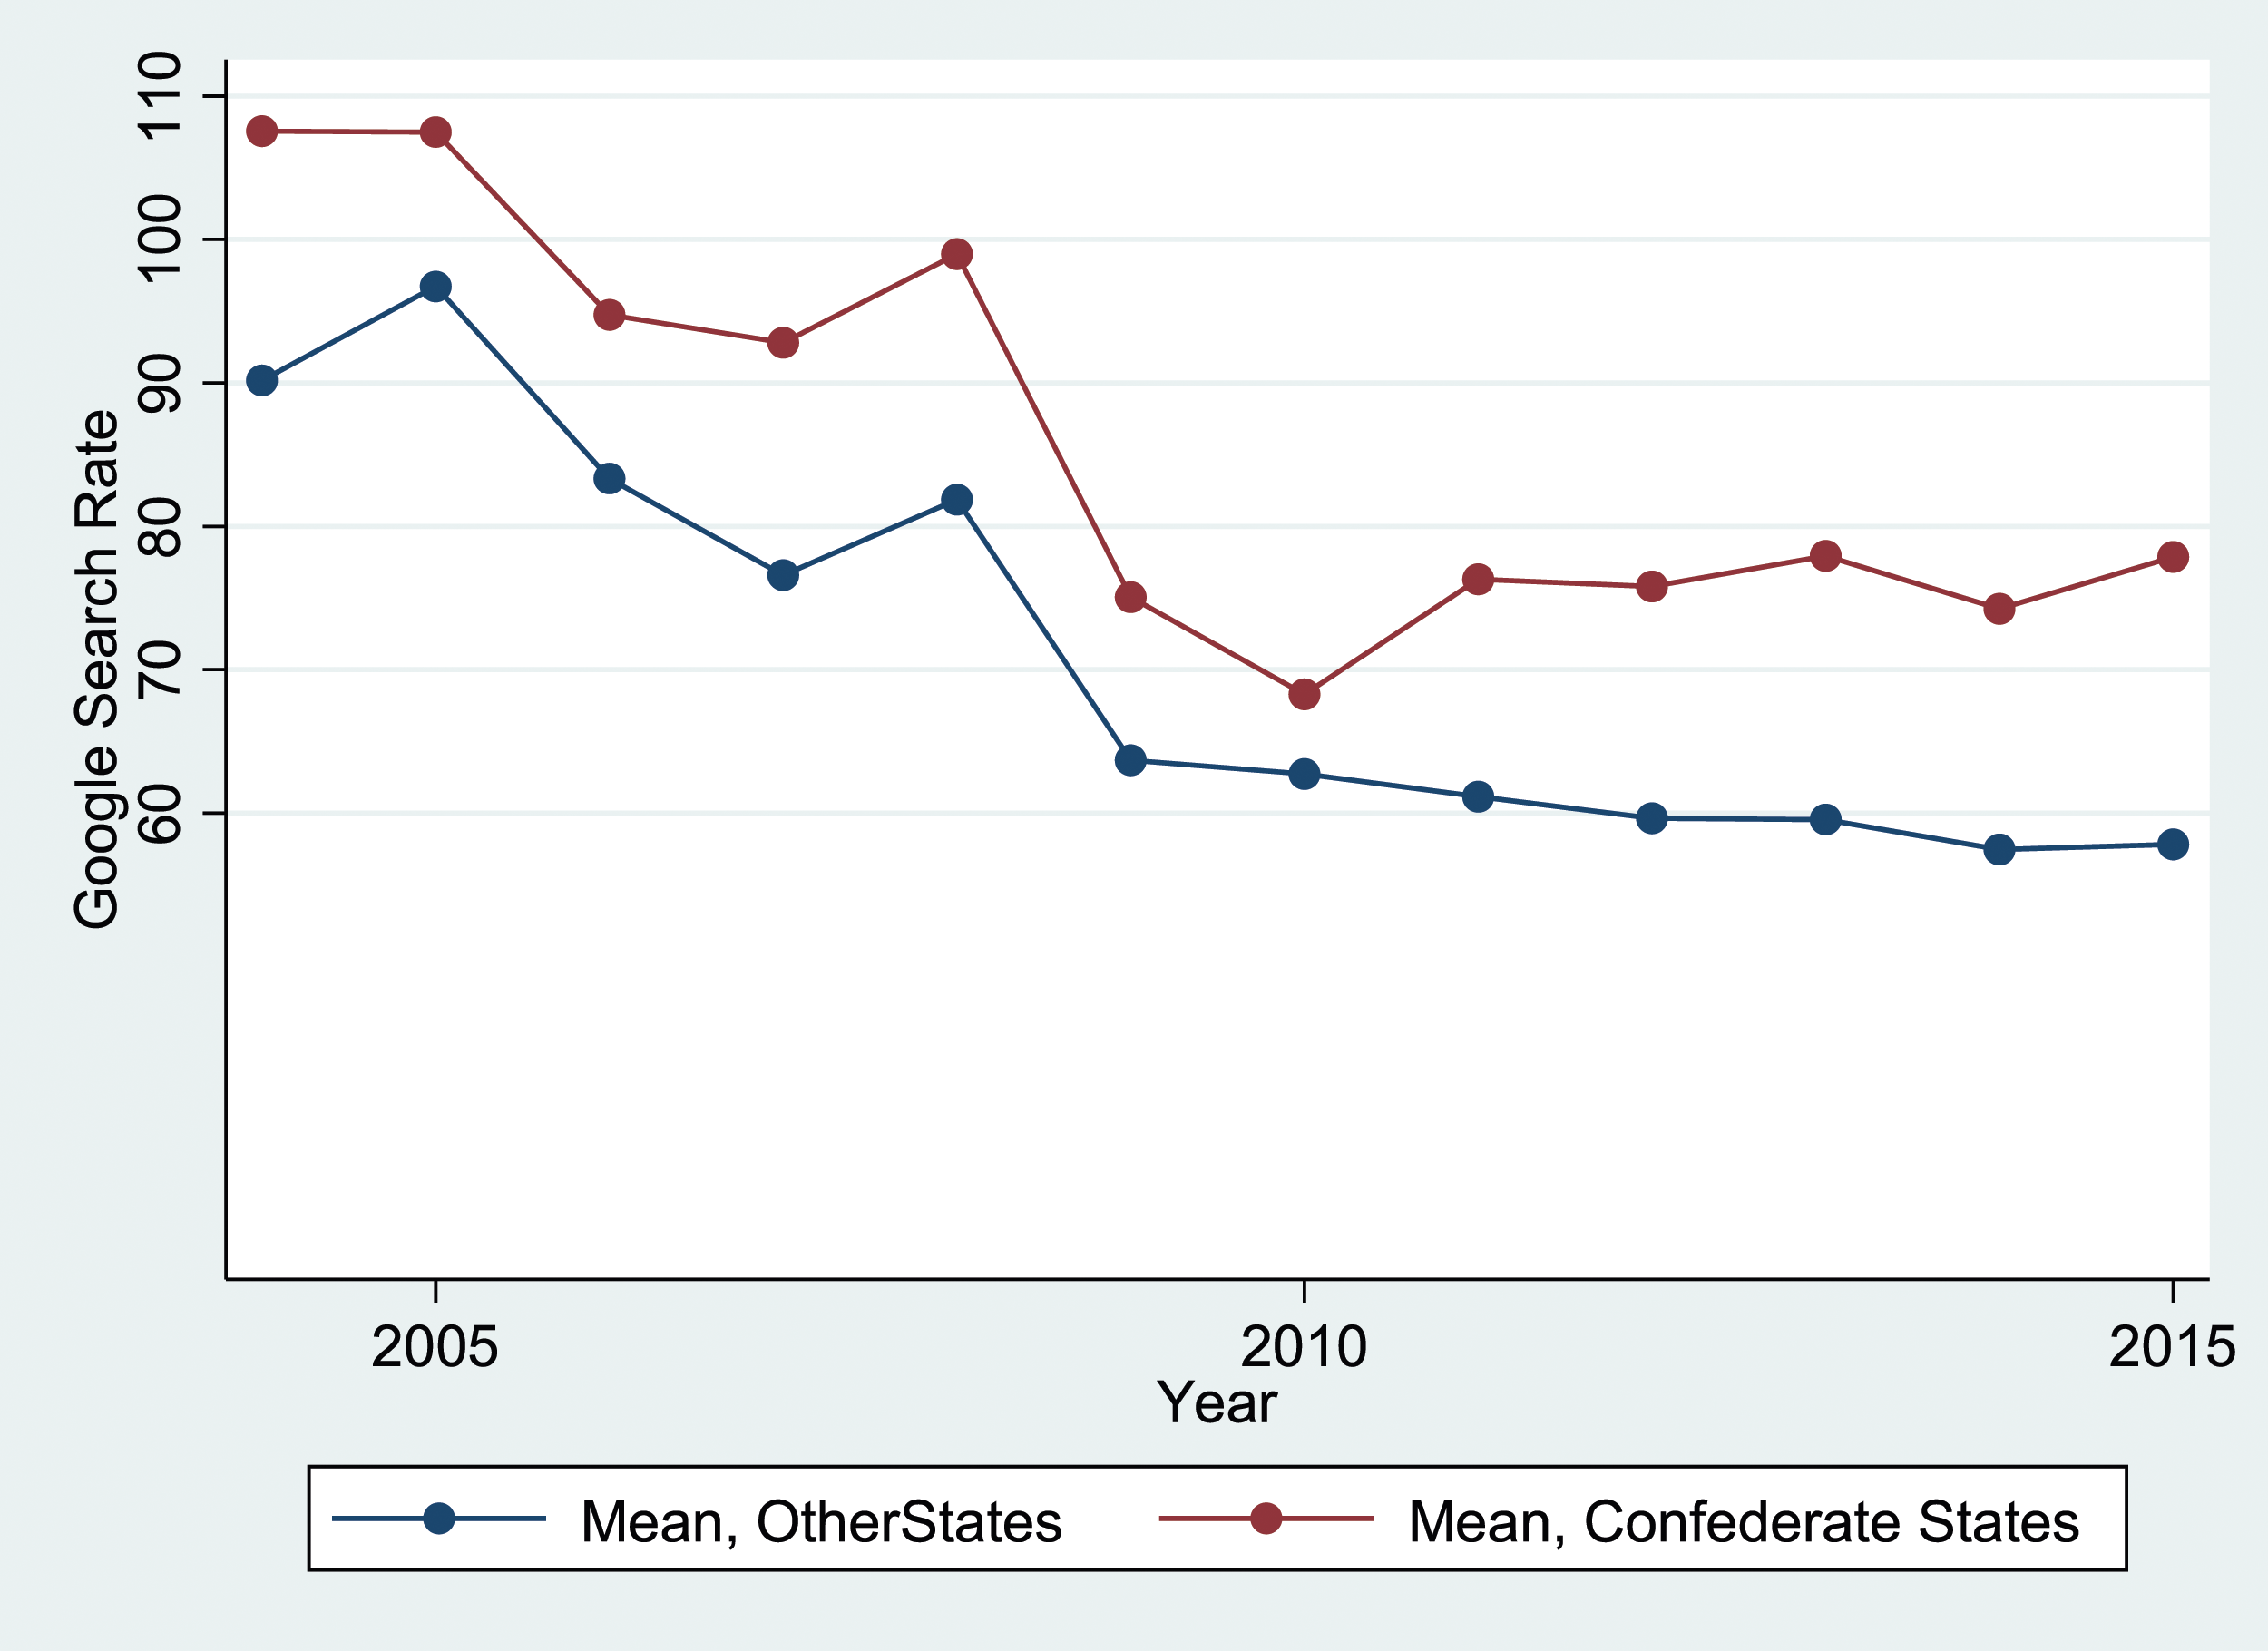
Empirical Specification and Regression Results
We now describe the regression models that we use to predict and impute hate crime rates. For our primary analysis, we use a linear model with the following specification:
Here,
While we include year fixed effects (which capture national trends in
Hate Crime Rates (African-American Victims) and Google Search Rates for “N_____”.
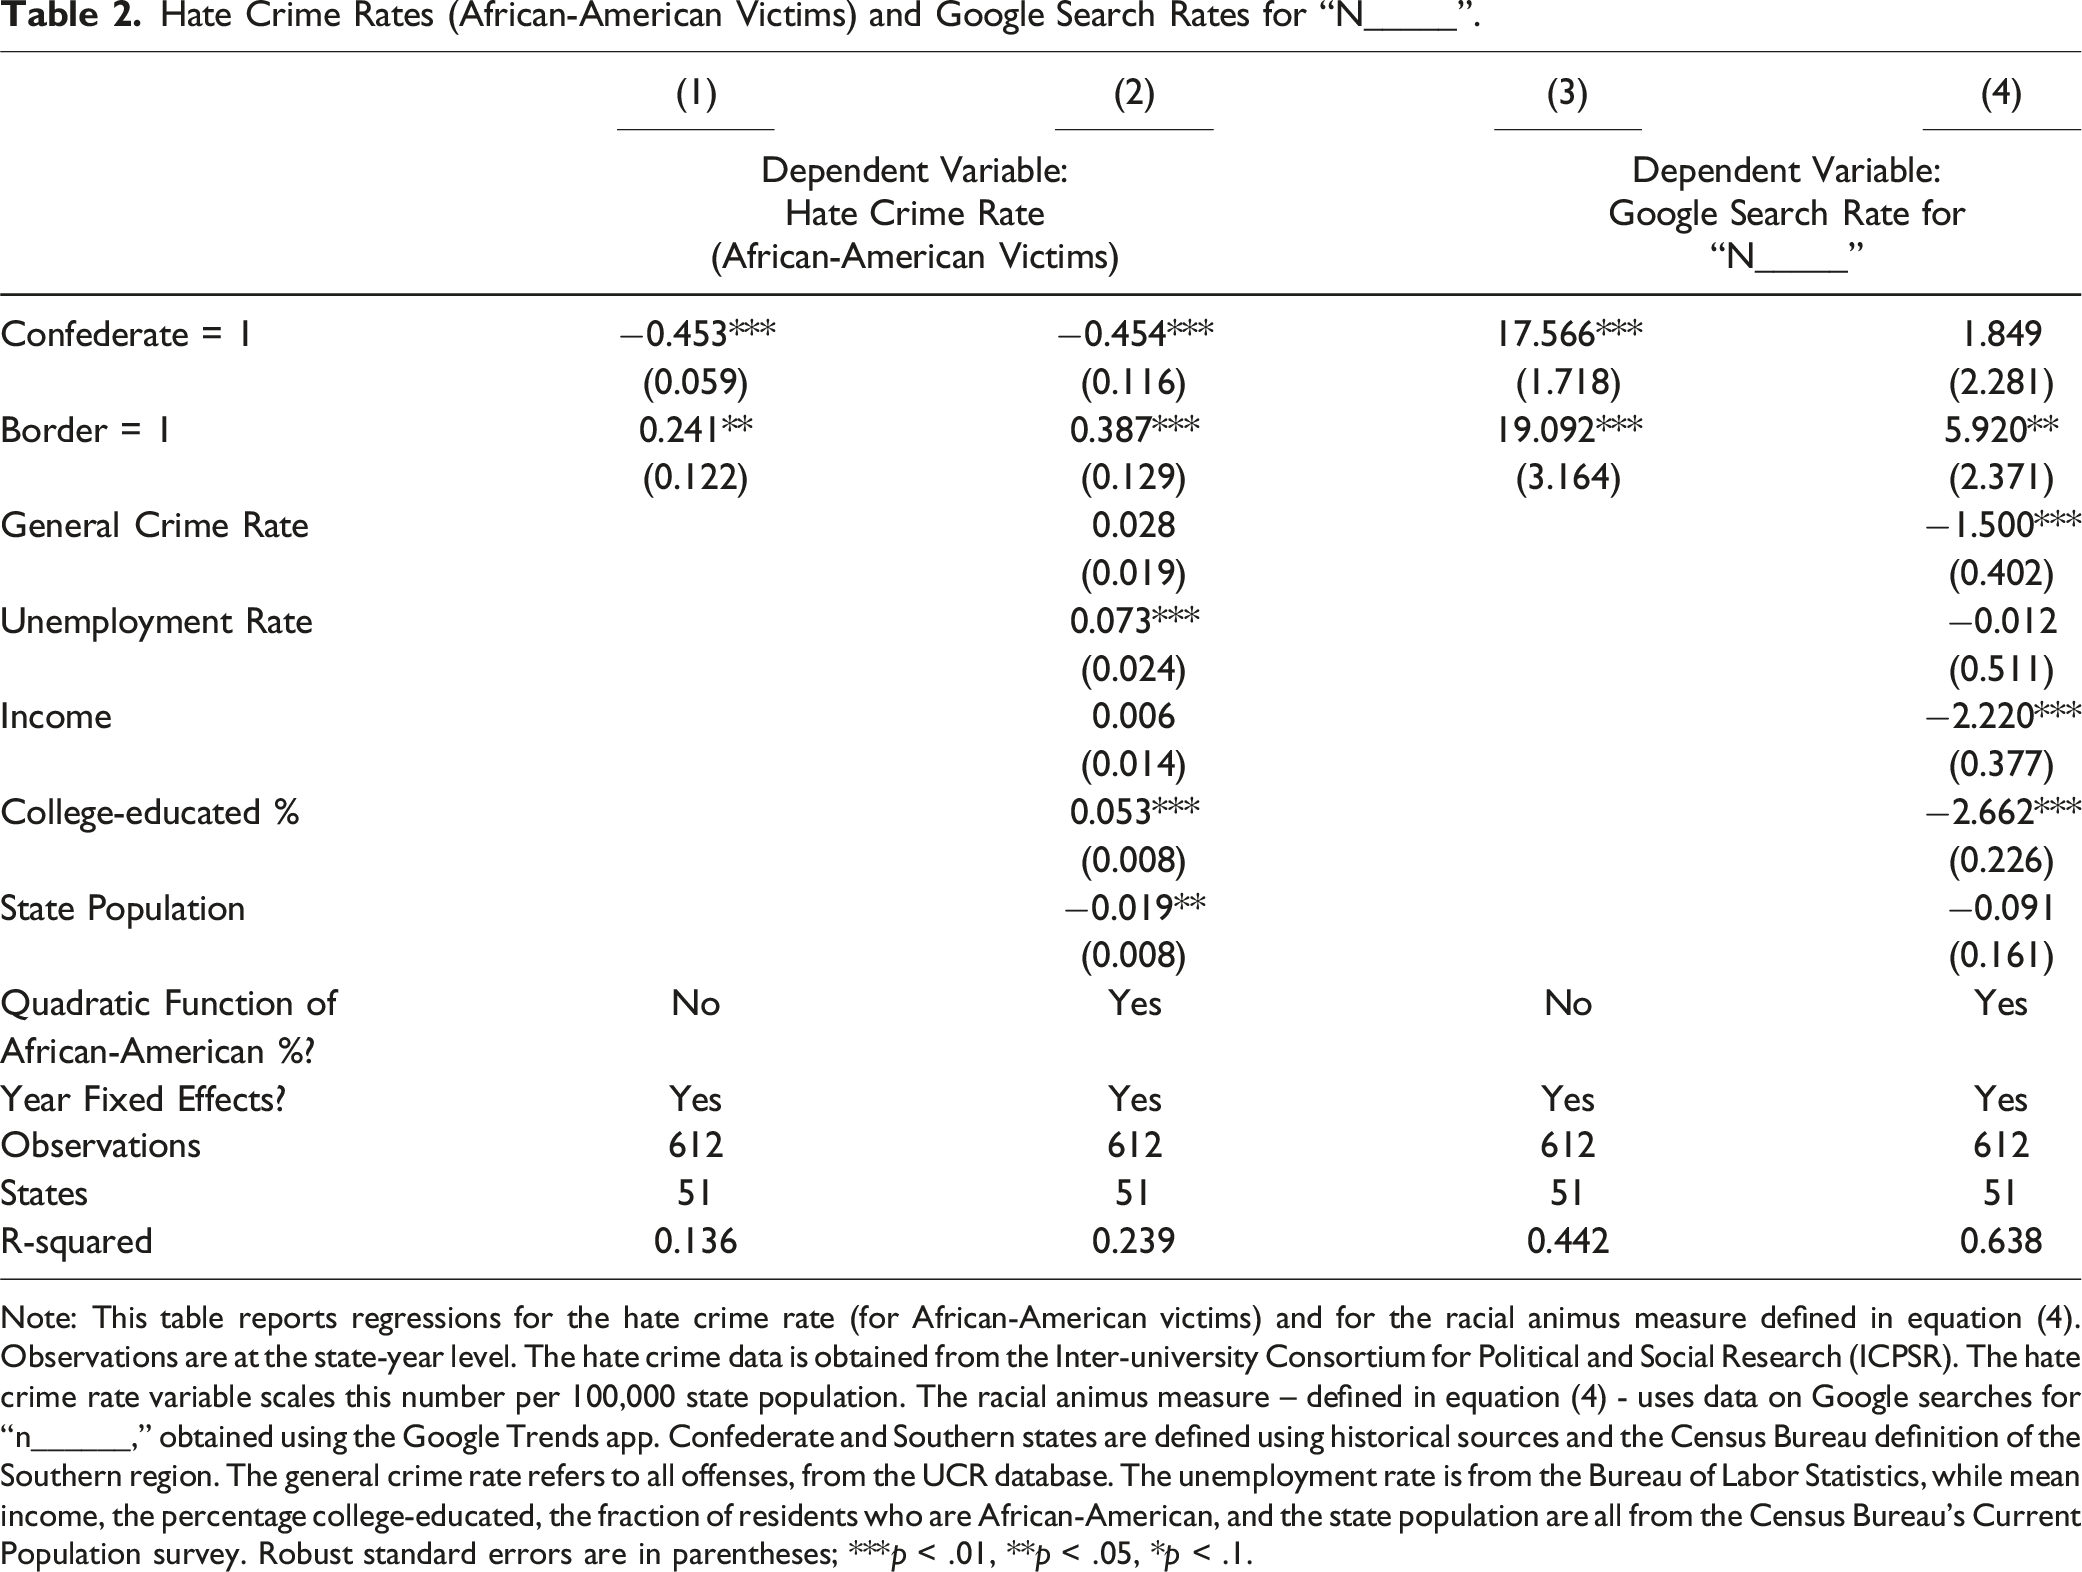
Note: This table reports regressions for the hate crime rate (for African-American victims) and for the racial animus measure defined in equation (4). Observations are at the state-year level. The hate crime data is obtained from the Inter-university Consortium for Political and Social Research (ICPSR). The hate crime rate variable scales this number per 100,000 state population. The racial animus measure – defined in equation (4) - uses data on Google searches for “n______,” obtained using the Google Trends app. Confederate and Southern states are defined using historical sources and the Census Bureau definition of the Southern region. The general crime rate refers to all offenses, from the UCR database. The unemployment rate is from the Bureau of Labor Statistics, while mean income, the percentage college-educated, the fraction of residents who are African-American, and the state population are all from the Census Bureau’s Current Population survey. Robust standard errors are in parentheses; ***p < .01, **p < .05, *p < .1.
Column 3 of Table 2 reports a regression in which
Regressions Predicting Hate Crime Rates.
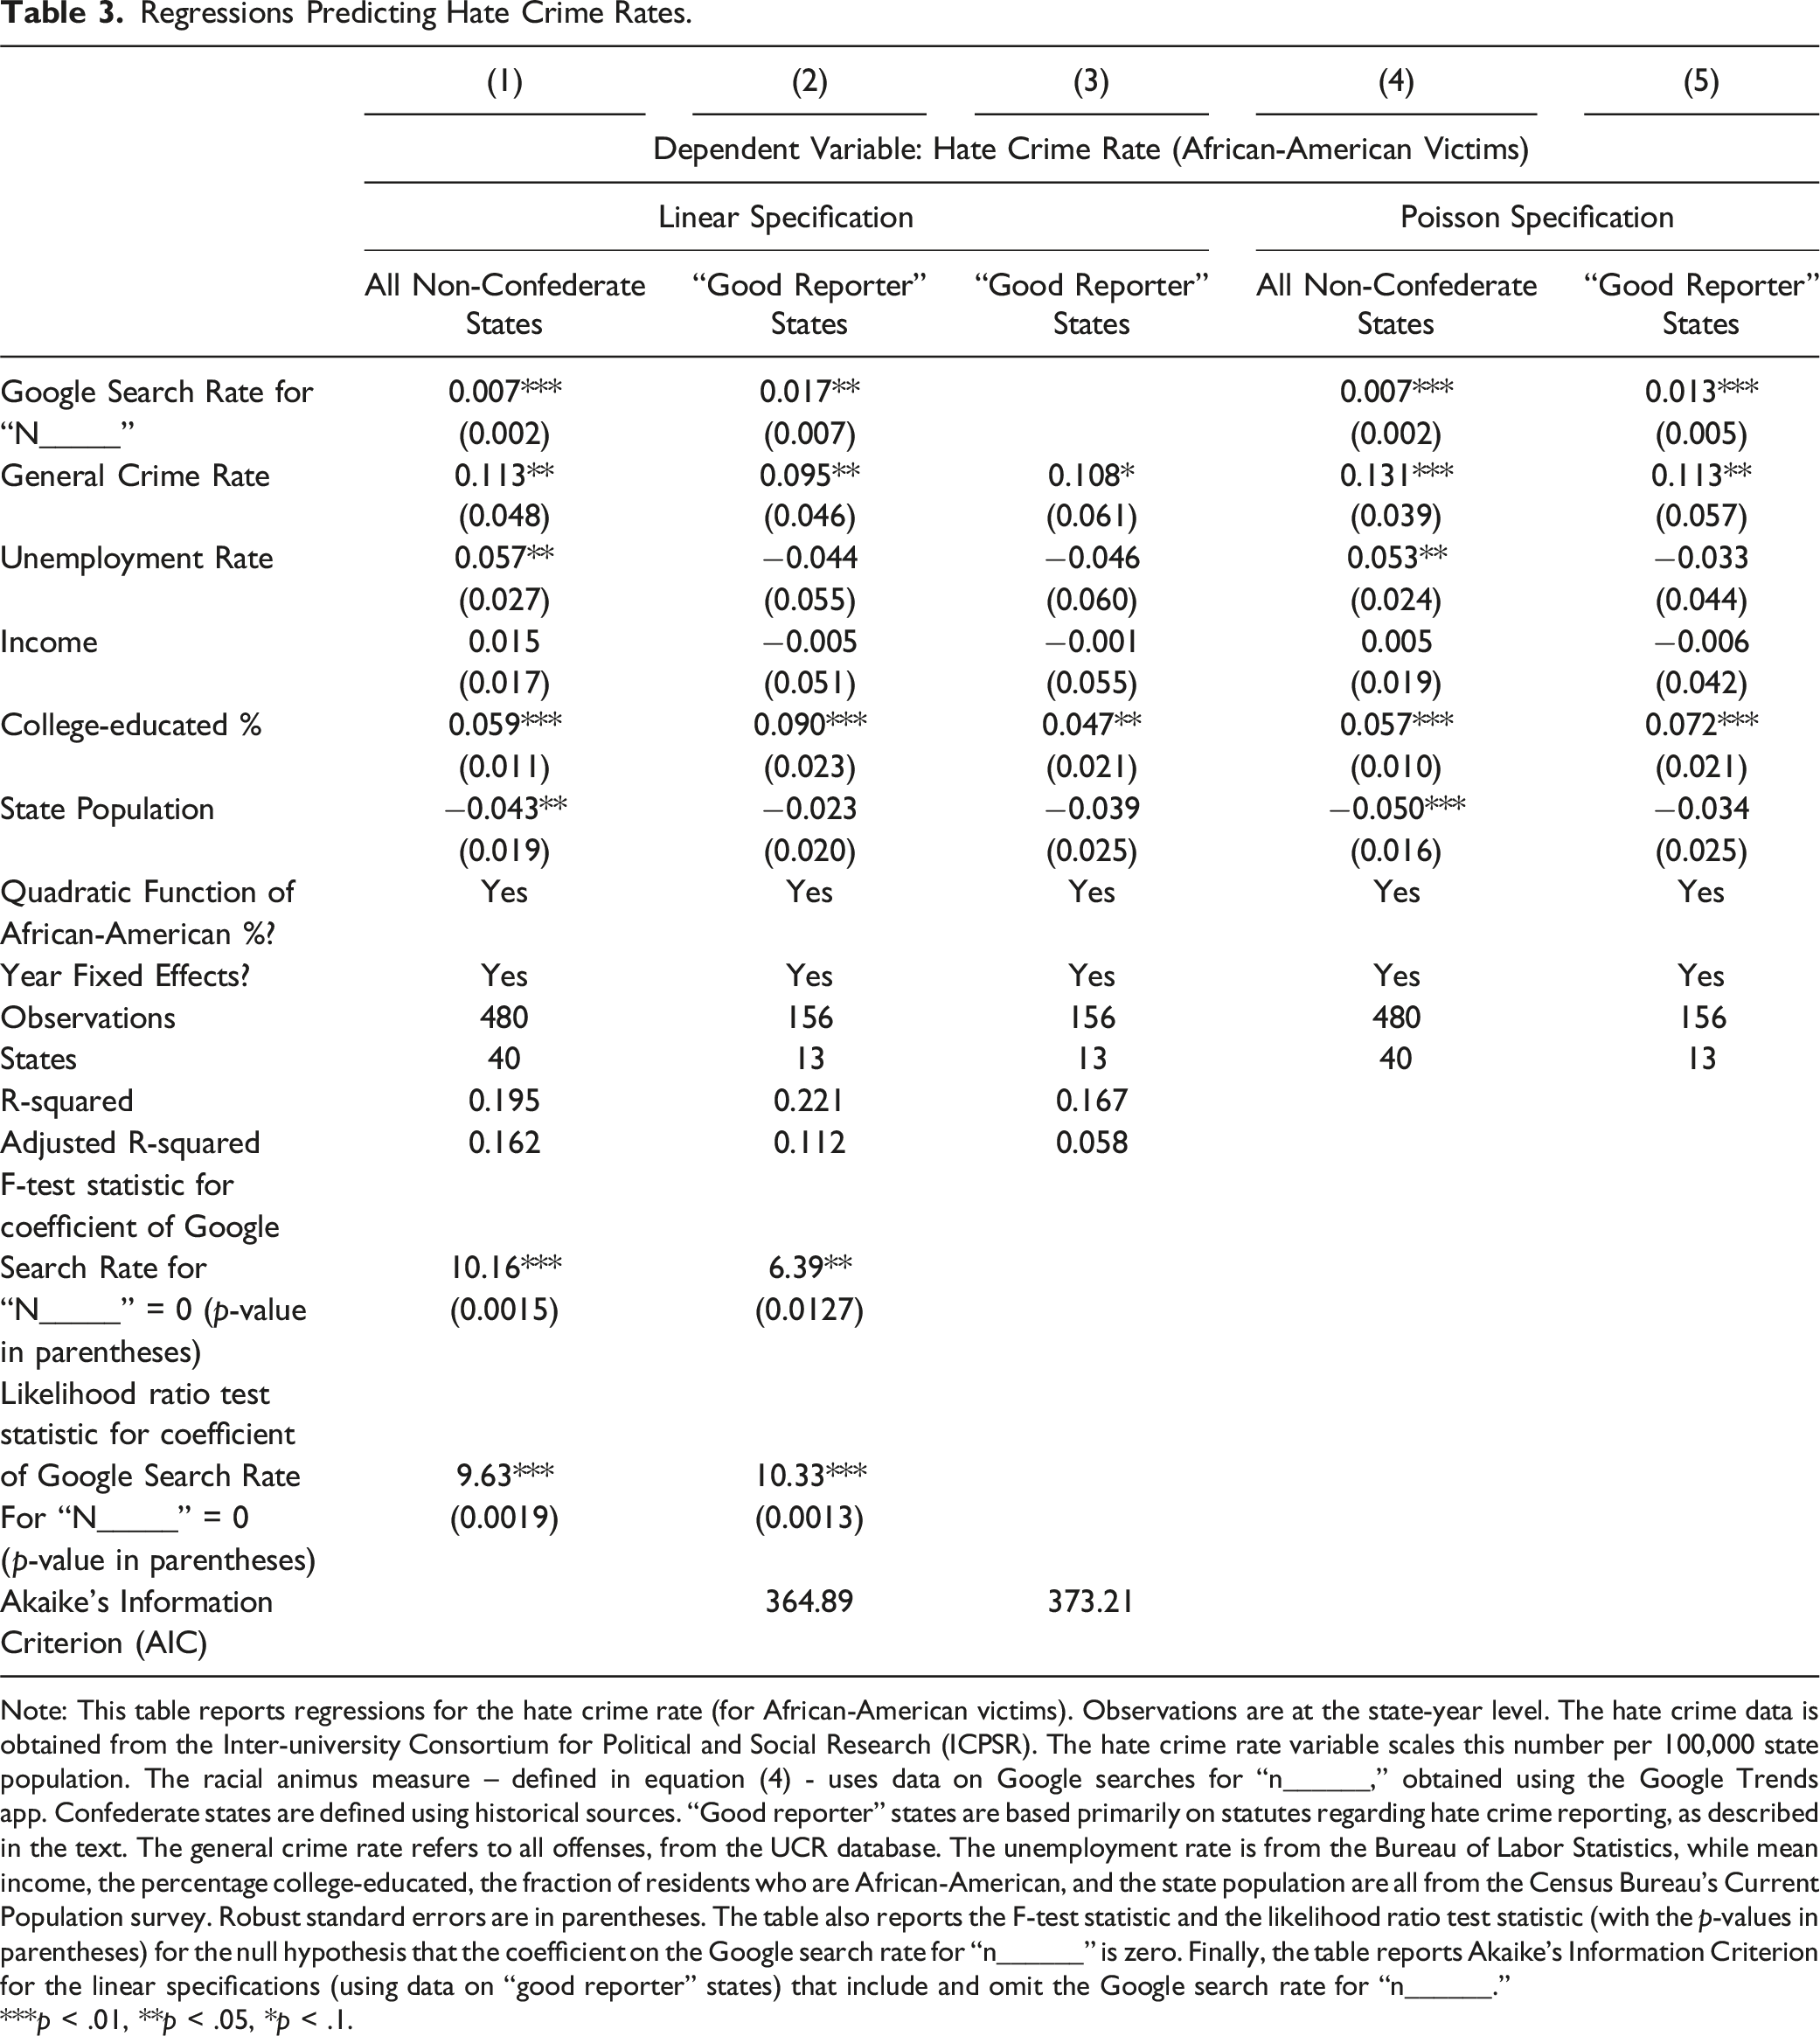
Note: This table reports regressions for the hate crime rate (for African-American victims). Observations are at the state-year level. The hate crime data is obtained from the Inter-university Consortium for Political and Social Research (ICPSR). The hate crime rate variable scales this number per 100,000 state population. The racial animus measure – defined in equation (4) - uses data on Google searches for “n______,” obtained using the Google Trends app. Confederate states are defined using historical sources. “Good reporter” states are based primarily on statutes regarding hate crime reporting, as described in the text. The general crime rate refers to all offenses, from the UCR database. The unemployment rate is from the Bureau of Labor Statistics, while mean income, the percentage college-educated, the fraction of residents who are African-American, and the state population are all from the Census Bureau’s Current Population survey. Robust standard errors are in parentheses. The table also reports the F-test statistic and the likelihood ratio test statistic (with the p-values in parentheses) for the null hypothesis that the coefficient on the Google search rate for “n______” is zero. Finally, the table reports Akaike’s Information Criterion for the linear specifications (using data on “good reporter” states) that include and omit the Google search rate for “n______.”
***p < .01, **p < .05, *p < .1.
Column 2 of Table 3 reports results from the regression specification in equation (5), estimated using only data on our second set of benchmarking jurisdictions. As explained above, this set is defined primarily in terms of legislatively mandated training on reporters or its analog. This sample includes 156 state-year-level observations on 12 states and DC. The results are generally very similar to those in column 1. In particular,
The Incremental Predictive Power of the Google Search Variable
It is crucial to our imputation strategy that Google searches for “n_____” are predictive of reported hate crime rates (at least among “good” reporter states). Thus, we now consider the extent to which the inclusion of
We also conduct several additional standard statistical tests for model fit with and without the inclusion of the Google search variable. Table 3 reports F-test statistics for the null hypothesis that the coefficient on the Google search variable is zero in Columns 1 and 2. In both cases, the null is firmly rejected, indicating that the Google search variable adds substantially to the predictive power of the model. We also report likelihood ratio tests for the same null hypothesis in Columns 1 and 2. Again, this null hypothesis is rejected (in each case at the 1% level of significance). This reinforces the increase in explanatory power from including the Google search variable in the model.
We also compare Akaike’s Information Criterion (AIC) across the models with (Column 2) and without (Column 3) the Google search variable. The AIC is a standard test of whether inclusion of additional variables improves model fit, taking account of the number of regressors that are included. Lower values of the AIC indicate better model fit. As shown in Table 3, the AIC falls substantially (from 373.21 to 364.89) when the Google search variable is added to the model. In general, a decrease of two units or more in the AIC is considered to imply a substantially better model fit. Thus, this test also shows that adding the Google search variable leads to a considerable enhancement of model fit and enhances our ability to predict anti-Black hate crime rates among “good reporter” states.
The incremental predictive power of the Google search variable can also be illustrated graphically using an “added variable” plot. Figure 6 shows the relationship between the Google search variable and anti-Black hate crime rates for “good reporter” states over 2004–2015. The graph plots the standardized residuals for each variable, conditioning on the other independent variables (the socioeconomic and demographic variables that are included in the vector Added variable plot showing the relationship between Google searches and hate crimes for “Good Reporter” states, controlling for other independent variables. Note: This figure depicts a scatterplot of standardized residuals at the state-year level (for “good reporter” states only) for the racial animus measure defined in equation (4) – which is on the horizontal axis – and the number of African-American victims of racially-motivated hate crimes (scaled by state population) – which is on the vertical axis. It also shows a fitted line with a 95% confidence interval. The racial animus measure uses data on Google searches for “n______,” obtained using the Google Trends app. The data on reported hate crimes is from the Inter-university Consortium for Political and Social Research (ICPSR). The independent variables described in the text following equation (5) - the general crime rate, the unemployment rate, mean income, the college-educated percentage of the population, the state population, a quadratic function of the African-American fraction of the state population, and year fixed effects – are controlled for. Thus, the relationship that is depicted in the figure is conditional on these control variables.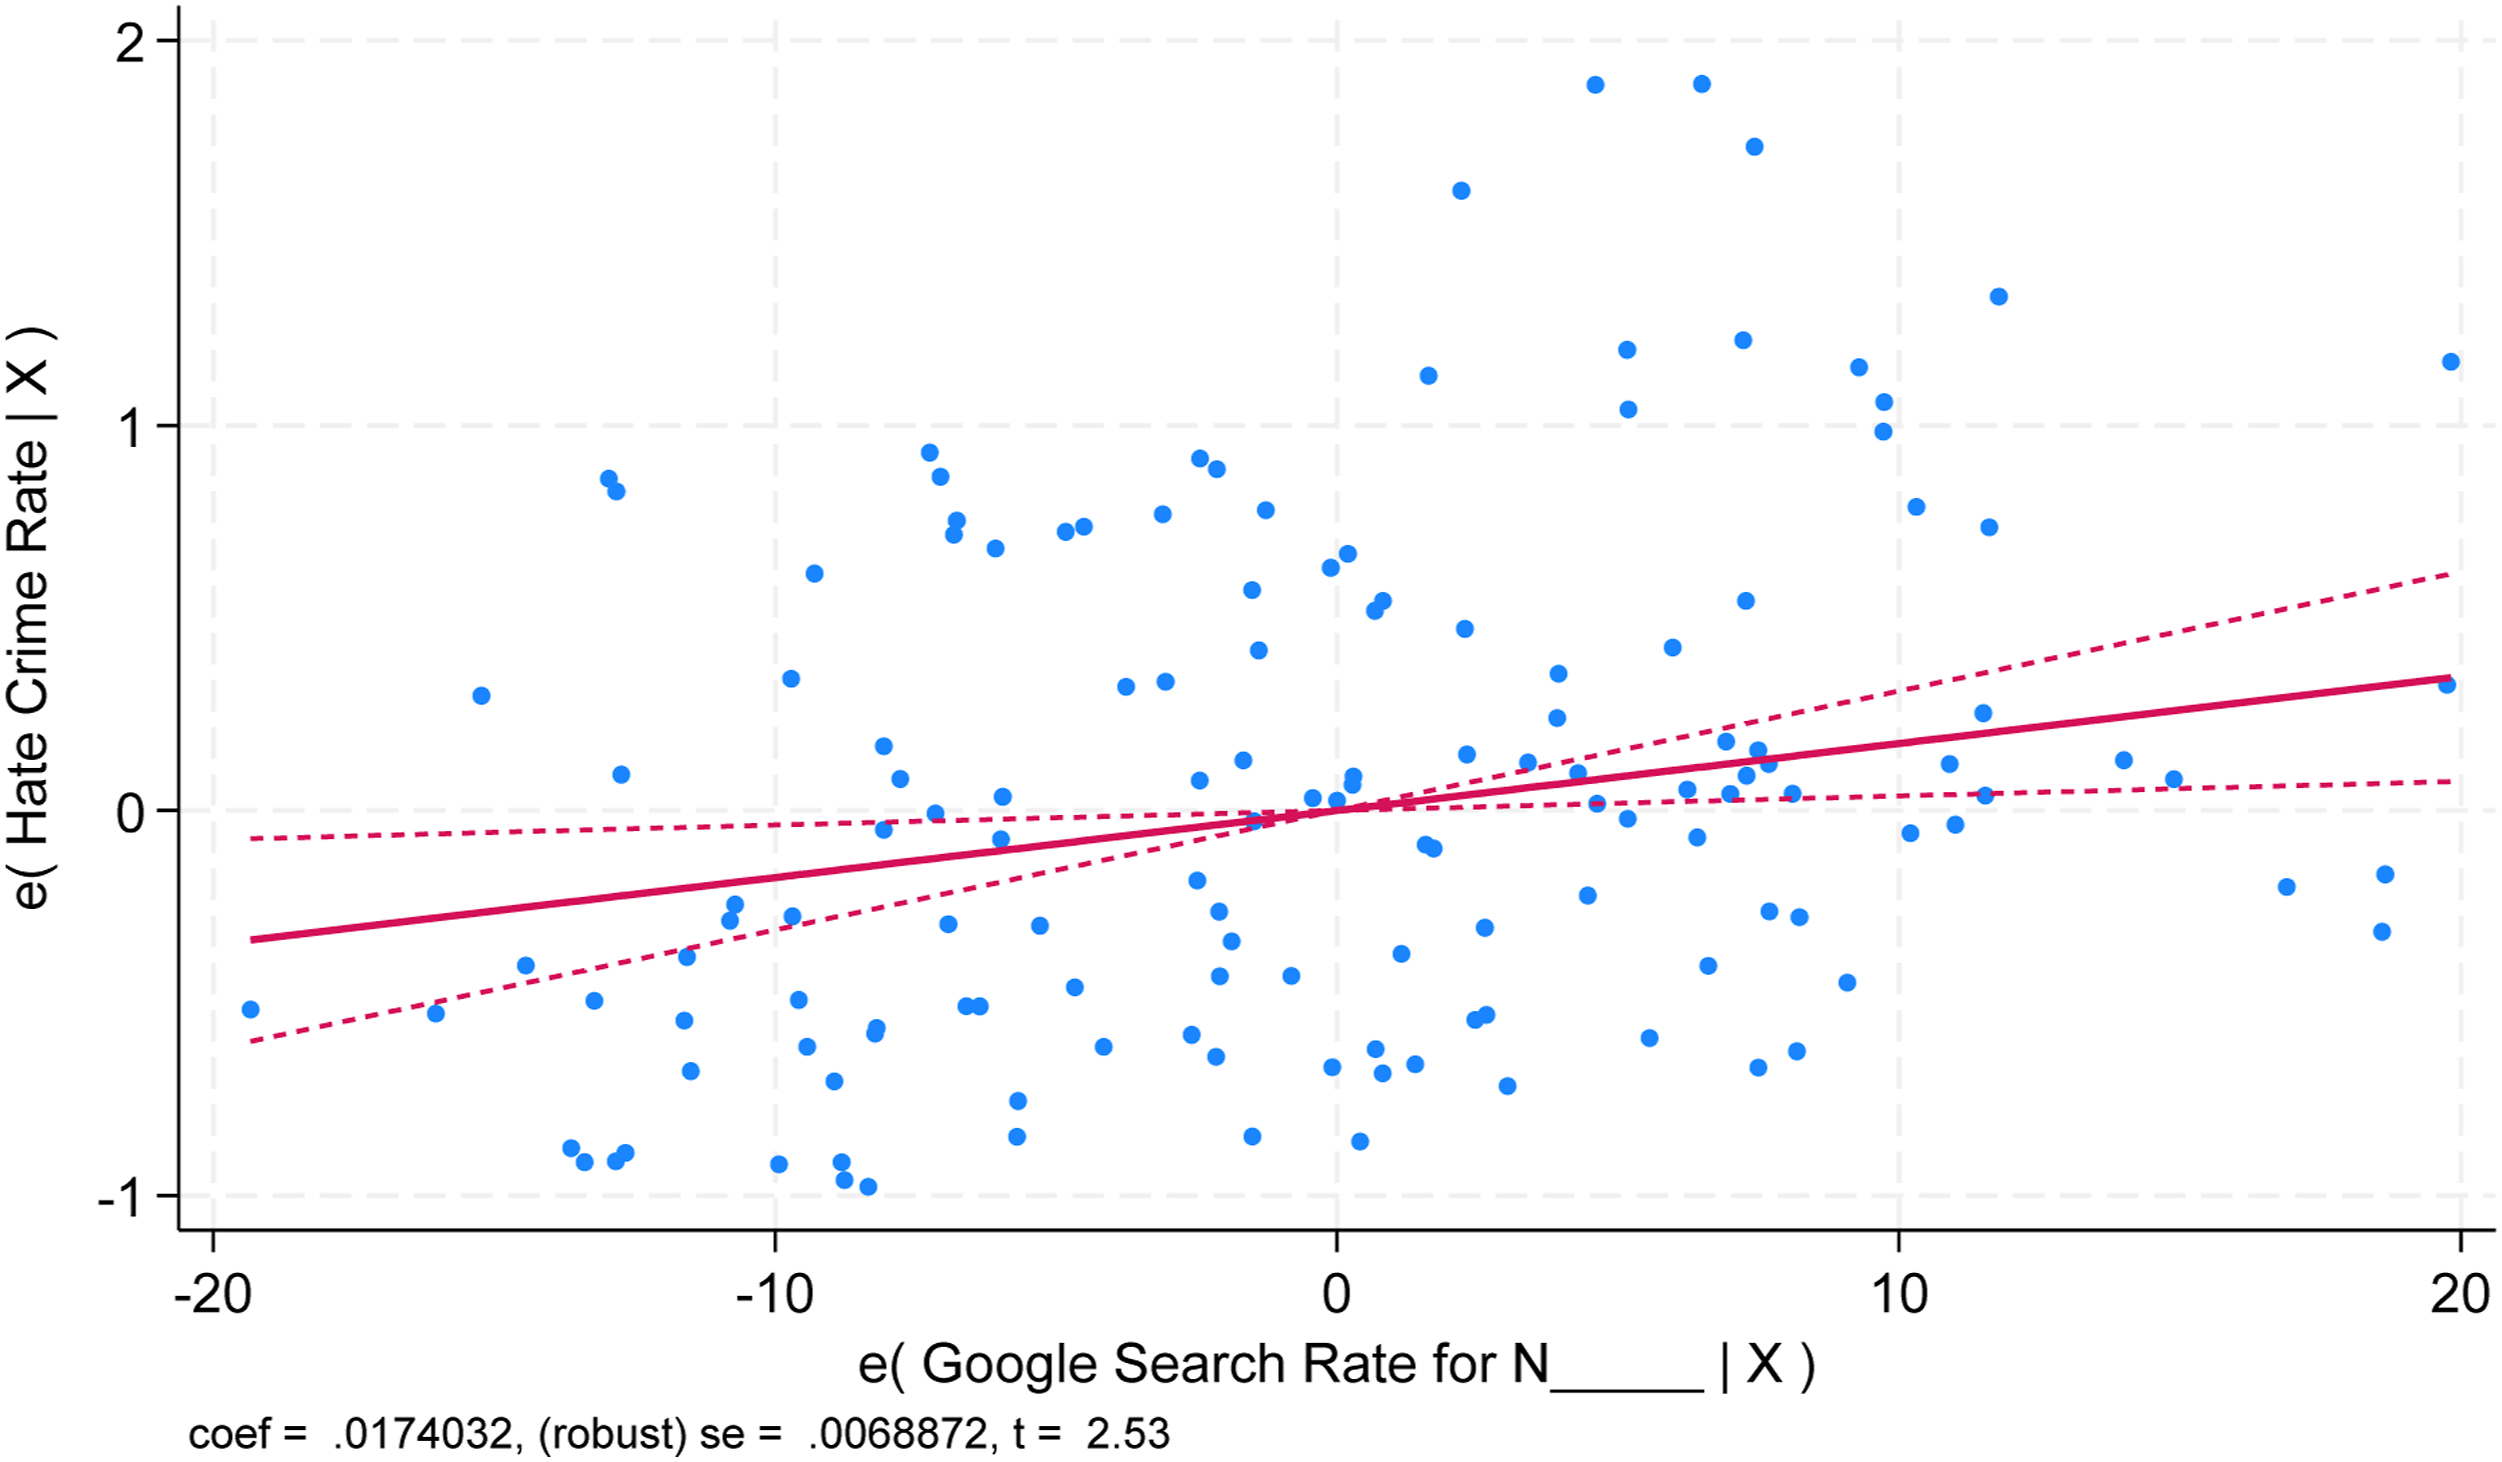
While this relationship holds for the entire 2004–2015 period, it is somewhat stronger in the latter part of that period, over 2010–2015. Figure 7 shows the relationship between the Google search variable and anti-Black hate crime rates for “good reporter” states over 2010–2015. It is evident that the incremental value of the Google search variable is greater over this period. However, we use the entire 2004–2015 period in our analysis to avoid the possible appearance of manipulating the time period to obtain stronger results. Added variable plot showing the relationship between Google searches and hate crimes for “Good Reporter” states over 2010–2015, controlling for other independent variables. Note: This figure depicts a scatterplot of standardized residuals at the state-year level (for “good reporter” states only, over the 2010–2015 period) for the racial animus measure defined in equation (4) – which is on the horizontal axis – and the number of African-American victims of racially-motivated hate crimes (scaled by state population) – which is on the vertical axis. It also shows a fitted line with a 95% confidence interval. The racial animus measure uses data on Google searches for “n______,” obtained using the Google Trends app. The data on reported hate crimes is from the Inter-university Consortium for Political and Social Research (ICPSR). The independent variables described in the text following equation (5) - the general crime rate, the unemployment rate, mean income, the college-educated percentage of the population, the state population, a quadratic function of the African-American fraction of the state population, and year fixed effects – are controlled for. Thus, the relationship that is depicted in the figure is conditional on these control variables.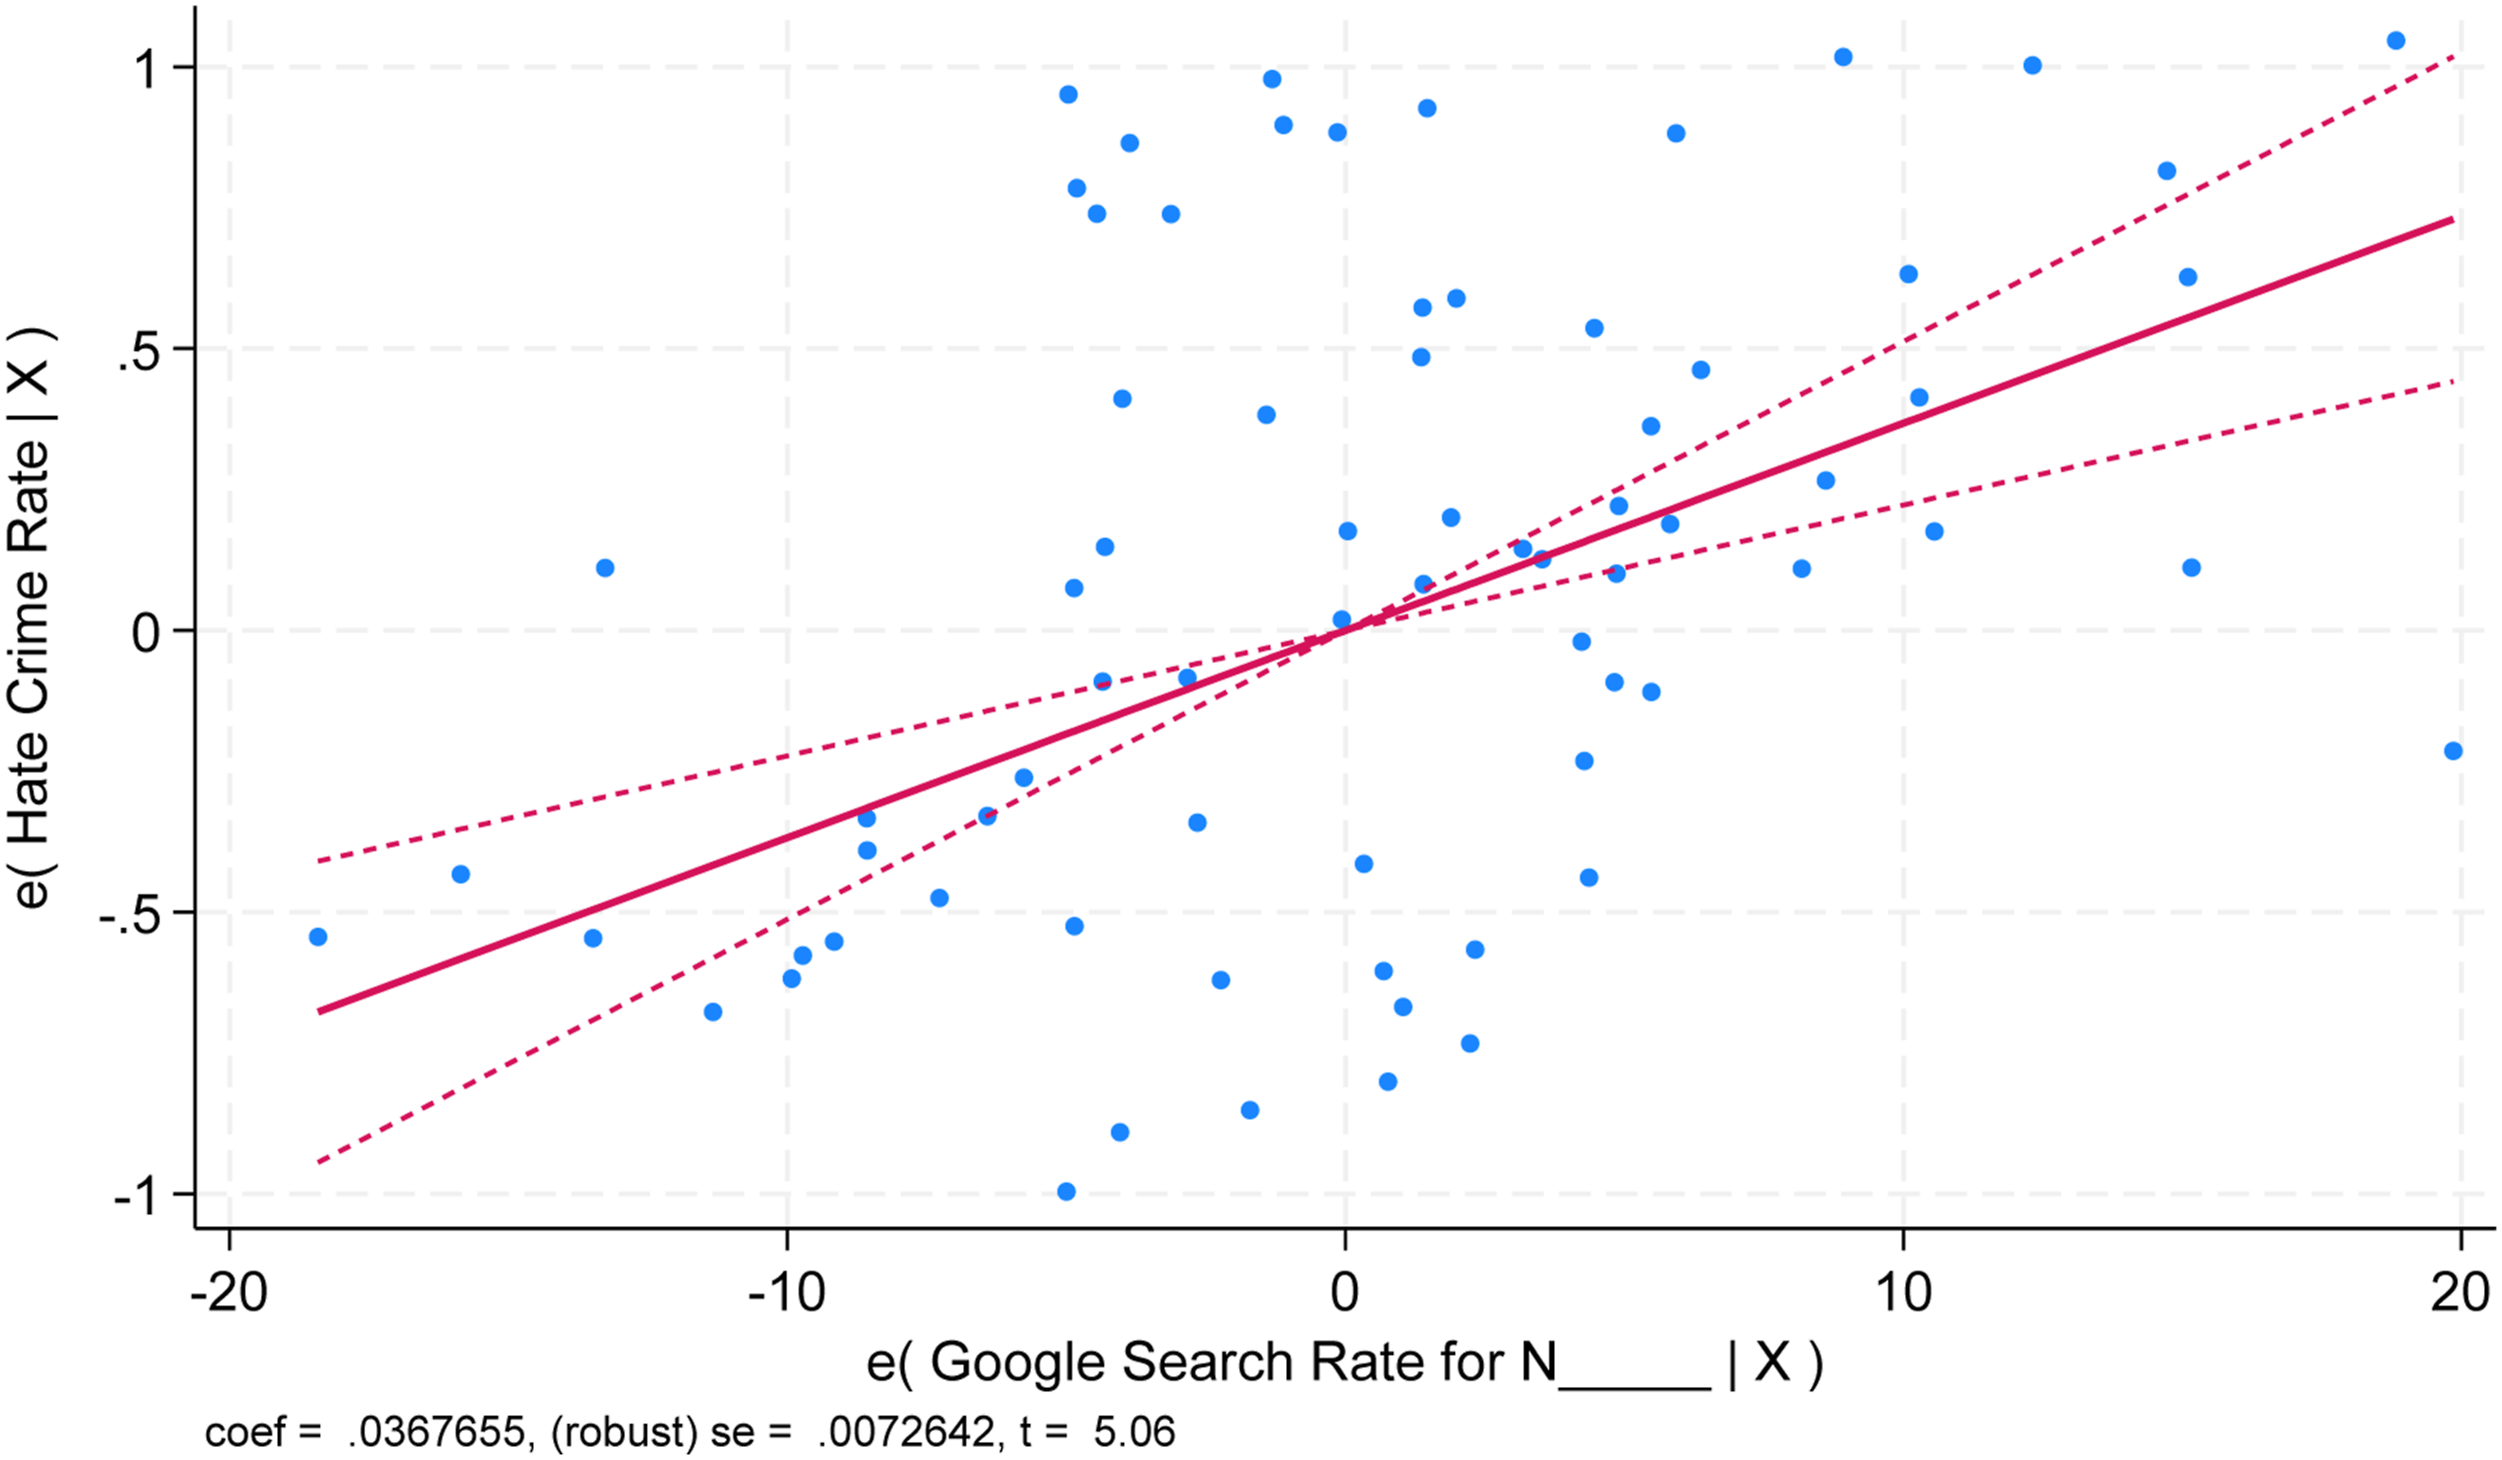
Poisson Specification
Equation (5) uses a linear specification. The number of African-American hate crime victims in a given state-year takes on only non-negative integer values, and thus is an example of “count” data. The hate crime rate (scaled by state population) that we compute and use has a more continuous distribution, but also necessarily only takes on non-negative values. Moreover, it potentially includes more zero observations than would be expected with a standard normal distribution of the error term. Ultimately, we wish to generate predicted values of hate crime rates. But the linear model does not constrain predicted values to be non-negative, and so it is in principle possible to predict negative hate crime rates (although this does not turn out to be a major problem in our sample).
For these reasons, we check the robustness of our results using a specification that better accommodates non-negative count data, the Poisson maximum-likelihood model:
Imputing Unreported Hate Crimes
For each of the baseline samples, we use the estimates reported in Table 3 to generate predicted values of hate crime rates, denoted 
Critically, the predicted values of hate crime rates
Mean Annual Imputed Hate Crimes and Hate Crime Rates for Selected States and Aggregate Imputed Hate Crimes for the US, 2004–2015.
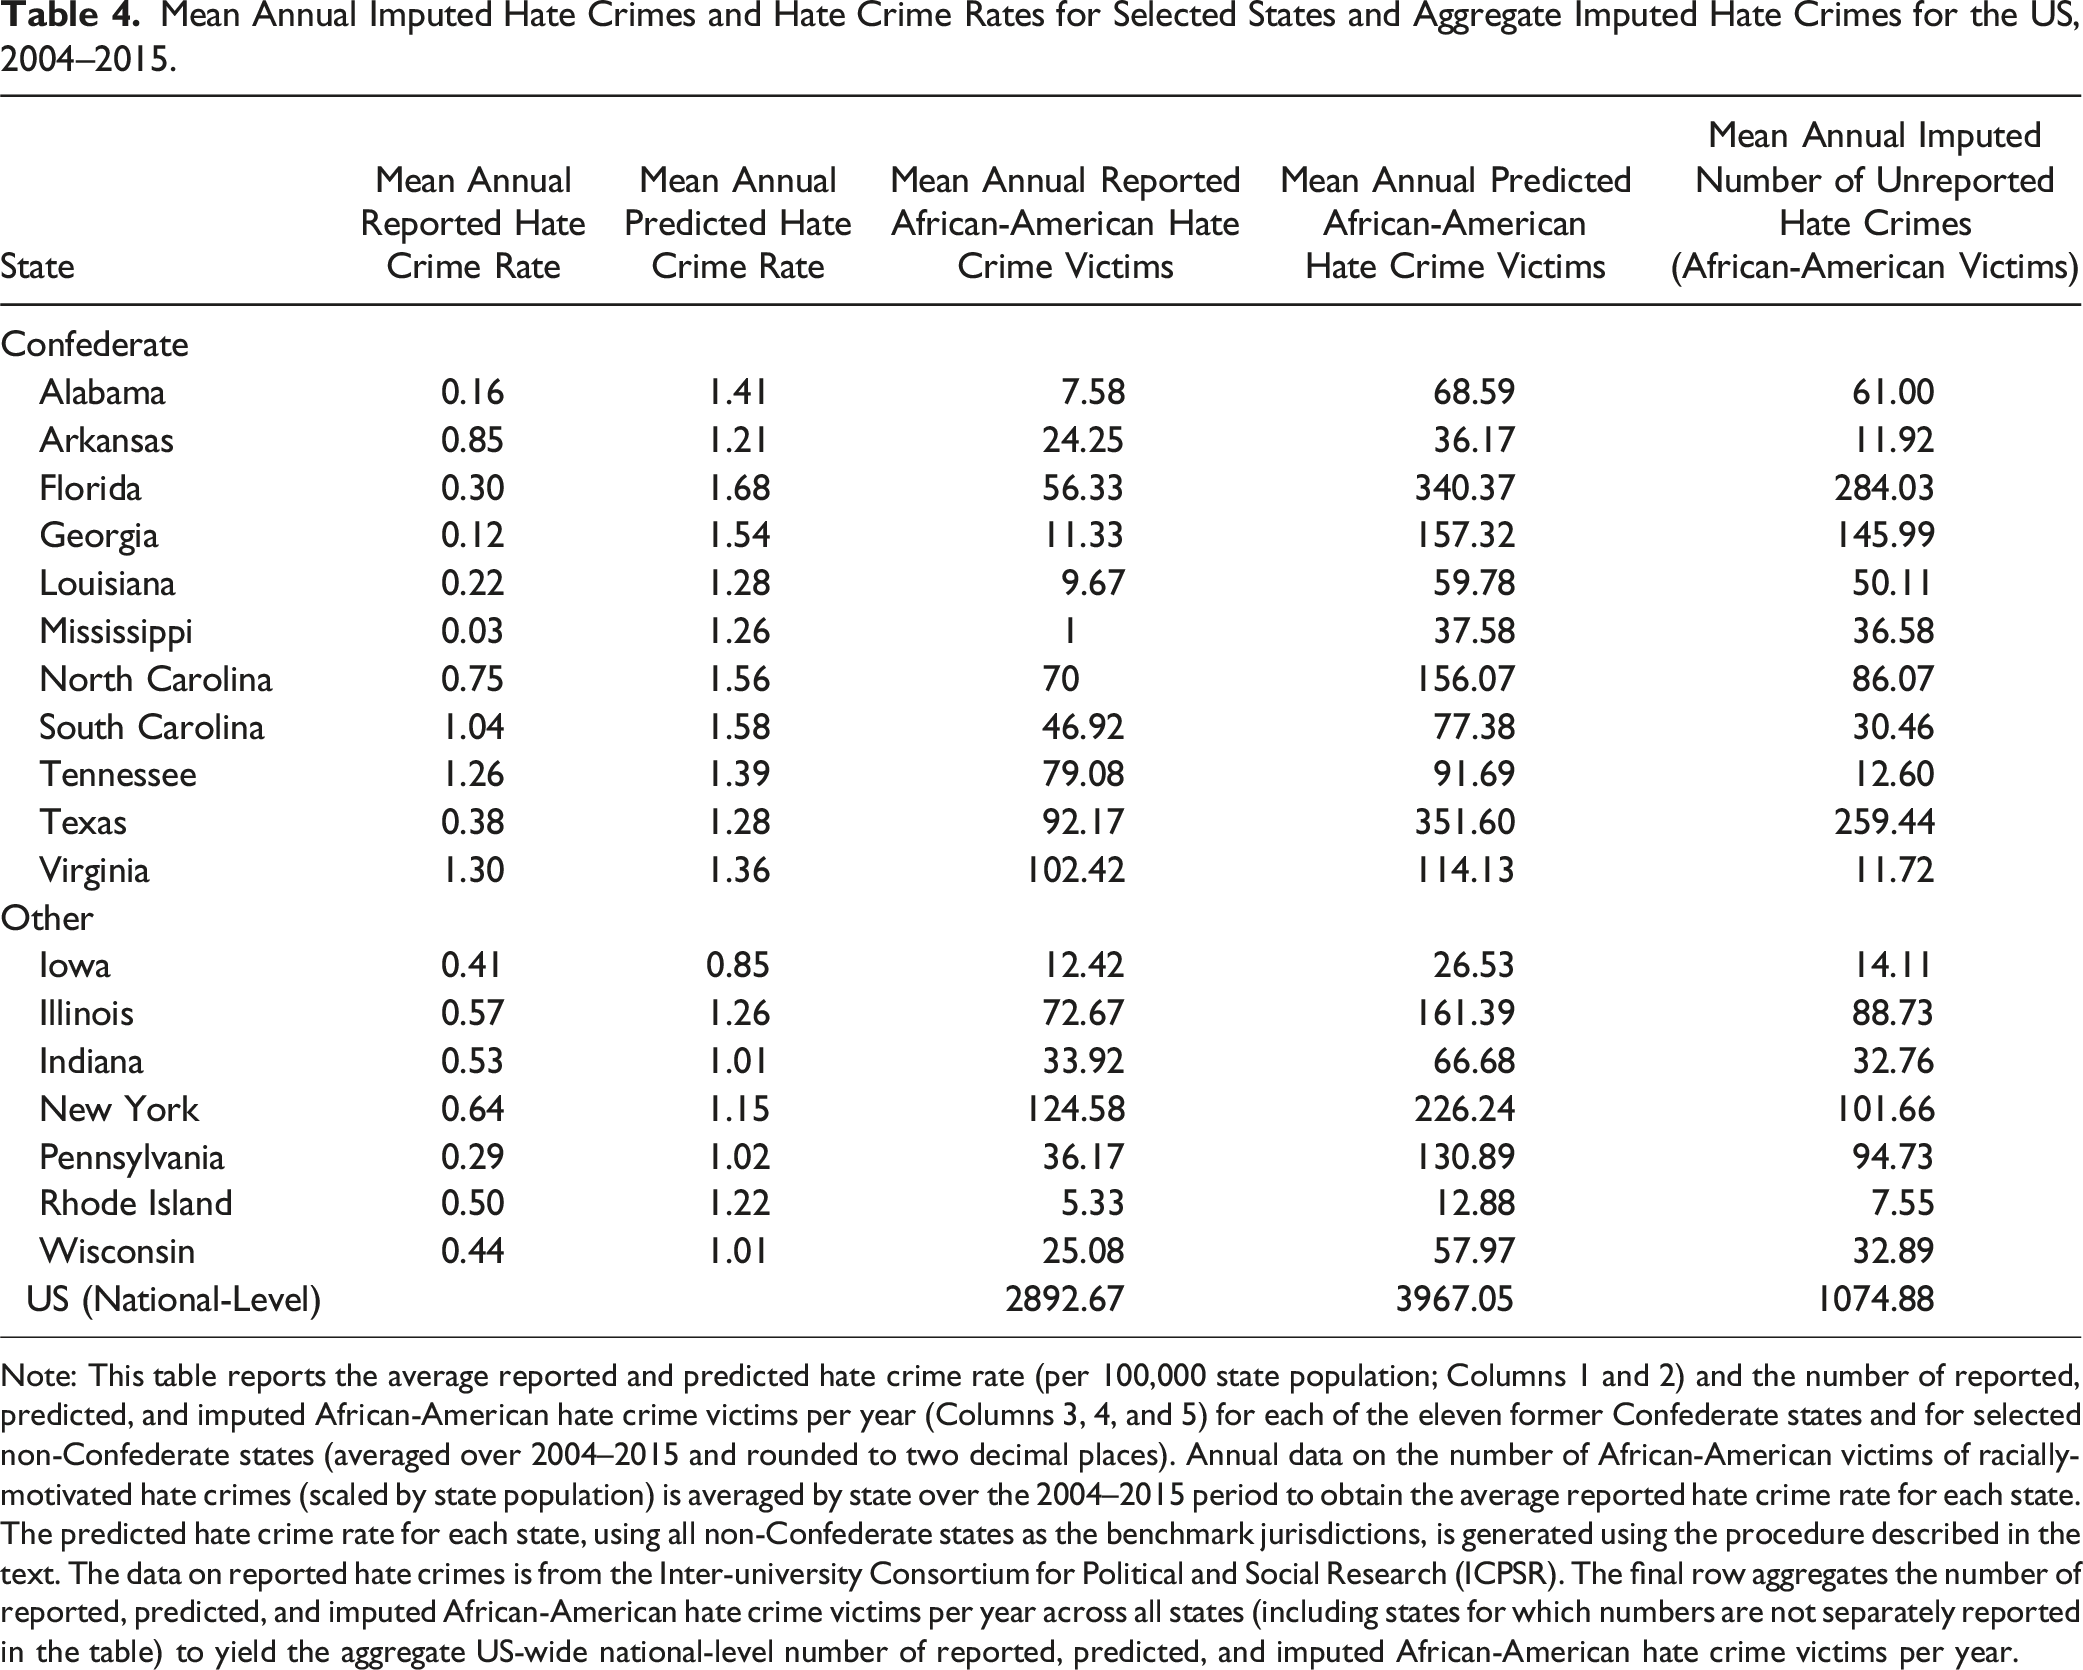
Note: This table reports the average reported and predicted hate crime rate (per 100,000 state population; Columns 1 and 2) and the number of reported, predicted, and imputed African-American hate crime victims per year (Columns 3, 4, and 5) for each of the eleven former Confederate states and for selected non-Confederate states (averaged over 2004–2015 and rounded to two decimal places). Annual data on the number of African-American victims of racially-motivated hate crimes (scaled by state population) is averaged by state over the 2004–2015 period to obtain the average reported hate crime rate for each state. The predicted hate crime rate for each state, using all non-Confederate states as the benchmark jurisdictions, is generated using the procedure described in the text. The data on reported hate crimes is from the Inter-university Consortium for Political and Social Research (ICPSR). The final row aggregates the number of reported, predicted, and imputed African-American hate crime victims per year across all states (including states for which numbers are not separately reported in the table) to yield the aggregate US-wide national-level number of reported, predicted, and imputed African-American hate crime victims per year.
The third column of Table 4 reports the mean annual number of African-American hate crime victims from the ICPSR data, averaged over the years 2004–2015. The fourth column converts the predicted hate crime rate in column 2 into the implied number of African-American hate crime victims per year (by multiplying the rate by the state population). For instance, Florida law enforcement agencies reported an average of 56 African-American victims of racially-motivated hate crimes per year over 2004–2015, a number that is very close to the sample mean of 57. Still, the predicted hate crime rate for Florida implies an average of 340 African-American victims of racially-motivated hate crimes per year over 2004–2015. This in turn implies an average of 284 African-American victims of unreported racially-motivated hate crimes per year over 2004–2015, as shown in the final column of Table 4 (which reports the difference between the predicted number of victims per year from column four and the reported number from column three).
The imputed number of unreported hate crimes is large for several other former Confederate states. For instance, the predicted hate crime rate for Texas implies an average of 259 African-American victims of unreported racially-motivated hate crimes per year over 2004–2015; the predicted hate crime rate for Georgia implies an average of 146 African-American victims of unreported racially-motivated hate crimes per year over 2004–2015.
Underreporting is not limited to former Confederate states. Even among the benchmark states, there is variation in whether states reported hate crime rates fall above or below the predicted value that represents an average among all states in the benchmark set. For example, the predicted hate crime rate for Pennsylvania implies an average of 95 African-American victims of unreported racially-motivated hate crimes per year over 2004–2015; the predicted hate crime rate for Illinois implies an average of 89 African-American victims of unreported racially-motivated hate crimes per year over 2004–2015.
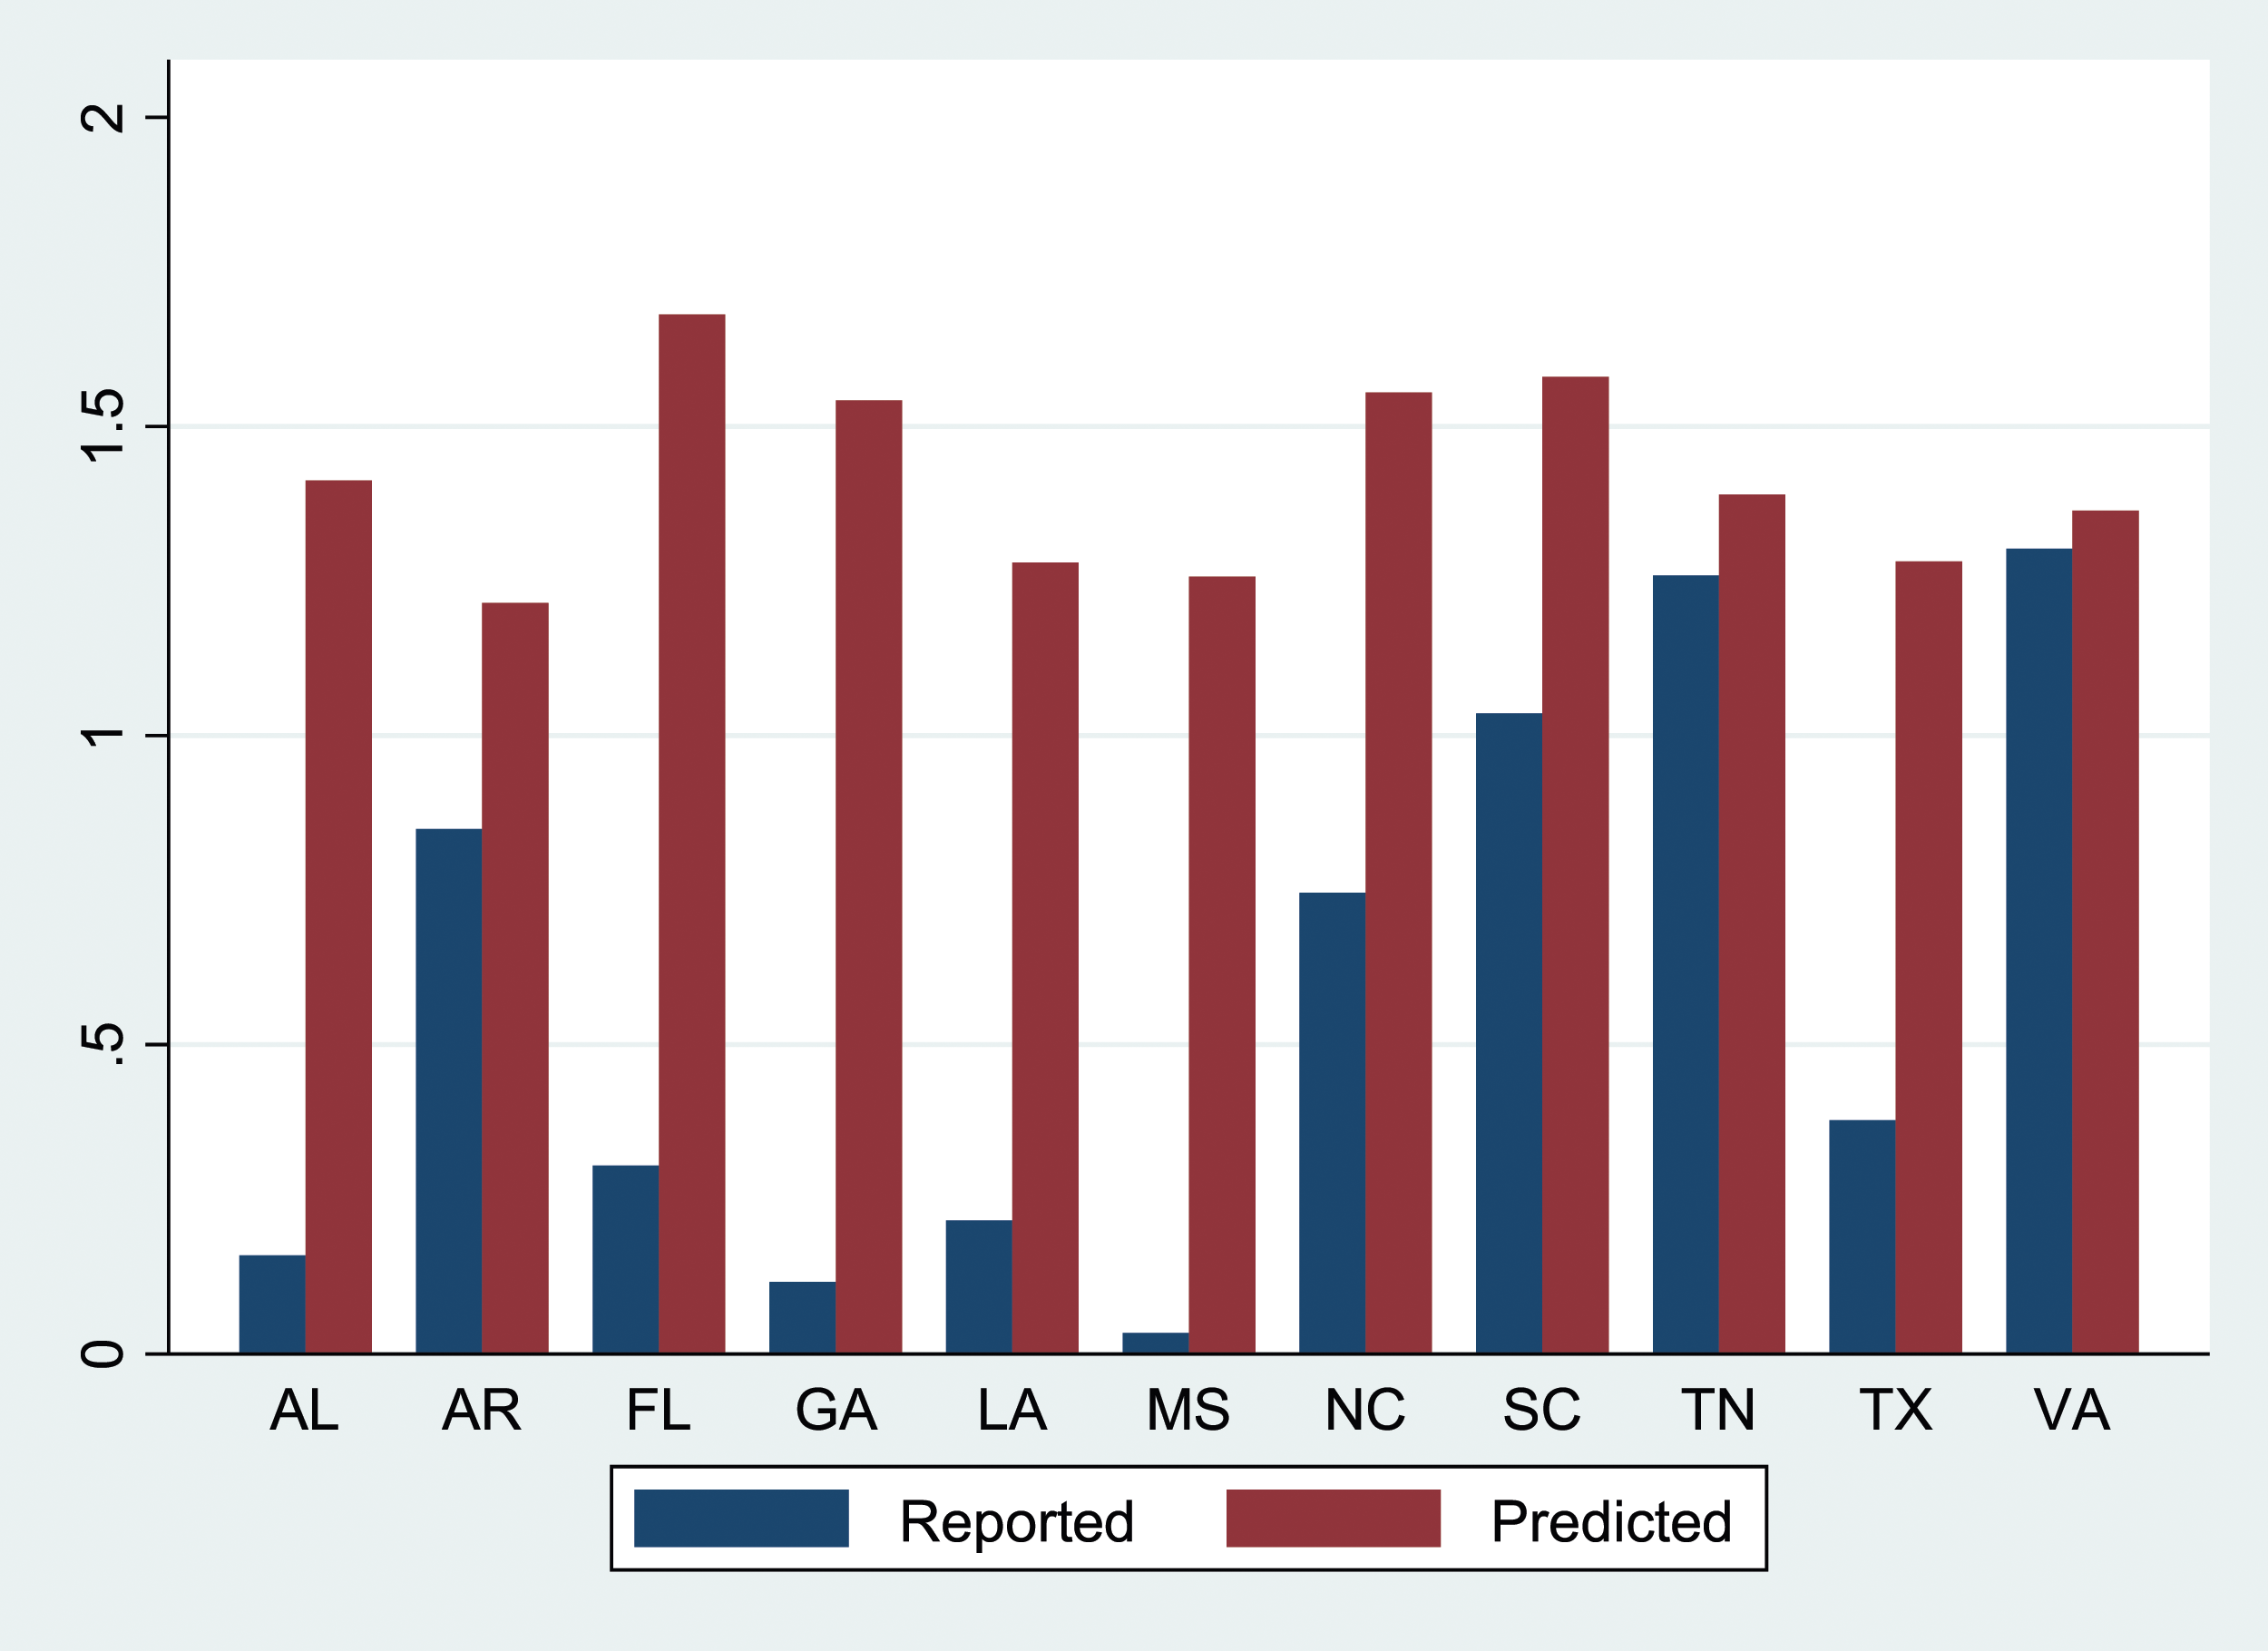
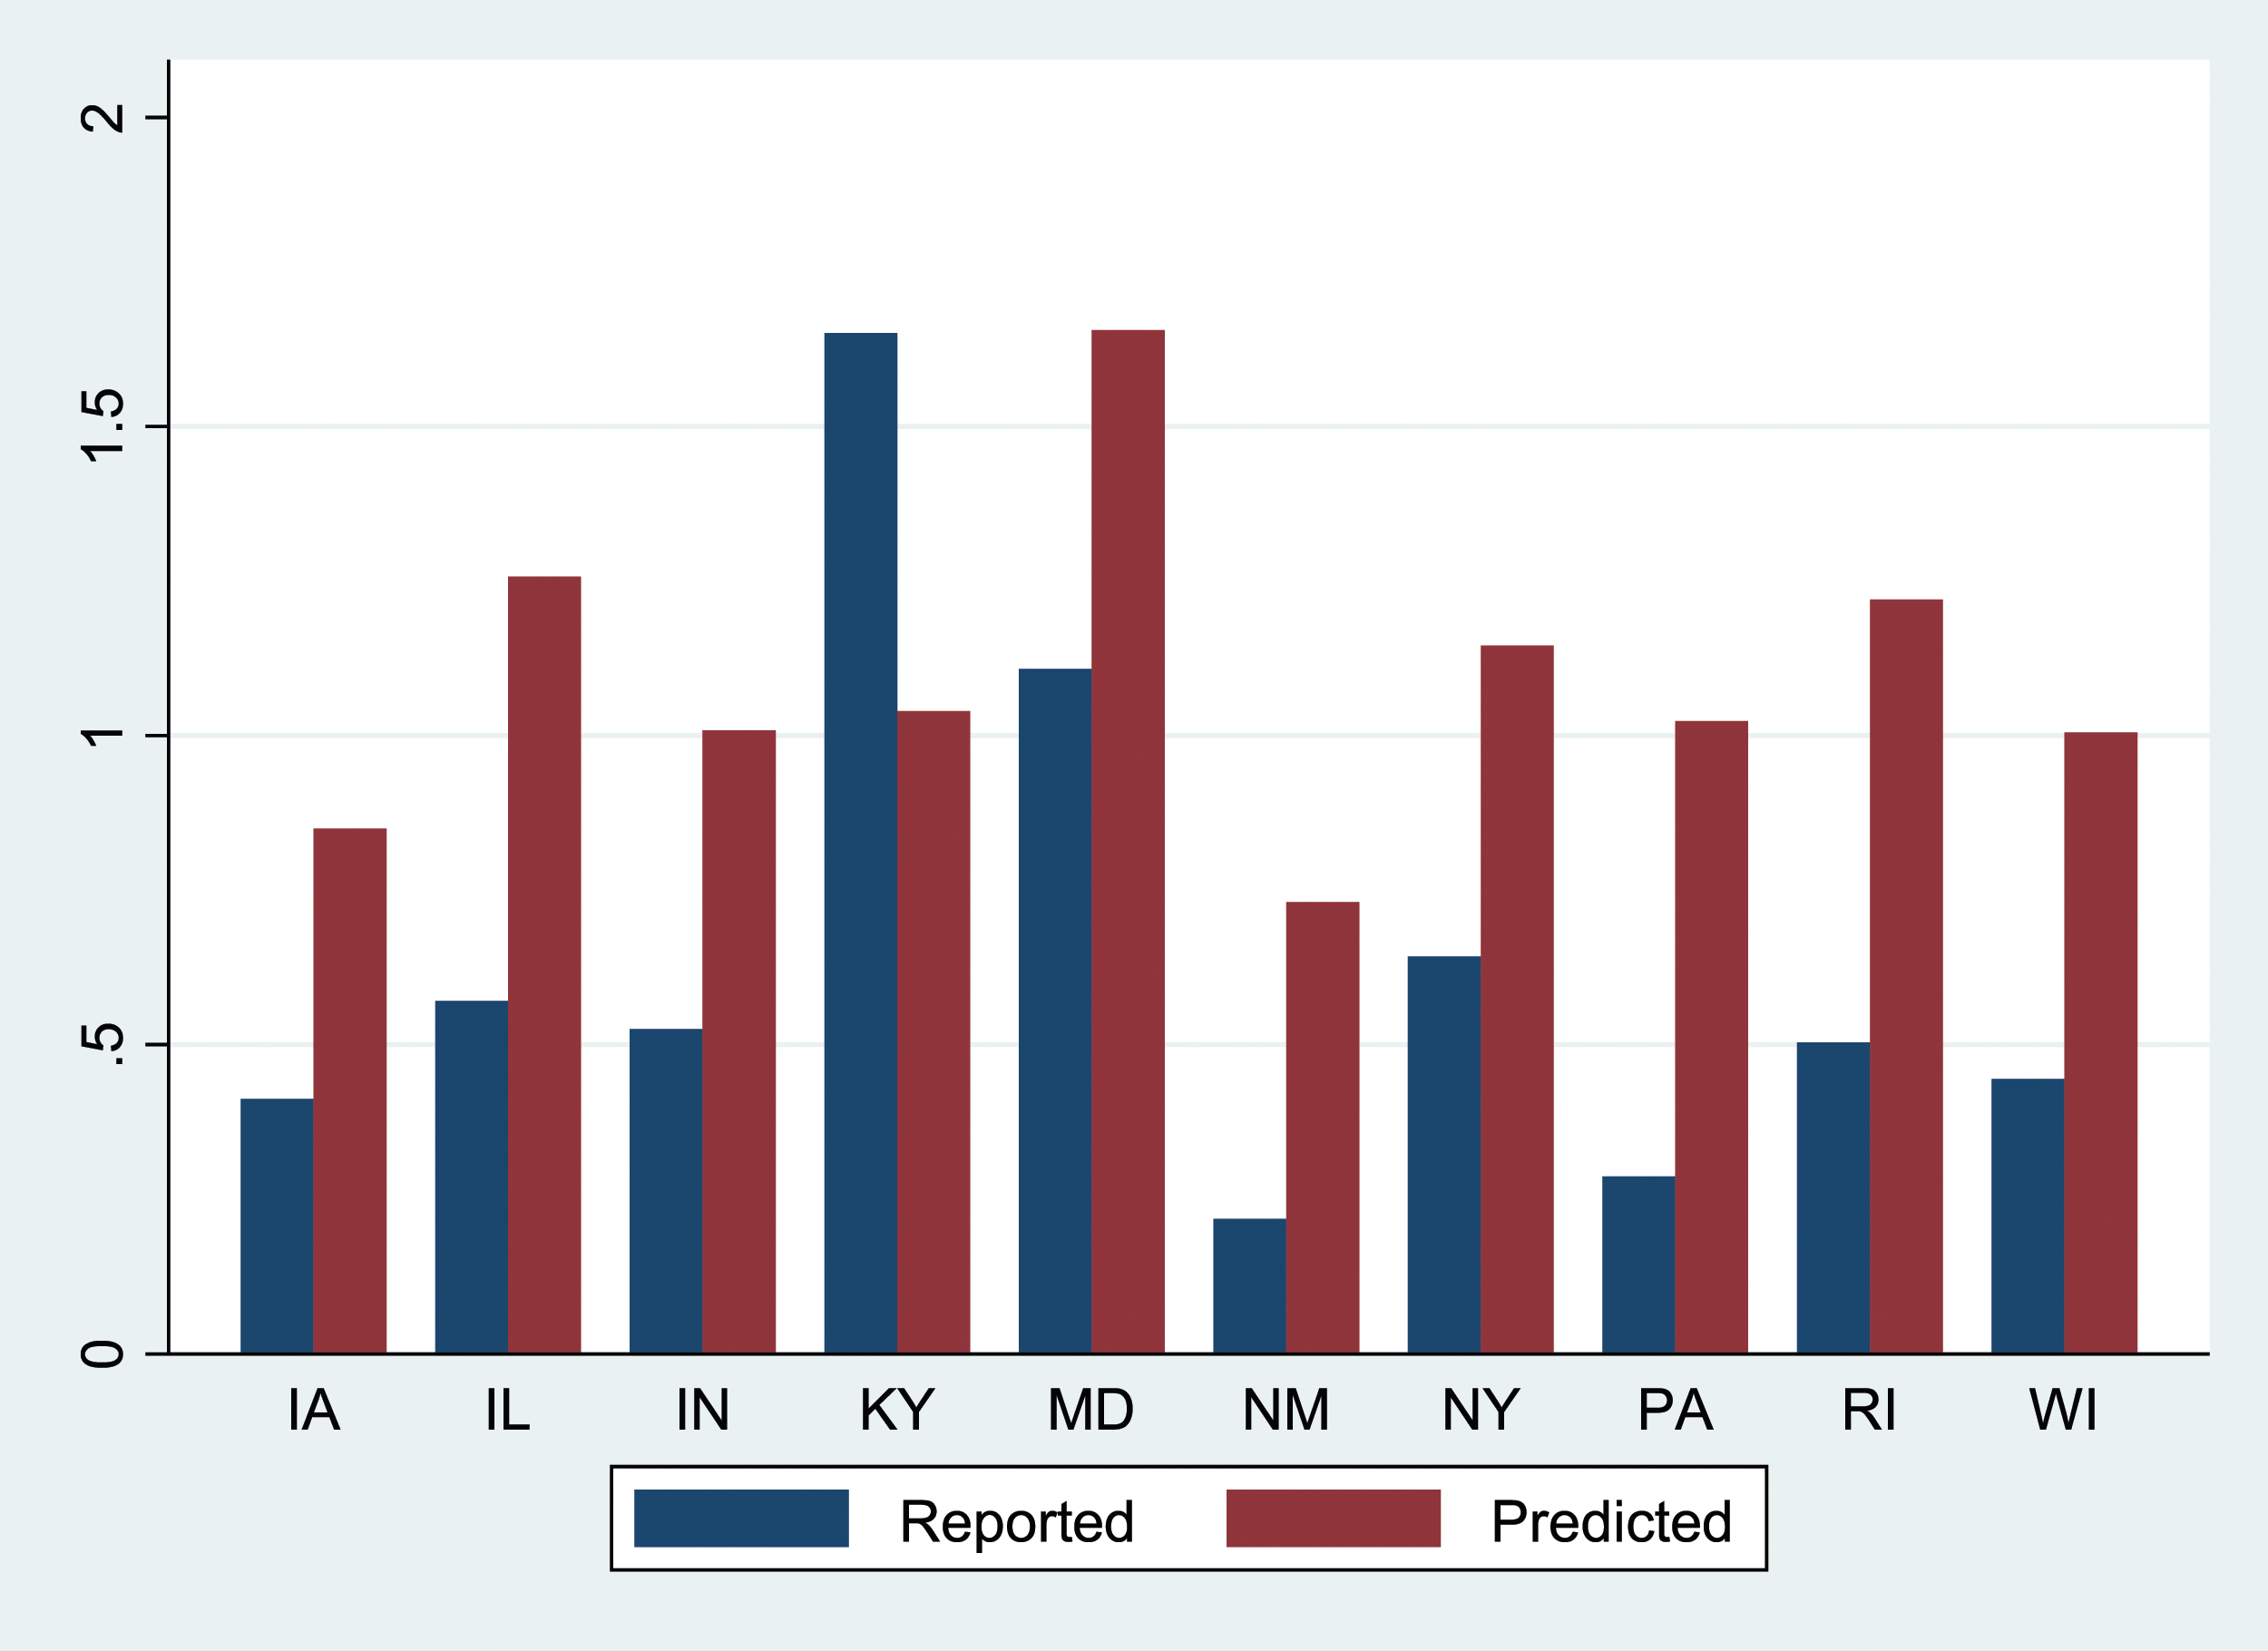
Figure 8 presents a map of the states showing predicted mean annual hate crime rates averaged over 2004–2015. It is notable that states in the southeast tend to have relatively large predicted values in Figure 8, in sharp contrast to the pattern of reported hate crime rates in Figure 1. The reported and imputed hate crime rates for each of the former Confederate states are represented in Figure 9. This shows that our procedure implies an upward adjustment for each of these states, though the magnitude of the gap between the reported and imputed rates differs substantially across states (Figure 10 reports selected rates for selected non-Confederate states). Predicted Mean Hate Crime Rates, Averaged by State over 2004–2015 (Using All Non-Confederate States as the Benchmark). Note: This map depicts the predicted hate crime rate for each state, using all non-Confederate states as the benchmark jurisdictions, generated using the procedure described in the text. Reported and Predicted Mean Hate Crime Rates for Confederate States, 2004–2015 (Using All Non-Confederate States as the Benchmark). Note: This figure depicts the average reported and predicted hate crime rate for each of the 11 former Confederate states. Annual data on the number of African-American victims of racially-motivated hate crimes (scaled by state population) is averaged by state over the 2004–2015 period to obtain the average reported hate crime rate for each state. The predicted hate crime rate for each state, using all non-Confederate states as the benchmark jurisdictions, generated using the procedure described in the text. The data on reported hate crimes is from the Inter-university Consortium for Political and Social Research (ICPSR). Reported and Predicted Mean Hate Crime Rates for Selected Non-Confederate States, 2004–2015 (Using All Non-Confederate States as the Benchmark). Note: This figure depicts the average reported and predicted hate crime rate for selected non-Confederate states. Annual data on the number of African-American victims of racially-motivated hate crimes (scaled by state population) is averaged by state over the 2004–2015 period to obtain the average reported hate crime rate for each state. The predicted hate crime rate for each state, using all non-Confederate states as the benchmark jurisdictions, generated using the procedure described in the text. The data on reported hate crimes is from the Inter-university Consortium for Political and Social Research (ICPSR).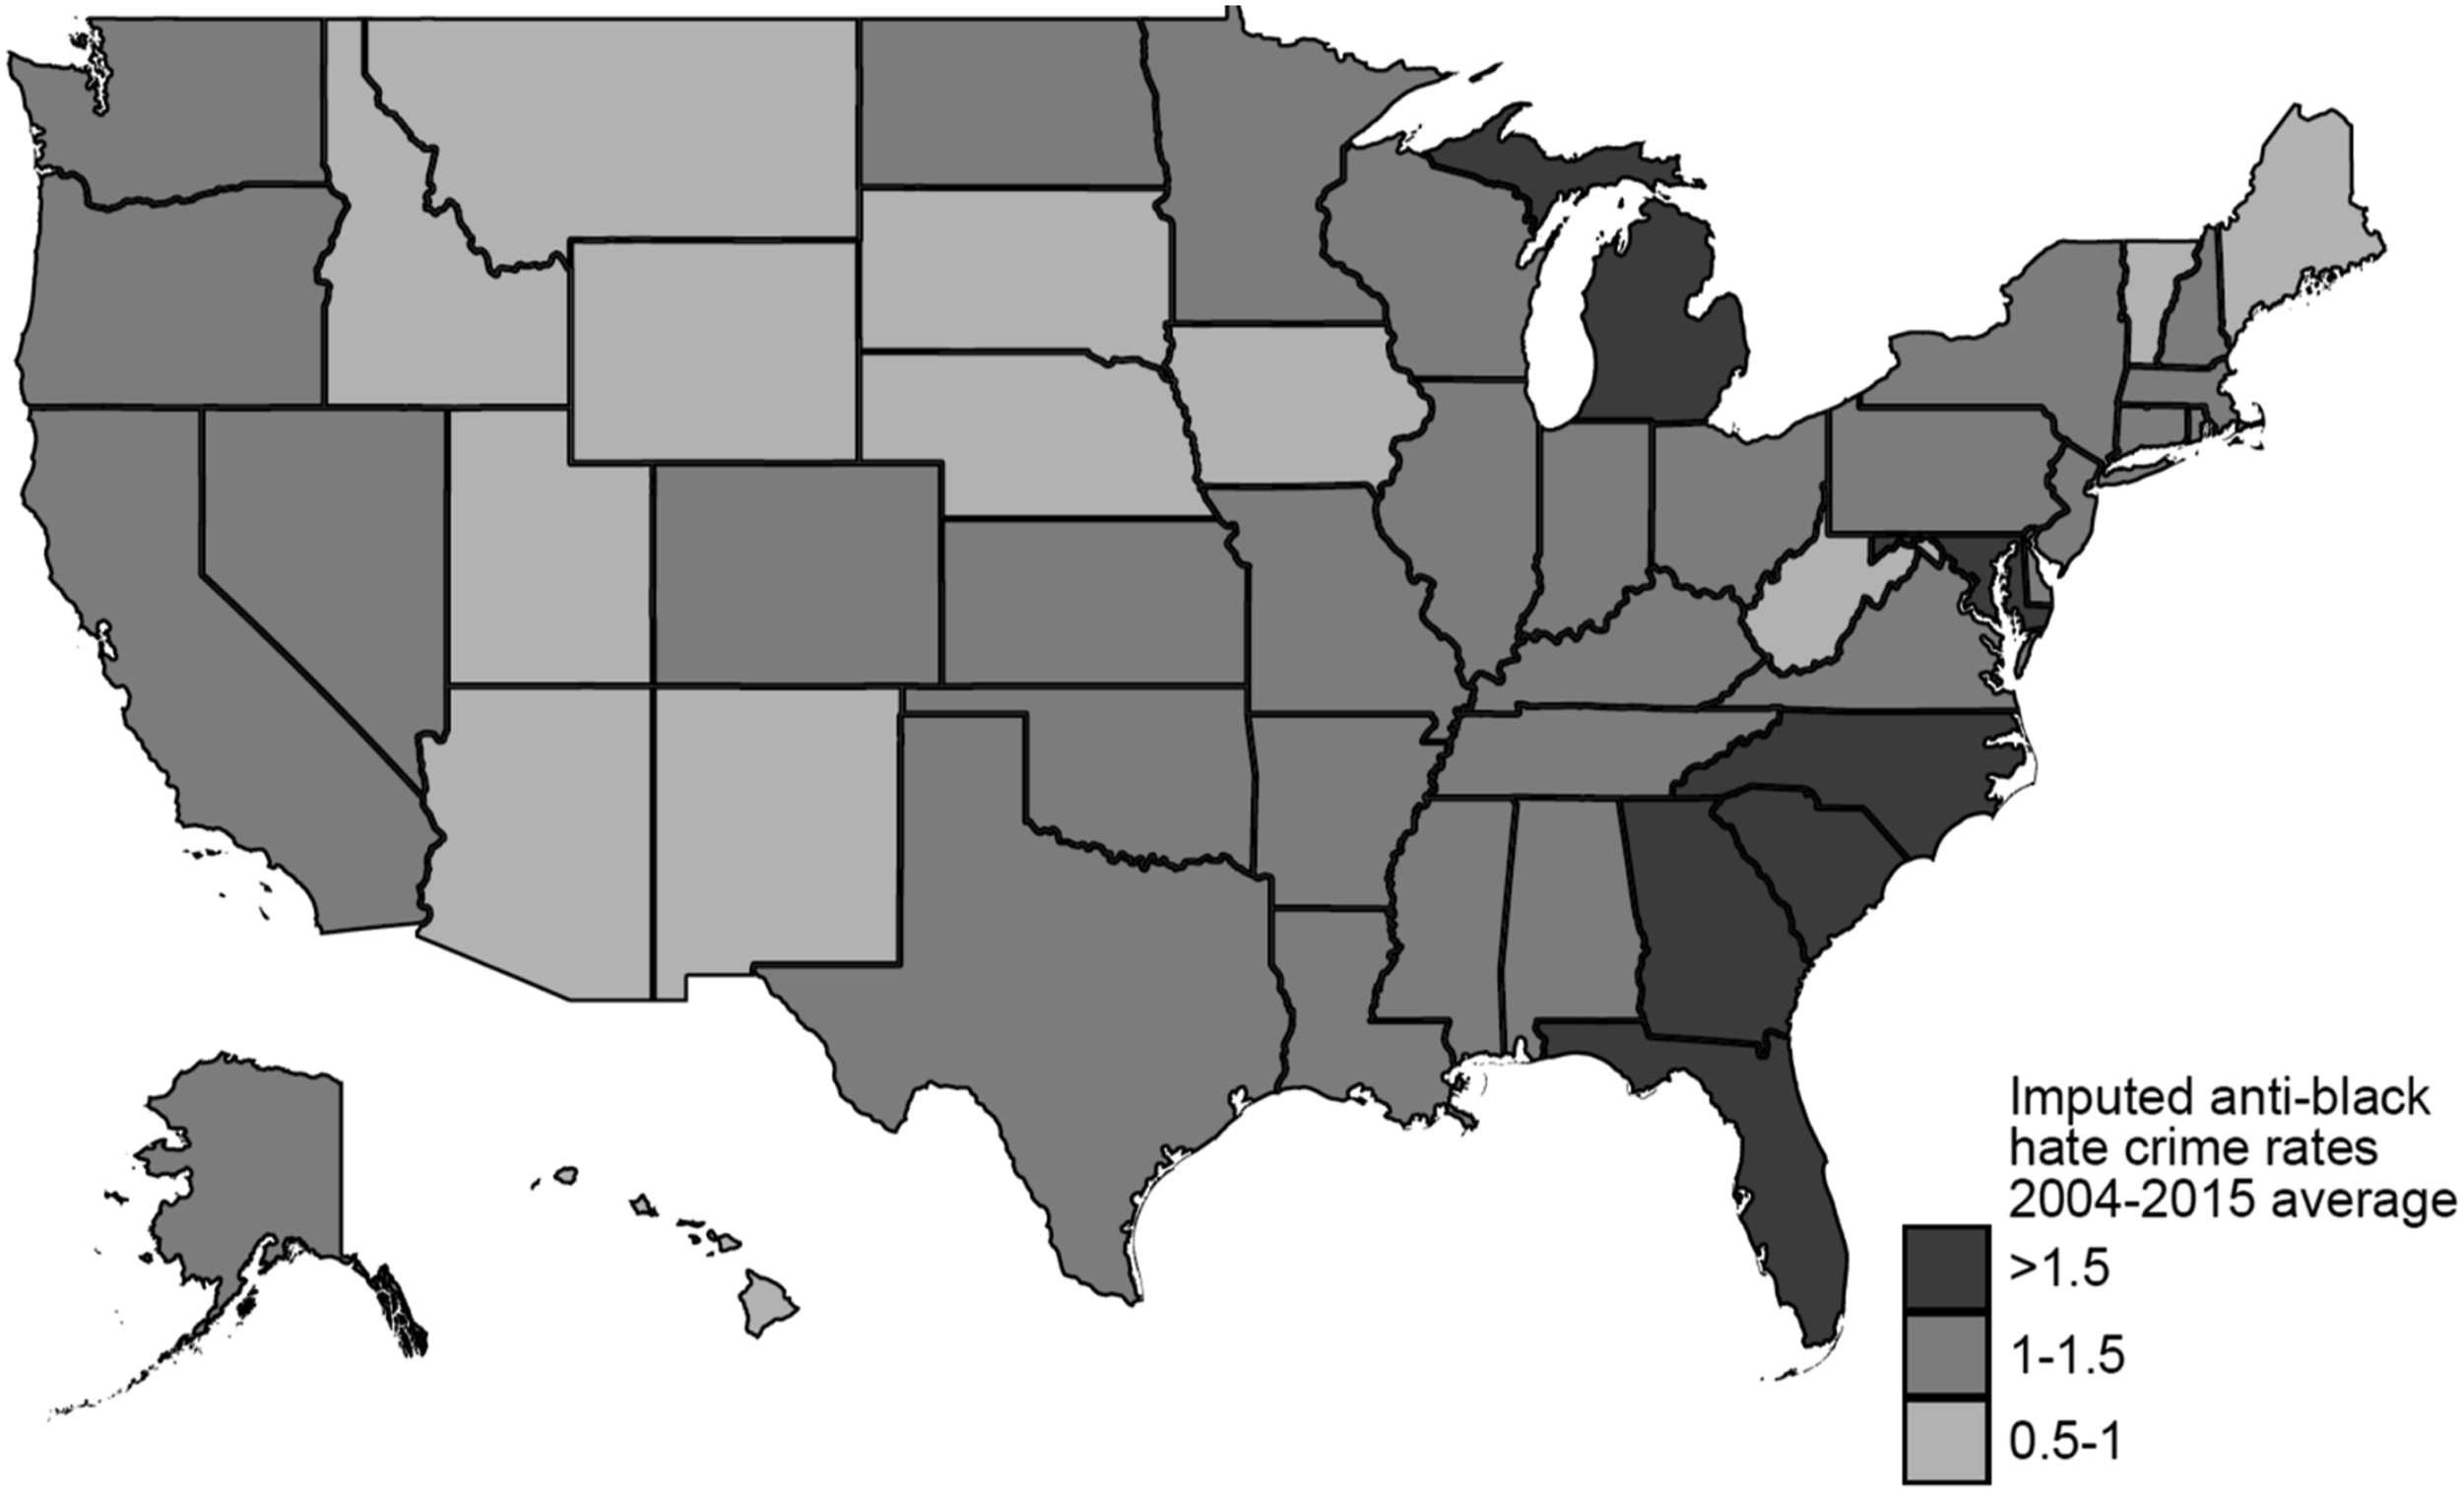
While the Google search variable adds considerably to our model’s predictive power, there remains a substantial component of the variation in the hate crime rate that we cannot explain. Thus, an important caveat to the discussion above is that the state-year-level predictions that we make may involve substantial error. Averaging the predictions over 2004–2015 helps somewhat in this regard, but does not eliminate potential noise in the estimates. Under some circumstances, it is possible that a national-level estimate may involve less error, if the errors in state-level estimates tend to cancel out. For instance, if the state-level errors are state-specific (“idiosyncratic”), then we would expect those errors to be statistically independent of each other, suggesting that a national-level estimate would be more precise. On the other hand, if the state-level errors are positively correlated (“systematic”), perhaps because they reflect national-level shocks, then national-level estimates may involve larger errors than the state-level estimates.
With that caveat, the last row of Table 4 aggregates the number of reported, predicted, and imputed African-American hate crime victims per year across all states (including states for which numbers are not separately reported in Table 4) to compute the aggregate US-wide national-level number of reported, predicted, and imputed African-American hate crime victims per year. As shown in Table 4, the implication is that there are about 1075 imputed unreported hate crimes per year across the United States, a very substantial number in relation to the approximately 2900 reported hate crimes per year. 28
Limitations
Our analysis is constrained by a number of important caveats and limitations. It uses reported hate crimes in some jurisdictions as a benchmark to estimate the rate at which hate crimes would be reported in other jurisdictions. The analysis thus rests on the premise that the benchmark jurisdictions constitute a reasonable comparator for other jurisdictions. In particular, it requires that racial animus translates into hate crimes to a roughly similar degree across states.
One partial check on this is to use the NCVS data based on victim self-reporting (in the publicly-available dataset, only at the national and regional, not state, levels). Using the NCVS data over 2003–2018, we compute that about 26% of African-Americans who report being victims of hate crimes reside in the South, compared to about 38% of the total population in our dataset in 2015. 29 This suggests that actual hate crime victimization, as measured by in the NCVS data, is somewhat lower in the South compared to other regions. Even if this were true, however, it cannot possibly account for the phenomenon of several Southern states’ authorities reporting hate crime numbers of zero or close to zero to the FBI. Even adjusting our estimates of imputed hate crimes downwards to account for putatively lower actual hate crime victimization in the South would leave us with imputed numbers for most Southern states dramatically larger than those reported to the FBI. 30
Moreover, there are reasons to be cautious in interpreting the regional NCVS data. One relates to sampling variability, as the sample size for specific subgroups (such as African-American victims of hate crimes in the South) are quite small in the survey. In addition, some victims of hate crimes may be unwilling to provide details of their experiences even to a survey such as the NCVS, or may themselves not classify or recognize a qualifying experience as a hate crime in terms that fit the survey’s framework. Importantly, the reluctance to report or to understand an experience in hate-related terms may differ across states and regions based on their cultural environment and history. Hate crimes are intended to create or exacerbate a sense of social vulnerability (Waldron, 2012), and often succeed in doing so, possibly to a differential degree across regions. The NCVS employs a two-step process to measure and collect data on sexual assault in recognition of the likelihood that respondents will be reluctant to discuss such events (Department of Justice, 2017a, p. 17). It uses no such protocol for hate crimes, although this may help equalize reporting propensities across regions.
Finally, the wider lesson of the NCVS data is perhaps that the rate at which hate crimes are reported is likely to be substantially lower than the rate at which they occur (Department of Justice, 2017b). In addition, reporting practice in ‘good’ states is far from perfect (Boyd et al., 1996; Grattet and Jenness 2005a, 2005b), suggesting another source of downward bias in our estimates. 31
Our focus has been on Google searches for “n_____” serving as an indicator of racial animus. It is possible that high levels of animus in particular states may lead some residents who are concerned about, or fearful of, hate crimes to use Google to search for possible responses or remedies (perhaps along the lines of “how might hate crimes be prevented?”). While this is possible, it is exceedingly unlikely that such searches would include the racial epithet; thus, searches along those lines will not confound our use of searches for “n_____” as an index of racial animus. In principle, it would be interesting to test whether such “counter-searching” is detectable. However, there are some practical problems. The likely search terms may be fairly diffuse, and may not meet the threshold for detection via the Google Trends app. It is also not clear whether we should expect a positive or negative correlation between such searches and searches for “n_____”; high levels of animus may lead a state’s residents to be more concerned about hate crimes, but a cultural environment with more animus may also be one where hate crimes engender less concern due to their greater social acceptability. Despite these caveats, the prevalence of “counter-searching” would be an interesting topic for future research.
Conclusion
Google search data has been identified as a proxy for otherwise unobservable attitudes on the ground that trends in search rates are correlated with overall attitudinal shifts or differences at the population level. In particular, Stephens-Davidowitz (2014) pioneered the use of Google search rates for “n____” as a measure of racial animus. We extend that approach to a field in which data in respect to an important question of law enforcement and public policy has been of inconsistent quality. We test whether there is a relationship between population-level Google search rates for “n____” in a jurisdiction and rates of reported anti-black hate crimes in the same area (among jurisdictions for which our prior would suggest that state and municipal data collection efforts are more rather than less robust). We demonstrate that these Google search rates add substantial predictive power relative to a model that includes only state-year socioeconomic and demographic characteristics. This relationship can be used to extrapolate beyond the benchmarking sample and thereby impute hate crime rates for jurisdictions that are, by hypothesis, poor reporters. Our estimates, to be clear, are only a lower bound of the expected reported hate crime rate.
There are many other possible applications of this same method, if it is found to be generally reliable. An obvious extension of our work here is to other kinds of hate crimes, or to other offenses that are in expectation under-reported. 32 We can imagine, for instance, extending this method to impute rates of rape or sexual assault. More generally, it is possible that Google search trends can be validated as proxies for other attitudinal and behavioral trends with which the law is concerned. Our contribution here, in short, should be understood to be as much methodological as substantive: It entails the introduction of a new method of empirical research for a legal scholarly audience.
Footnotes
Acknowledgments
We thank the editor (Christoph Engel), two anonymous referees, Nick Stephanopoulos, and workshop participants at the University of Chicago Law School for helpful comments. We also thank Rafeh Qureshi and Bartosz Woda of the Coase-Sandor Institute for Law and Economics at the University of Chicago Law School for their outstanding work in constructing the dataset used in this paper, Ken Schwenke, Scott Klein, and John Keefe for their advice on the hate crime data, and numerous engineers at Google for useful conversations. Dharmapala acknowledges the financial support of the Lee and Brena Freeman Faculty Research Fund at the University of Chicago Law School; Huq acknowledges the Frank J. Cicero Fund. Any remaining errors or omissions are, of course, our own.
Declaration of Conflicting Interests
The author(s) declared no potential conflicts of interest with respect to the research, authorship, and/or publication of this article.
Funding
The author(s) disclosed receipt of the following financial support for the research, authorship, and/or publication of this article: Dharmapala acknowledges the financial support of the Lee and Brena Freeman Faculty Research Fund at the University of Chicago Law School for his general research activities; Huq acknowledges the Frank J. Cicero Fund at the University of Chicago Law School for his general research activities.