
Abstract
One of the key policing innovations of the last three decades has been community-oriented policing. It is particularly important because it is one of the only proactive policing approaches that consistently improves citizen evaluations of the police. At the same time, a series of reviews have concluded that there is not persuasive evidence that community policing reduces crime. In this paper we argue that these conclusions are likely flawed because of what we term crime reporting sensitivity (CRS) bias. CRS bias occurs because community policing leads to more cooperation with the police and subsequently increased crime reporting. Such increased crime reporting bias adjusts crime prevention outcomes of community policing downward. We illustrate this process by reanalyzing data from the Brooklyn Park ACT Experiment (Weisburd et al., 2021). We begin by showing the specific crime categories that contribute most to CRS bias. We then use a difference-in-differences panel regression approach to assess whether the experimental intervention in Brooklyn Park led to significant CRS bias. Finally, we use bounded estimates from the Brooklyn Park Experiment to adjust meta-analytic results from prior community policing studies to examine whether the conclusion that community policing does not impact on crime would need to be revisited if CRS bias was accounted for. We find that adjusted estimates tell a very different, more positive, story about community policing, suggesting that future studies should recognize and adjust for CRS bias, or identify other measures not influenced by this mechanism.
Introduction
The conclusions that have been reached so far in scientific assessments of community policing’s ability to prevent crime are not optimistic. Gill et al. (2014), in a systematic review that covered studies until 2012 and included 37 studies in a meta-analysis, noted that “we do not find evidence that COP reduces … officially recorded crime” (p. 423). In a more recent review, the National Academies of Sciences (NAS) Committee on Proactive Policing (Weisburd & Majmundar, 2018) concluded that “existing studies do not identify a consistent crime prevention benefit for community-oriented policing programs” (p. 176). These reviews have had a major impact on how we view the crime prevention benefits of community policing programs. In sum, they have led to the prevailing assumption that community policing does not reduce crime.
However, it is important to note that the same reviews also concluded that community policing significantly improves community members’ satisfaction with the police and positively influences their perceptions of police legitimacy. Gill et al. (2014) conclude that “the results of this systematic review of community-oriented policing (COP) strategies provide robust evidence that community policing increases satisfaction with police, elements of police legitimacy, and citizen perceptions of disorder” (p. 423). The NAS report comes to a similar conclusion, though it is more hesitant about the strength of the evidence. The report concluded that, “overall, community-oriented policing programs show a tendency to increase citizen satisfaction and have positive but weaker effects on perceptions of police legitimacy” (Weisburd & Majmundar, 2018, p. 224).
Our paper builds on findings from a randomized controlled trial of increased police-community collaboration in Brooklyn Park, Minnesota (Weisburd et al., 2021), which suggested that the positive effects of community policing interventions on community members’ perceptions of the police may lead to what the authors defined as “crime reporting inflation.” They argued that the crime prevention benefits of community policing are likely confounded by its impacts on crime reporting. In this context, the main measures that researchers use to estimate crime outcomes (i.e., calls for service and crime incidents) are impacted not only by the actual prevalence of crime, but also by the fact that community policing is likely to increase collaboration between the public and the police—indeed, that is one of the expressed goals of community policing programs. This increased collaboration, as well as increased trust in and satisfaction with the police, may increase the likelihood that community members will report problems in their neighborhood to the police, producing a statistical artifact in the data.
This idea has been suggested previously by researchers, though it was not formally defined in an experimental trial until Brooklyn Park. For example, in a community-based program to reduce burglaries in Portland, Oregon, Schneider (1976) observed a striking inconsistency between official data on crime and victimization surveys in the same areas: During the three years beginning in 1971 and ending in mid-1974, official crime data in Portland indicated that the residential burglary rate had climbed from fifty per 1000 households to fifty-six per 1000 households. In contrast, data from the two surveys for the same period indicate that the rate actually declined from 151 per 1000 households to (at least) 127 per 1000. In addition, the proportion of surveyed burglary victims who said that they reported the incidents to the police increased from 50% in the first time period to 70% by the time the second survey was taken. (p. 136)
Accordingly, this community policing program, like the program reported on by Weisburd et al. (2021), observed an increase in crime reporting, at least for burglaries.
A similar observation has been made in a recent study in Libya in which rural communities were randomly assigned to receive “confidence patrols” from the Libyan National Police (Blair et al., 2019). The patrols included 10–12 officers who carried out recurring visits to these communities, during which they conducted “forms of engagement often associated with community policing” (Blair et al., 2019, p. 645) such as holding town hall meetings, distributing informational posters, and conducting foot patrols to interact with community members. The experiment found a significant increase in the reporting of crimes in the communities that received the confidence patrols intervention. This phenomenon was also identified in an experimental field trial in the United States involving the implementation of problem-oriented policing, which often involves collaboration with the community (Taylor et al., 2011). More generally, Thomas Feltes, a community policing scholar in Germany, observed that community policing was likely to lead to increased crime reporting (Feltes, 2013; see also Feltes, 2002).
While these studies support the principle of crime inflation as defined by Weisburd et al. (2021), it is important to note that we could not identify any studies that sought to provide a fuller understanding of what may be driving observed “crime inflation” or that tried to understand its impacts on assessments of community policing’s impacts on crime. As the NAS report on proactive policing observed, “there is little empirical research that explicitly examines the causal linkage between community-oriented policing and crime reporting” (Weisburd & Majmundar, 2018, p. 221).
Below we describe the Brooklyn Park study and findings, and its initial identification of crime reporting inflation. We then present additional analyses of data from the Brooklyn Park experiment in which we sought to identify the underlying mechanisms that contributed to its findings. Our analyses lead us to redefine this phenomenon as “crime reporting sensitivity” (CRS) rather than “inflation” because the data suggest a greater willingness to report crime to the police rather than changes in crime per se. 1 We then develop statistical models to assess whether CRS is observed in the Brooklyn Park data. Finally, we suggest a method for correcting crime outcomes in earlier studies based on our analyses and illustrate how it might impact our interpretation of the overall impacts of community policing on crime. Simply stated, when studies are adjusted for CRS, community policing leads to significant reductions in crime incidents.
The Brooklyn Park Experiment
The Brooklyn Park experiment had a strong focus on community collaboration—a key component of community policing—as a way to advance crime control. It sought to use unallocated police patrol time to increase collective action and community collaboration in solving problems at crime hot spots (Weisburd et al., 2015). The program was called Assets Coming Together to Take Action (ACT): ACT was intended to work through officers encouraging three key mechanisms at the hot spots: (1) establishing proximal relationships with and between residents; (2) increasing working trust between the police and community members; and (3) developing shared expectations that empower residents to take action against problems and then leveraging these mechanisms to…develop successful collaborative problem-solving strategies. (Weisburd et al., 2021, p. 6)
The intervention involved the entire patrol force in Brooklyn Park (a city with more than 100 sworn officers) and focused on 21 treatment hot spots, with an equal number of randomly assigned control hot spots. Brooklyn Park is a suburban city located immediately north-west of Minneapolis, Minnesota. The city is home to almost 79,000 residents and covers an area of 26 square miles. Almost 30% of residents are under the age of 18, and around 11% are below the poverty level. In 2016, nearly 22% of residents were foreign-born, just over half were non-White, and 28% spoke a language other than English at home.
The intervention was carried out for 16 months, from July 2015 to October 2016. The program evidenced strong treatment integrity with more than 1000 activities documented during the experimental period. Perhaps most importantly, from the perspective of community collaboration, the officers identified 405 “assets” at the hot spots, with a median of 18 assets at each hot spot. Assets were key stakeholders in the community whom officers identified during their time spent at the hot spots, who were willing to work with police officers to address problems.
Experimental analyses showed that the police did succeed at increasing community collaboration and collective action in doing something about problems (Weisburd et al., 2021). In a survey of a random sample of community members at the hot spots, a significantly larger number of respondents in the treatment hot spots said that they had participated in problem-solving efforts during the experimental period. And when they were asked whether they had spoken to a police officer about a problem, again a significantly larger number of residents of the treatment hot spots responded affirmatively. These results suggest that ACT was successful in increasing community collaboration.
However, consistent with similar community policing-type studies, when Weisburd et al. (2021) looked at the crime outcomes of ACT they did not find evidence of crime prevention benefits. Importantly, Weisburd et al. (2021) measured crime using a common metric—officially-reported crime incidents—which include events for which a crime report is written by police. To a lesser extent, some studies evaluate crime outcomes using citizen calls to the police. Both of these measures are proxies for the real level of crime which is unknown. In the Brooklyn Park experiment, the treatment and control hot spots had about the same change in crime incidents (i.e., Part I and Part II crimes for which a police crime report is written) from the pre-treatment to during-treatment periods. Given the increase in collaboration and cooperation with the police, what happened?
Assets Who Called the Police From July 1, 2015, Through October 31, 2016 (Retrieved From Weisburd et al., 2021).
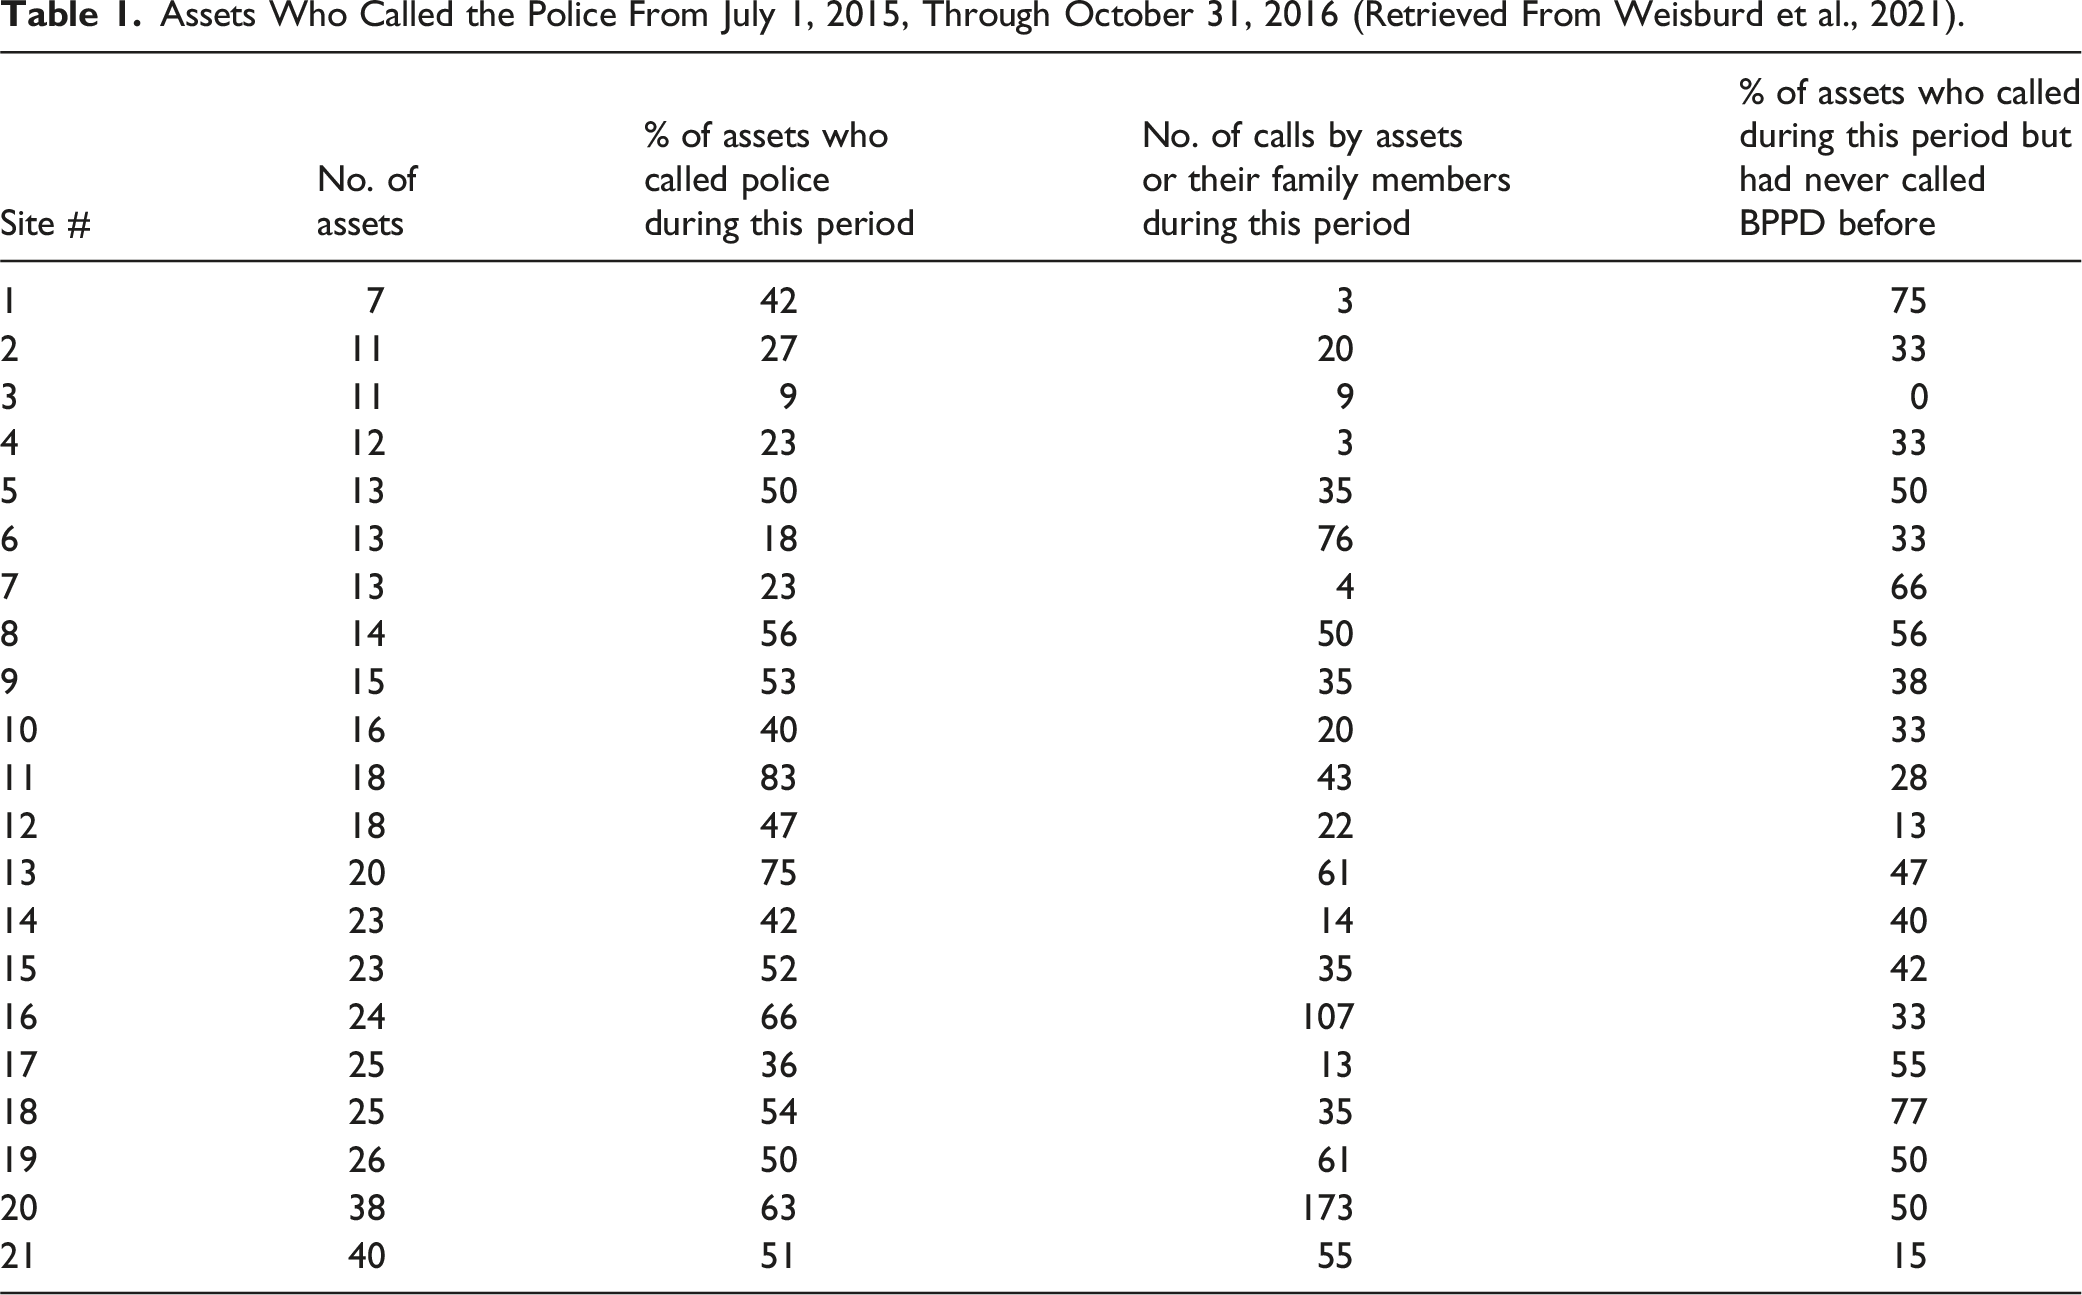
These findings led Weisburd et al. (2021) to coin the term “crime reporting inflation,” suggesting that the community collaboration component of the program increased crime reporting by community members in the treatment hot spots. The researchers tried to measure the extent of the increase by comparing the number of community-initiated CFS to crime incidents before the experiment and during the experiment
If the experimental period and the pre-experimental period were equal in length we would expect the outcome of this measure to be 1. However, the experimental period was 16 months and the pre-experimental period was 12 months. This meant that, absent treatment, Weisburd et al. (2021) expected the crime reporting inflation statistic to equal 1.33 (16/12), accounting for the fact that the gap between CFS and incidents was counted for an additional four months during the experimental period. For the untreated control hot spots, the inflation statistic equaled 1.27, about what was expected. However, for the treatment hot spots that received the ACT intervention, the inflation statistic was 1.67. The difference between the groups was statistically significant (p < .05). Weisburd et al. (2021) believed this reflected crime reporting inflation in the treatment hot spots.
Weisburd et al. (2021) speculated on what this finding meant in terms of the program’s impacts on crime. Would conclusions regarding the crime prevention impacts of ACT change if they could adjust the crime counts for crime reporting inflation? They attempted to calculate this by adjusting the crime incident outcomes in the experimental condition by the overall crime reporting inflation ratio across the two groups (1.27/1.67). When they did this their findings regarding crime were quite different. The difference between the groups was then statistically significant at the .10 alpha level (p = .055), the threshold set at the outset of the experiment.
What are the Mechanisms Underlying Crime Reporting Sensitivity Bias in Brooklyn Park?
Counts of Calls for Service and Crime Incidents Before and During the Treatment by Assignment and Difference in Differences.
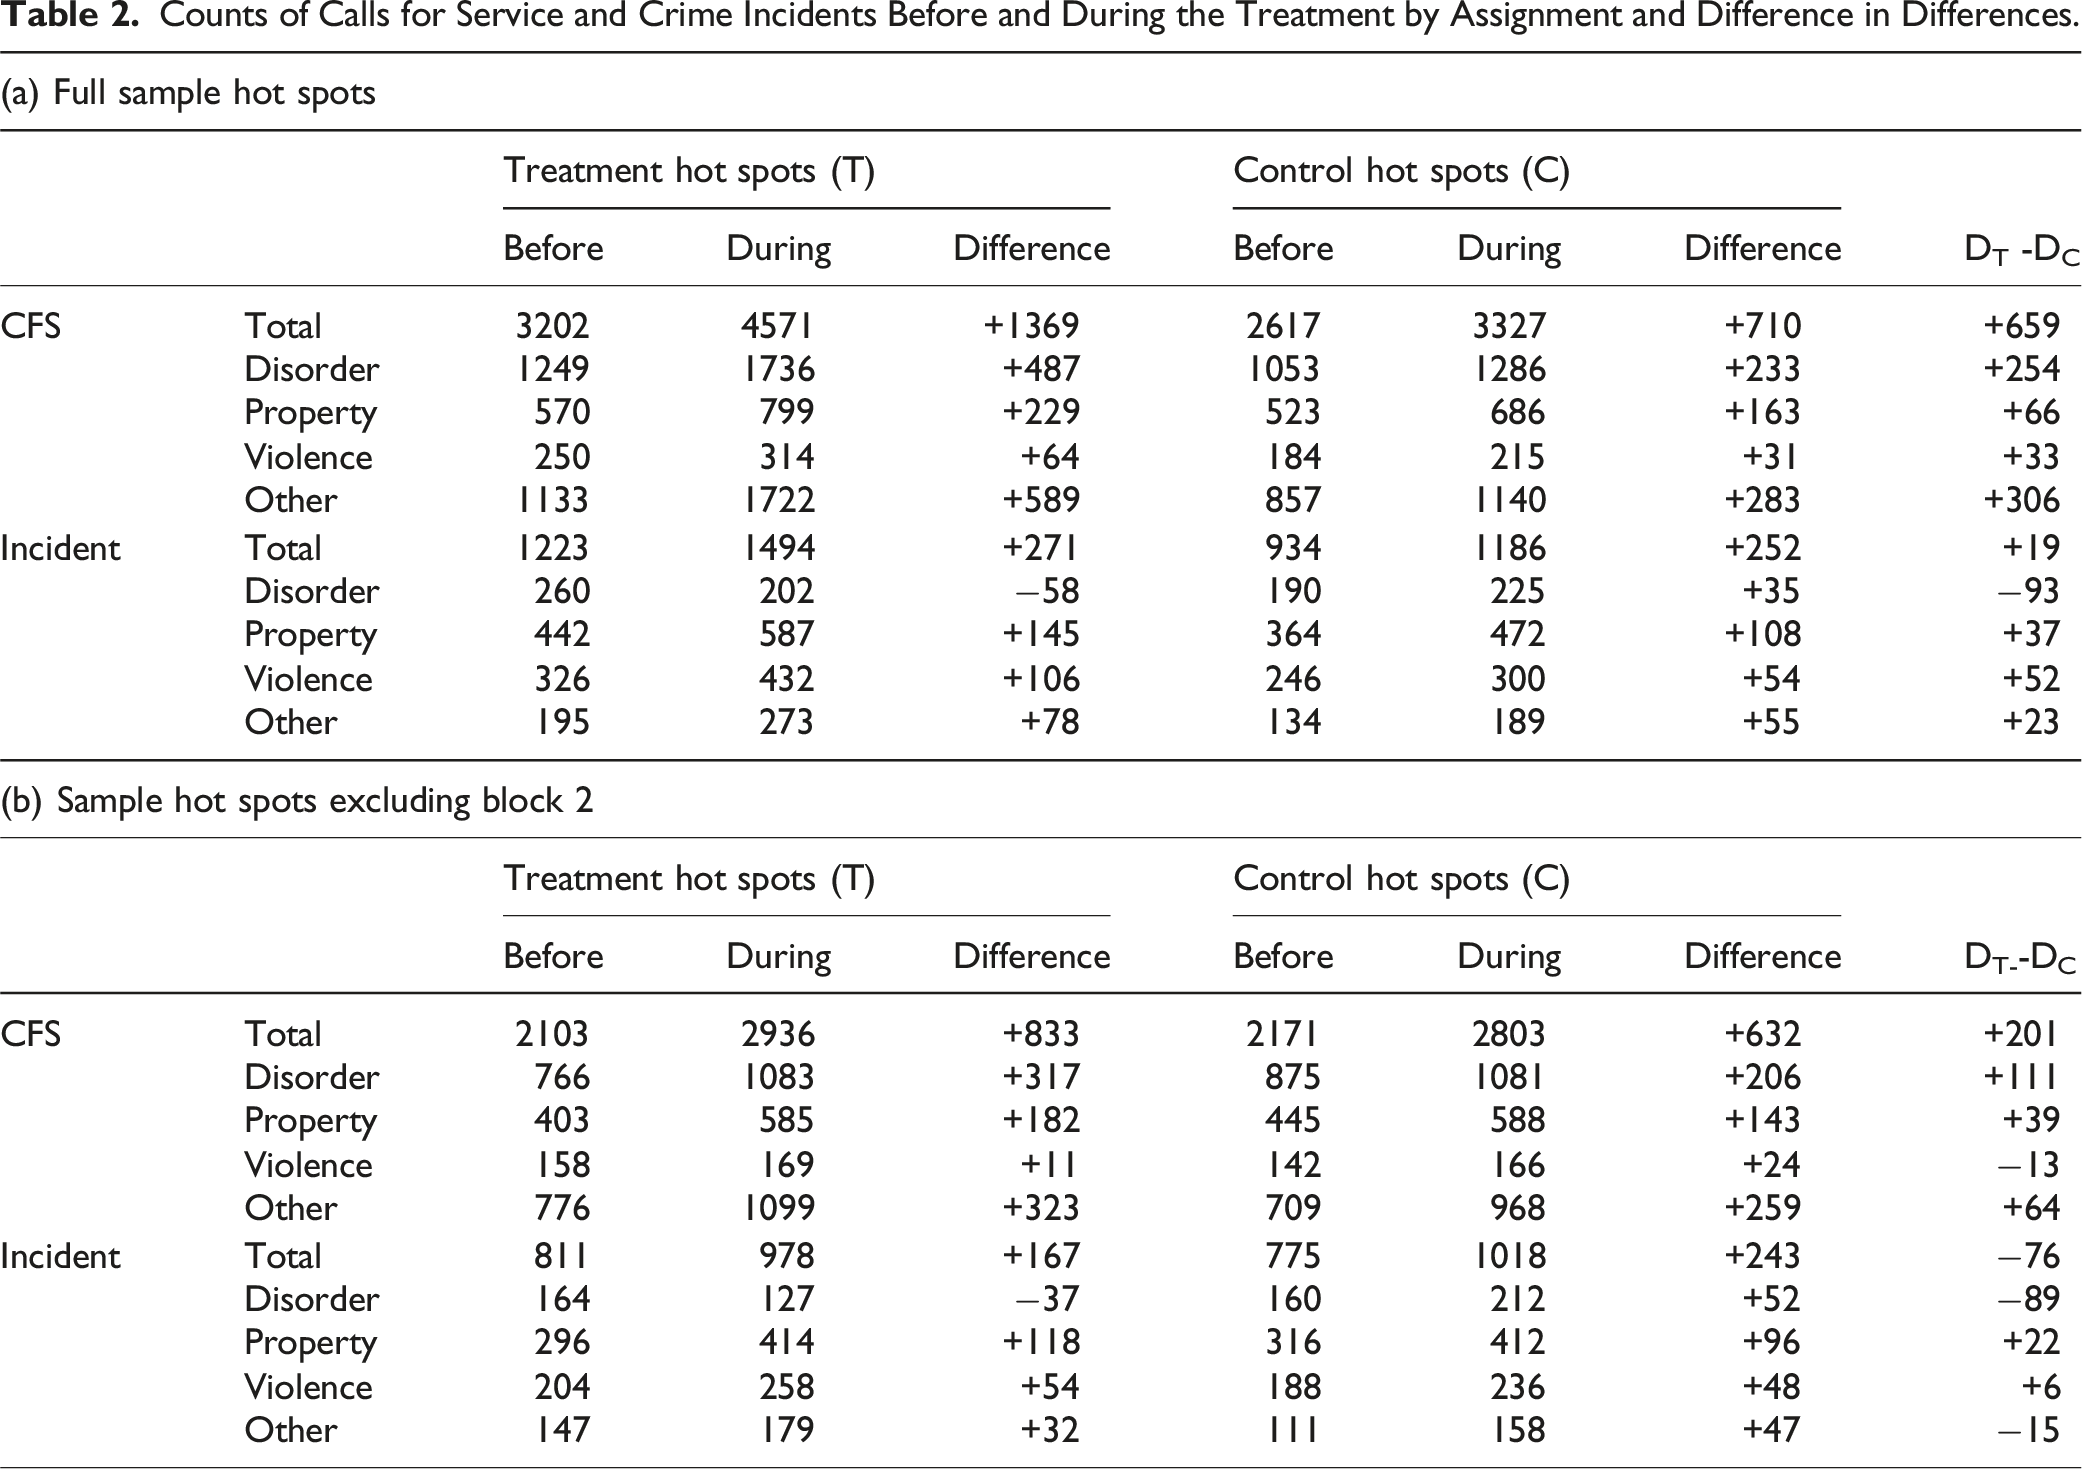
We first calculate the absolute difference in crime calls and incidents between the pre-intervention and intervention periods for the treatment and control conditions for five main crime categories. We then subtract these two differences to gain a general sense of which crime categories are contributing most to the bias that the experimental treatment is introducing to crime reporting. Note that in this table and in subsequent analyses we report the outcomes with and without “block 2,” which comprises a matched pair of treatment and control hot spots with extremely large crime number counts. The original experiment involved a block-randomized design with treatment and control hot spots assigned to one of five statistical blocks.
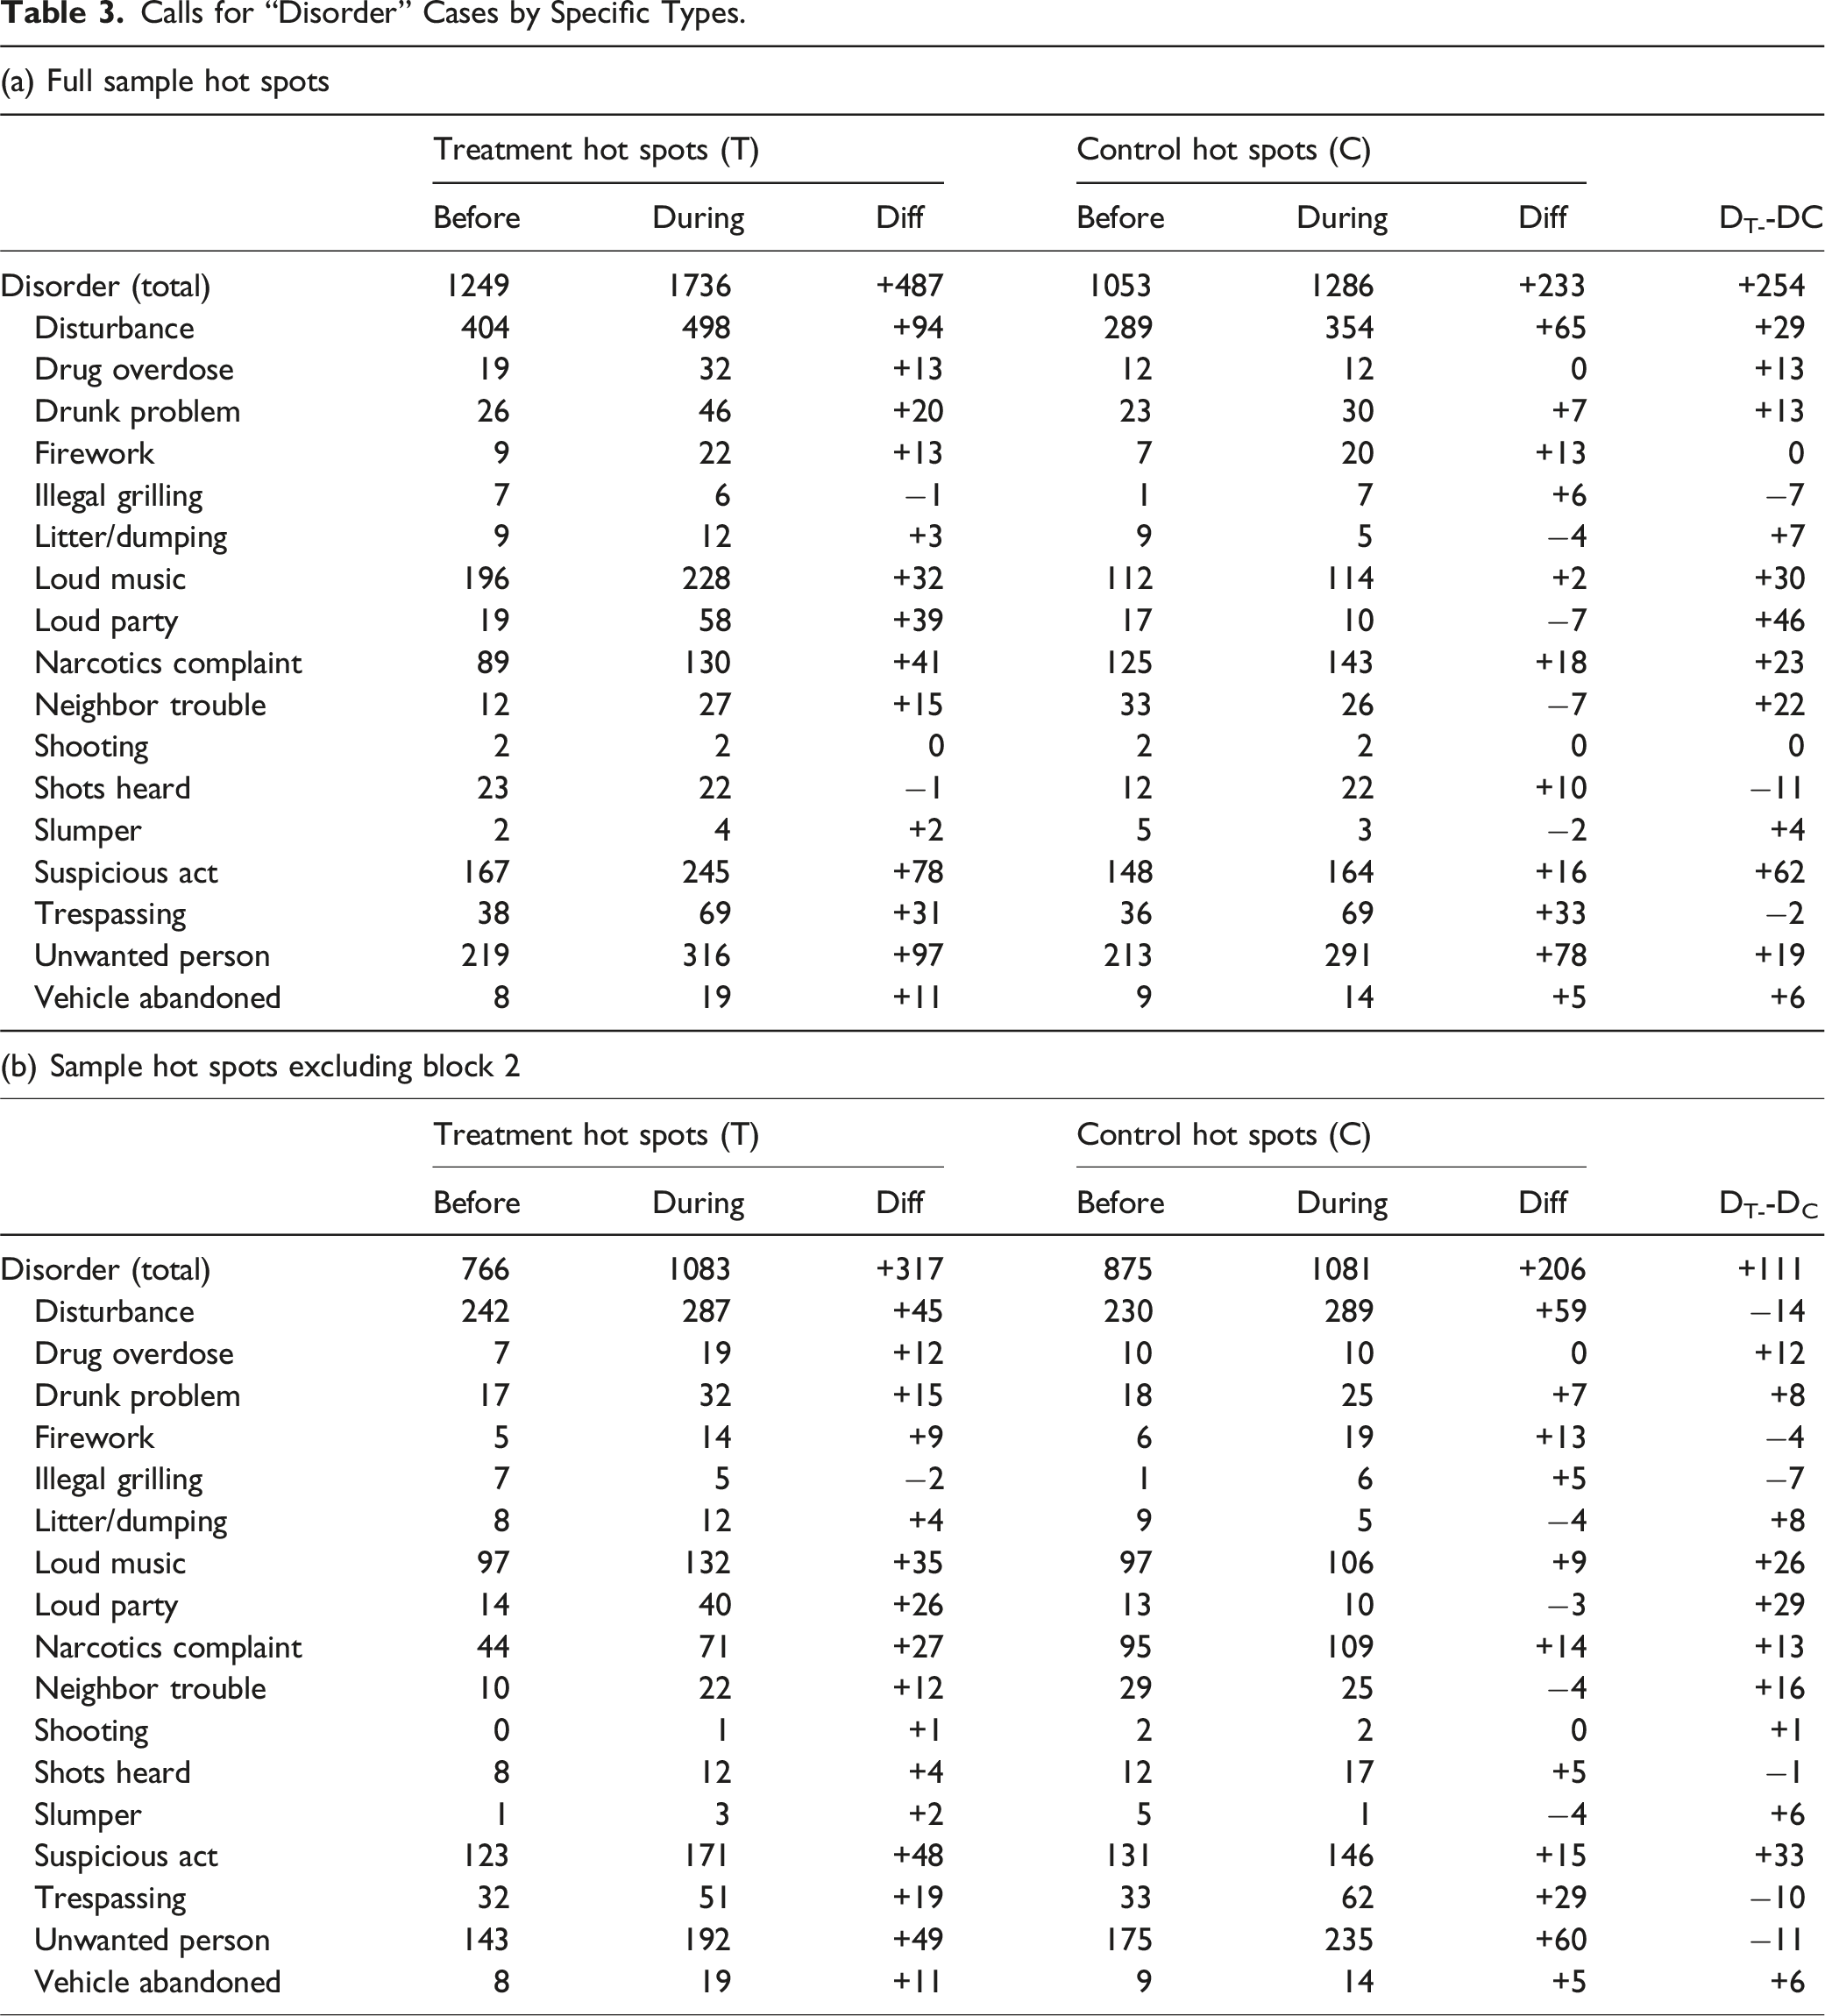
Calls for “Disorder” Cases by Specific Types.
Calls for “Other” Cases by Specific Types.
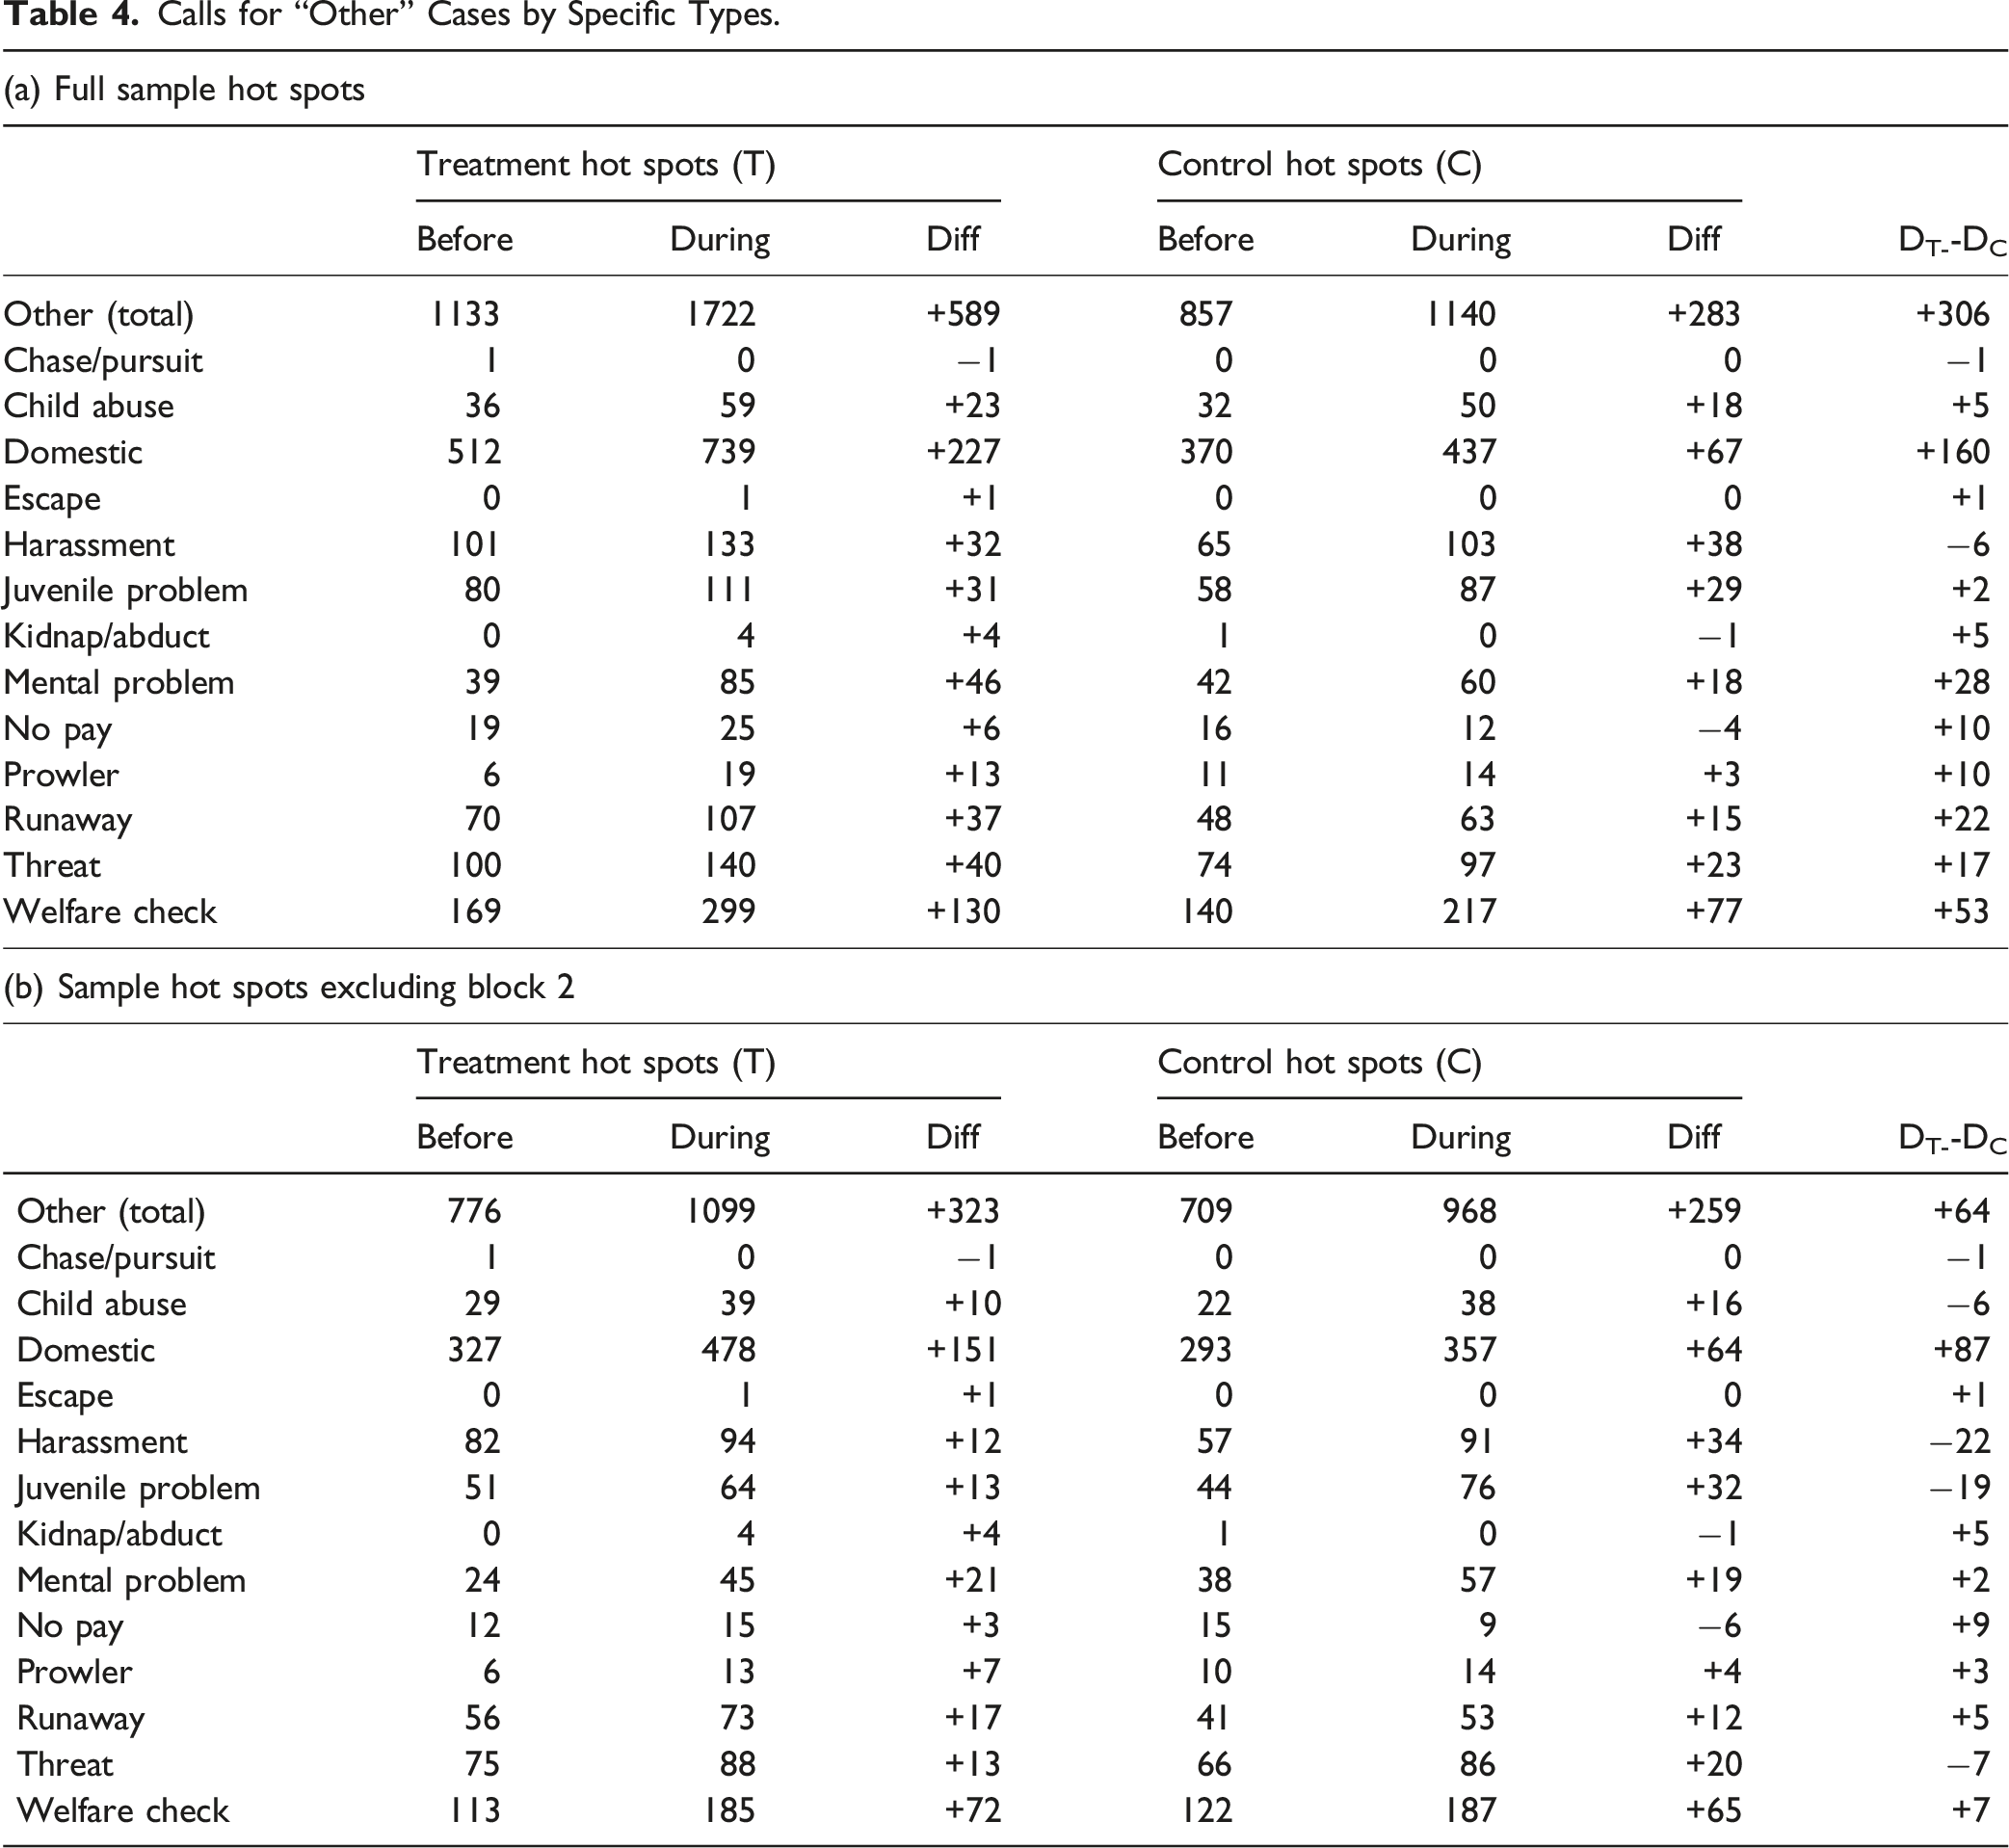
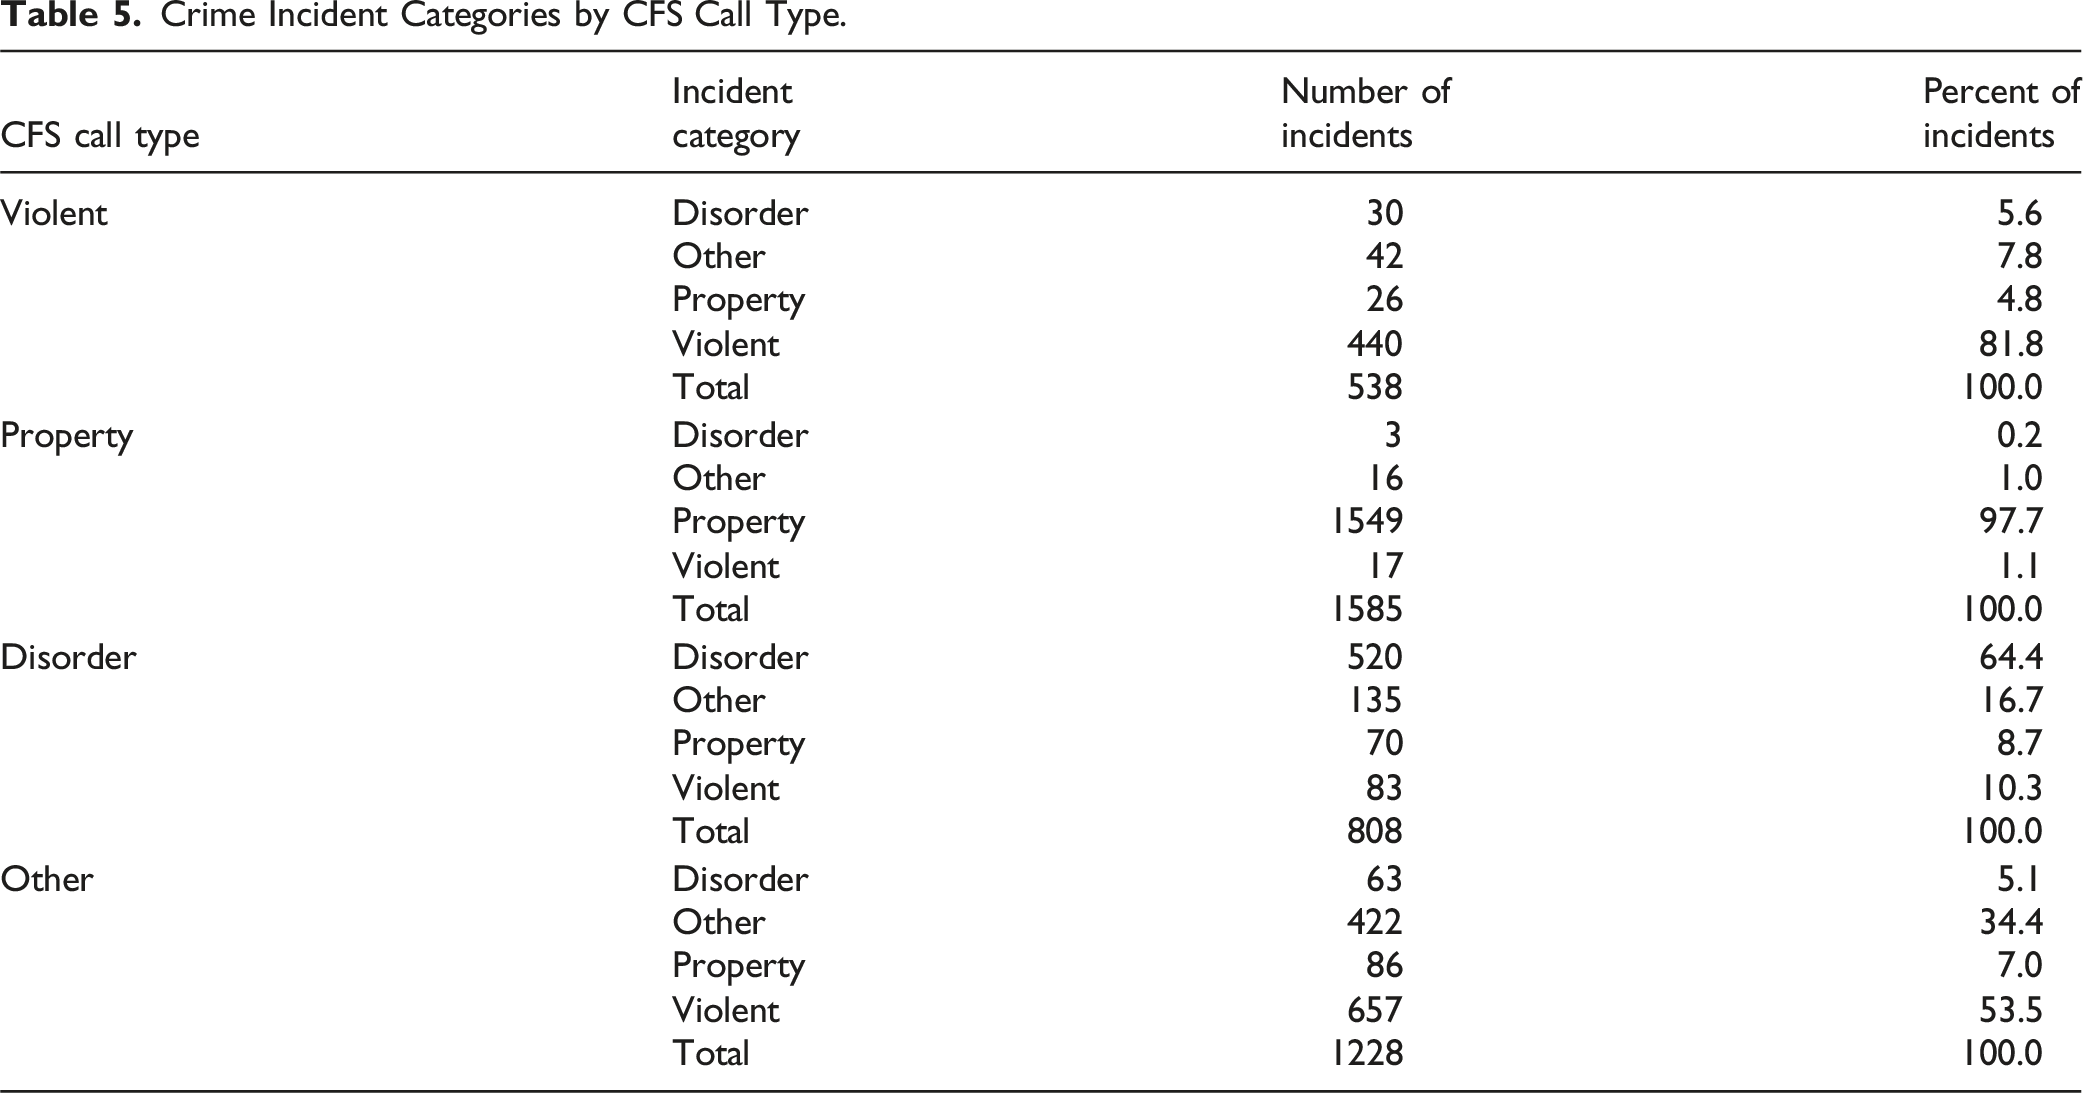
This suggests that the “crime reporting inflation” identified by Weisburd et al. (2021) is primarily driven by an increase in disorder and other calls; that is, those most likely to be sensitive to increases in willingness to report a crime to the police. To look at this more carefully, we divided crime and disorder calls into specific categories. In the case of disorder calls, there is a general spread across the categories (Table 3), suggesting that calls relating to a variety of disorder issues increased in the treatment hot spots. However, in the other crimes category, domestic crimes are generating most of the relative increase (Table 4).
Figure 1 presents a visualization of a plausible mechanism for the crime reporting sensitivity. Working backward, the figure shows that crime incidents recorded by the police are the result of both community-initiated CFS and police-initiated activities. We also assume that calls for service depend on community members’ willingness to report a crime. Furthermore, we assume that actual crime reports are influenced by both police-initiated activity and community members’ willingness to report. Police-initiated activities are both responsive to crime and may help deter or suppress it. Similarly, community members’ willingness to report can have a deterrent effect on crime as well. Thus, we hypothesize reciprocal relationships between crime and police-initiated behavior as well as crime and willingness to report. Theoretical model of crime reporting sensitivity.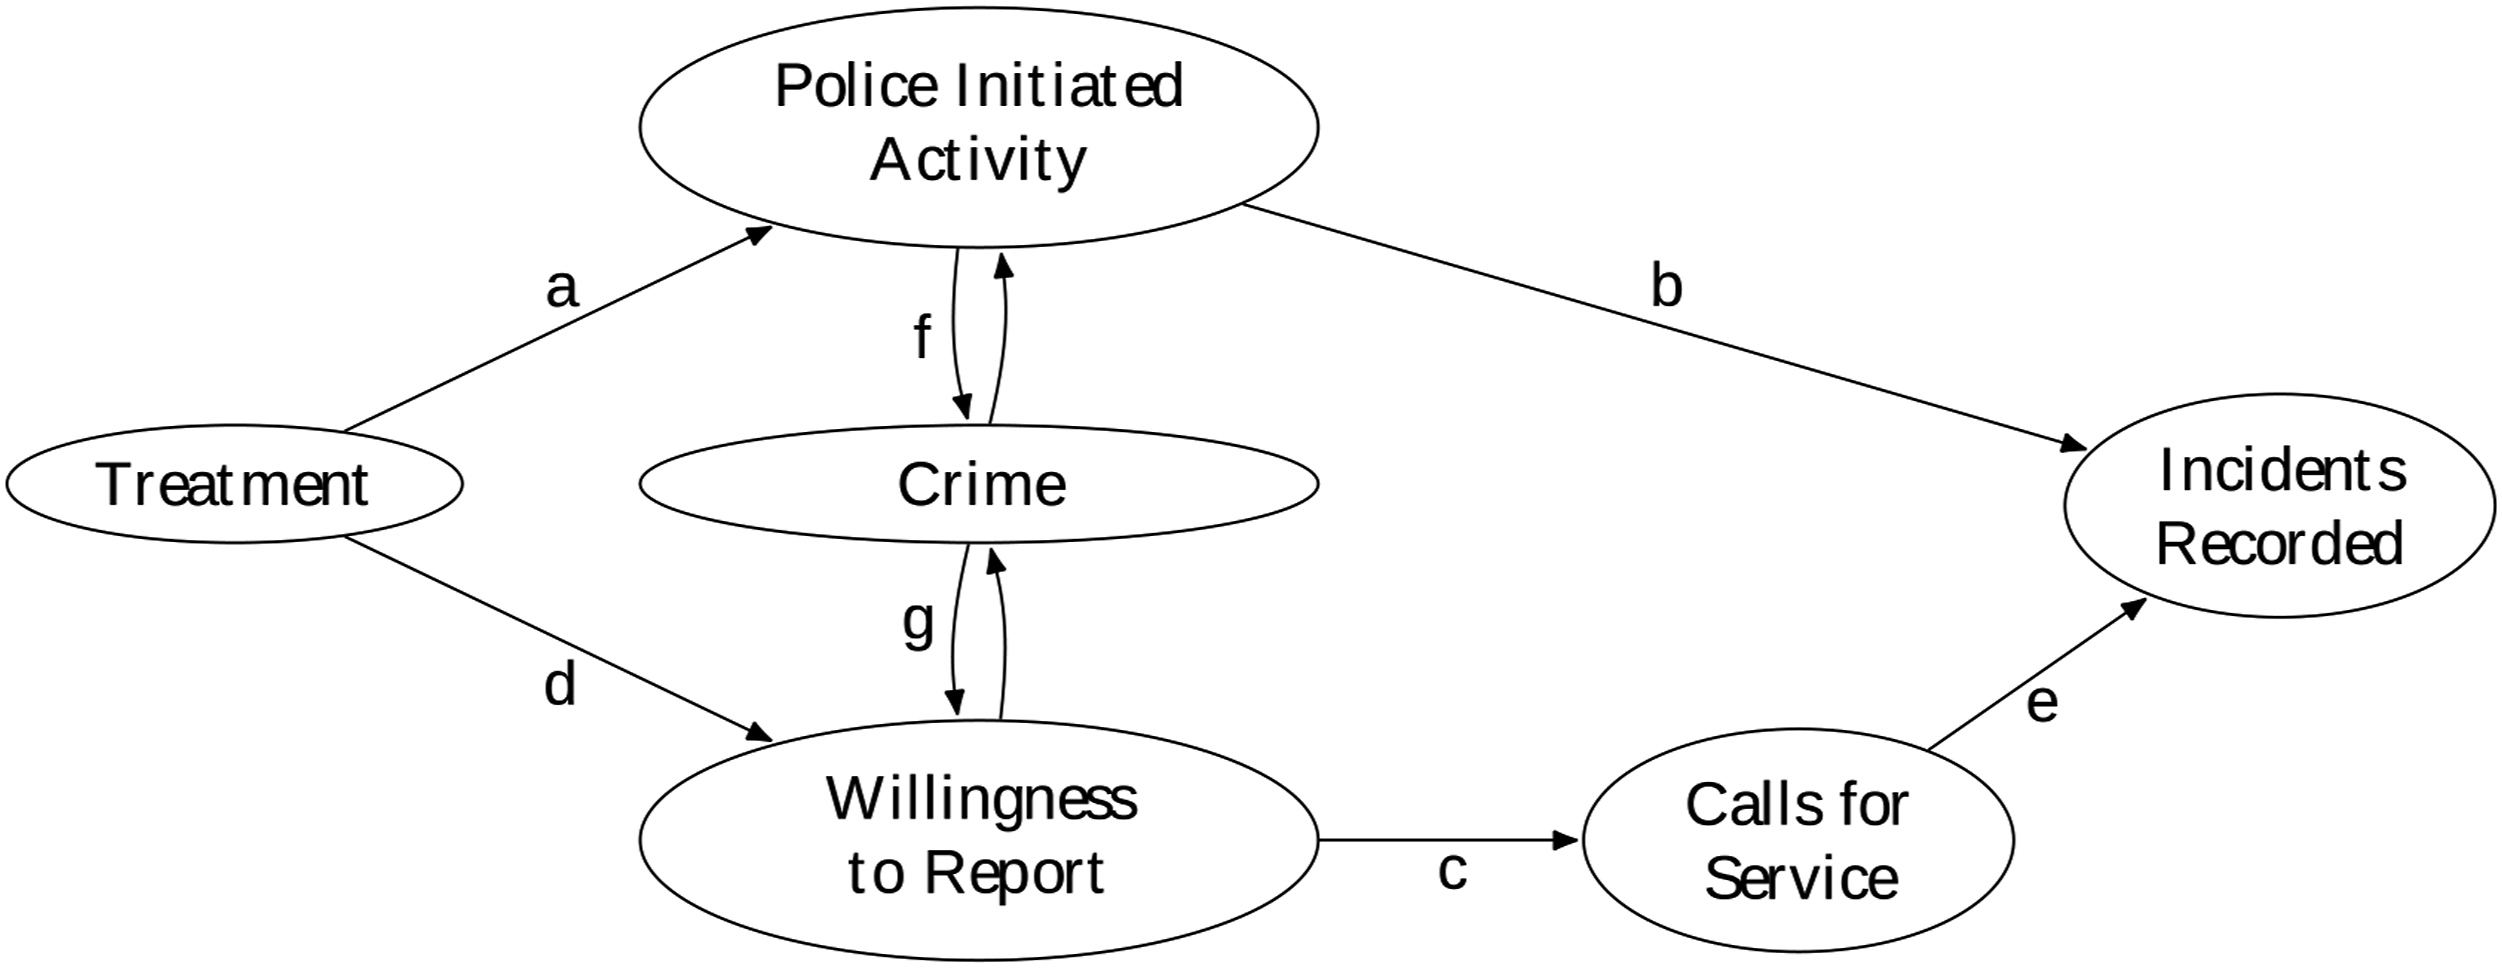
The ACT program was designed to increase police activity in the treatment hot spots. We hypothesize that this has competing effects by both deterring crime and increasing the detection of crime through increased police presence. However, based on consistent findings of a crime suppression effect of hot spot policing (see Braga et al., 2019; Braga & Weisburd, 2022 for an updated systematic review of the evidence), we hypothesize that the overall effect of the increased police-initiated activities would be negative; that is, it decreases crime and hence the number of recorded incidents. The ACT program also explicitly engaged community members as assets in helping to solve community problems related to crime. These efforts on the part of the police to build trust and relationships with the community should increase willingness to report and appear to have had such an effect in Brooklyn Park, as shown in Table 1. Thus, we hypothesize that the treatment increased the ratio of incidents that resulted from community-initiated CFS versus police-initiated activities. We think it important to note that this could also lead to decreased reporting of crime in circumstances in which trust and cooperation in the police are declining. After high-visibility events that show the police using extreme violence against community members, for example, there is evidence of decreases in reporting of crimes to the police (Desmond et al., 2016; Ang et al., 2021).
Unfortunately, in Brooklyn Park we only observed the treatment, CFS, and incident portions of this model—actual crime is unobserved (as it is in most outcome studies). However, we believe that a treatment-induced change in the ratio of the number of CFS (paths c and d) to the number of incidents (paths a and b) is indicative of crime reporting sensitivity (CRS) bias. To fully assess the model, we would need measures of the actual crime level, the community’s willingness to report, and changes in police-initiated behavior.
Additionally, as we have seen above, some crime types are more sensitive to this effect than others. Our analyses suggest that what Weisburd et al. (2021) termed “crime reporting inflation” can be linked to two crime categories, both of which are likely influenced by community members being more willing to report crime to the police, rather than any objective changes in crime itself. Because of this we prefer the term “crime reporting sensitivity” (CRS) which more appropriately describes our assumptions regarding the causes of the increases in crime reporting by the community.
With respect to disorder, we might speculate that the collaboration and trust built between the police and the public in the treatment sites led community members to be more willing to report problems like litter, loud noise, public intoxication, and disorderly conduct. Under “normal conditions” people might not have reported these events but, in the context of an intervention that sought to both build trust between the police and the community and encourage residents to contact the police about problems on their street, it is reasonable to assume that people might be more likely to call about these problems. In contrast, calls for violent crime and property crime changed little as a result of the intervention. We might postulate that people are very likely to report such crimes to the police under normal conditions because of severity in the case of violent crime and possible insurance implications in the case of property crime.
We think that the increased CRS in the ‘other’ category reflects a second but similar change in willingness to report. Domestic and family crimes, and especially intimate partner violence, have traditionally been underreported despite the fact that these are often serious crimes (Morgan & Truman, 2020; Reaves, 2017). However, if community members have developed increased collaboration with and trust in the police as a result of police-community engagement efforts, they may be more likely to report such crimes if they experience them or are aware of a neighbor who may be experiencing them. In this case the increased collaboration with and trust in the police leads to the reporting of serious, rather than less serious, crimes that ordinarily would have gone unreported.
Crime Incident Categories by CFS Call Type.
Reanalyzing the Brooklyn Park Data
If we are correct in our proposition that the intervention is increasing sensitivity of crime reporting irrespective of the actual number of crimes, what we term CRS bias, we first need to assess whether there is evidence of such increased sensitivity. Once that is established, the next step is to develop measures that allow for corrections in estimating crime incidents, as we discuss below.
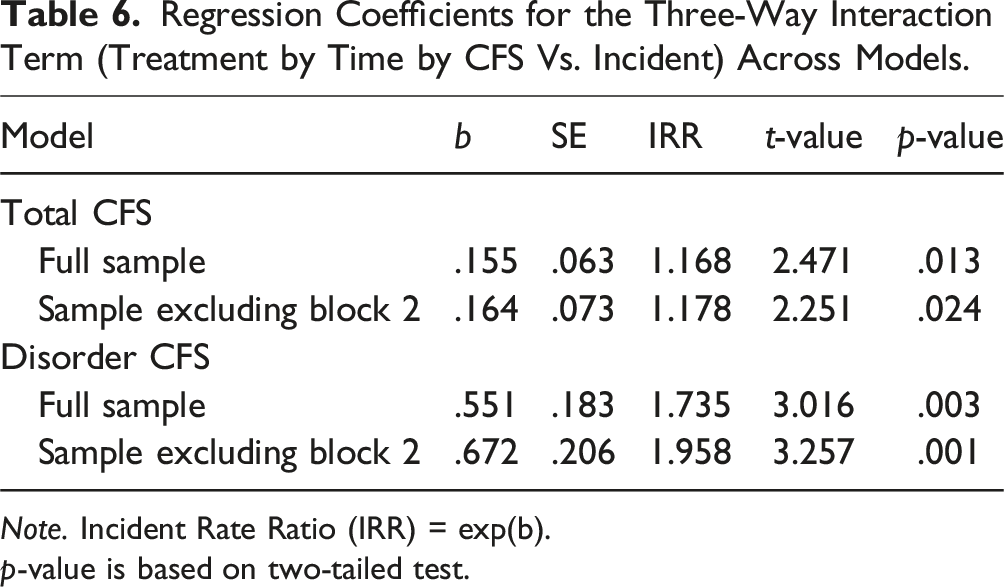
Accordingly, our goal in the following analyses is to model whether calls for service (CFS) and reported crime incidents (INC) are differentially impacted by the treatment. In order to increase the statistical power of the analyses, we do this at the monthly level rather than averaging CFS and INC counts across the entire period, as was the approach of Weisburd et al. (2021). We also model both CFS and INC in the same model so that we can explicitly test for a differential effect on these two outcomes. Thus, the effect of interest is the three-way interaction between treatment versus control, before versus during, and INC versus CFS. This model is a difference-in-difference-in-differences on panel data. The model includes fixed effects for the month of the year to account for seasonal crime effects. We also have fixed effects for the randomization blocks (5 such blocks). The number of treatment and control sites is balanced within each block, and as such, these fixed effects are exogenous to the treatment effects of interest.
We used a quasi-Poisson model to estimate our models as it is designed for over-dispersed count data. Note that count-based models such as the quasi-Poisson use the log-link. This has the advantage of estimating the relative or proportional change in the counts, rather than the absolute differences. Our model is shown below
Interaction terms in nonlinear models, such as the quasi-Poisson model above, are often difficult to interpret, particularly for logit and probit type models (see Ai & Norton, 2003). However, in the case of a Poisson model, the interaction between dichotomous independent variables is straightforward and meaningful. That is, such an interaction reflects a difference in the rate of change (proportional change) for the two levels of one variable relative to the two levels of the other. In our case, the three-way interaction reflects whether the ratio of the proportional change in CFS relative to INC differs between the treatment and control conditions.
We report outcomes for total calls, since that is the overall measure of interest in trying to understand CRS. However, per our earlier analyses, a very large part of the changes we observe is attributable to the disorder call category. Accordingly, we also present the analyses only for disorder. We do not include analyses of the ‘other crimes’ category because they are centered around a single crime—domestic calls—and the Ns are too small for robust analyses. Statistical tests of significance are two-tailed.
Regression Coefficients for the Three-Way Interaction Term (Treatment by Time by CFS Vs. Incident) Across Models.
Note. Incident Rate Ratio (IRR) = exp(b).
p-value is based on two-tailed test.
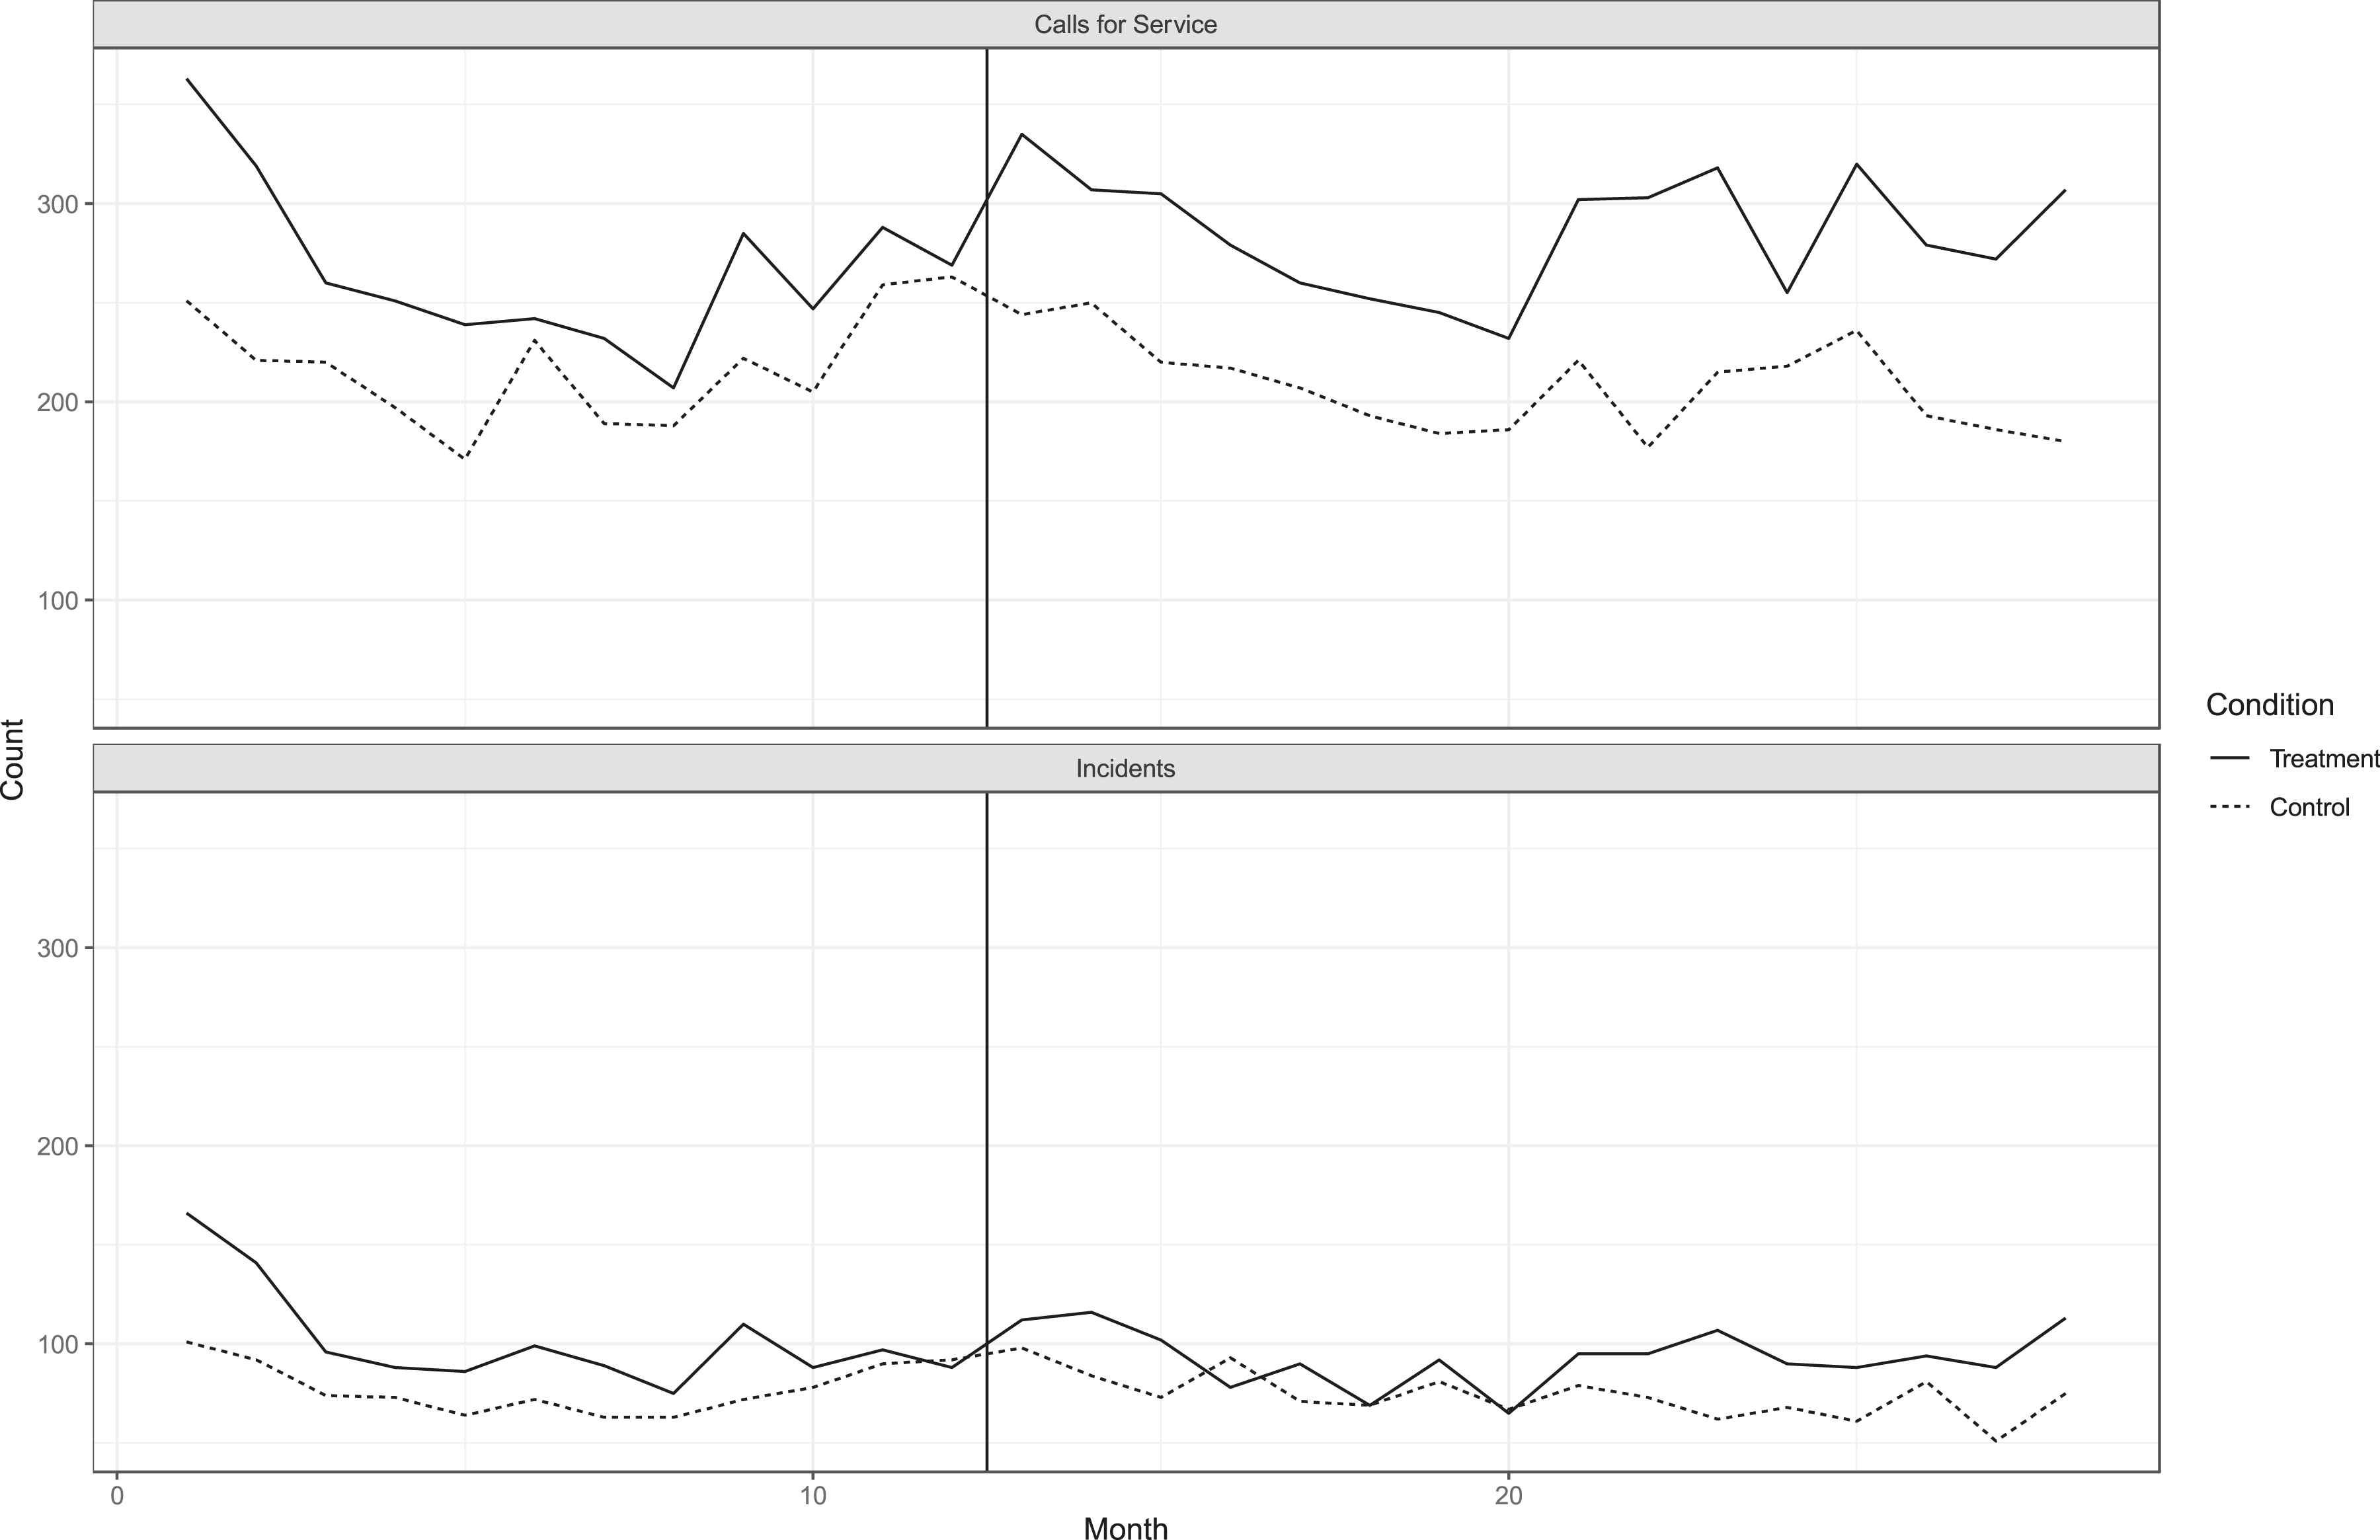
Trends in calls for service and crime incidents before and during treatment in treatment and control hot spots.
Estimating Treatment Impacts Correcting for CRS
Having established that CRS is a source of bias in the Brooklyn Park experiment, we wanted to consider the extent to which it influenced assessment of the impacts of the experiment on crime incidents, the main outcome measure used to estimate changes in crime.
As we noted above, Weisburd et al. (2021) developed such an approach to correct for bias in the assessment of crime outcomes in the Brooklyn Park Experiment. We term this approach the ‘Absolute Difference Ratio Index’ (ADRI)
It assumes an additive process in terms of differences between incidents in each period but creates a ratio of change. The equation requires that the count for CFS is greater than the count for incidents. The index produces a meaningless value when this relationship does not hold. The importance of the ratio is that it provides a metric that can be used in adjusting study results. For example, it might lead to an estimate of a 10% increase in incidents in the treatment group relative to the control group. We could then decrease the number of incidents in the treatment condition by 10% to adjust for CRS bias. We note that a simple difference-in-difference measure would not provide an estimate that allowed for adjustment since it would be scaled differently depending on the number of events observed. Accordingly, for adjustment purposes a ratio measure is required.
ADRI for Brooklyn Park Data.
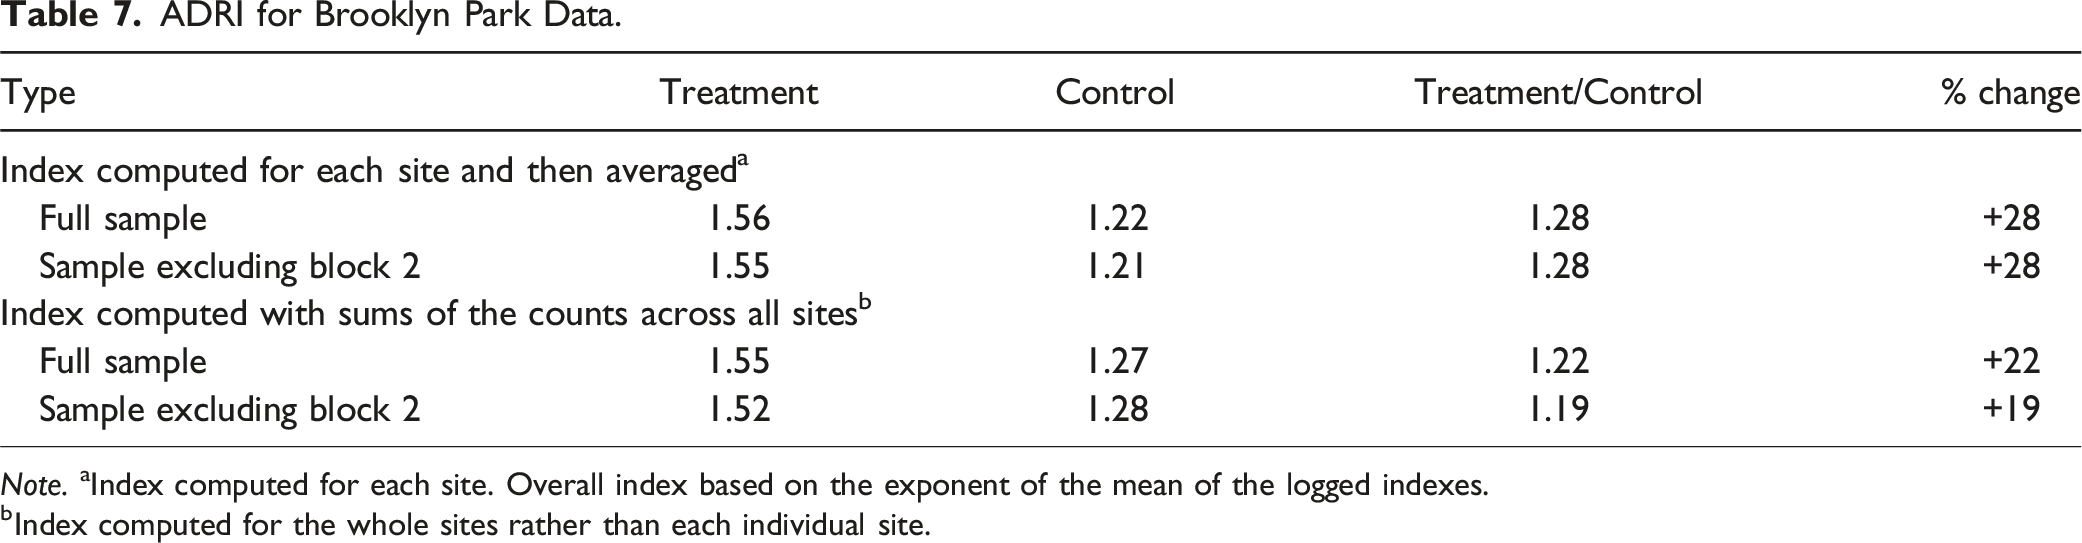
Note. aIndex computed for each site. Overall index based on the exponent of the mean of the logged indexes.
bIndex computed for the whole sites rather than each individual site.
We also examine a proportional index, where the absolute number of crimes at the hot spots has little impact on the index. Rather, it is the proportional change that is relevant. We call this the Proportional Ratio Index (PRI)
PRI for Brooklyn Park Data.
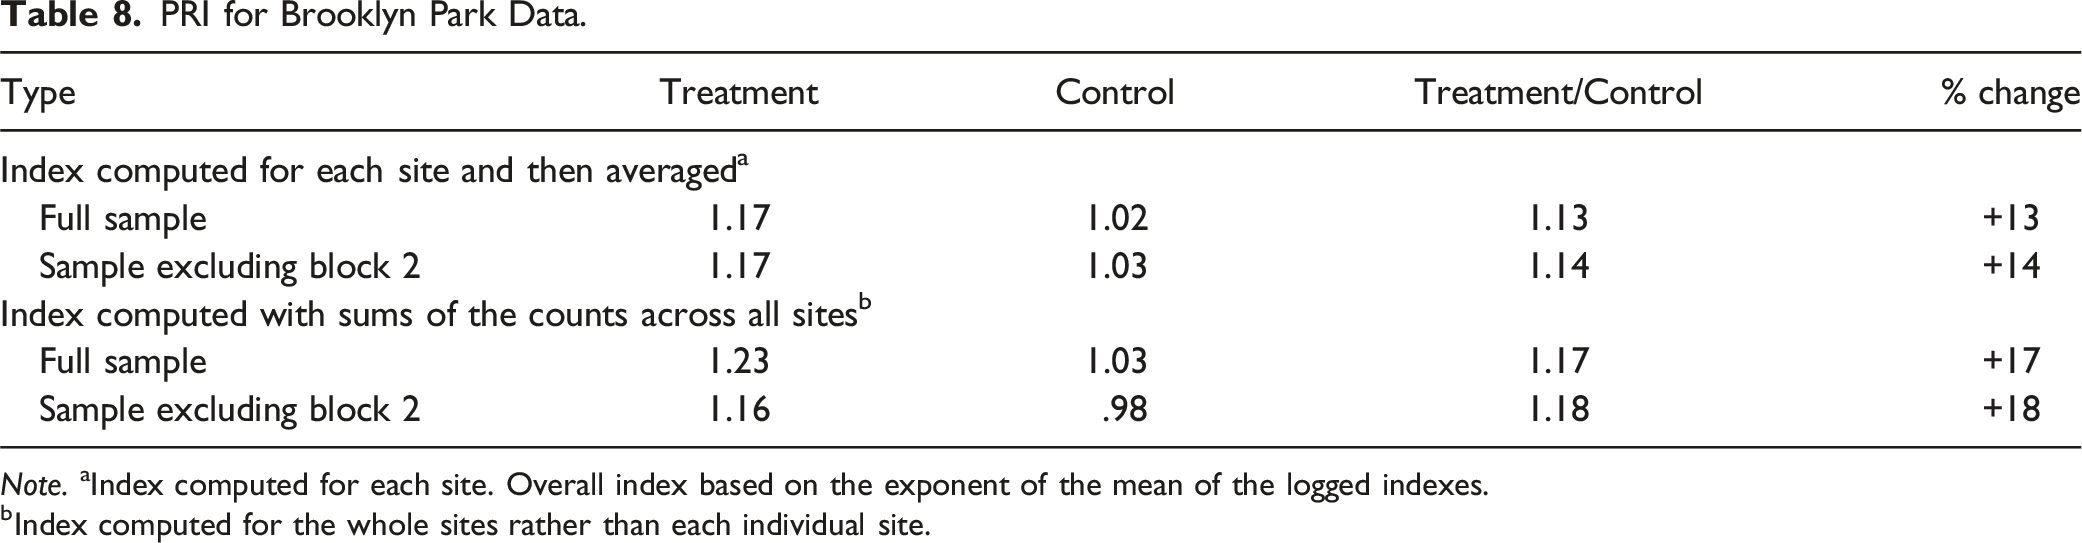
Note. aIndex computed for each site. Overall index based on the exponent of the mean of the logged indexes.
bIndex computed for the whole sites rather than each individual site.
Taken together, these analyses suggest a bandwidth of corrections that is between 13 and 28%. That is the range of outcomes we observe using either the ADRI or PRI approaches, either summing across sites or taking the average across sites.
A Simulation of Possible Impacts of CRS Bias on Meta-Analyses of Community Policing Studies
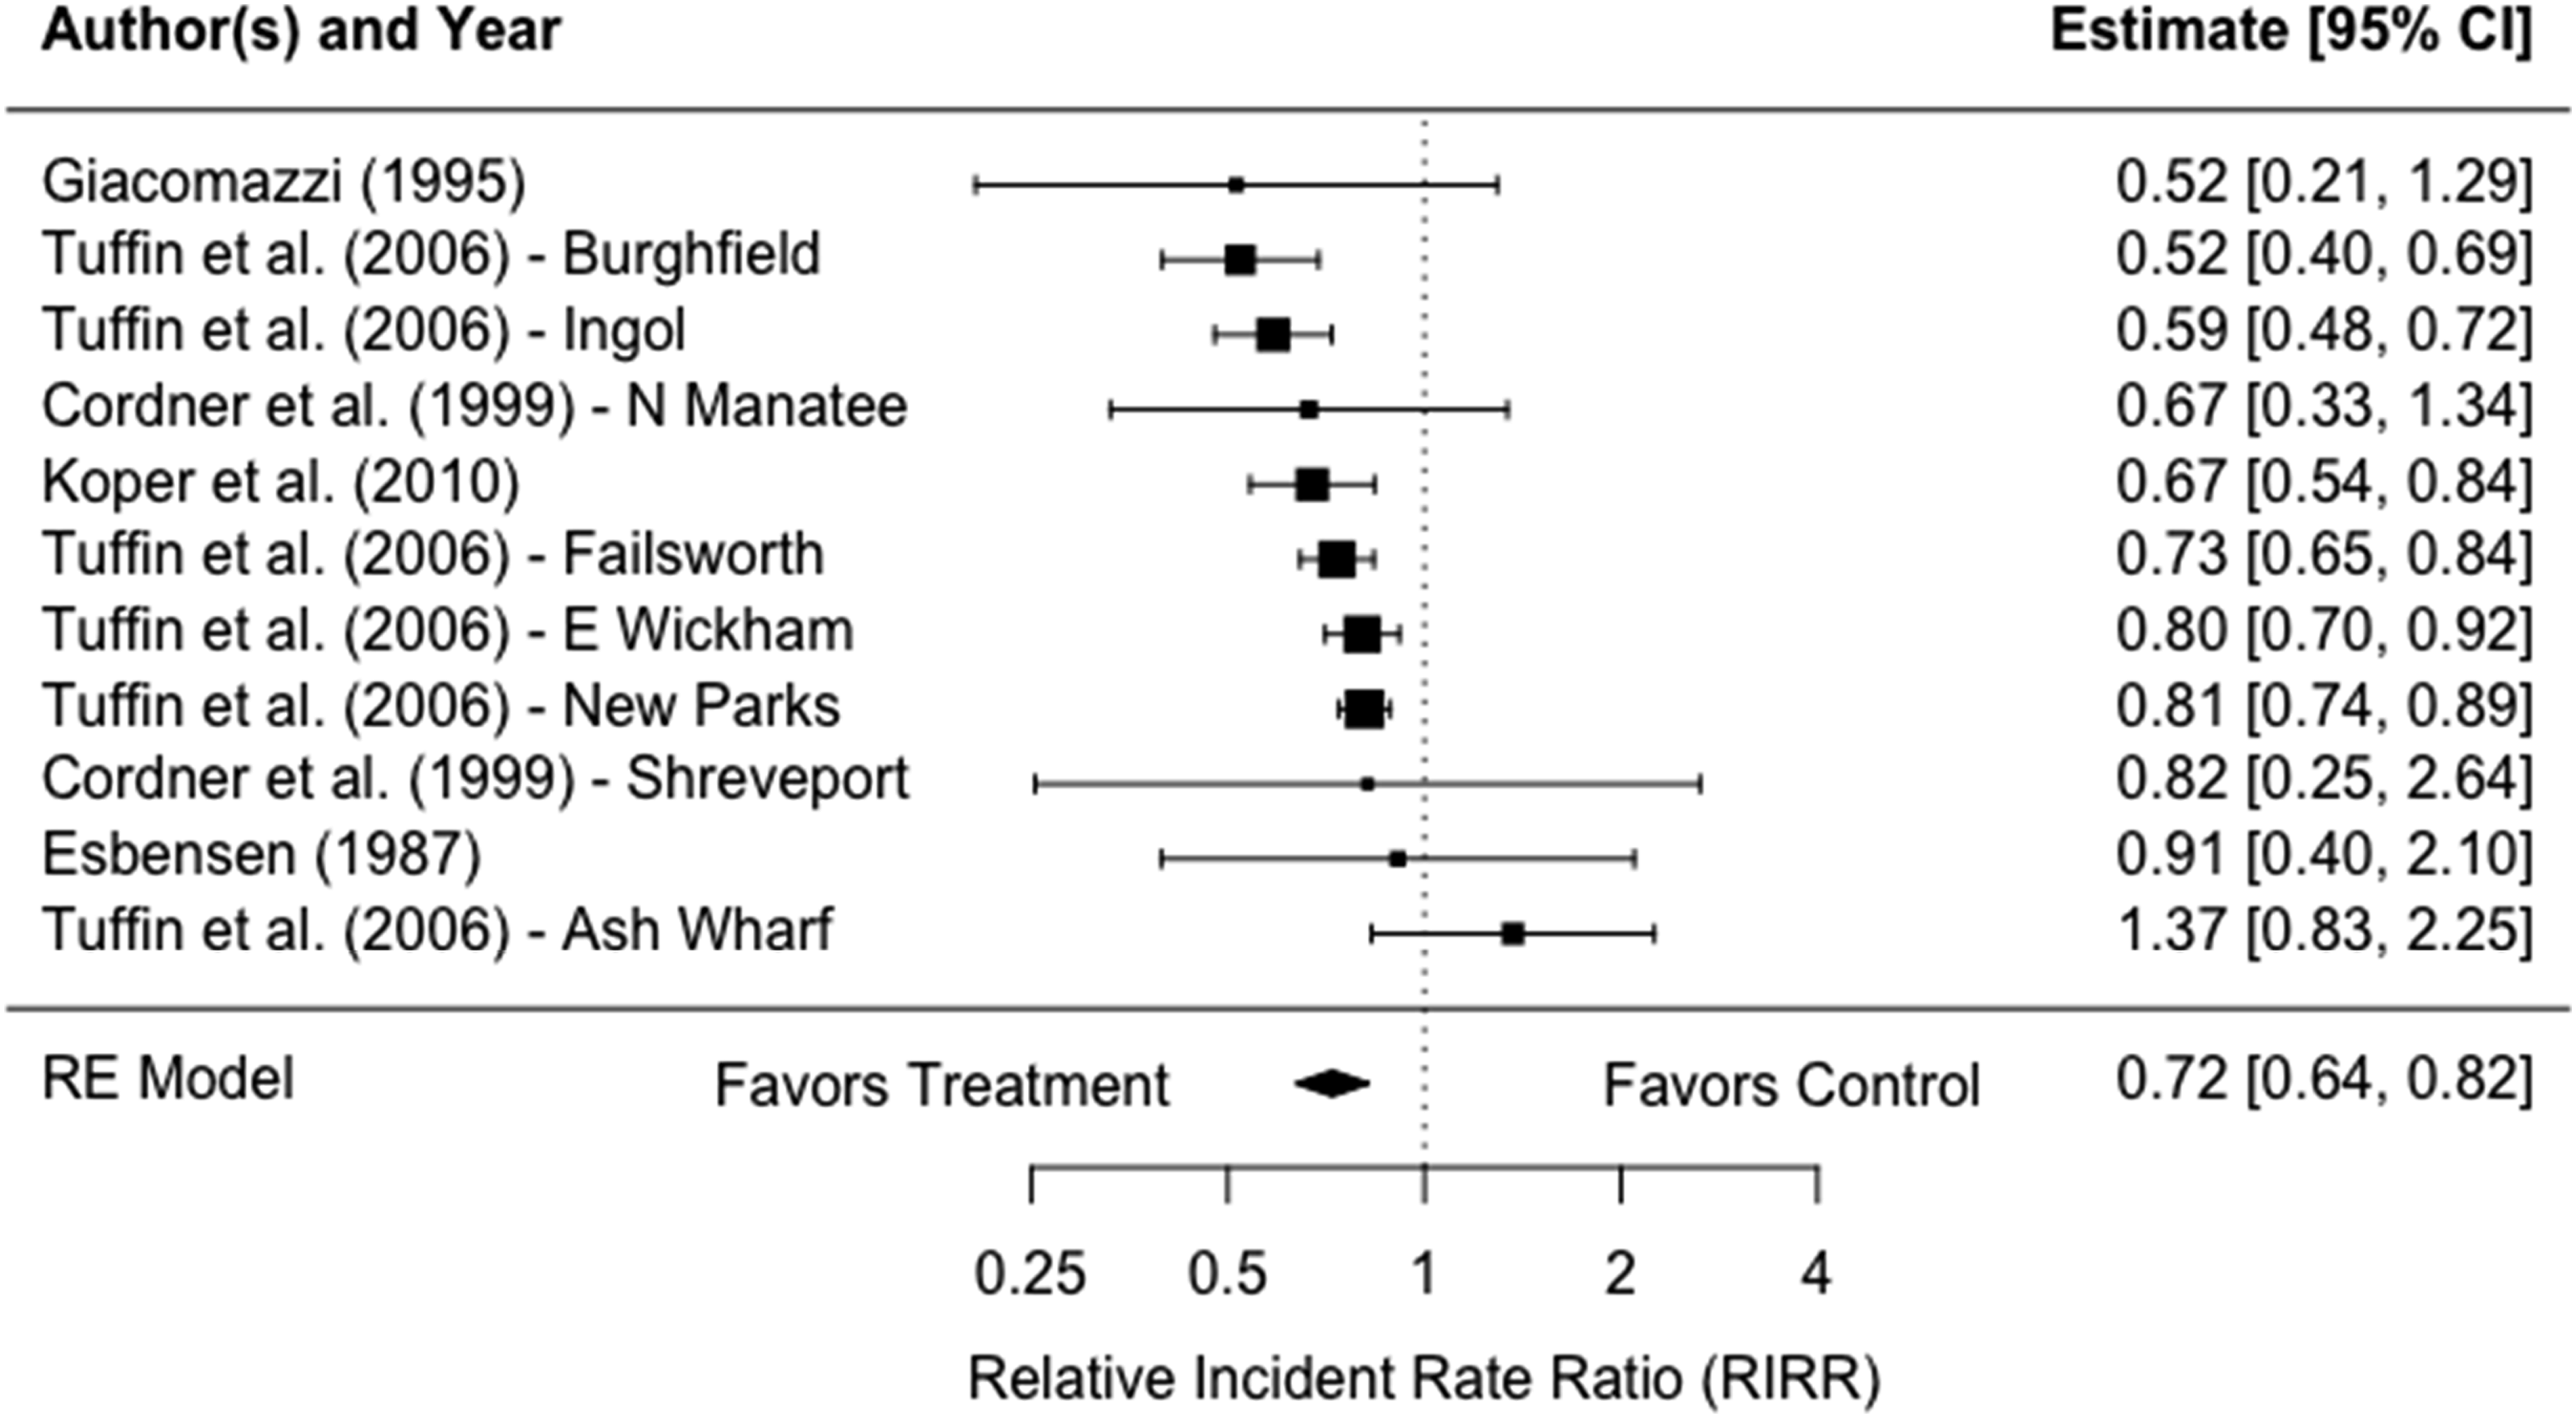
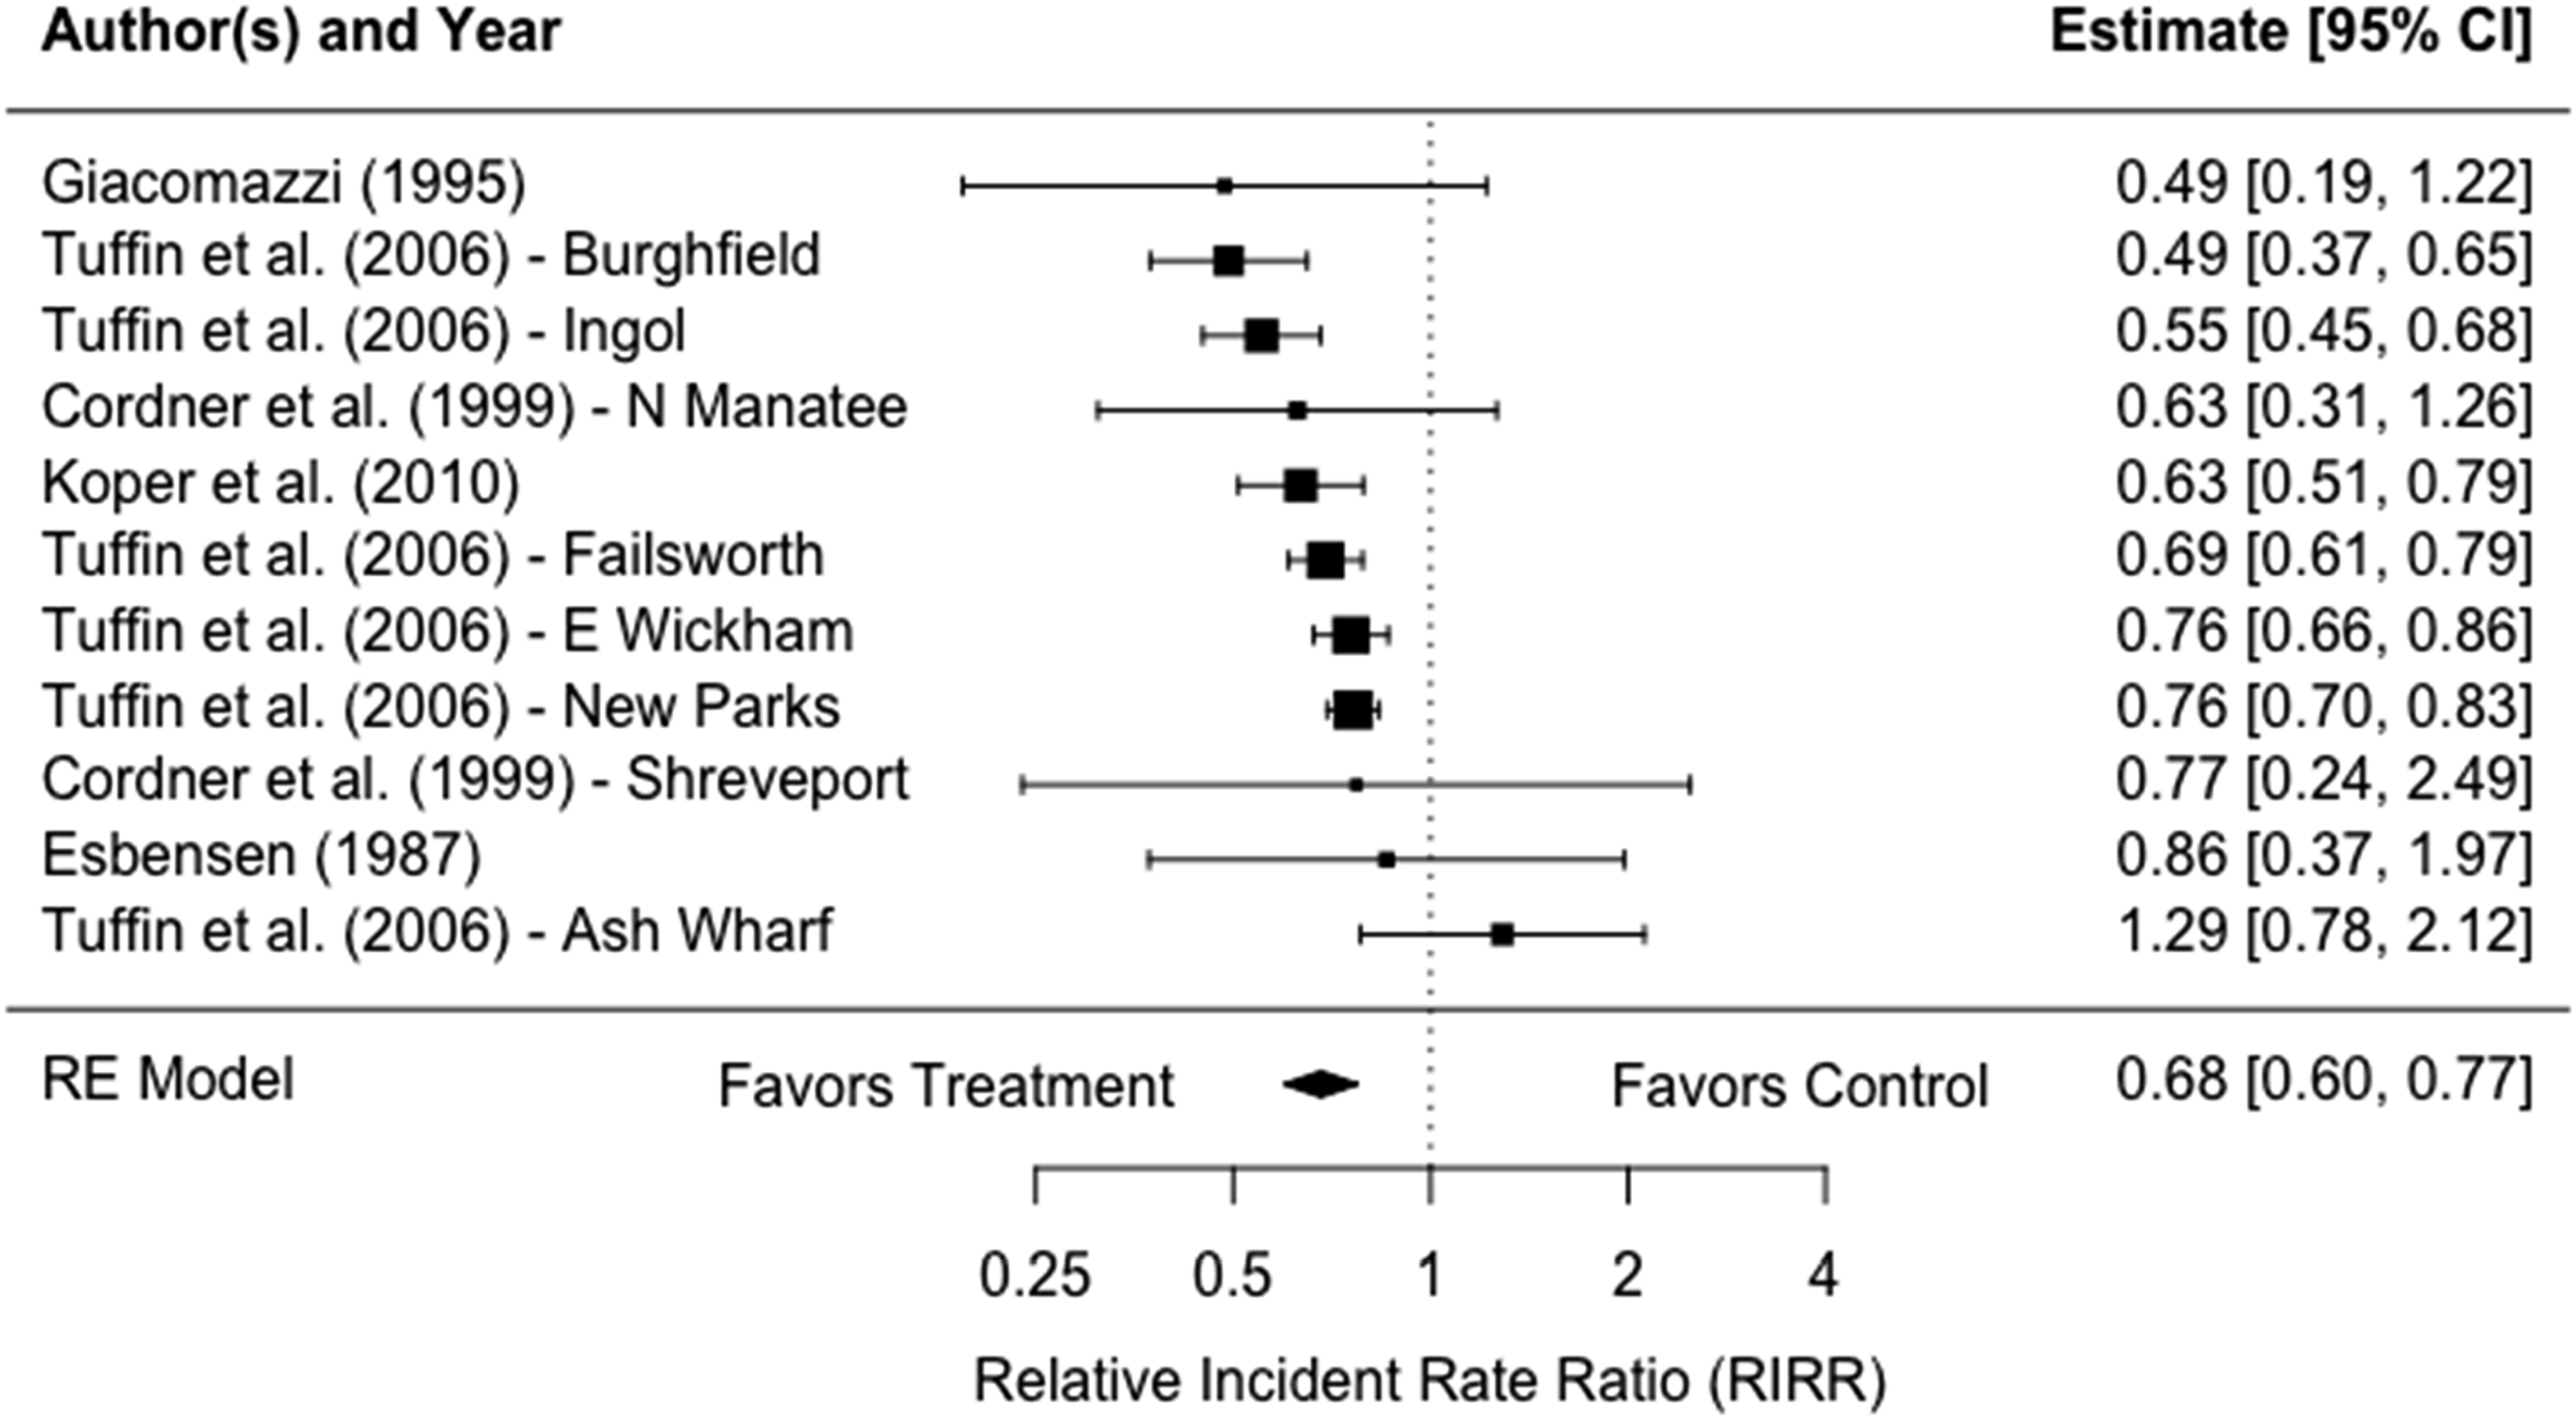
We began this article by arguing that CRS bias may have had an impact on the conclusions that have been reached about the crime control impacts of community policing. While Brooklyn Park provides only one set of estimates of CRS, we wanted to assess how such estimates, if they were found in community policing studies more generally, might influence outcomes in a meta-analysis of community policing studies. We identified 11 studies from Gill et al.’s (2014) meta-analysis of community-oriented policing that reported counts of crime incidents (typically general or Part I crime incidents). For each study, we adjusted the count of crime incidents reported in the treatment group in the post-intervention period by 13% (lower bound of the bias estimates), 20.5% (mid bound), and 28% (upper bound). We then conducted meta-analyses of the studies, using the adjusted counts instead of the original data to calculate effect sizes.
We estimated random-effects meta-analysis models based on a priori assumption of a heterogeneous distribution of effect sizes, which was confirmed by the Q statistic (Q = 23.33, df = 10, p < .01, I2 = 66.37 for the model without a CRS adjustment). While Gill et al. (2014) used the “relative effect size” devised by Farrington et al. (2007) as an effect size index to account for overdispersed distribution of crime data, we use the “relative incident rate ratio” (RIRR) developed by Wilson (2022), who argues that this is a more precise approach to handling overdispersion in crime counts. We also flipped the direction of the effect such that effect size values less than 1 reflected a crime reduction effect for ease of interpretation.
It is important to note that Gill et al. (2014) conducted two separate analyses for official crime data. While 19 studies were eligible for the original meta-analysis, five of those studies analyzed property and violent crime separately. Accordingly, Gill et al. examined the crime outcomes for the 19 studies twice, using the property crime outcomes from these five studies in one model and the violent crime outcomes in the other (p. 414). They also did not distinguish between crime calls and crime incidents in these analyses. In our analyses we look only at general crime incident outcomes. Gill et al. (2014) found a non-significant and marginal decrease in the odds of crime for the analysis that included the property crime outcomes, but a significant (p = .02) though small (10%) reduction was found in the analysis that included violent crimes. They argued that the effect size for the latter analysis was too small and the heterogeneity of the study outcomes too large to draw any strong conclusions (Gill et al., 2014, p. 414).
The results of our meta-analysis on the crime outcomes of the subset of these studies that report crime incidents, using different adjustments, are provided in Figure 3 through 6. The result of the meta-analysis without CRS adjustment showed that community policing had an overall statistically significant effect on crime at the .05 level (p = .04) (see Figure 3). However, as in the original study, these results should be interpreted with caution given the heterogeneity of the study results. But when we apply the CRS adjustments, the argument that community policing is associated with lower crime rates becomes more convincing. Effects of community policing on crime incident without adjustment.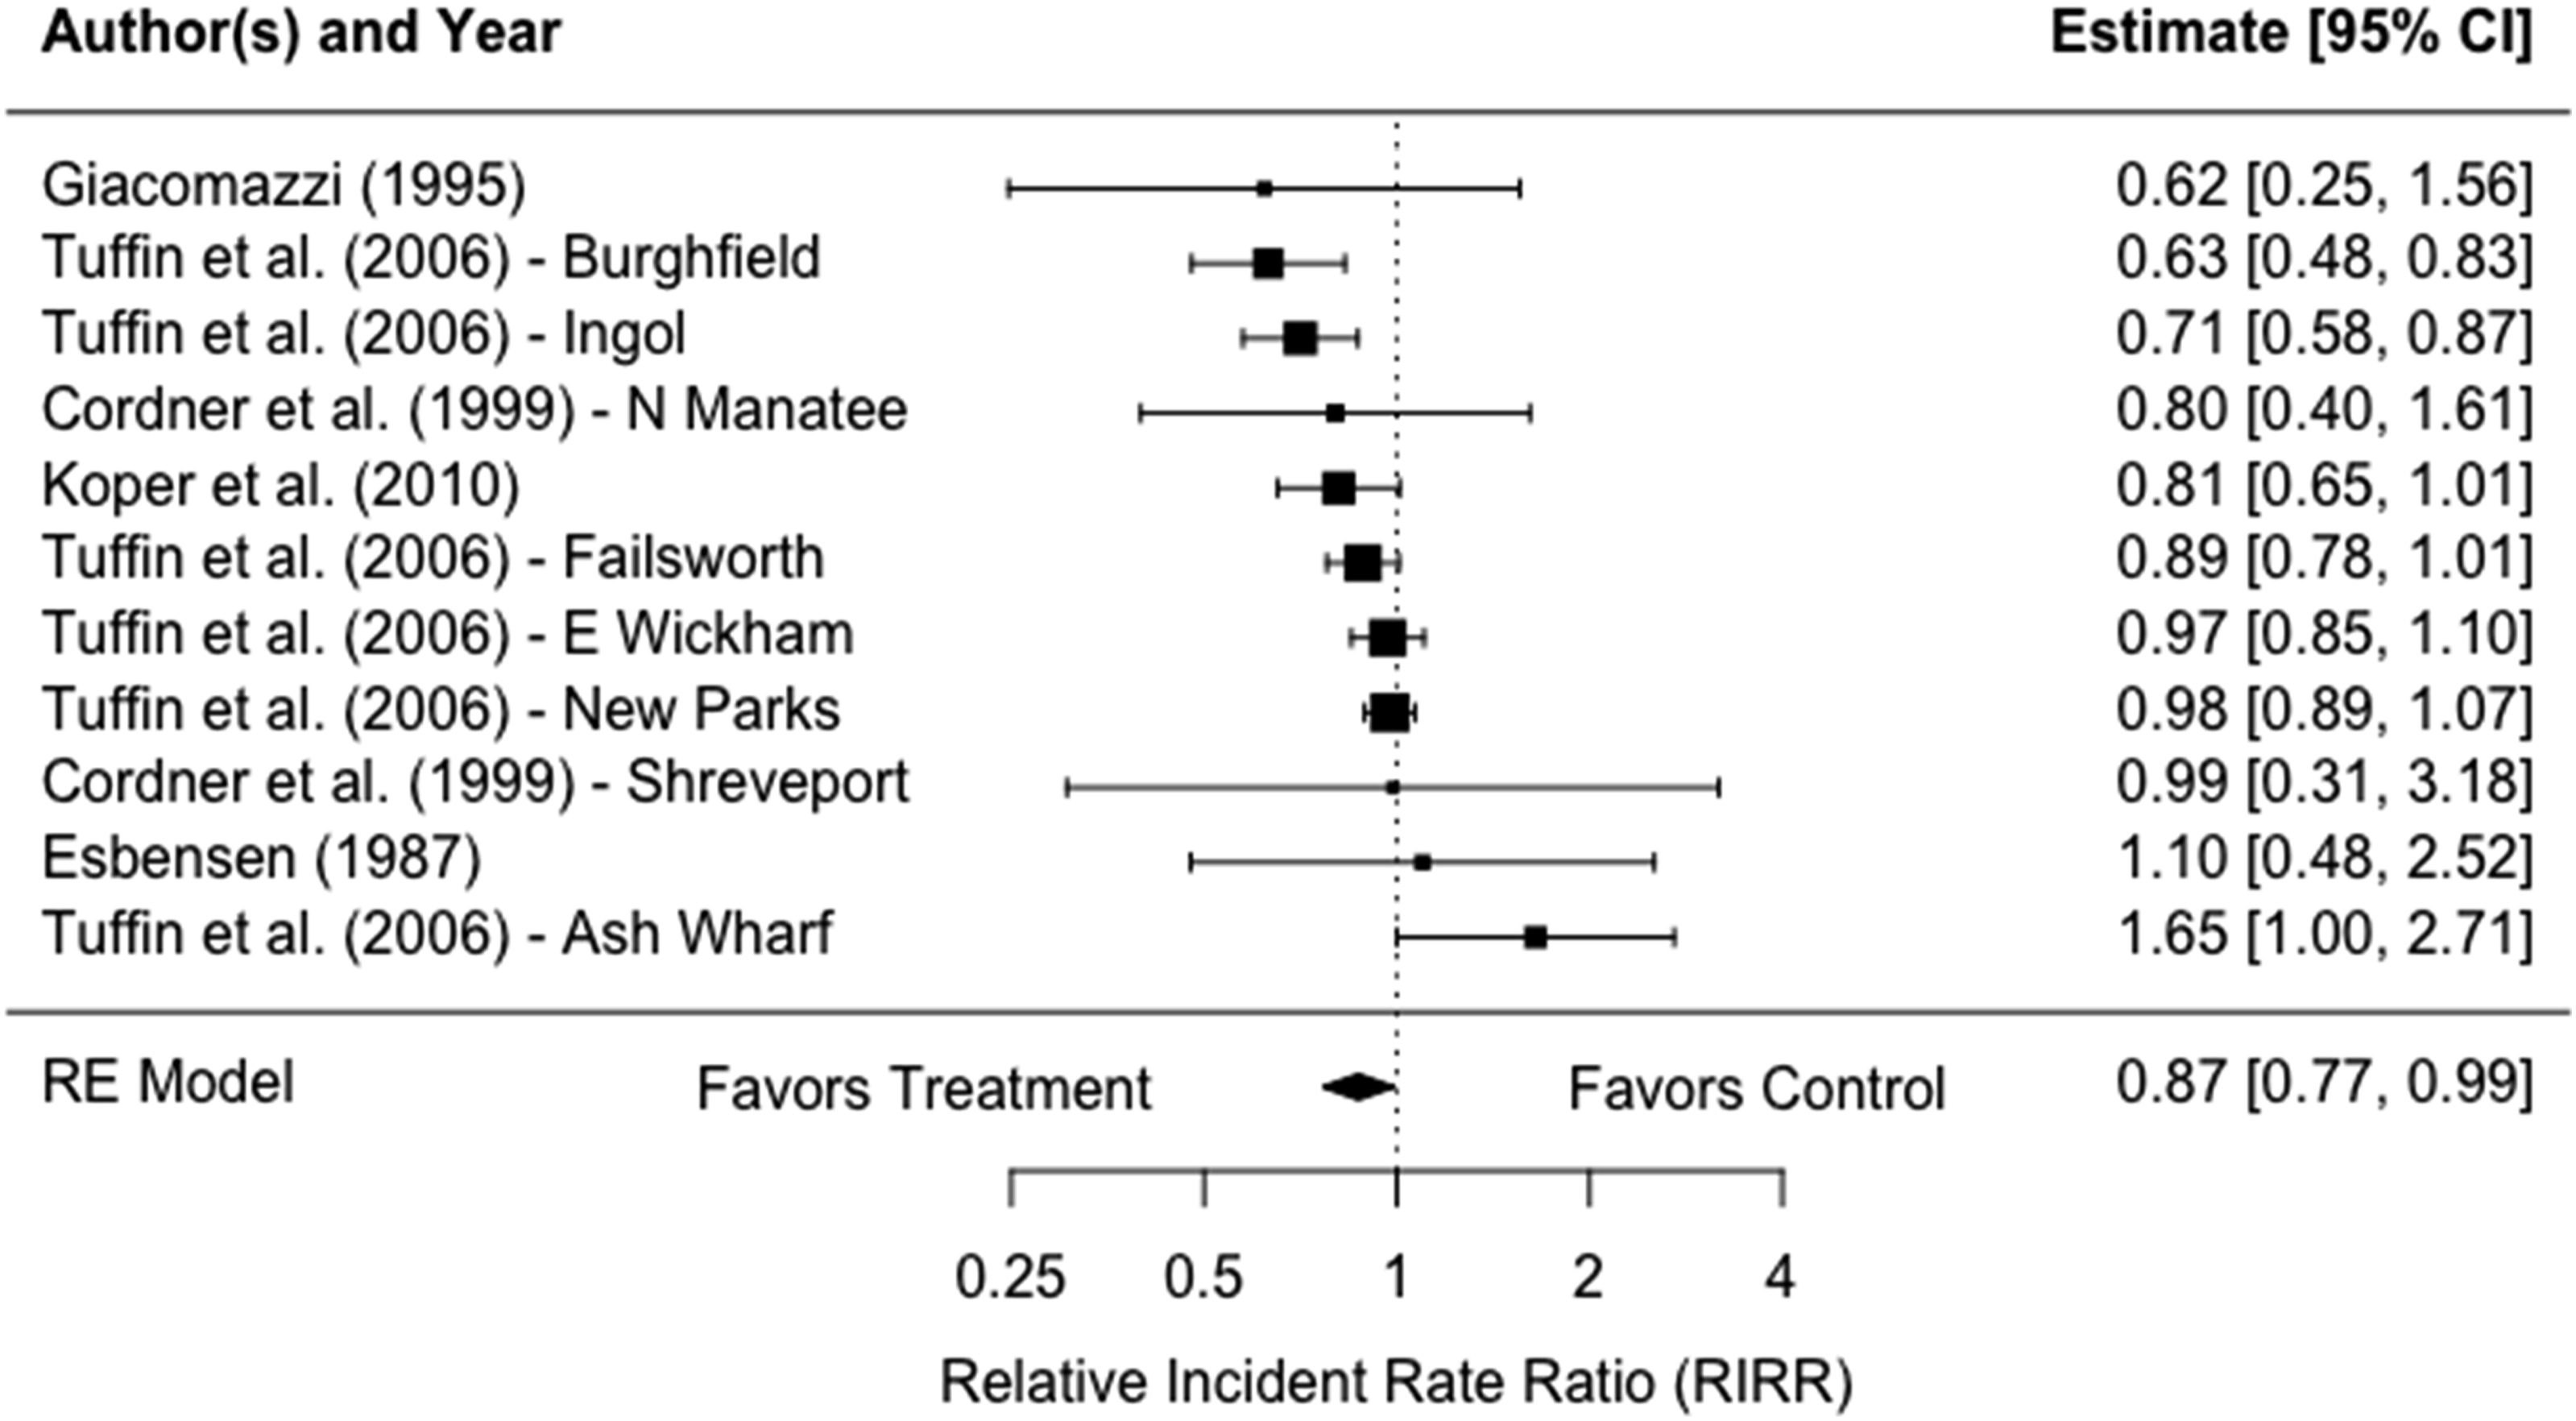
With the lower range adjustment, community policing was associated with a relative 23% reduction in crime, significant at the .001 level (see Figure 4). The RIRR for the mid-range adjustment leads to a relative reduction in crime of 28% (see Figure 5), and the higher range a relative reduction in crime of 32% (see Figure 6). These results are also statistically significant at the .001 level, and it is important to note that in these analyses all but one of the studies showed an effect in the direction of crime prevention. Thus, our conclusions about the crime control effectiveness of community policing change radically when we adjust the outcomes based on a presumed change in CRS. Effects of community policing on crime incident with 13% adjustment. Effects of community policing on crime incident with 20.5% adjustment. Effects of community policing on crime incident with 28% adjustment.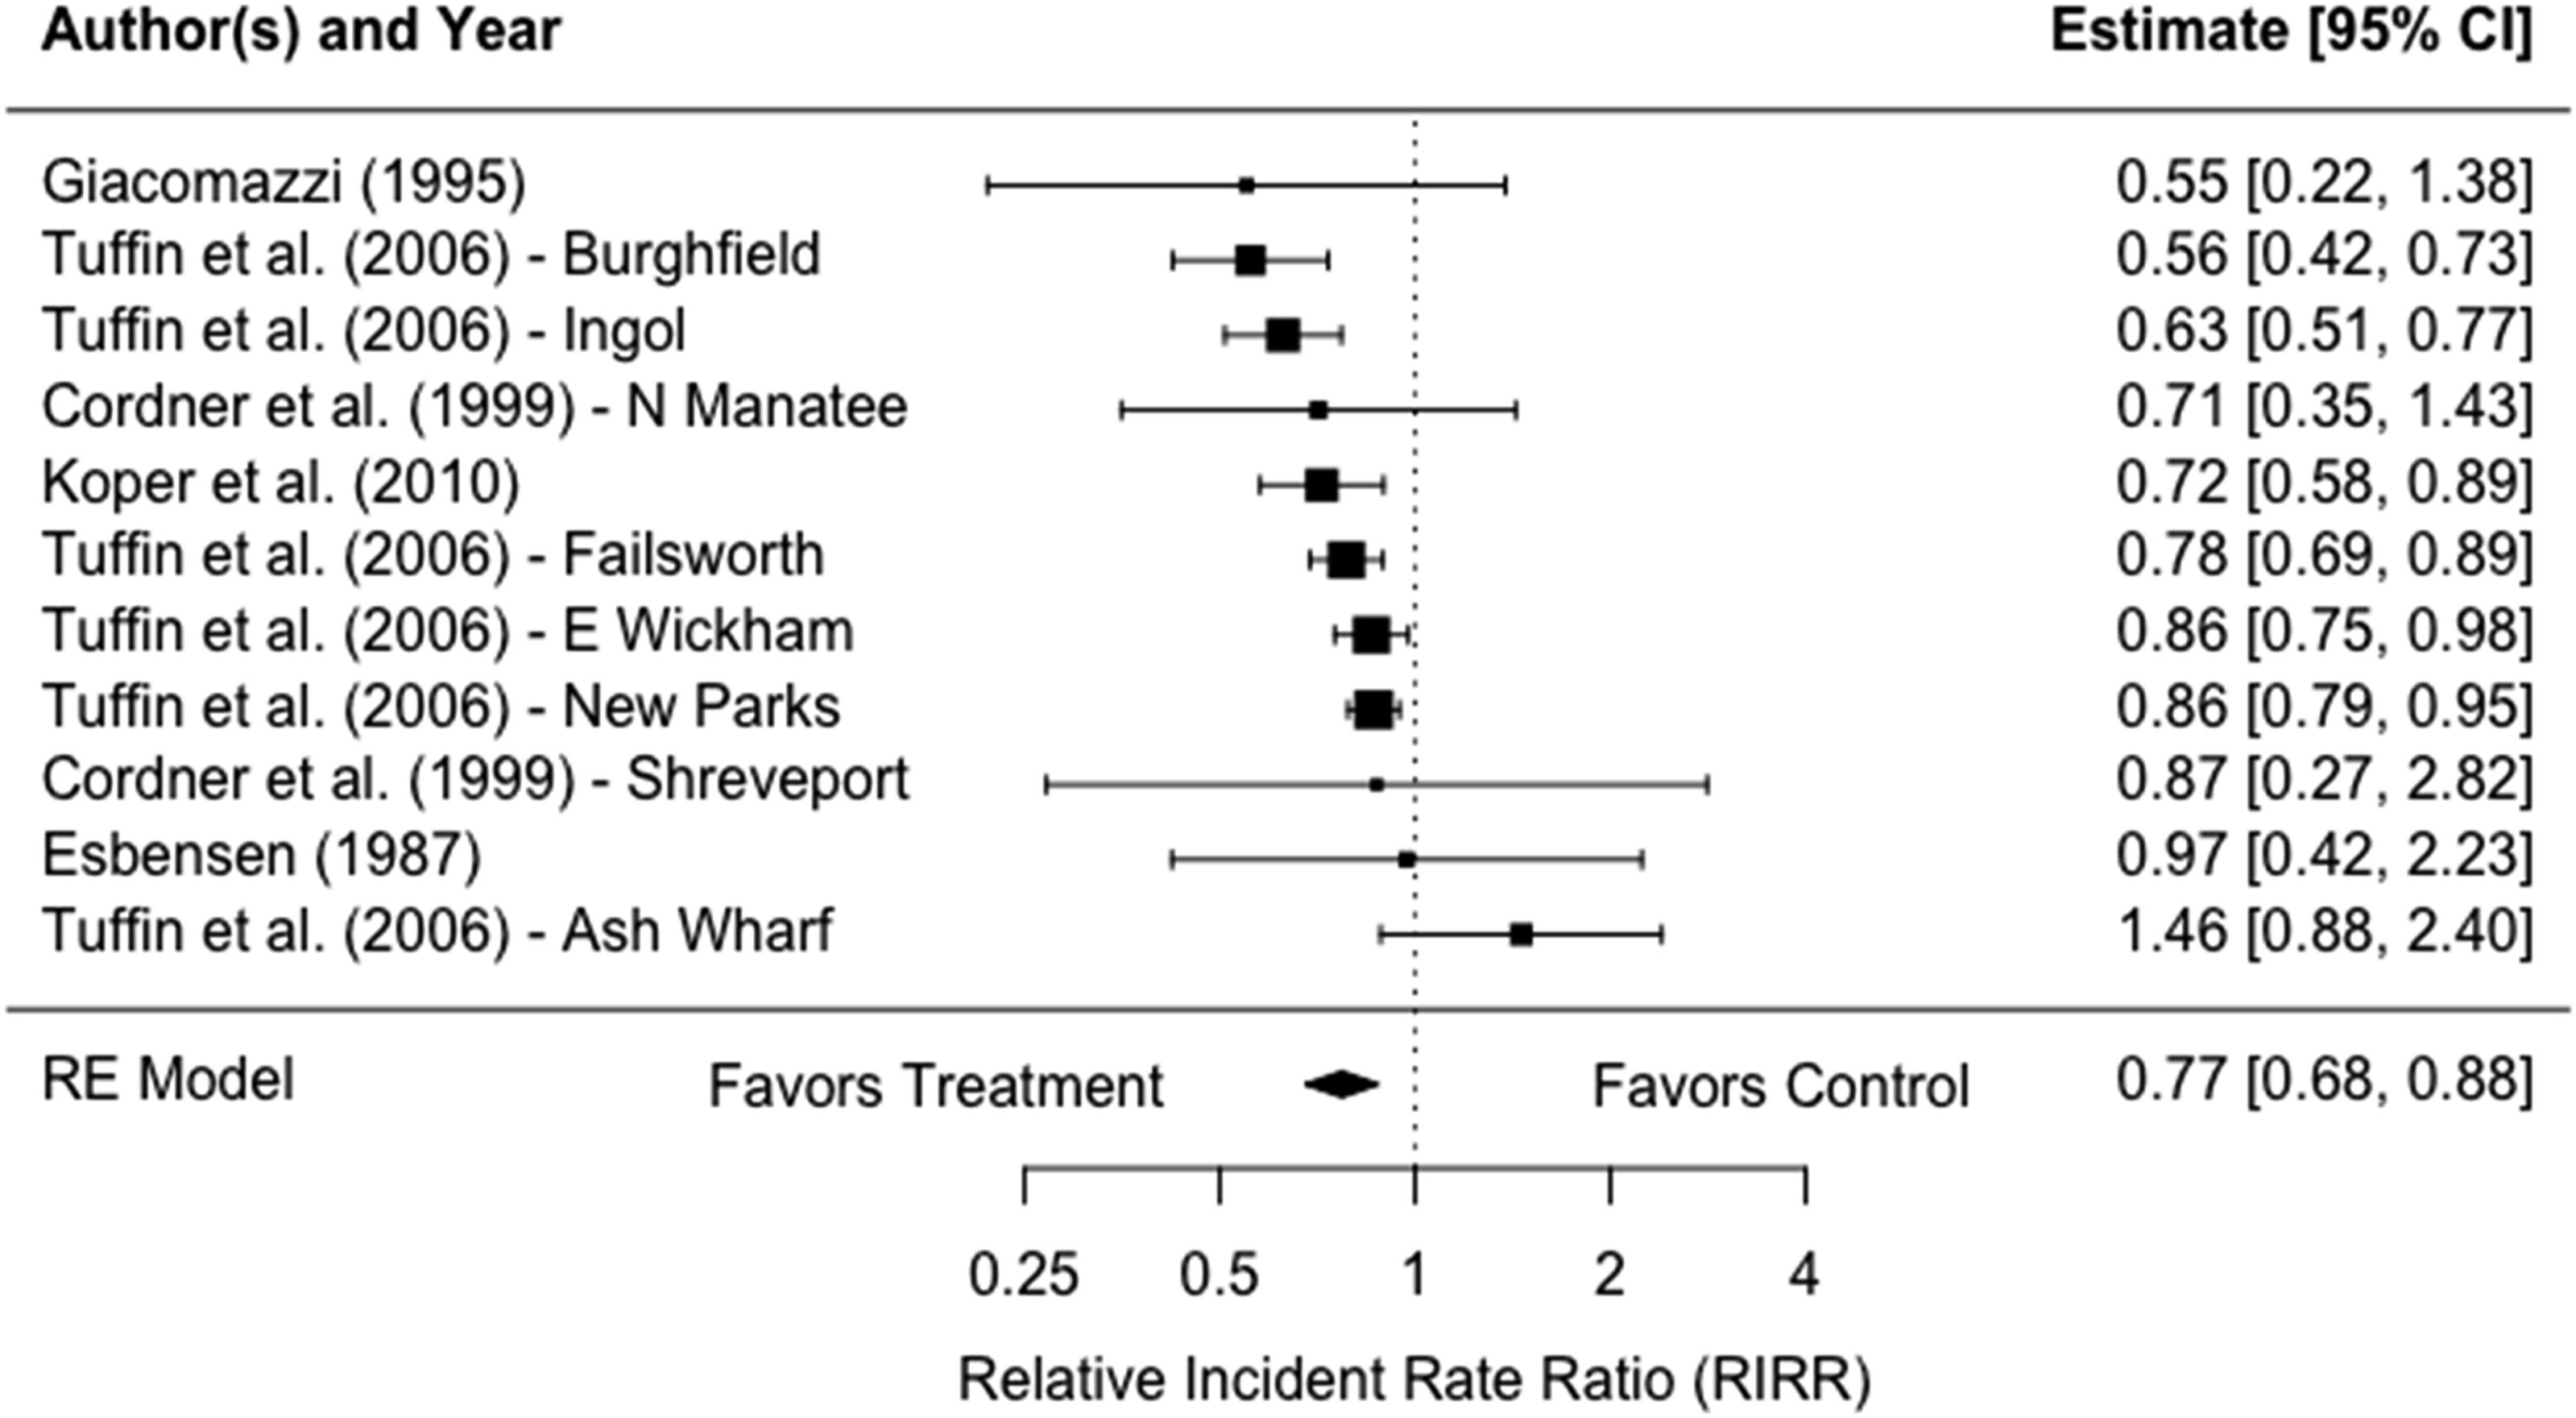
Discussion and Conclusions
In our paper we have tried to identify the mechanisms that drove what Weisburd et al. (2021) identified as “crime inflation” in the Brooklyn Park ACT experiment. Looking deeper into the data, we identified disorder crimes and domestic crimes as the key generators of this process, leading us to argue that “crime reporting sensitivity” (CRS) is a more appropriate name for the mechanisms identified than “crime reporting inflation.” We argue that citizens are more likely to report disorder crimes because of the increased community collaboration and trust that is built in community policing programs. In this case, crimes that were less serious and less likely to be reported before the intervention were reported more often during the intervention. In turn, we argue that the more serious category of domestic crimes, which are generally underreported, also became more likely to be reported during the experiment because of increased collaboration and trust. Importantly, this increased sensitivity in reporting these crimes led to increases in recorded crime incidents in not only these crime categories, but also other crime incident categories like violence and property crimes.
In testing this more general mechanism, both in terms of increased sensitivity for crime calls to the police more generally and for disorder crimes specificially, we found strong evidence of CRS bias in these data. In Brooklyn Park, the experiment led to community members being significantly more likely to report crime. It is important to note that increasing cooperation and willingness to report crime to the police was a general goal of the Brooklyn Park experiment, and is a common goal of community policing more generally. In this sense CRS bias is not evidence of a pathology or failure in community policing. Indeed, its presence is evidence that community policing is achieving its stated goals. Those goals in turn are part of the crime prevention mechanism hypothesized in community policing. Greater collaboration and cooperation with the police will, it is assumed, lead to greater crime control, as the police are more aware of crime problems, and as community members collaborate with the police to ameliorate those problems. Our paper points to an inevitable contradiction between the goals of community policing and our measurement of its crime prevention impacts. Increasing collaboration and reporting to the police leads to larger numbers of crime calls to the police—a measure sometimes used to evaluate policing interventions. Increased calls to the police, in turn, lead to higher numbers of crime incidents, which are commonly used as indicators of real crime levels in evaluations of policing programs.
Our results suggest that it is time to look critically at conclusions based on crime calls or crime incident outcomes in any intervention that emphasizes cooperation and collaboration with the police, or that encourages directly or indirectly increased crime reporting. Such programs may affect the mechanisms through which crime calls and crime incidents are generated, and it is likely that this impact would lead to underestimating crime prevention benefits because of CRS bias. In such cases it is crucial to try to estimate the extent of that bias to develop more valid estimates of crime impacts, and to explore other measures of crime that will not be as affected by CRS as crime calls or crime incidents.
We also examined how adjustments for CRS might impact upon our more general view of the crime control outcomes of community policing. We illustrated this potential impact by using a range of corrections developed from the Brooklyn Park data. Our findings are instructive and reinforce our concerns about the conclusions of existing studies. Using a subset of studies included in Gill et al.’s (2014) systematic review of community policing that examined crime incidents, we applied the bias adjustments we developed from the Brooklyn Park data. When we did this, both the effect sizes and statistical significance of the crime outcomes from these studies shifted dramatically. The importance of these outcomes should not be underestimated. They call into question a prevailing scientific conclusion—that community policing does not impact upon crime.
Of all proactive policing strategies, community policing is the approach that has been found most likely to improve relationships between the police and the public (Gill et al., 2014; Weisburd & Majmundar, 2018). Given the growing criticisms of the police, often focusing on their treatment of citizens and their relationships with the communities they serve (e.g., Nix et al., 2018; Vitale, 2017), this would suggest that community policing is a particularly important part of the evidence-based policing toolbox. While police agencies have for this reason often adopted community policing, they have done so with the scientific community telling them that there is no evidence that community policing reduces crime (Gill et al., 2014; Weisburd & Majmundar, 2018). Our work suggests that this conclusion must be reassessed. CRS bias may be at play in many community policing studies, and especially those that successfully meet their goal of creating more engagement between the police and the public, which is often manifested in a greater willingness to report crimes.
These findings also have implications for other types of interventions that increase collaboration and cooperation with the public. For example, procedural justice policing emphasizes fair and respectful interactions with citizens. This includes giving citizens voice and showing trustworthy motives. Procedural justice policing in this sense can be seen as likely to improve interactions between the police and the public (Weisburd et al., 2022), and such interactions might lead to increased crime reporting to the police (e.g. see Kochel, Mastrofski, & Parks, 2013). A recent National Academy of Sciences review of proactive policing did not find crime prevention benefits for procedural justice policing (Weisburd & Majmundar, 2018). Perhaps the lack of observed crime prevention benefits here is the result at least in part of CRS bias. 5
Of course, we recognize that our approach is only tentative, and restricted to adjustments based on a single study. Brooklyn Park may not be representative of community policing studies more generally. For example, the emphasis on “assets” in the study may have increased CRS bias. Nonetheless, the underlying mechanisms ongoing during the experiment in Brooklyn Park are likely to be present to some degree in all successful community policing programs. Engagement and cooperation are key to community policing, and such engagement and cooperation are likely to lead to CRS bias.
Footnotes
Acknowledgments
We would like to thank Anthony Braga, Rachel Boba, James Bueerman, Cynthia Lum, Chris Koper, John MacDonald, Jerry Ratcliffe, Anita Ravishankar, Greg Ridgeway, and Wes Skogan for their insights and suggestions on the conceptual and analytic work developed in our paper.
Declaration of Conflicting Interests
The author(s) declared no potential conflicts of interest with respect to the research, authorship, and/or publication of this article.
Funding
The author(s) disclosed receipt of the following financial support for the research, authorship, and/or publication of this article: This work was supported by the by a grant from Arnold Ventures [grant number 20-04481] and Bureau of Justice Assistance (2013-DB-BX-0030).
Notes
Appendix
Full model for difference-in-differences panel regression approach to crime reporting sensitivity.
Full Quasi-Poisson Model Predicting Monthly CFS and INC (Total Crime; Full Sample).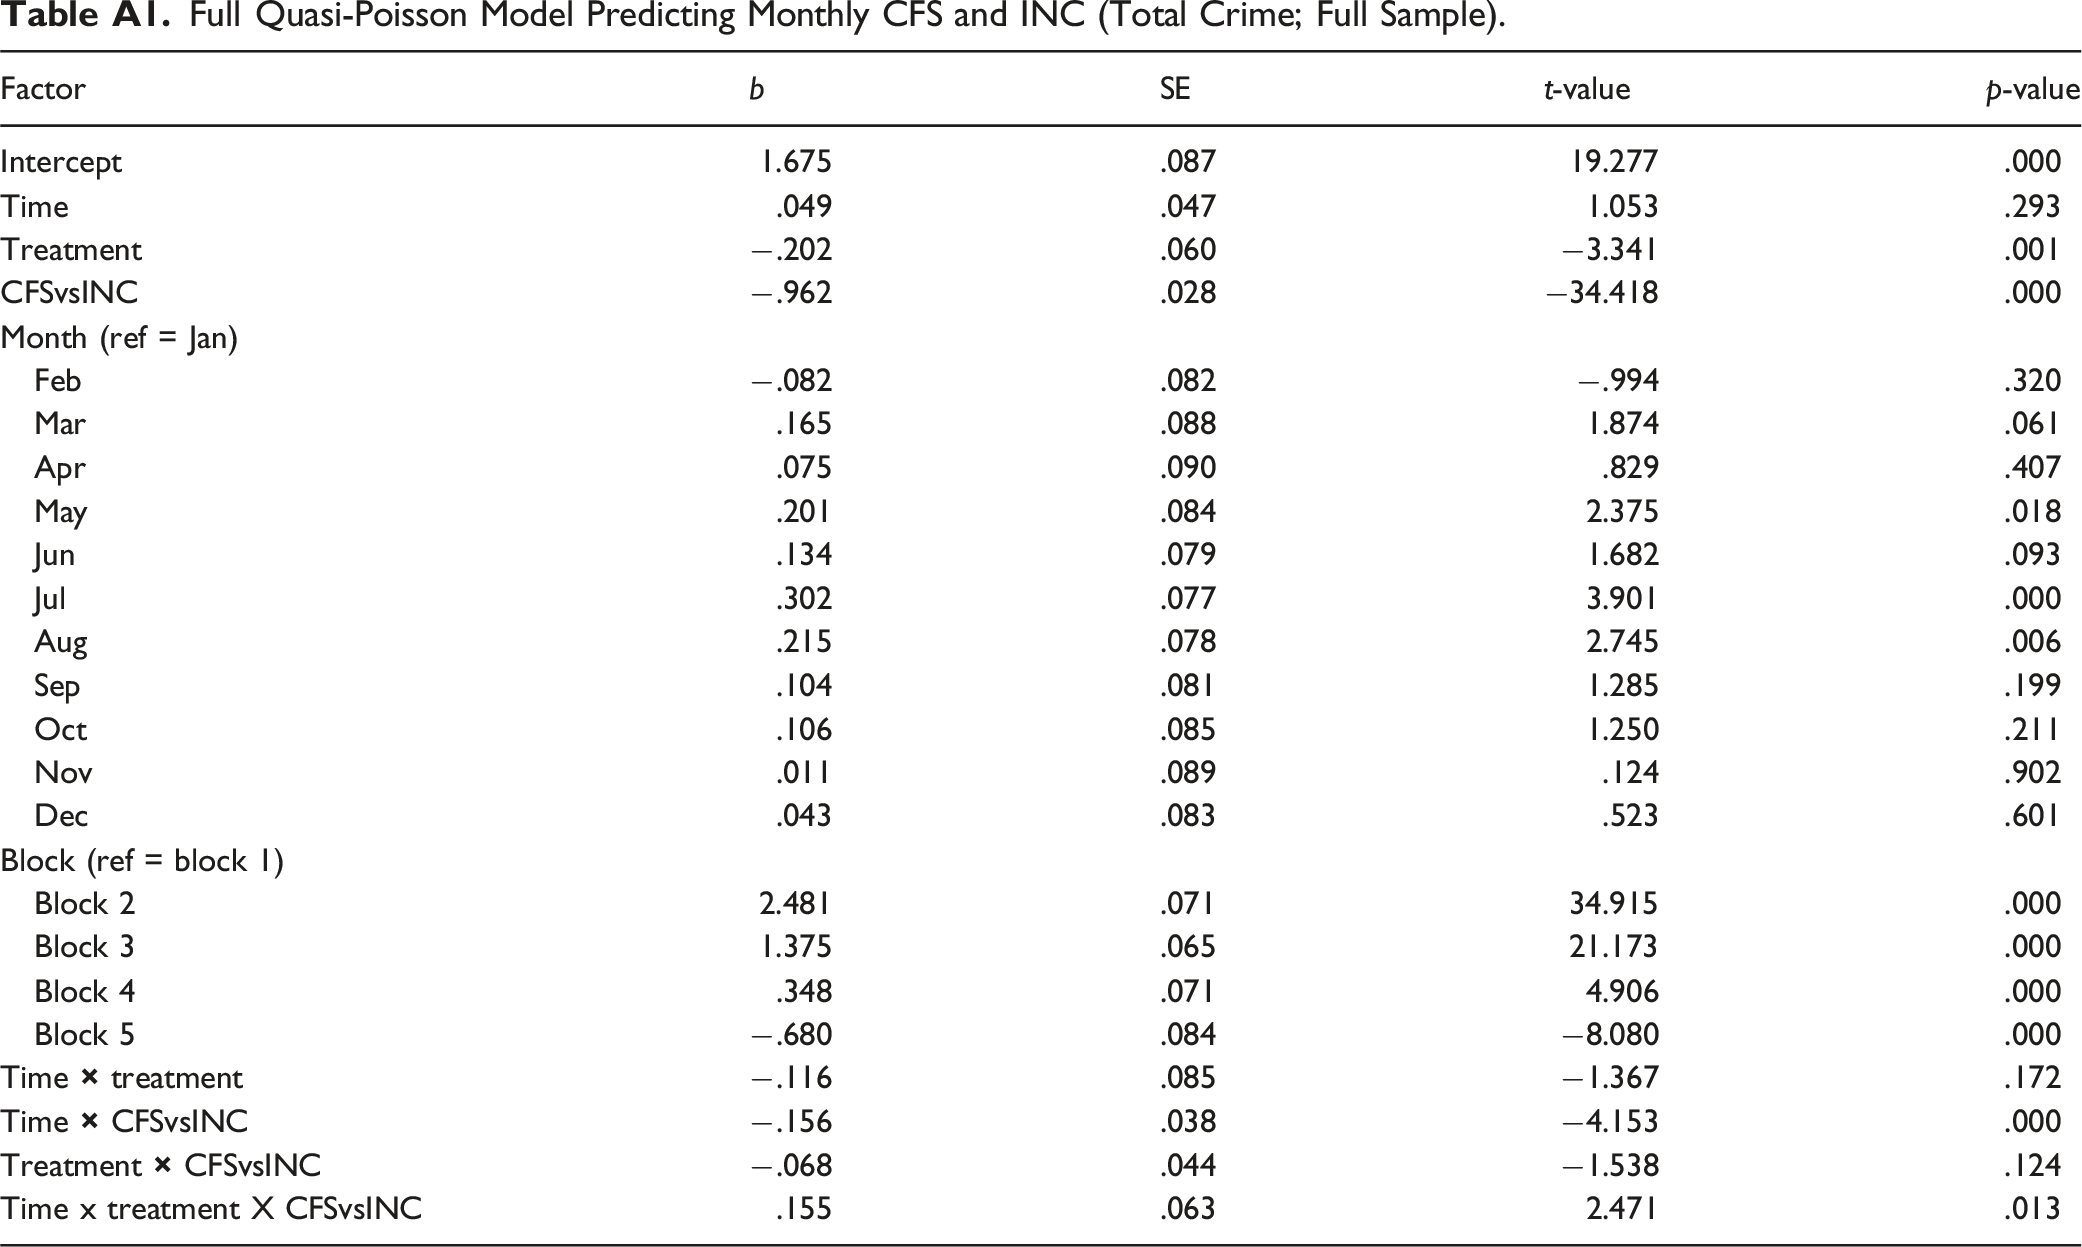
Factor
b
SE
t-value
p-value
Intercept
1.675
.087
19.277
.000
Time
.049
.047
1.053
.293
Treatment
−.202
.060
−3.341
.001
CFSvsINC
−.962
.028
−34.418
.000
Month (ref = Jan)
Feb
−.082
.082
−.994
.320
Mar
.165
.088
1.874
.061
Apr
.075
.090
.829
.407
May
.201
.084
2.375
.018
Jun
.134
.079
1.682
.093
Jul
.302
.077
3.901
.000
Aug
.215
.078
2.745
.006
Sep
.104
.081
1.285
.199
Oct
.106
.085
1.250
.211
Nov
.011
.089
.124
.902
Dec
.043
.083
.523
.601
Block (ref = block 1)
Block 2
2.481
.071
34.915
.000
Block 3
1.375
.065
21.173
.000
Block 4
.348
.071
4.906
.000
Block 5
−.680
.084
−8.080
.000
Time
−.116
.085
−1.367
.172
Time
−.156
.038
−4.153
.000
Treatment
−.068
.044
−1.538
.124
Time x treatment X CFSvsINC
.155
.063
2.471
.013
Full Quasi-Poisson Model Predicting Monthly CFS and INC (Total Crime; Sample Excluding Block 2).
Factor
b
SE
t-value
p-value
Intercept
1.561
.087
17.955
.000
Time
.021
.046
.464
.643
Treatment
.032
.053
.595
.552
CFSvsINC
−.953
.035
−26.843
.000
Month (ref = Jan)
Feb
−.124
.087
−1.430
.153
Mar
.161
.099
1.628
.104
Apr
.063
.091
.695
.487
May
.209
.091
2.303
.021
Jun
.137
.087
1.585
.113
Jul
.358
.087
4.120
.000
Aug
.252
.086
2.929
.003
Sep
.104
.084
1.233
.218
Oct
.106
.090
1.185
.236
Nov
−.009
.093
−.101
.919
Dec
.041
.089
.462
.644
Block (ref = block 1)
Block 3
1.375
.066
20.838
.000
Block 4
.348
.069
5.022
.000
Block 5
−.680
.083
−8.199
.000
Time
−.078
.077
−1.019
.308
Time
−.146
.046
−3.175
.001
Treatment
−.077
.054
−1.426
.154
Time x treatment X CFSvsINC
.164
.073
2.251
.024
Full Quasi-Poisson Model Predicting Monthly CFS and INC (Disorder Crime; Full Sample).
Factor
b
SE
t-value
p-value
Intercept
.806
.130
6.200
.000
Time
.027
.061
.447
.655
Treatment
−.171
.081
−2.110
.035
CFSvsINC
−1.569
.075
−20.817
.000
Month (ref = Jan)
Feb
−.119
.140
−.847
.397
Mar
.143
.134
1.067
.286
Apr
.033
.151
.222
.824
May
.239
.129
1.852
.064
Jun
−.015
.126
−.117
.907
Jul
.244
.126
1.945
.052
Aug
.095
.127
.746
.455
Sep
.093
.124
.750
.453
Oct
.072
.137
.524
.600
Nov
−.017
.153
−.112
.911
Dec
.038
.144
.265
.791
Block (ref = block 1)
Block 2
2.492
.102
24.422
.000
Block 3
1.296
.094
13.863
.000
Block 4
.353
.101
3.497
.000
Block 5
−.936
.129
−7.280
.000
Time
−.129
.112
−1.159
.246
Time
−.582
.102
−5.691
.000
Treatment
−.143
.115
−1.245
.213
Time x treatment X CFSvsINC
.551
.183
3.016
.003
Full Quasi-Poisson Model Predicting Monthly CFS and INC (Disorder Crime; Sample Excluding Block 2).
Factor
b
SE
t-value
p-value
Intercept
.624
.126
4.969
.000
Time
.039
.062
.622
.534
Treatment
.133
.069
1.923
.054
CFSvsINC
−1.541
.101
−15.243
.000
Month (ref = Jan)
Feb
−.194
.142
−1.369
.171
Mar
.163
.142
1.142
.254
Apr
.044
.149
.296
.767
May
.287
.134
2.137
.033
Jun
.041
.131
.311
.755
Jul
.321
.134
2.393
.017
Aug
.144
.131
1.095
.273
Sep
.107
.125
.852
.394
Oct
.092
.133
.688
.491
Nov
−.061
.155
−.390
.696
Dec
.064
.148
.432
.666
Block (ref = block 1)
Block 3
1.296
.094
13.737
.000
Block 4
.353
.099
3.553
.000
Block 5
−.936
.128
−7.325
.000
Time
−.135
.102
−1.324
.186
Time
−.602
.135
−4.467
.000
Treatment
−.158
.142
−1.108
.268
Time x treatment X CFSvsINC
.672
.206
3.257
.001