
Abstract
We sought to determine whether a country's social policy configuration—its welfare state regime—is associated with food insecurity risk. We conducted a cross-sectional study of 2017 U.N. Food and Agriculture Organization individual-level food insecurity survey data from 19 countries (the most recent data available prior to COVID-19). Countries were categorized into three welfare state regimes: liberal (e.g., the United States), corporatist (e.g., Germany), or social democratic (e.g., Norway). Food insecurity probability, calibrated to an international reference standard, was calculated using a Rasch model. We used linear regression to compare food insecurity probability across regime types, adjusting for per-capita gross domestic product, age, gender, education, and household composition. There were 19,008 participants. The mean food insecurity probability was 0.067 (SD: 0.217). In adjusted analyses and compared with liberal regimes, food insecurity probability was lower in corporatist (risk difference: −0.039, 95% CI −0.066 to −0.011, p = .006) and social democratic regimes (risk difference: −0.037, 95% CI −0.062 to −0.012, p = .004). Social policy configuration is strongly associated with food insecurity risk. Social policy changes may help lower food insecurity risk in countries with high risk.
Keywords
Food insecurity , or uncertain access to the food needed for an active, healthy life, 1 has been increasingly recognized as a public health problem in many wealthy countries because it is associated with worse mental health, greater prevalence of cardiometabolic disease, reduced health-related quality of life, and higher health care utilization and cost, among other outcomes.2–15 For this reason, clinical organizations increasingly seek to identify and treat food insecurity among their patients.16–21 Despite these efforts, food insecurity still remains a problem for many—for example, it affected over 33 million people in the United States in 2021, 1 and over seven million people in the United Kingdom 22 amidst an ongoing cost of living crisis in Europe. 23
Food insecurity results from social conditions shaped by the configuration of distributive institutions—those policies and practices that distribute resources—within a society. A key set of distributive institutions are social policies, typically financed through taxation and meant to protect against material hardship, such as social insurance and means-tested “safety net” income supports. 24 These policies comprise a society's “welfare state”.25–30 Different welfare state configurations are likely to affect both the overall level of food insecurity in a society, and its distribution across segments of the population.
Analyses that examine the relationship between social policy and public health indicators across countries often rely on quantitative variables, such as the amount of social spending (sometimes called “welfare effort”), as the key exposure.31–35 However, this can neglect important differences in what that spending supports, the logic, or guiding principles, of various policies, and how they developed historically. Further, and perhaps most importantly, it may neglect how different policies—including social assistance, 24 social insurance, in-kind benefit provision (such as education), along with the tax system that finances them—all fit together into an overall system: a welfare state “regime”. 36 An approach that may better “see the forest for the trees” is typological, creating categorizations of welfare state regimes based on their historical development, underlying logic, and interacting components. 27 In welfare state studies, a landmark typology was the “three worlds” formulation of sociologist Esping-Andersen. 37 First published in 1990, this typology has encouraged a large body of scholarship over the past 30 years. This scholarship critiques certain particulars, but overall has shown welfare state typologies to be of enduring usefulness, still holding explanatory power for issues like poverty.27–30,38–43
The three regime types are termed corporatist (also called conservative), liberal (here meant to denote a free market or laissez-faire economic orientation, rather than left-wing politics), and social democratic (see Supplementary Table 1; 37,41,42). Corporatist regimes (e.g., Germany) emphasize the participation of sectoral stakeholders (e.g., the state, industrial sectors, and unions) working together to promote the social stability of the body politic (as the organs work together to promote the health of the physical body). Hallmarks of corporatist policies include family-focused benefits, policy segmentation by occupation (e.g., rather than a single public pension, pensions organized by industrial sector), and involvement of non-governmental stakeholders in program design and administration. Entitlement to benefits often stems from one's (or one's spouse's or parents’) work or service to the state, creating an insider/outsider distinction.
Liberal welfare regimes (e.g., the United States) are characterized by a free market orientation and a residualist ethos—the state is only meant to step in for “left over” needs that cannot be addressed by the market or within families.37,39,40,44 Welfare state programs are thus “second-line” safety nets to turn to only when other options have been exhausted. Hallmarks of liberal policies include means testing (designing benefits to be available only for those with income or assets below a certain threshold), phase-outs (decreasing benefits as income increases), and stringent eligibility requirements intended to distinguish the “deserving” from the “undeserving.”
Social democratic welfare regimes (e.g., Norway), often use “universalist” policies meant for everyone, regardless of income or occupation. These are “first-line” approaches, arranged so to prevent individuals from falling into destitution from old age or poor health, rather than waiting until needs are great enough to establish eligibility.37,39,42,44 Program participation is seen as a right available to everyone, rather than a benefit to be claimed only when failing upon hard times, or only for those with particular occupational histories.
All three types of welfare regimes emerged as types of “welfare capitalism”—ways to address the problem that markets as distributive institutions lack a clear mechanism for distributing income to those who neither own assets nor can engage in paid labor.37,45 Historically, corporatist welfare regimes often emerged in the setting of “statism” (efforts by central governments to encourage citizen loyalty and drain support for revolutionary movements), and strong Catholic political parties that sought to both address people's basic needs and reinforce traditional family relationships.37,46,47 Liberal regimes emerged in settings of early industrialization, relatively less organized labor movements, and political systems that allowed greater roles for business interests to shape legal arrangements.37,46,47 Social democratic regimes emerged in contexts of later industrialization that allowed for alliances between rural citizens and relatively stronger labor movements, and in economies heavily exposed to international trade, which encouraged active state management of the economy.37,46,47
More contemporarily, all of the welfare regimes have weathered neoliberal ideology as a force for change in welfare state policy, including “austerity” (reductions in public spending), privatization, and deregulation.27,48,49 However, regimes have experienced these trends differently. Such trends were perhaps most pronounced in liberal welfare state regimes, particularly where labor movements had been weakened and neoliberal ideology was embraced by center-left as well as right-wing parties.27,48–50 In countries where the political left was stronger and at least periodically in power, there was more resistance to neoliberal trends, and such countries also benefitted from path dependence of previously established institutions.44,51,52
Prior studies examining categorizations of welfare regimes using both qualitative typologies and approaches that quantitatively try to isolate specific aspects highlighted by the typologies have found that regime type is strongly associated with income distribution and poverty risk.27,38,39,41,42 In particular, social democratic and corporatist regimes are typically associated with lower poverty and more compressed income distributions than liberal regimes. Food insecurity risk increases as income decreases,53–55 so it is plausible that welfare state regimes may be associated with an individuals’ food insecurity risk. However, to our knowledge, such a relationship has not been tested. In this paper, we applied a typology of welfare regimes to a dataset of internationally comparable individual-level food insecurity data to examine the association between welfare state regime and food insecurity. We hypothesized that social democratic and corporatist welfare state regimes would be associated with lower food insecurity risk than liberal regimes.
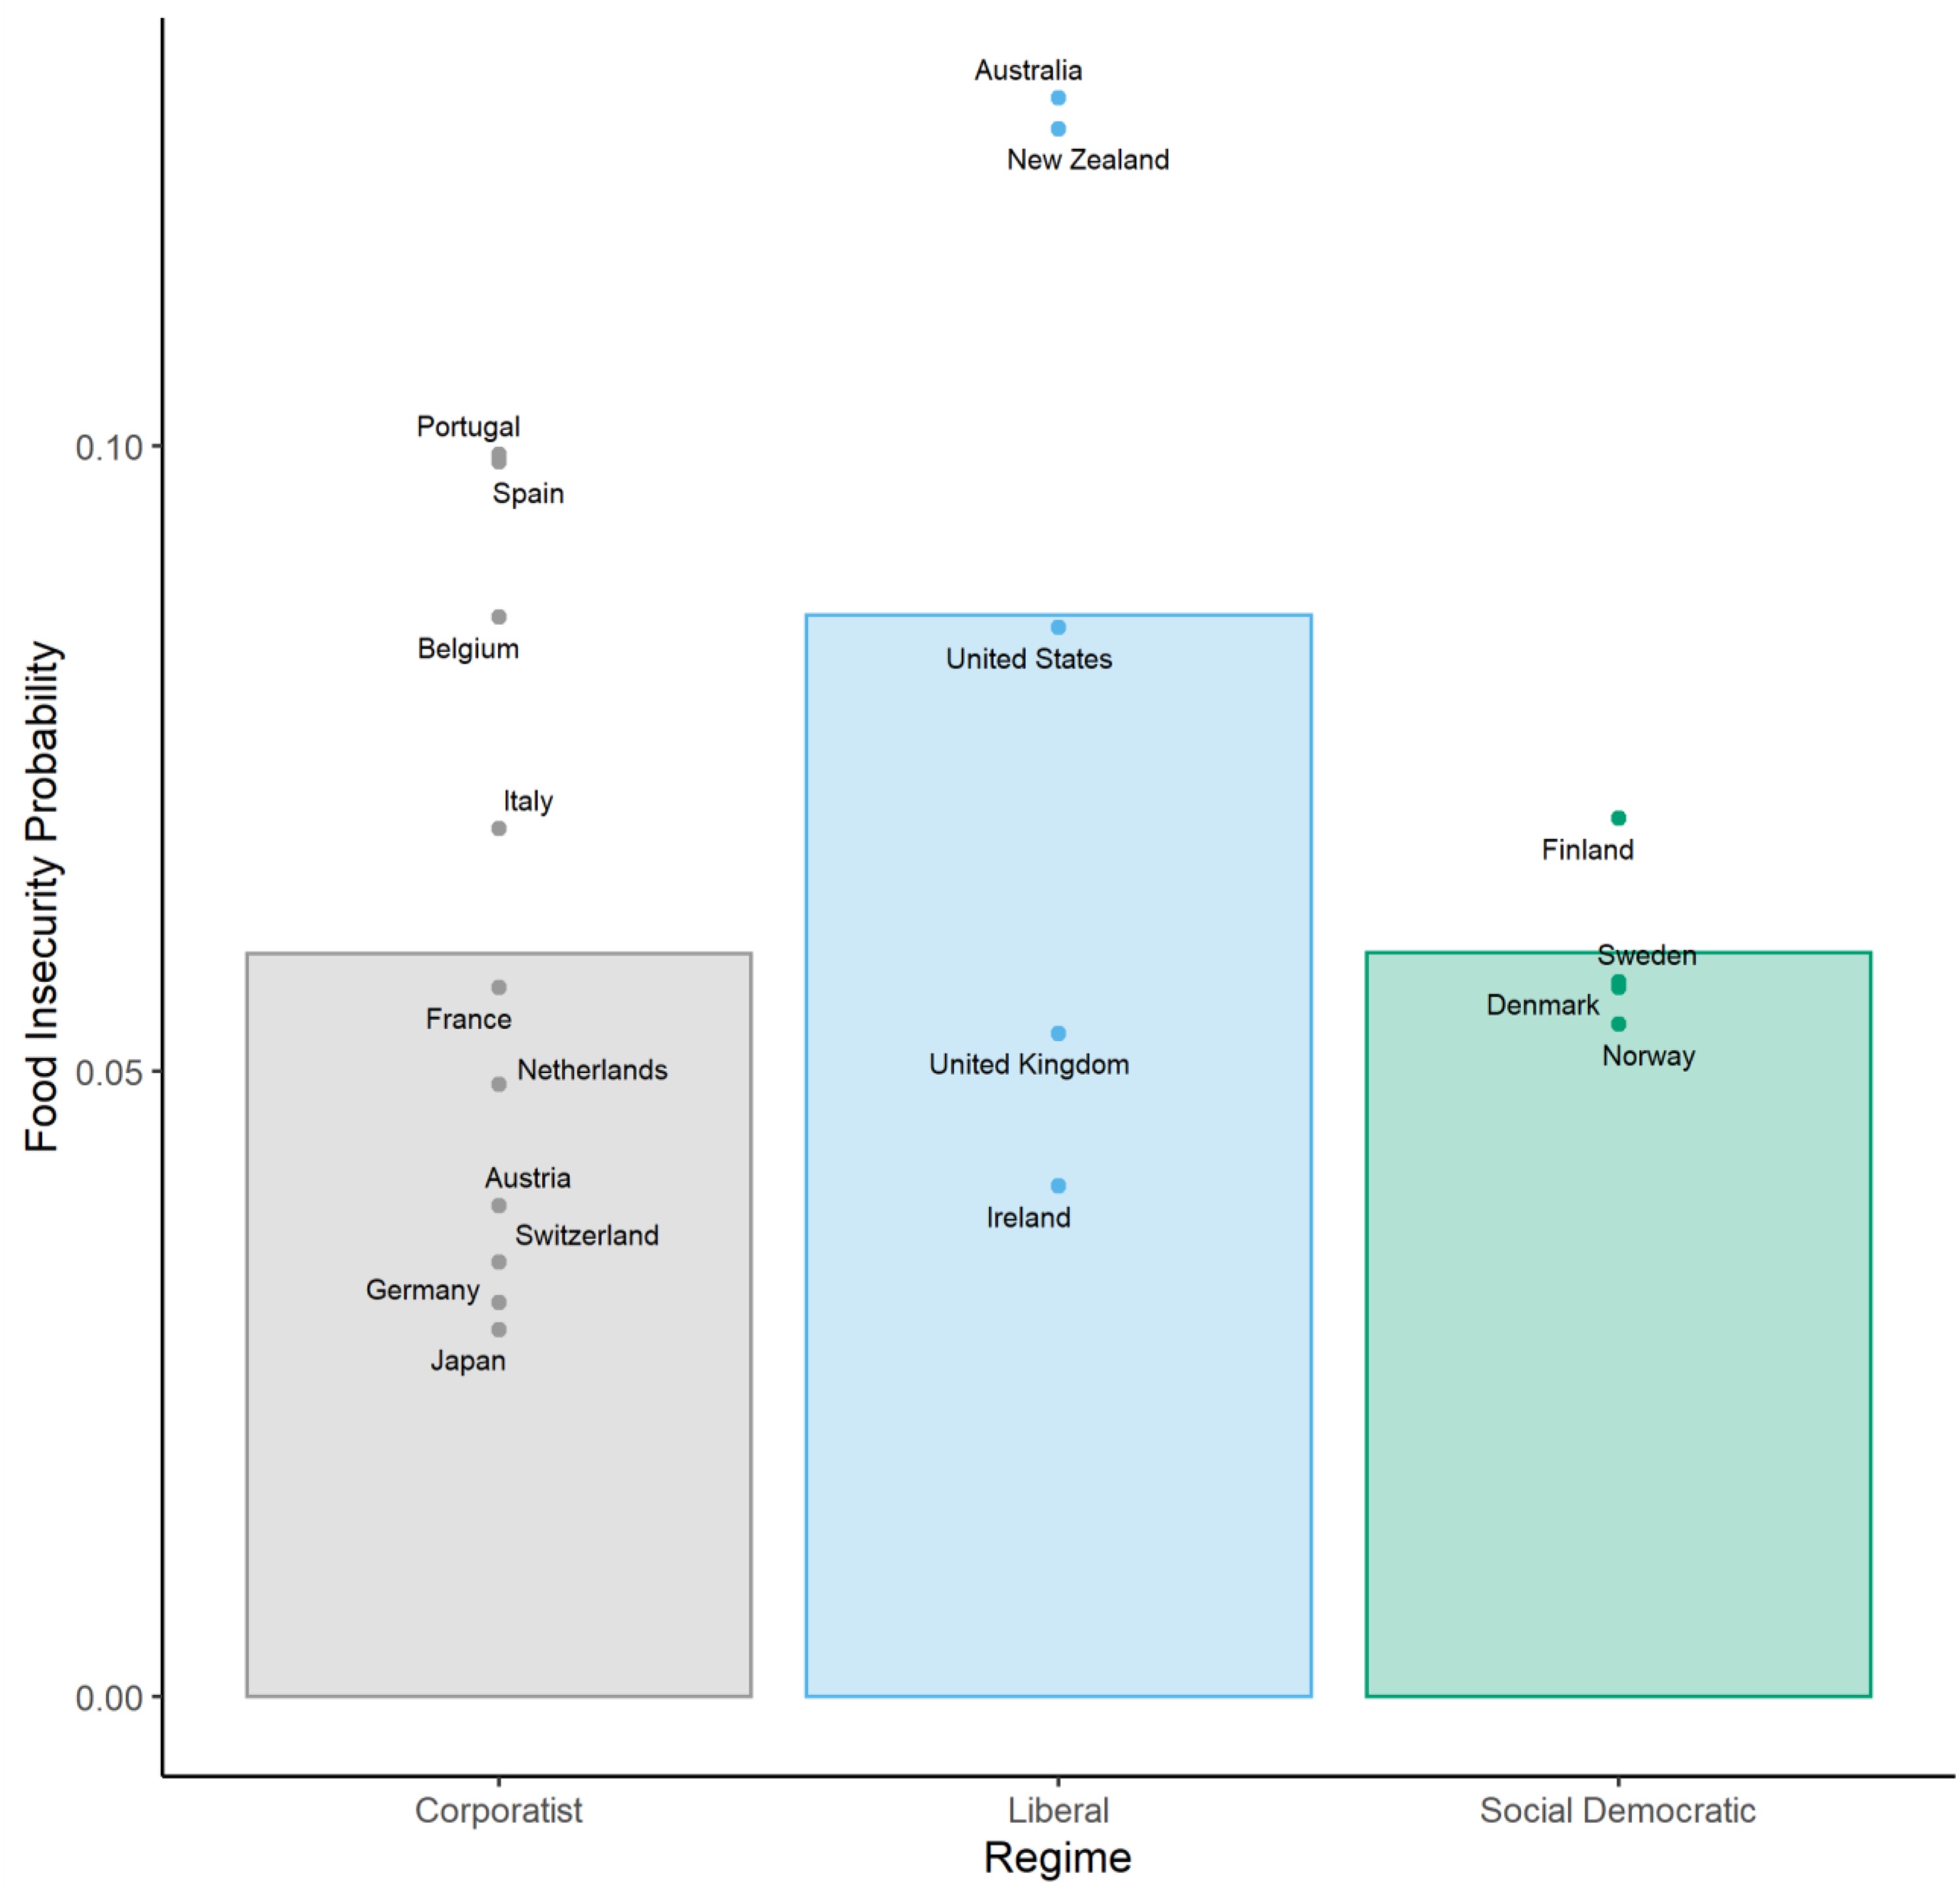
Probability of moderate or severe food insecurity by regime type
Methods
Data Sources
The primary data source for this study was an international assessment of food insecurity prevalence in different nations. 56 The Voices of the Hungry project, sponsored by the Food and Agriculture Organization (FAO) of the United Nations, assesses food insecurity to monitor progress towards U.N. sustainable development goal 2.1.2, which relates to elimination of hunger. 57 This effort undertakes food insecurity assessment in a representative sample of approximately 1,000 individuals per country in over 100 countries. Data are collected as part of the Gallup World Poll, and deidentified micro data are made publicly available. 56
For this study, we aimed to include data from 20 countries that we could categorize into one of the three welfare state regime types articulated by Esping-Anderson and the body work that followed his account27,37,41,42: Australia, Austria, Belgium, Canada, Denmark, Finland, France, Germany, Ireland, Italy, Japan, the Netherlands, New Zealand, Norway, Portugal, Spain, Sweden, Switzerland, the United Kingdom, and the United States. The justification for selecting these countries is provided in the Welfare State Regimes section.
All countries but two, the United States and Canada, had data available within the FAO dataset. For the United States, we were able to obtain equivalent data from the December supplement of the U.S. Census Bureau's Current Population Survey, which is used to report official food security statistics.1,58 For Canada, we attempted to use data from the Canadian Community Health Survey. 59 Unfortunately, public use versions of the Canadian Community Health Survey are missing information needed to harmonize its data with FAO data; consequently, we had to exclude Canada from the countries studied.
Participants in the FAO datasets are age 15 years and older. We included all participants in these datasets without exclusions. To harmonize U.S. Current Population Survey data with FAO data, we excluded individuals younger than 15 to match the FAO data. Further, because FAO datasets include approximately 1,000 individuals per country, we randomly selected 1,000 U.S. participants using the sample function within R. No other exclusions were applied.
Data from all sources covered the year 2017. This was the most recent year for which data from all countries were available while also prior to the disruption caused by the COVID-19 pandemic. Data were analyzed from November 2022 to June 2023.
The Institutional Review Board at the University of North Carolina at Chapel Hill determined that this analysis of deidentified data did not constitute human subjects research.
Welfare State Regimes
The welfare state typology used in this study takes as its point of departure the “three worlds” typology of Esping-Andersen, 37 and important re-analyses conducted 20 years on. 27 We have updated these categorizations, drawing from our synthesis of a body of work both critiquing and supporting it over the last 30 years.36,38–43,46,60 While recognizing several important concerns related to Esping-Andersen's typology, we wanted to retain three, rather than a larger number, of categories to maximize power for comparative analysis, and we do not think there has been an alternative typology that has achieved consensus. As we recognize that people may differ reasonably in their preferred typology, it is important that we state our categorizations explicitly. Included countries were categorized into welfare state regime types as follows. Corporatist: Austria, Belgium, France, Germany, Italy, Japan, the Netherlands, Portugal, Spain, and Switzerland. Liberal: Australia, Ireland, New Zealand, the United Kingdom, and the United States. Social Democratic: Denmark, Finland, Norway, and Sweden.
The welfare state typology we used in this study represents a trade-off. On one hand, the utility of welfare typologies have been demonstrated across three decades of research, and, though it is not without criticism and disagreements at the margins, there is a core of agreement across a number of classifications using both qualitative and quantitative methods.27,39,41–43 For this study, we included a set of 19 countries for which our synthesis of this literature reveals broad agreement about their classification. On the other hand, there have been a number of important critiques of this approach along with alternative typologies proposed, which are important to acknowledge. Bambra summarized many of these critiques well. 60 Two important critiques to highlight are a degree of “gender-blindness” in the typology, 60 and that its historical and sociological focus means it can be difficult to apply to countries outside the set of countries on which it was developed (which are Northern or Western European, or have historical connections to the United Kingdom, or Japan). This is partially because macro-level economic indicators alone are not sufficient to permit categorization. Therefore, we believe the findings of this study should be interpreted in a limited way, as relevant to the set of included countries while recognizing that results may not be generalizable to many of the countries of the world. We view this as analogous to an internal validity/external validity trade-off, with a smaller number of more similar countries permitting less confounded comparisons among themselves, while a larger number of more diverse countries would facilitate more generalizable results. The selection of countries in this study has emphasized internal validity, and as a particular consideration as U.S. based researchers, the selection of countries helps make the findings more informative for U.S. policy.
Food Insecurity
Food insecurity is assessed within FAO data using the eight-item Food Insecurity Experience Scale (FIES; 57,61,62). This scale is psychometrically valid and meant to measure the underlying latent construct of food insecurity. It uses statistical techniques from Item Response Theory, such as Rasch modeling, to provide comparable results across countries and times. To make comparisons across countries and cultures, the FAO fits a Rasch model within data collected within each country and year, and then equates it to a common global standard based on global results from 2014 to 2016. This approach allows for the estimation of the probability of experiencing food insecurity, based on survey results for each individual respondent. Though there are different levels of food insecurity severity, this study focused on the probability of experiencing what is termed moderate or severe food insecurity, which is the form of food insecurity monitored in U.N. Sustainable Development Goal 2.1.2. 63
The U.S. data source measures food insecurity using the Household Food Security Survey Module.1,55 This is a different instrument than the FIES, but it is similarly based on item response theory, and can produce comparable scores. The U.N. Voices of the Hungry project has previously developed methods for equating scores from the Household Food Security Survey Module to the global reference standard, which we applied here. 61 Further details of this approach are described in Supplementary Table 2.
Covariates
Our interest in this study was to examine how different welfare state regimes, which distribute income differently, relate to food insecurity. To focus on how income is distributed, not the amount of income a country has available to distribute, the primary covariate we considered was per capita gross domestic product (GDP), expressed in 2017 dollars and made comparable across countries using the purchasing power parity approach. We further considered a set of individual-level covariates available within the FAO data which may affect both political programs (and thus welfare regimes) and food insecurity risk. These were: age, gender (categorized as male or female; additional categories were not available in the datasets), education (categorized as primary only, secondary, or college and above), area of residence (categorized as urban or rural), number of adults (age 15 or older) in the household, and number of children (age less than 15 years) in the household. Equivalent variables from the U.S. data were harmonized with FAO data.
Statistical Analysis
The primary outcome used in this study was the estimated probability of moderate or severe food insecurity, estimated from a country and year specific Rasch model equated to the global reference standard. Unlike dichotomous categorizations of food insecurity, using the probability better captures the inherent uncertainty involved in measuring the underlying latent construct of food insecurity. The estimand of interest was the difference in (and, secondarily, the ratio of) the probability of moderate or severe food insecurity between welfare state regime types.
For statistical modeling, we used linear regression. As a robustness check, we repeated our analyses with fractional logistic regression. In this dataset, some probabilities statistically indistinguishable from 0 occurred, so we could not use beta regression. After model fitting, we used predictive margins to estimate the risk difference and risk ratio of the probability of moderate or severe food insecurity across regime types. All analyses were weighted using representativeness weights provided as part of the FAO data (or CPS data for the United States). The representativeness weights were representative within countries but did not try to account for differences in population size across countries. That means that analyses weight each country equally, while weighting individuals within each country differently, based on demographic characteristics, in order to be representative of the country's population. Standard errors were clustered at the country level, which represents the level of “treatment” in this study. 64
Analyses were conducted in SAS version 9.4, Stata 16.1, and R version 4.2.0. A p-value < .05 was taken to indicate statistical significance.
Results
There were 19,008 participants across 19 countries. The mean age was 47.6 years (SD: 18.6), and 51.3 percent of participants were women. Liberal welfare states typically had higher levels of education, higher rates of urban/suburban residence, and younger ages than corporatist or social democratic states (see Table 1).
Demographics.
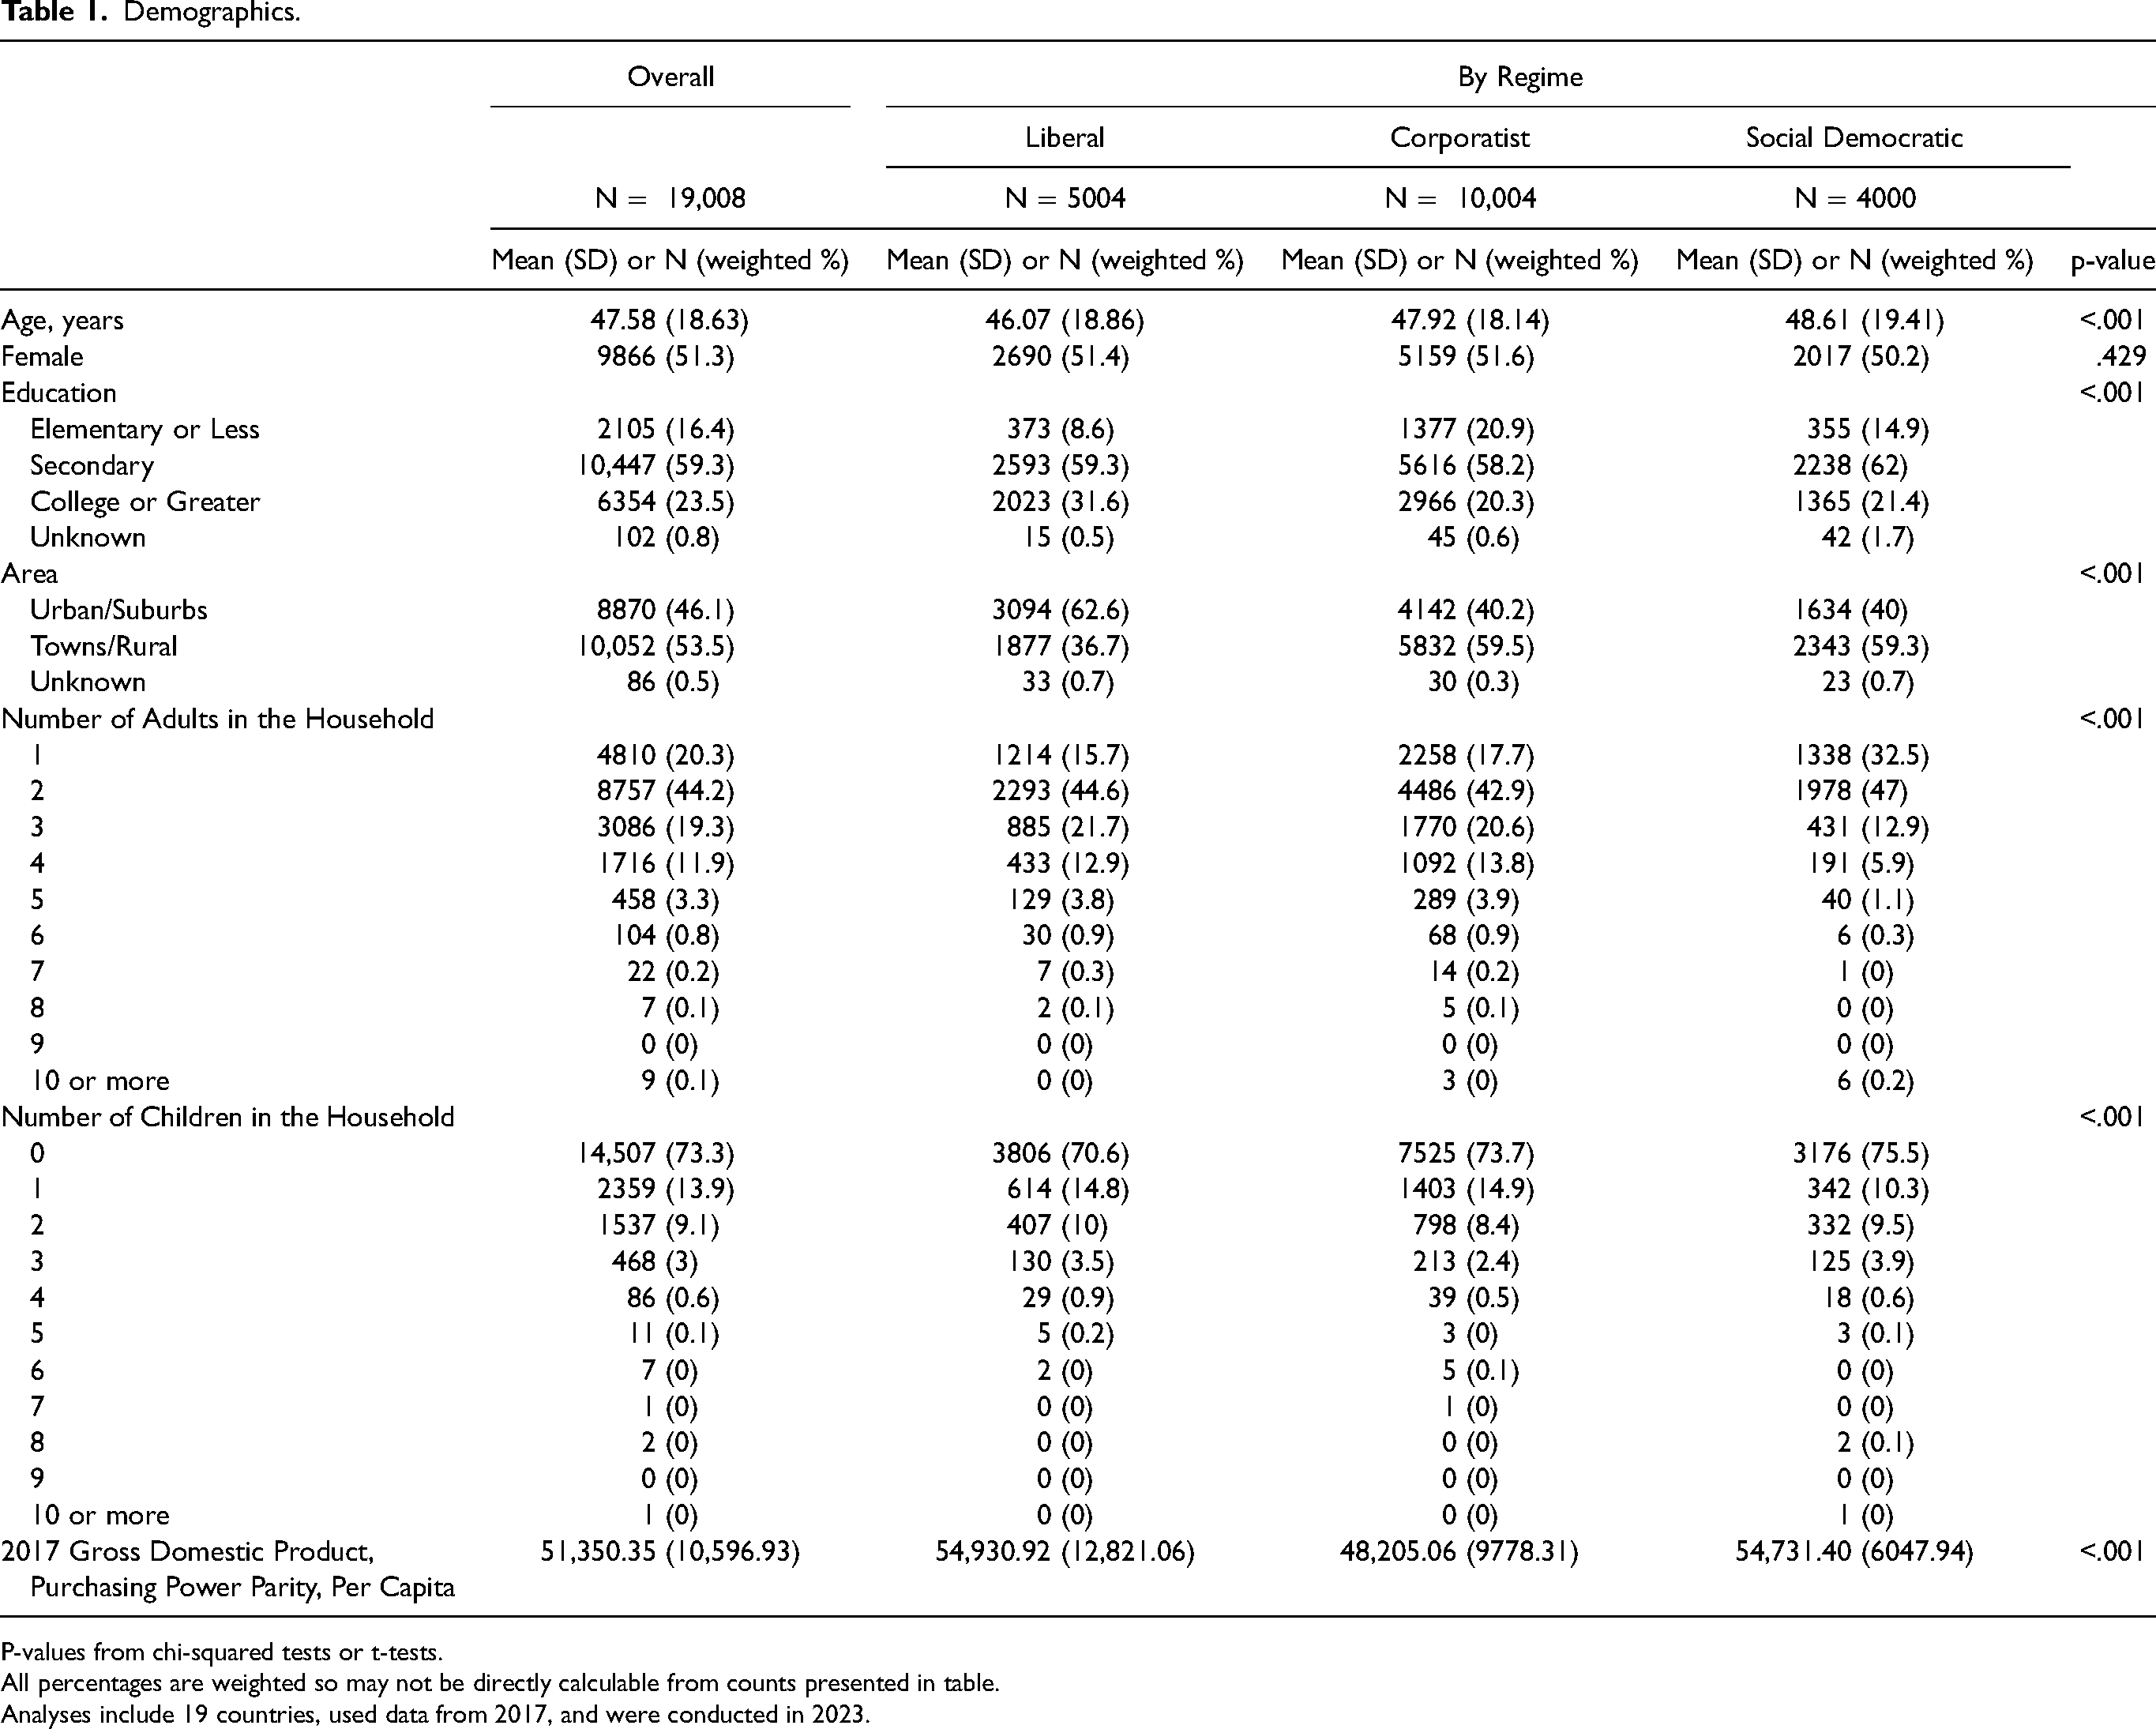
P-values from chi-squared tests or t-tests.
All percentages are weighted so may not be directly calculable from counts presented in table.
Analyses include 19 countries, used data from 2017, and were conducted in 2023.
Across the entire sample, the mean probability of an individual experiencing moderate or severe food insecurity was 0.067 (SD: 0.217) (Figure 1). In the model adjusted only for per capita GDP, there were significant differences in food insecurity probability by welfare regime type (see Table 2; full model in Supplementary Table 3). Individuals living in corporatist regimes had significantly lower food insecurity probability than those living in liberal regimes (risk difference: −0.038 in favor of corporatist regimes, 95% CI −0.068 to −0.008, p = .01), as did those living in social democratic regimes (risk difference: −0.027 in favor of social democratic regimes 95% CI −0.052 to −0.002, p = .03). In models adjusted for age, gender, education, area, number of adults in household, number of children in household, and GDP per capita, and compared with liberal regimes, the probability of food insecurity for an individual was again lower for those living in corporatist (risk difference: −0.039 in favor of corporatist regimes 95% CI −0.066 to −0.011, p = .006) and social democratic regimes (risk difference: −0.037 in favor of social democratic regimes 95% CI −0.062 to −0.012, p = .004). The adjusted model is presented in Supplementary Table 4.
Probability of Moderate or Severe Food Insecurity by Welfare State Regime.
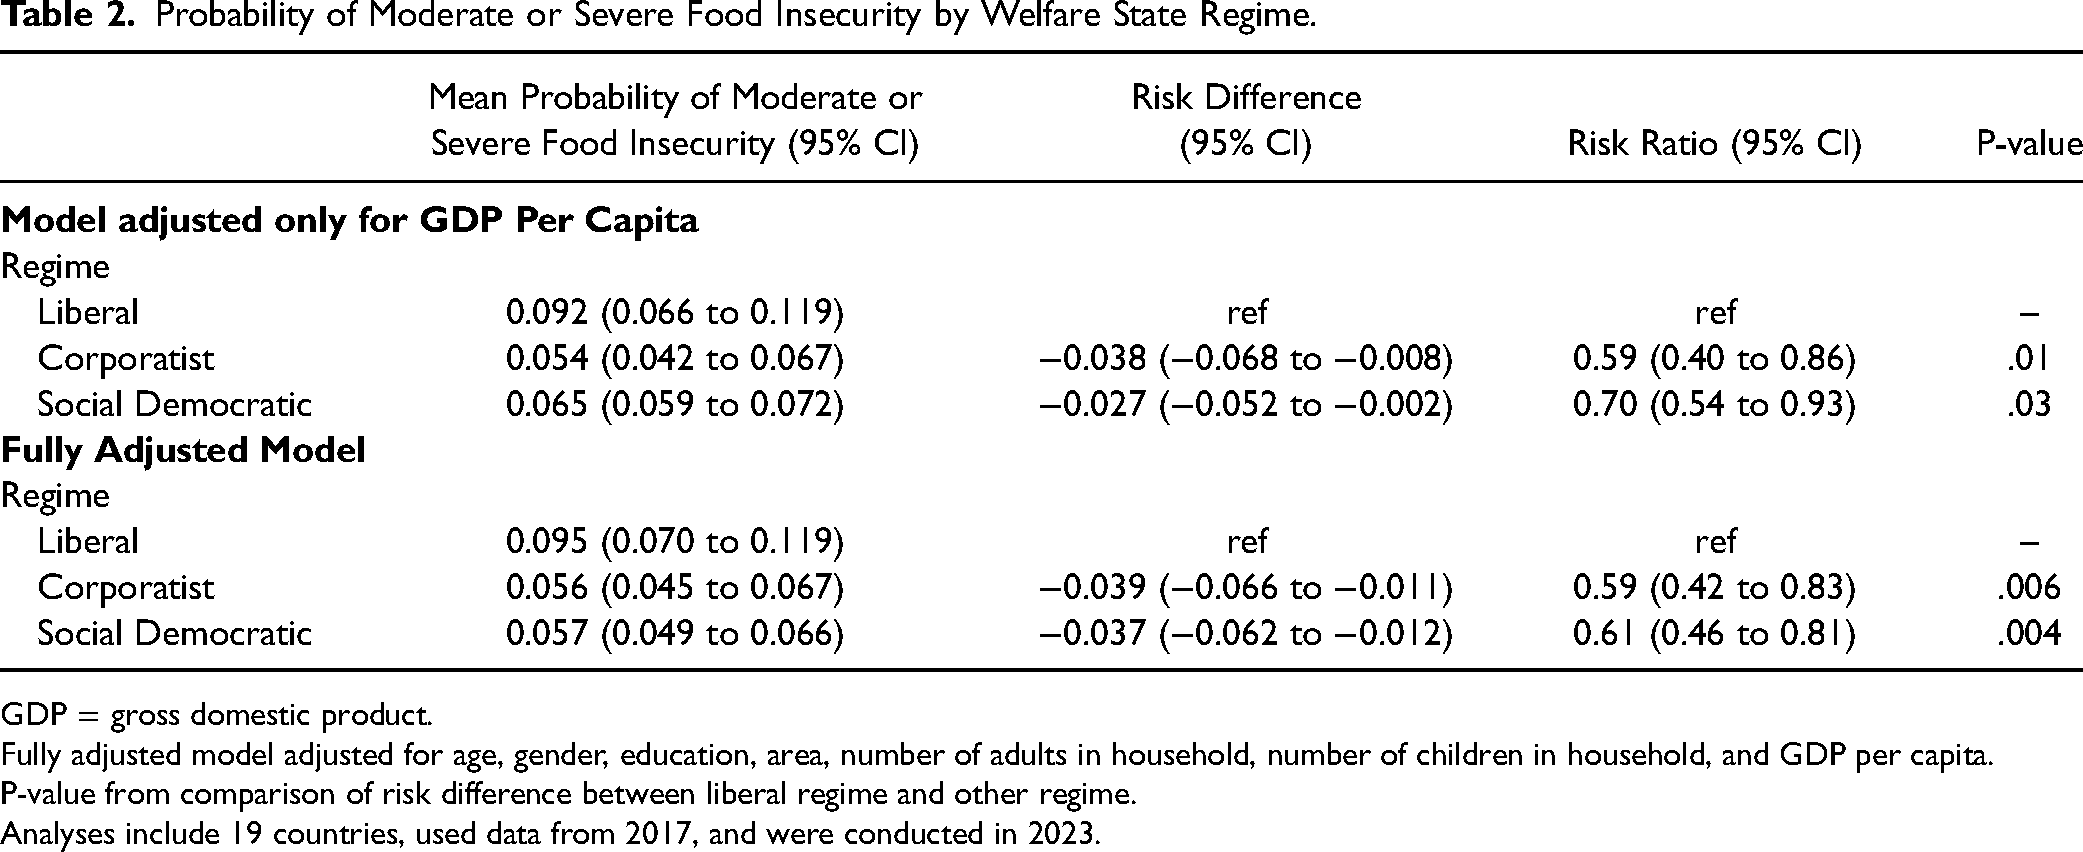
GDP = gross domestic product.
Fully adjusted model adjusted for age, gender, education, area, number of adults in household, number of children in household, and GDP per capita.
P-value from comparison of risk difference between liberal regime and other regime.
Analyses include 19 countries, used data from 2017, and were conducted in 2023.
In Table 3, we present estimates made using predictive margins 65 of how the mean probability of food insecurity for an individual might change if liberal welfare states adopted corporatist or social democratic regimes, but otherwise maintained the same demographic characteristics and GDP. Such changes are estimated to be associated with large decreases in the probability of an individual's risk of food insecurity. For example, if the United States were to adopt a social democratic welfare regime, we estimate that the mean probability of an American experiencing moderate or severe food insecurity would halve—from 0.075 (95% CI 0.055 to 0.096) to 0.038 (95% CI 0.026 to 0.050).
Estimated Probability of Moderate or Severe Food Insecurity if Liberal Welfare States Adopted Corporatist or Social Democratic Policies.
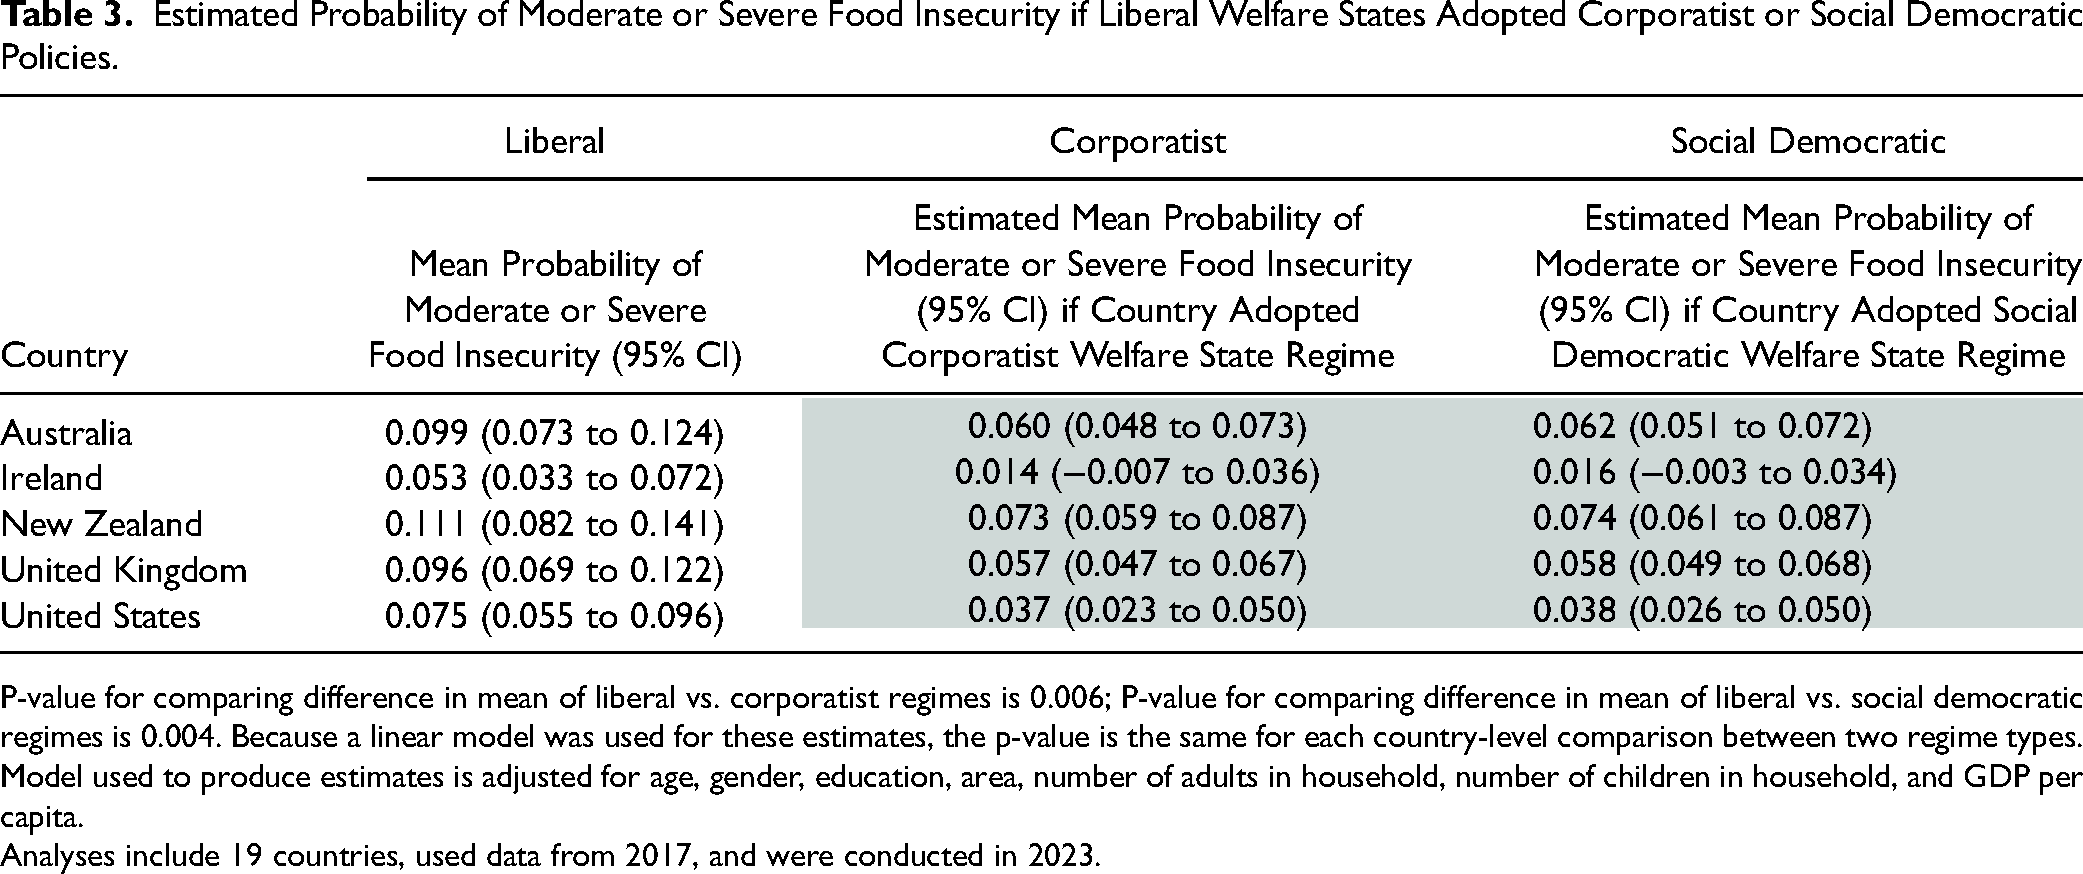
P-value for comparing difference in mean of liberal vs. corporatist regimes is 0.006; P-value for comparing difference in mean of liberal vs. social democratic regimes is 0.004. Because a linear model was used for these estimates, the p-value is the same for each country-level comparison between two regime types.
Model used to produce estimates is adjusted for age, gender, education, area, number of adults in household, number of children in household, and GDP per capita.
Analyses include 19 countries, used data from 2017, and were conducted in 2023.
In robustness checks, results estimated using fractional logistic regression were virtually unchanged from the main results (see Supplementary Table 5).
Discussion
In this study of the probability of food insecurity in 19 wealthy democratic countries, we found that the overall configuration of social policies within a country—a country's welfare regime—was strongly associated with food insecurity. Indeed, individuals living under corporatist or social democratic regimes had, on average, substantially lower probability of food insecurity than those living under liberal regimes, even after accounting for differences in individual characteristics and the GDP per capita of the countries studied. Further, we estimated that, were liberal welfare regime countries to adopt corporatist or social democratic policies, and if the relationship between welfare regime and food insecurity were causal, the probability of food insecurity for people living under those regimes would be meaningfully lower.
The results of this study are consistent with and extend those of prior studies. A number of studies have found that welfare state regime is associated with economic outcomes, such as poverty prevalence, across countries.27,38,41,42 In addition, studies of specific aspects of social policy, such as labor market policies, have found associations with food insecurity. 66 Moreover, studies of overall level of social spending, sometimes called “welfare effort,” have found that greater spending is associated with less food insecurity. 67 This study adds a holistic assessment of the connection between the policy environment and the way funds are spent with food insecurity risk. We also estimated that countries with liberal welfare regimes, such as the United States, would see substantial reductions in the probability of food insecurity if they adopted other social policies. Interestingly, the 2021 reform of the Child Tax Credit in the United States, which has since expired, was associated with reductions in food hardship among families with children of similar magnitudes to those predicted by the results of this study.68,69 The details of the 2021 Child Tax Credit reform (in particular, monthly payments and removal of income requirements) parallel child benefits commonly issued in corporatist or social democratic states, 70 a fact that provides support for the estimates of this study.
Understanding the political context in which this study's findings are applicable deserves careful consideration. The findings are most directly relevant to liberal regime countries like the United States and the United Kingdom, which have struggled with endemic food insecurity despite policy attempts to address it. 71 In the United States, for example, many commonly proposed food insecurity policies fit squarely into the liberal welfare regime framework, such as imposing stricter conditions on how food benefits can be spent, further “targeting” policies to narrow who might receive benefits, and increasing the role of private organizations in addressing food insecurity through the health care sector.72–74 Such approaches often breed unintended consequences through administrative complexity and cumbersome means testing, with those most in need of assistance often least equipped to navigate the administrative burdens. 75
Instead, drawing on the principles of universalism, broad inclusion, and public provision that are common in social democratic program design, for instance, might provide better policy guidance.39,40 Though not as directly relevant, the findings are also applicable as countries develop more income and seek to expand the scope of their welfare state.47,76
This study focused holistically on the welfare regime, but future work could (and should) seek to “unpack the black box” of these policies by identifying specific policy subsets within overall regimes that most clearly reduce food insecurity. Future work could also examine variations within regimes—for example, while Australia and Ireland are both liberal regimes, the mean probability of food insecurity varies between those countries. Similarly, prior studies of corporatist welfare regimes have suggested a Southern or Mediterranean cluster within corporatist regimes.27,77 That trend aligns with our findings, with countries like Spain and Portugal having higher food insecurity probability than other corporatist states like Germany or Switzerland.
The results of this study should be interpreted in light of several limitations. A major limitation of the typology used in this study is its focus on a narrow set of wealthy democratic countries, primarily located in Europe or with historical connections to the United Kingdom. Thus we do not think the findings of this study are readily generalizable to other countries, at least without carefully considering how contexts may differ. However, this relative similarity of the included countries does have the advantage of allowing better comparisons between the policy differences among the countries studied, analogous to emphasizing the internal validity of the study design. Further, although the welfare regime typology used has proven useful in comparative policy analysis, it is, ultimately, simply a pragmatic classification scheme, and any country likely has some policy elements consistent with each of the regimes, meaning that category membership is fuzzy rather than crisp. 27 Next, data from the United States came from a different source than other countries, and used a different instrument to assess food insecurity. Although we followed recommended practices to harmonize these data, the different data sources could affect the study results. Further, the data are cross-sectional, and do not permit assessment of causal relationships. Although it is certainly plausible that social policy could shape food insecurity risk, that suggestion cannot be directly tested in this study. Additionally, the available individual-level data had a somewhat limited set of covariates, which notably did not include data on race and ethnicity. This is relevant as the experience of racism can result in food insecurity. These limitations are balanced by several strengths. First, the study used a large dataset of international data. It harmonized the assessment of food insecurity across countries based on a Rasch model of the underlying construct, and further harmonized assessment of covariates, all during the same time frame. Further, it made use of a well-tested categorization of social policy regime types that is known to have explanatory power in other contexts. Moreover, this categorization is more nuanced than simply looking at fiscal outlays for social policy, without considering the underlying logic of the programs on which such outlays are spent.
In conclusion, this study presents evidence that welfare state regime is associated with the probability of individuals experiencing food insecurity within their country of residence. Countries in which residents have higher mean probabilities of experiencing food insecurity might consider principles of policy design used in countries with lower probabilities of food insecurity to help address the important threat to public health that food insecurity represents.
Supplemental Material
sj-docx-1-joh-10.1177_27551938231219200 - Supplemental material for Food Insecurity and Social Policy: A Comparative Analysis of Welfare State Regimes in 19 Countries
Supplemental material, sj-docx-1-joh-10.1177_27551938231219200 for Food Insecurity and Social Policy: A Comparative Analysis of Welfare State Regimes in 19 Countries by Seth A. Berkowitz, Connor Drake and Elena Byhoff in International Journal of Social Determinants of Health and Health Services
Footnotes
Declaration of Conflicting Interests
The author(s) declared the following potential conflicts of interest with respect to the research, authorship, and/or publication of this article: Berkowitz reports research grants from NIH, North Carolina Department of Health and Human Services, Blue Cross Blue Shield of North Carolina, and Feeding America, and personal fees from the Aspen Institute, Rockefeller Foundation, Gretchen Swanson Center for Nutrition, and Kaiser Permanente, outside of the submitted work. The other authors report no conflicts to disclose.
Funding
The author(s) disclosed receipt of the following financial support for the research, authorship, and/or publication of this article: Byhoff reports funding support from NIMHD through K23MD015267. Drake reports funding support from the Center of Innovation to Accelerate Discovery and Practice Transformation at the Durham Veterans Affairs Health Care System. The content is solely the responsibility of the authors and does not necessarily represent the official views of the National Institutes of Health or the Department of Veterans Affairs.
Supplemental Material
Supplemental material for this article is available online.
Author Biographies
References
Supplementary Material
Please find the following supplemental material available below.
For Open Access articles published under a Creative Commons License, all supplemental material carries the same license as the article it is associated with.
For non-Open Access articles published, all supplemental material carries a non-exclusive license, and permission requests for re-use of supplemental material or any part of supplemental material shall be sent directly to the copyright owner as specified in the copyright notice associated with the article.