
Abstract
The compatibility of filler particles with polymer strongly influences composite structure. By altering the surface chemistry of the filler using treating agents such as fatty acids or silane filler–polymer compatibility can be controlled. In this study, we employed a myriad of analytical characterization methods to systematically investigate the surface chemistry of alumina fillers after ex situ treatment with methyltrimethoxysilane (MTM) to confirm the success of treatment. Each technique provides insights from different perspectives and demonstrates that a higher treatment level was achieved as a higher amount of MTM was used, and the resultant treatment formed a uniform layer on the filler surface. Such surface treatment led to a decrease in both dispersive and polar surface energy, which plays a critical role in the control of filler–matrix interactions, and in turn the performance of final products made with such fillers. Despite the use of chemically sensitive spectroscopy tools such as secondary ion mass spectrometry and dynamic nuclear polarization nuclear magnetic resonance, the exact nature of bonding of the treating agent and alumina surface remains elusive without convincing evidence to conclude the formation of the Al–O–Si bond.
This is a visual representation of the abstract.
Introduction
The compatibility of filler particles with polymer strongly influences composite structure. Good compatibility leads to well-dispersed particles and controlled composite properties. Poor compatibility leads to particle agglomeration and property degradation. Filler–polymer compatibility can be controlled by altering the surface chemistry of the filler using treating agents such as fatty acids or silanes. The choice of treating agent depends on both the types of bonds present on the filler surface and on the desired type of interaction between the polymer and filler. Approximately matching the surface energy (SE) of the coated filler to the surface tension of the polymer is sufficient for dispersion, but there are applications where it is also desirable to create a chemical bond between the filler and polymer. In these applications, a functional treating agent is used that can be subsequently reacted with active functional groups on the polymer.
When treating filler surfaces to increase polymer–filler compatibility, one has a choice of in situ versus ex situ treatment. In situ treatment refers to the reaction between a small molecule treating agent and the filler surface in the presence of the matrix polymer. Ex situ treatment is completed in the absence of the matrix. There are advantages and disadvantages to each method. Ex situ treatment can lead to direct control of the treatment process. 1 It prevents interference with competing reactions from matrix components, and it leads to treated particles that can be used in a variety of different polymers. Another advantage to this method is that it is straightforward to measure the concentration of the treating agent present on the surface of the treated particles, allowing the treatment process to be monitored. The main disadvantage to this method is that untreated filler surfaces can be created during high-shear processing while mixing the filler into a polymer, and this can lead to inconsistent polymer–filler interactions. Another potential problem with this method is that capillary forces present in the treating phase can serve to bridge adjacent particles and thereby create unintentional agglomerates.
When performed properly, in situ filler treatment leads to particles with a consistent layer of the treating agent, even after exposure to high shear. This method can therefore result in more consistent filler–polymer interactions and better particle dispersion. One drawback to in situ treatment is that the formulation components (including the matrix polymer) compete for surface interactions. This results in different treatment kinetics and opens the possibility for chemisorption of unintended functional groups. Another disadvantage of in situ treatment is that it is often extremely difficult to evaluate the extent of treatment, as particles are contained within the matrix polymer, and therefore there are seldom straightforward methods for analyzing the filler surface chemistry.
Thermally conductive and electrically conductive composites often involve the use of conductive particles in a non-conductive polymer matrix. In these materials, conductivity relies on the creation of a percolation network of particles. Industry demand for higher performance at reasonable cost drives concurrent demand for development of more efficient thermally and electrically conductive materials, and thus also drives a desire to better understand how filler surface treatment increases polymer–filler compatibility and thereby aids in particle dispersion.
Silicones are often used as the matrix for these conductive composites, due to their high thermal stability and favorable rheological properties. Alumina and aluminum trihydroxide are often used as fillers in these materials as they provide good thermal conductivity at a price the market can bear. Silane treating agents are often applied to the surfaces of these particles using an in situ process to increase their compatibility with the silicone matrix. It is often especially difficult to monitor these filler treatment processes, as the silanes used as treating agents tend to share at least some chemical functionality with the matrix itself and are present in low concentrations at the particle surfaces.2,3
Currently, there is no well-established protocol to characterize filler surface treatment. Particle size distribution analysis based on light scattering or microscopy techniques does not provide such chemical information. Thermal gravimetric analysis may provide an amount of treating agents on the surface only if the surface area is sufficiently large but does not provide speciation information. In this study, we employed a myriad of analytical characterization methods to systematically investigate the surface chemistry of alumina fillers after treatment using the ex situ process. The absence of the polymer matrix allows for straightforward application of analytical tools, and the combination of techniques provides insights that analysis using a single technique might lack. 4 We chose to focus on the industrially relevant filler/treating agent combination of alumina–methyltrimethoxysilane (MTM) for this study. Alkyltrimethoxysilanes are often used to improve compatibility between particles and polymer matrices, as they can interact with particle surfaces through either hydrogen bonding or through the hydrolysis and subsequent condensation of SiOMe groups with M–OH groups present on the particle surfaces and can interact with low surface tension polymers through the alkyl groups. The trifunctional nature of these silane-treating agents means that they can react with themselves in addition to reacting with the particle surfaces. Under the correct conditions, this can lead to formation of the type of silicone resin network that is typically formed in a sol–gel process.
Experimental
Materials and Methods
The α-alumina (Al2O3) filler used in this study had an average Brunauer–Emmett–Teller (BET) surface area of 2.3 m2/g. Figure S1 in the Supplemental Material shows the particle size distribution, the average particle size is 1.9 μm. These values remained unchanged by the treatment. Samples were treated with MTM, CH3Si(OCH3)3, as a treating agent. The general procedure for treating included addition of 2 kg of filler into a 5 L Littleford horizontal plow mixer. Fillers were heated to 60 °C while being mixed. A treating agent was then added through an ultrasonic spray nozzle during mixing. The material was heated to approximately 100 °C under vacuum (approximately 500 mm Hg absolute pressure) for 30 min. The mixer was then cooled, and the filler was removed. Four samples were created for analysis. The first was a virgin powder (VP) control sample that was mixed and heated at the same time as other fillers with no treating agent. The second was filler mixed and treated solely with isopropyl alcohol (IPA). The third run included filler treated with a mixture of IPA and MTM close to a theoretical silane addition amount to treat the filler based on the average surface area of the filler. The fourth run consisted of only MTM at an excess amount for filler treatment. IPA was chosen as the solvent due to its compatibility with the silane and ability to remove the majority of the solvent during processing. A summary of samples created for the study and abbreviated names can be found in Table I.
Samples and treatment details.

Time-of-Flight Secondary Ion Mass Spectrometry (TOF-SIMS)
The powders were placed on double-sided tape for direct analysis by positive and negative SIMS using an IONTOF IV instrument. TOF-SIMS probes the outermost 1–2 nm of the sample surface, using a high-energy ion beam to sputter materials from the surface. The sputtered particles that obtain a charge are drawn into the mass spectrometer. Post-acquisition topography correction was used to enhance mass resolution. The total primary ion dose was low; therefore, these measurements can be considered static measurements where the sample is essentially unchanged by the primary ion bombardment during the analysis. The likelihood of resampling a previously damaged area with additional primary ion impacts is low. For mass spectrometry of the particles, the primary ion beam was operated in bunched mode to maximize mass resolution using Bi3+ projectiles with an energy of 25 keV. The ion beam raster was set to 128 × 128 pixels over 250 μm × 250 μm for 50 scans. High spatial resolution images were collected with the same primary ion beam, but not bunched. For imaging, the ion beam raster was set to 256 × 256 pixels over 100 μm × 100 μm for 75 scans. All analyses employed a low-energy electron flood gun for charge compensation.
Inverse Gas Chromatography (IGC)
Approximately 90 mg of each material was weighed into a 3 mm diameter silanized glass column between two plugs of silanized glass wool. Each sample was tapped repeatedly before and after gas pressure was applied to settle the sample bed. Each column was conditioned in the iGC-SEA (Surface Measurement Systems) instrument for 12 h (30 °C, 10 mL/min He) prior to analysis. In sequential experiments, hexane, heptane, octane, and nonane probes were injected into the column at 0.02 fractional surface coverage based on the sample mass and previously determined BET surface area values. Cyclohexane, toluene, acetone, dichloromethane, ethyl acetate, methanol, ethanol, and 2-propanol were also injected into the column at 0.02 fractional surface coverage to assess polar SE.
Probe molecule chromatographic peaks were integrated manually in the SEA Analysis program (v.1.4.3.0) and their retention times were converted to net retention volume using two methane injections as a dead marker. Using the alkane probe injections, the SE was calculated for each surface coverage level using the Schultz method 5 and the peak center of mass. Using all of the previously described polar probes, the polar components of the SE were calculated using the Van Oss method and the Della Volpe scale. 6
Scanning Electron Microscopy Energy Dispersive Spectroscopy (SEM-EDS)
The alumina VP and alumina R4 samples were placed on carbon tape-coated SEM stubs and analyzed without coating using a Hitachi SU8230 field emission SEM. Instrument operating conditions for SEM imaging: 2 kV accelerating voltage, aperture 4, secondary electron images captured using the lower detector. Operating conditions for EDS mapping: 5 kV accelerating voltage, aperture 0, Bruker XFlash FlatQUAD EDS detector, ∼120 kcps count rate.
Magic Angle Spinning Dynamic Nuclear Polarization Nuclear Magnetic Resonance (MAS DNP NMR)
The MAS DNP NMR experiments were performed using a Bruker Avance III 400 MHz wide-bore spectrometer, equipped with a triple resonance 3.2 mm low-temperature DNP MAS probe operating at 100 K. The samples were irradiated with continuous wave high-power microwaves at a frequency of 263 GHz, with power stability better than ±1%. The microwaves were generated by a gyrotron and delivered to the sample by a corrugated waveguide with ≈22 W of power reaching the sample. The microwave power was optimized to obtain maximum enhancement for each sample. Then 3.2 mm sapphire rotors were used for optimal microwave penetration. A Teflon insert and zirconia cap were used for sealing and spinning the rotor. The MAS rate was set to 8 kHz for all experiments. The 1H one-dimensional (1D) spectra were recorded with a Hahn echo pulse sequence using a proton 90° pulse of 2.5 ms. 1H T1 was measured using saturation recovery for each sample. For the 1H-29Si cross-polarization experiment, the delay time was set to 1.3 times proton T1 for optimum polarization transfer with a 6 ms contact time.
Attenuated Total Reflection Fourier Transform Infrared spectroscopy (ATR FT-IR)
Attenuated total reflection (ATR) was carried out on a Nicolet iS50 spectrometer equipped with a deuterated triglycine sulfate detector. A small amount of the sample was placed on top of the ATR crystal (single bounce Diamond) and pressed using a clamp to achieve a good signal. Spectra were collected with the following parameters. A total of 64 scans were performed in the spectral range of 4000–400 cm–1 with a resolution of 4 cm–1.
Results and Discussion
Attenuated total reflection (ATR) FT-IR was first used to gain a crude estimation of the surface treatment level. The spectra of the four samples are overlaid in Figure 1, with the two insets showing the enlarged view of the OH stretching region around 3600 cm–1 and methyl bending region around 1260 cm–1. The OH stretch region exhibited similar OH absorbance consistent with aluminum monoxide (AlOH), presumably from the alumina surface OH groups. 5 No significant differences were observed among the four samples in the AlOH stretching region, indicating that the majority of them remained unreacted. A very weak peak was observed around 2960 cm–1 from the SiMe CH stretching mode. The same functional group also gave rise to the 1260 cm–1 peak for its CH bending mode. Its peak intensity demonstrates that R4 has more SiMe than R2 while the R0 and VP samples showed negligible absorbance. The starting MTM also shows a strong absorbance peak from the SiOMe group around 2845 and 1190 cm–1 (Figure S2, Supplemental material), but no such peaks were observed in R2 and R4, indicating that most of the SiOMe groups have reacted, though there is a chance that the hydrolysis reaction occurred during sample handling and storage. Such ATR FT-IR results support that some of the treating agents remained on the surface, but it is challenging to obtain more detailed speciation information such as whether condensation reactions occurred between the MTM groups.
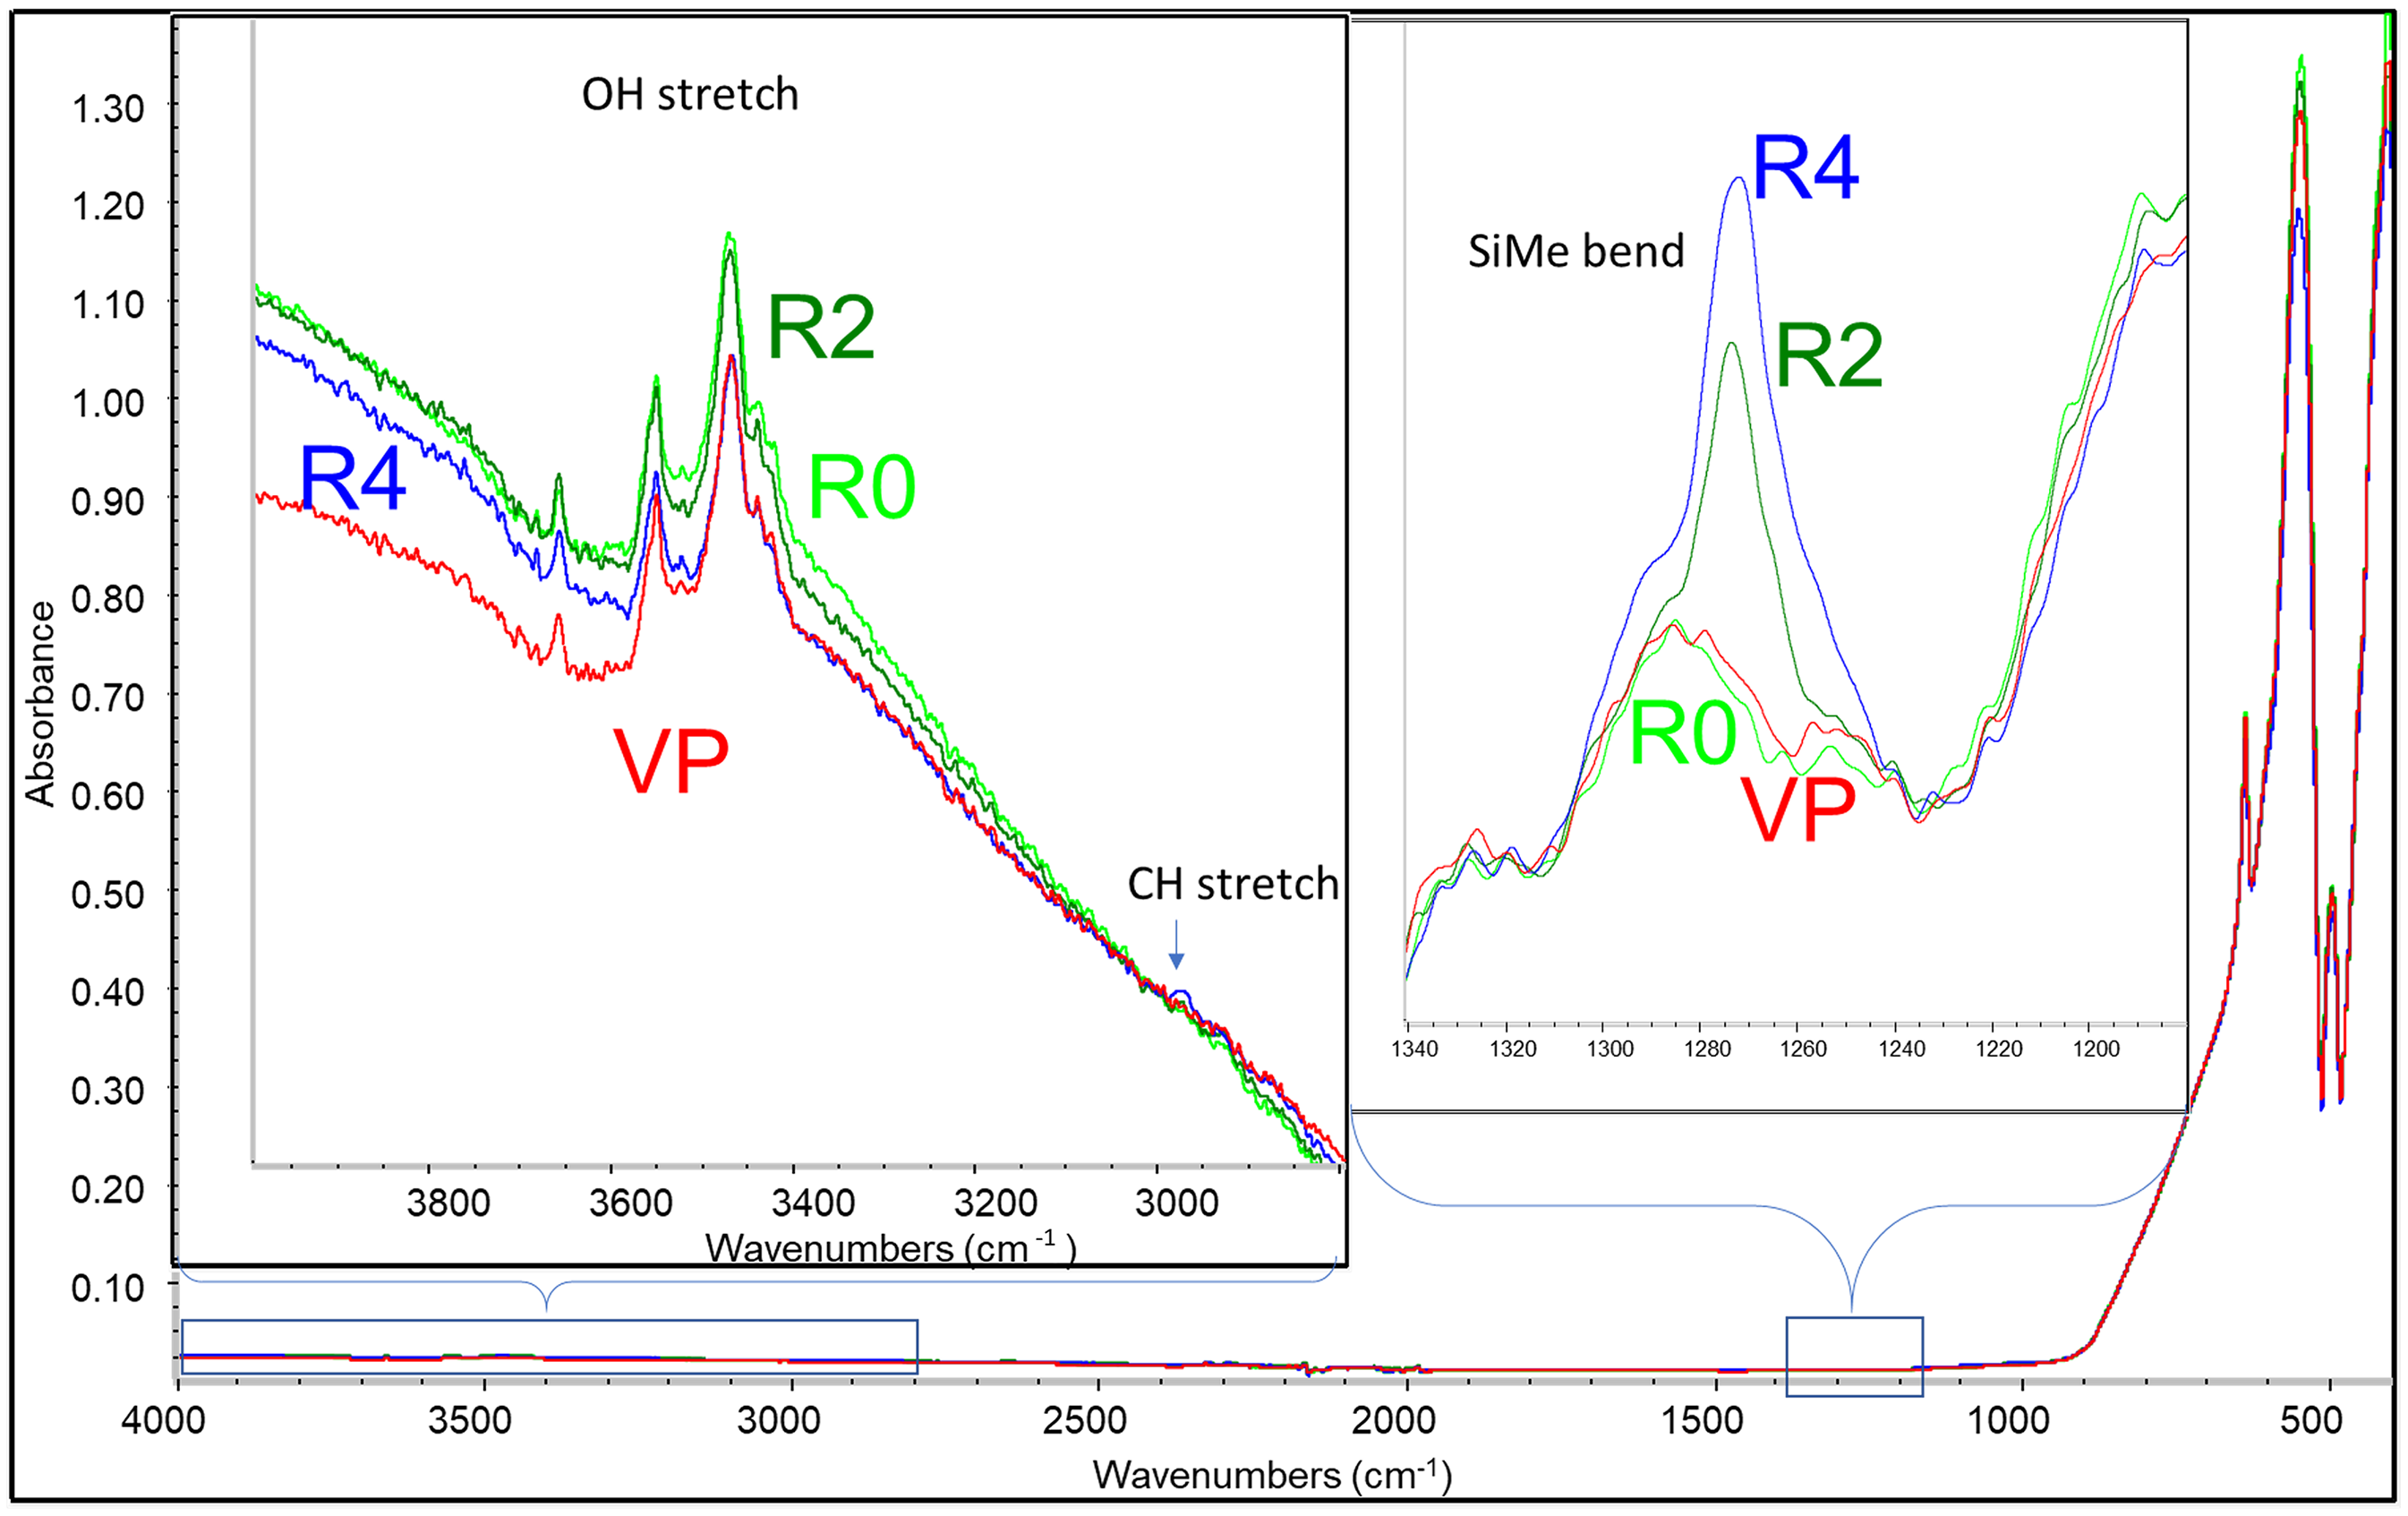
Overlaid ATR FT-IR spectra of the four samples. The two insets show the spectral differences at regions of interest.
Secondary ion mass spectrometry (SIMS) was utilized due to its higher surface sensitivity and potential to get more insights into speciation. Positive and negative SIMS spectra from the alumina particles contain several Si-containing peaks associated with the MTM surface treatment. Figure 2 shows selected regions of representative positive ion SIMS spectra from the alumina fillers highlighting fragment ion peaks due to the MTM filler treating agent. Relative to adjacent peaks, the intensity of the ions associated with MTM, including Si+, SiCH3+, and SiOCH3+, are clearly more intense for the treated samples (R2 and R4) compared with the untreated samples (VP and R0). A similar trend was observed for a peak due to AlSiO+ and several negative fragment ions including Si–, CH3O–, SiO2–, and SiO2CH3– (Figure S3, Supplemental Material). It is tempting to cite the AlSiO+ ion as evidence of direct bonding between Al and Si through an O atom (Al–O–Si).7–10 While it is reasonable to expect this ion should be more prominent when Al–O–Si bonding has occurred, Marcoen et al. 11 have convincingly shown that for steel surfaces with silane treatments, both hydrogen-bonded and covalently bonded organosilanes contribute to the FeSiO+ peak intensity. It seems likely the analogous ion can form from treated Al surfaces, leaving the question of direct bonding unanswered. Ion images produced from the treated alumina particles (not shown) indicate essentially uniform coverage of the silane on the alumina surfaces with an image resolution of about 400 nm.

Selected regions of representative positive ion SIMS spectra from the alumina fillers highlighting fragment ion peaks due to the MTM filler treating agent.
The higher spatial resolution of SEM-EDS was used to answer whether self-condensation of the MTM would lead to formation of a separate T-resin phase.
Condensed resins are observed fairly regularly in silicone production processes and can be observed in SEM-EDS mapping experiments. In the materials examined in Figure 3, both the VP and R4 samples were found to contain some Si (nominally present as SiO2). This corroborates the SIMS results that showed Si in the VP sample. In both the VP and R4 samples, observation of concentrated regions of Si was rare. There was no indication that there were significantly more of these regions in the R4 sample, consistent with the interpretation that silane self-condensation does not create nanoscale-to-microscale domains of resin in these materials which were previously observed in other systems.12,13

Scanning electron microscopy energy dispersive spectroscopy (SEM-EDS) maps of untreated and MTM-treated alumina demonstrate that there are no domains of resin present from self-condensation of MTM.
To further understand the impact of treatment on the alumina surface, IGC interrogation of dispersive and polar SE was performed. As seen in Figure 4, the dispersive (red) and polar (blue) SEs were virtually unchanged upon filler mixing (VP versus R0) and moderately decreased upon surface treatment (R2). Intriguingly, treatment with an excess treating agent (R4) significantly reduced both the dispersive and polar SE (31.3 and 7.8 mJ/m2, respectively). Prior analyses of silanized mannitol on this iGC-SEA platform instrument indicated that dispersive surface energies between 30 and 35 mJ/m2 are typical for materials with near-complete surface silylation (data not shown). However, surface treatment often generates a nonlinear reduction in the measured SE as surface treatment preferentially occurs at more energetic surface sites and IGC cannot readily discriminate between physisorbed and chemisorbed treating agents. 14 As such, these values are best viewed as qualitative measures of relative treating agent deposition onto the surface and not a true quantitative measure of chemisorption.

Dispersive (red) and polar (blue) surface energies of samples determined using IGC.
To gain a further understanding of molecular bonding and speciation, we attempted to use solid-state NMR but found a poor signal-to-noise ratio despite using a 4 mm rotor and data acquisition time spanning over two days. A broad signal centered at −60 parts per million (ppm) was barely recognizable from noise in the acquired spectrum. We therefore decided to use DNP NMR, which has been demonstrated to offer orders of magnitude improvement in the signal-to-noise ratio. 15 DNP has been a particularly impactful method for characterization of surfaces and interfaces. Sample preparation was the first step toward using DNP NMR. Commonly used polarizing agents for intermediate magnetic fields (9.4 T), TEKpol and AMUPol were tested. The solvent mixture was also optimized in the interest of DNP enhancement factors. Samples are exposed to paramagnetic species (organic radicals) using an established method called incipient wetness impregnation (IWI). 16 In several tested solvents, the powdered samples were quite difficult to impregnate due to either hydrophobic tendency or partial solubility. An optimized polarizing solution containing 15 mM TEKpol in a partially deuterated tetrachloroethane TCE-d2/TCE (90/10) was used for the IWI of all samples listed below. Additional samples were added to test the feasibility of characterization in more diluted systems. The additional samples were: R5, a physical blend of 80 wt% R4 mixed in 20 wt% polydimethylsiloxane (PDMS); R6, the same alumina treated in situ with MTM in the presence of PDMS; and R7, alumina treated in situ in the presence of PDMS only.
The efficiency of hyperpolarization is commonly measured by the ratio of NMR signal intensity with microwave on (i.e., with DNP effect) to that with microwave off. The NMR signal intensity without microwave still benefits from thermal enhancement due to low temperature at 100 K. Moderate enhancements amounting to over 100 were obtained on protons of solvent TCE. The efficiency of polarization transfer to 29Si was not quantified due to unreasonably long measurement times. The signal quality with DNP enhancement was so poor that a 29Si experiment without a microwave (i.e., without DNP) was not attempted. The low quality of 29Si NMR spectra (Figure 5) is due to the scarcity of 29Si species in the samples. Varying measurement times are used coincidentally to optimize the level of information gathered per sample. Sample change is done manually on the instrumentation; therefore, some experiments are run longer to take advantage of signal accumulation overnight.

1H-29Si cross polarization DNP NMR spectra of R2, R4, and several control samples (R5, R6, and R7) along with vertically enhanced spectra corresponding to R5, R6, and R7 overlaid in gray to facilitate visibility of smaller peaks. All spectra are acquired with a MAS rate of 8 kHz, contact time of 6 ms, and delay time of 4 s. Experimental times are indicated and color-coded indicated. Noteworthy features are highlighted and numbered to assist interpretation.
In Figure 5, the peak at −57 ppm (labeled 3) is the prominent feature in the two topmost 29Si spectra corresponding to R2 and R4 (alumina filler treated with MTM and IPA; and MTM only respectively). In a physically mixed sample of R4 in PDMS (labeled R5), the 29Si spectrum is dominated by PDMS. In situ treatment employed in sample R6 resulted in spectral features similar to ex situ treated R4. This feature is clearly present in R2, R4, and R6, where MTM is involved in the filler treatment. The position and shape of this peak in ex situ and in situ treated filler indicate similar Si species are formed by these two methods. It is to be noted that the 29Si chemical shift of pure MTM is at about −40 ppm. 17 Rankin et al. 18 demonstrated that in Si-γ-Al2O3 materials, the 29Si chemical shift values decrease with an increasing number of Al neighbors to Si. Intuitively, this signal at −57 ppm can be assigned to MTM-treated alumina where the 29Si chemical shift is affected by the vicinity of Al. Whether or not this signal originates from an Al–O–Si covalent bond cannot be concluded solely based on 1D NMR spectra.
A weak signal at −87 ppm (labeled 4) became discernable in the 29Si NMR spectrum of R2 after 4.5 h of acquisition time (data not shown) therefore a longer (19 h) measurement was done to conclude that the signal builds up over time. A combination of density functional theory and DNP NMR by Valla et al. 19 has shown the occurrence of a 29Si signal between −83 and −93 ppm due to hydrogen bonding interactions. The fact that sample R2 treated with MTM and IPA contains –OH functionality makes this assignment plausible. 20 Therefore, the signal labeled 4 at −87 ppm is tentatively assigned to Si species influenced by hydrogen bonding in the presence of –OH groups.
Another intense signal present at −25 ppm (labeled 2) can be radially assigned to repeating D units of PDMS used in in situ treatment. 21 In the 29Si spectrum of R6, this peak is inexplicably shifted to −21 ppm. A unique feature at −9 ppm (labeled 1) can be observed in the 29Si NMR spectrum of sample R5 which can be assigned to MOH end groups of PDMS in this physical blend of MTM-treated alumina and PDMS. 22 While inferences about the effect of MTM treatment can be made from DNP NMR characterization, the proof of Al–O–Si linkage remains elusive in the light of acquired 1D data.
Conclusion
A myriad of analytical techniques were employed to characterize gaseous MTM-treated alumina to confirm the success of treatment. Each technique provides insights from a different perspective and demonstrates that a higher treatment level was achieved as a higher amount of MTM was used, and the resultant treatment formed a relatively uniform layer on the filler surface. Such surface treatment led to a decrease in both dispersive and polar SE, which plays a critical role in controlling filler–matrix interactions, and in turn the performance of final products made with such fillers. Despite the use of chemically sensitive tools such as SIMS and DNP NMR, the exact nature of bonding of the treating agent and alumina surface remains elusive without convincing evidence to conclude the formation of the Al–O–Si bond.
Supplemental Material
sj-docx-1-app-10.1177_27551857251320661 - Supplemental material for Surface Characterization of Methyltrimethoxysilane-Treated Alumina Particles
Supplemental material, sj-docx-1-app-10.1177_27551857251320661 for Surface Characterization of Methyltrimethoxysilane-Treated Alumina Particles by Xiaoyun Chen, Paul Vlasak, Paul Hutchins, Monu Kaushik, Jeremy Beebe, Kelly Krzysik and Kevin Kellogg in Applied Spectroscopy Practica
Footnotes
Declaration of Conflicting Interests
The authors declared no potential conflicts of interest with respect to the research, authorship, and/or publication of this article.
Funding
The authors received no financial support for the research, authorship, and/or publication of this article.
ORCID iDs
Supplemental Material
All supplemental material mentioned in the text is available in the online version of the journal.
References
Supplementary Material
Please find the following supplemental material available below.
For Open Access articles published under a Creative Commons License, all supplemental material carries the same license as the article it is associated with.
For non-Open Access articles published, all supplemental material carries a non-exclusive license, and permission requests for re-use of supplemental material or any part of supplemental material shall be sent directly to the copyright owner as specified in the copyright notice associated with the article.