
Abstract
This study assessed knowledge and awareness of developmental dyscalculia among education professionals in the UK, Italy, Vietnam and South Africa, using the newly developed Dyscalculia Knowledge and Awareness Scale (DKAS). In total, 1323 educators responded to the DKAS as well as questions relating to their job roles, level of experience, and training received in supporting pupils with dyscalculia and dyslexia. Overall, most educators were familiar with the concept of dyscalculia, but only 33% reported that they had a clear idea about it. Responses to the DKAS also revealed several knowledge gaps and misconceptions. Our study also documented the low availability of training in dyscalculia, with most educators not receiving any relevant training. Higher levels of education, working in specialist inclusion and support roles, and access to relevant training were positively related to knowledge and awareness of dyscalculia. These findings have important implications for research, teacher education and education policy.
Keywords
Developmental dyscalculia (DD) is a common neurodevelopmental condition that emerges in the early years of schooling and affects the acquisition of mathematical skills (APA, 2013). Prevalence estimates suggest that around 3–6% of children may be affected (Geary, 2004; Haberstroh & Schulte-Körne, 2019; Morsanyi et al., 2018). This means that approximately one in twenty children will likely experience symptoms of dyscalculia, which often co-exists with other neurodevelopmental conditions, such as dyslexia (e.g. Luoni et al., 2023) and Attention-Deficit/Hyperactivity Disorder (ADHD) (e.g. Polanczyk et al., 2014). Earlier diagnostic frameworks on dyscalculia primarily focused on impairments in arithmetic skills. However, more recent guidance – such as the Diagnostic and Statistical Manual of Mental Disorders, Fifth Edition (DSM-5) (APA, 2013) and the International Classification of Diseases – Eleventh Edition (ICD-11) (WHO, 2022) highlights a broader range of difficulties, encompassing challenges with the memorisation and recall of number facts, arithmetic fluency, mathematical reasoning and numerical processing (Desoete, 2008; Landerl et al., 2021; Morsanyi et al., 2018; Roulstone et al., 2024; Simms et al., 2016; Träff et al., 2017). Alongside these diagnostic shifts, theoretical perspectives have also begun to evolve. Earlier conceptualisations of dyscalculia focused on a core deficit in understanding sets and numerosity (e.g. Butterworth et al., 2011), whereas contemporary accounts also highlight the role of domain-general cognitive processes (e.g. Bugden & Ansari, 2016; Mammarella et al., 2021). Given these developments, it is important that educators remain informed about the current diagnostic guidance and theoretical frameworks to assist them with the identification of learners with dyscalculia, so that they are able to implement appropriate support strategies and interventions (Gross-Tsur et al., 1996; Reigosa-Crespo et al., 2011; Shalev, 2004; Stark et al., 2016). This is particularly important given that dyscalculia remains less widely recognised than other neurodevelopmental conditions (such as dyslexia, autism or ADHD), and it is frequently undiagnosed (e.g. Morsanyi et al., 2018).
The aim of our study was to deepen the understanding of educators’ knowledge and awareness of dyscalculia, including common misconceptions and knowledge gaps in training related to neurodevelopmental conditions. While a growing body of research has begun to investigate educators’ familiarity with dyscalculia (e.g. Akça & Akgün, 2024; Armstrong-Gallegos et al., 2023; Chideridou-Mandari et al., 2016; Dias et al., 2013; Kunwar and Sharma, 2020; Mutlu, 2022; Sousa et al., 2017; Van Hervegen et al., 2024), this literature remains relatively limited and varied in scope. Two recurring challenges are the low sample sizes and the diversity in the quality and validation of the study materials. With regard to sample sizes, several studies were conducted with less than 100 participants (e.g. Graves et al., 2018; Neville, 2012), while studies with larger sample sizes (i.e. over 300 educators) are rare (although see Kunwar et al., 2021; Mekonnen, 2023; Mutlu, 2022; Satybaldy, 2022). This also means that studies are often restricted to specific geographical regions, so may not always represent the broader population of the country where the study was conducted (Dias et al., 2013; Fu & Chin, 2017; Graves et al., 2018; Neville, 2012; Sezer & Akin, 2011). In terms of the quality of study materials, most studies have used self-designed questionnaires. These materials often lack external validation of the questions assessing educators’ knowledge (e.g. no reliability measures were reported in Chideridou-Mandari et al., 2016; Dias et al., 2013; Fu & Chin, 2017; Karasakal, 2018; Mutlu et al., 2022). These methodological considerations highlight the need for more robust, scalable and psychometrically sound approaches to investigating educators’ understanding of dyscalculia.
With regard to contradictions in this literature, some studies reported significant misconceptions and a lack of familiarity with dyscalculia among educators (e.g. Akça & Akgün, 2024; Armstrong-Gallegos et al., 2023; van Herwegen et al., 2024), while others suggested that educators were reasonably familiar with dyscalculia (Chideridou-Mandari et al., 2016; Sousa et al., 2017). Contradictory findings have also emerged in relation to the effect of some demographic factors on educators’ knowledge about dyscalculia. For example, several studies reported a positive association between years of teaching experience and awareness of dyscalculia (Dias et al., 2013; Kunwar & Sharma, 2020; Mekonnen, 2023), whereas other studies did not find such a relationship (Albina, 2019; Chideridou-Mandari et al., 2016; Sousa et al., 2017). These contradictions may partially stem from methodological differences between the studies and the country and setting where data collection took place. Indeed, existing studies have employed a range of data collection methods, including online and paper-based survey instruments and semi-structured interviews (Sousa et al., 2017). It is also notable that most studies on this topic have been conducted in Asia (e.g. Albina, 2019; Fu & Chin, 2017; Kunwar, 2023). Additionally, more research on dyscalculia has been conducted with educators in primary settings (Albina, 2019; Dias et al., 2013; Fu & Chin, 2017; Karasakal, 2018; Kunwar, 2023; Neville, 2012; Sousa et al., 2017) than in secondary settings (Akça & Akgün, 2024; Chideridou-Mandari et al., 2016; Kunwar & Sharma, 2020; Mekonnen, 2023; Mutlu, 2022; Satybaldy, 2022).
The current study
To address the limitations of existing research on educators’ knowledge of dyscalculia, we conducted a large-scale study with education professionals from four countries across three continents (the UK, Italy, Vietnam and South Africa). By engaging educators from four countries, we aimed to examine both cross-national variation and shared patterns in dyscalculia-related knowledge gaps, misconceptions, demographic influences and access to dyscalculia-specific and dyslexia-specific training. It is important to note that the qualifications required to train as a teacher or be employed in an education setting vary internationally. Whilst some countries require a degree or higher qualification to work in the education sector, others have different entrance requirements and pathways to achieving qualified teacher status. Starting ages for formal schooling also vary across the UK, Italy, South Africa and Vietnam, reflecting differences in educational policy and cultural expectations. In the UK, children typically begin school at age 4 or 5, one of the earliest starting ages globally. In Italy, compulsory education starts at age 6. South Africa also mandates school entry at age 6, although many children attend Grade R (Reception) at age 5. In Vietnam, children usually start primary school at age 6, following a year or more of preschool. Job roles and leadership structures also differ across countries. Overall, while the role of a Special Educational Needs Co-ordinator and specialist inclusion teachers exists in all four countries, the specific responsibilities and frameworks may differ based on the educational policies and practices of each country. To make our study more representative and to be able to investigate potential differences in dyscalculia knowledge and awareness across job roles, we made sure that we recruited educators across all job roles (including leadership roles, such as headteachers, and support roles, such as teaching assistants, as well as teachers specialising in inclusion and special educational needs (SEN)). We also made sure to recruit teachers from both state-run and private schools.
For the purposes of this study, we designed a 24-item survey instrument to assess educators’ knowledge and awareness of dyscalculia. The survey items reflected the DSM-5 (APA, 2013) and ICD-11 (WHO, 2022) diagnostic criteria for dyscalculia and current theorising about this topic. To confirm the validity of these statements, we recruited an independent group of 30 leading international research experts on dyscalculia and asked them to indicate to what extent they agreed with each statement in the survey (Roulstone et al., 2025). Existing surveys related to educators’ knowledge about dyscalculia have used different response formats, including asking whether an item was true or false (e.g. Chideridou-Mandari et al., 2016), using a 3-point Likert scale (i.e. disagree/don’t know/agree; e.g. Satybaldy, 2022; Sousa et al., 2017), using yes/no items (Graves et al., 2018) or other response formats (for example, Likert scales with four or five response options; Graves et al., 2018; Kunwar et al., 2021). We decided to use a 5-point Likert scale (ranging from strongly disagree to strongly agree with a mid-point of neither agree nor disagree). This format was the most appropriate for our purposes, because we wanted to create a total score based on educators’ responses. Additionally, by giving the option to choose “neither agree nor disagree”, we aimed to avoid responses based on guessing. Another advantage of this method is that it makes it possible to discriminate between misconceptions (when a person agrees with an incorrect statement or disagrees with a correct statement) and knowledge gaps 1 (when a person neither agrees nor disagrees with a specific statement). With regard to this point, when designing the survey items, we made sure that all statements included in the survey were relatively uncontroversial and could be easily categorised as true or false.
Another issue that we wanted to address with our study was the role of demographic factors regarding educators’ knowledge and awareness of dyscalculia. While some studies indicate that age, gender, greater years of teaching experience, higher qualifications, educational setting and type of school (i.e. public vs. private schools) are associated with knowledge related to dyscalculia (e.g. Dias et al., 2013; Kunwar & Sharma, 2020), other studies found no associations (e.g. Sousa et al., 2017). A cross-cultural study is ideal for addressing this question, as it makes it possible to assess the robustness of findings relating to demographic factors while using the same measure of knowledge and awareness across different countries. Though we also reflect that differences in knowledge may also be related to cultural differences between countries in how participants approach surveys in general (e.g. tendencies to underestimate when utilising Likert scales) and their confidence levels influenced by access to dyscalculia-specific training.
When reviewing the existing literature on educators’ knowledge and awareness of dyscalculia, we have found that studies often focus on a single country, or even a single region within a country, and usually involve small samples of primary school teachers, which reduce the generalizability of the findings. Investigating educators’ knowledge and awareness of dyscalculia across four countries in the UK, Italy, Vietnam and South Africa offers a valuable lens into how cultural, educational and policy contexts shape understanding of mathematical learning difficulties, whilst also making it possible to check the robustness of some of our findings across different education systems. The selected countries represent diverse educational systems and stages of inclusion policy development. The UK and Italy have well-established SEN frameworks, yet dyscalculia is still rarely diagnosed or addressed in teacher training. South Africa and Vietnam, meanwhile, offer contrasting perspectives shaped by resource constraints, evolving inclusion agendas and differing cultural attitudes toward neurodiversity. Therefore, identifying common challenges across countries and three continents (Europe, Asia and Africa) can highlight priorities for global educational policy. We recognise that inclusive education systems differ worldwide, so it is important to consider the training that educators receive in their respective countries to support learners with dyscalculia.
In the current study, we asked educators to report on the training that they had received in relation to both dyscalculia and dyslexia. We decided to consider dyslexia as a comparison, as it is similar to dyscalculia in its prevalence (e.g. Wagner et al., 2020), yet it is much better recognised and less underdiagnosed in comparison to dyscalculia (e.g. Morsanyi et al., 2018). In summary, the current study investigated the following questions:
Do educators from the UK, Italy, Vietnam and South Africa share similar knowledge and awareness of dyscalculia, and do they have any common knowledge gaps and misconceptions? Are there any demographic factors that relate to awareness of dyscalculia? Are these similar in all countries? What are educators’ experiences of training in dyslexia and dyscalculia, and do these vary significantly between countries?
Method
Participants
Participants were 1323 education professionals (Mage = 42.50 years, SD = 10.57, range = 18–72 years old, 87% female), recruited from four countries: the United Kingdom (n = 607, England = 96.5%, Wales = 1%, Scotland = 2%, Northern Ireland = 0.5%), one region in Vietnam (n = 450), one region in Italy (n = 177) and two provinces in South Africa (n = 89). Participants were recruited from a range of educational settings. The majority were primary educators (53%), followed by those in early years (17%), secondary (16%), and further education (14%) settings. Most educators were employed in public schools (88%) with a smaller proportion working in private settings (12%). This distribution reflects the relatively low prevalence of private schools in the countries involved in this study, which are typically accessed by the most affluent families. Educators held a diverse range of job roles, including teaching staff in leadership roles (13%), teachers specialising in inclusion and SEN (11%), classroom teachers (55%), teaching assistants (16%) and other school support roles (5%). Participants reported substantial teaching experience (M = 15.08 years, SD = 10.16, range = 0–55 years). Overall, 81% of educators had completed a degree or higher postgraduate qualification. However, a significant proportion of educators from Vietnam (20%) and South Africa (27%) preferred not to disclose their highest level of qualification. The demographic characteristics of the educators are presented in Table 1.
Educators' Demographic Characteristics from the UK, Italy, Vietnam and South Africa.

In Vietnam, the qualification that is generally considered equivalent to the UK A-Level is the Bằng Tốt Nghiệp Trung Học Phổ Thông (THPT), which is the Senior Secondary School Graduation Diploma. In Italy, the equivalent of the UK A-Level is the Diploma di Esame di Stato, also known as the Maturità. This qualification is obtained at the end of upper secondary school (scuola secondaria di secondo grado) and is required for university admission. In South Africa, the equivalent of the UK A-Level is the National Senior Certificate (NSC), also known as the Matric. This qualification is obtained at the end of Grade 12 and is required for university admission.
In South Africa, the qualification that is considered equivalent to the General Certificate of Secondary Education (GCSE) in the UK is the IGCSE.
Materials
Development of the Dyscalculia Knowledge and Awareness Scale (DKAS)
The development of the DKAS items included several steps. First, a comprehensive literature review of existing studies on educators’ knowledge of dyscalculia was undertaken to compile a set of statements about dyscalculia. These statements were then assessed to ensure that they agreed with the most up-to-date diagnostic criteria published in the DSM-5 and ICD-11 (APA, 2013; WHO, 2022). They were also selected to cover a broad range of fundamental topics related to dyscalculia, including its prevalence, gender differences, core symptoms, heritability, co-occurrence with other conditions, etc. The statements were then edited to obtain both positively and negatively worded items about dyscalculia (i.e. where agreement/disagreement was expected), with the aim to reduce the possibility of acquiescence bias. This process resulted in a bank of 24 statements involving 12 positively worded, for example, “Dyscalculia can run in families” (Item 2), and 12 negatively worded, for example, “Dyscalculia is another name for maths anxiety” (Item 14), which were presented in a fixed, quasi-random order. Educators were invited to evaluate each item using a 5-point Likert scale (strongly agree/agree/neither agree nor disagree/disagree/strongly disagree). This response format was selected instead of asking for a True/False judgement, as we wanted to avoid people relying on guessing, when they were not clear about their answer. Moreover, including a neutral response option makes it possible to discriminate between correct/incorrect responses (i.e. misconceptions) and lack of knowledge regarding the statements (i.e. knowledge gaps; including cases where the respondent feels that the available evidence is ambiguous). After developing the survey content and format, 30 international research experts on dyscalculia were recruited for the purpose of validating the statements – see Roulstone et al., 2025) for detailed information about the design and validation of the 24 statements. These researchers were highly experienced, with an average of 15 years of experience in research into dyscalculia. Level of agreement (or disagreement, in the case of reversed items) with the statements ranged from 67% to 100% among experts, with 18 out of 24 statements showing at least 80% agreement (i.e. 80% of experts converged on an agree/strongly agree or disagree/strongly disagree response in the case of these items). Overall, these results suggested that the survey items reflected well the current consensus within the research community and could be used to assess educator's knowledge and awareness of dyscalculia. The responses for each statement were summed to calculate an overall total score across the 24 items, which was used to compare educators’ awareness between countries and some other demographic categories. A score of 5 was awarded if a person strongly agreed with a true statement or strongly disagreed with a false statement, resulting in a maximum total score of 120. The internal consistency, based on the total sample from the four included countries for the 24 DKAS items, was α = .71, suggesting good reliability. The survey was also piloted, and no concerns regarding clarity were raised. The 24 DKAS items, presented to participants in their original order, are listed in Table S1 of the supplemental materials.
Additional Questions Included in the Survey
Part 1 asked educators about their demographic characteristics (age, gender, education setting, school type, job role, highest level of education, years of teaching experience). These questions were adapted to the context of each participating country. Part 2 examined educators’ self-evaluated knowledge of dyscalculia. Educators were asked: “Do you know what dyscalculia is?” Participants were invited to select a response from three options (0 = I have no idea; 1 = Roughly – I have a rough idea; 2 = Yes – I have a clear idea). Educators who answered “I have no idea” to the initial question regarding their knowledge about dyscalculia were permitted to continue the survey (see Table 2). Part 3 included the 24 DKAS items. The final section asked educators about their experiences of training in dyscalculia and dyslexia. Participants were invited to select a response from two options (0 = No - I have not received any training; 1 = Yes – I have received training) for both pre-service and in-service training in dyscalculia and dyslexia. The survey was developed using forward and back translation in Vietnam, Italy and South Africa, followed by consultation with local and UK experts, so that the meaning of the statements was preserved. The survey was initially piloted with education professionals in the UK (n = 20) and Vietnam (n = 38), and this data is included in the final sample.
Distribution of Answers to the Question: “Do you Know What Dyscalculia Is?”.

Note: Yes: I have a clear idea; Roughly: I have a rough idea; No: I have no idea.
Procedure
The study design was approved by the Ethics Committee and the Boards of all participating countries. Data was collected from educators in the UK, Italy and Vietnam using an online survey method, whilst a paper-based survey was utilised in South Africa. This was because the survey in South Africa was administered in several rural areas where access to online facilities was limited. In the online version, participants did not have the option to go back and change their answers, nor was there any evidence of participants changing their answers in the paper-based version. To reduce social desirability bias, participation in the survey was anonymous, and data were non-identifiable. The survey took no longer than 30 min to complete. Opt-in consent was obtained from all participants prior to survey completion. Education professionals were recruited via social media channels, as well as from conferences and professional development events.
Results
Educators’ Self-Evaluated Knowledge of Dyscalculia
First, we analysed educators’ self-evaluated knowledge of dyscalculia. We asked educators, “Do you know what dyscalculia is?” with three possible response options (I have no idea; Roughly – I have a rough idea; Yes – I have a clear idea). Table 2 shows that, across the overall sample, 33% of educators reported that they had a clear idea of what dyscalculia was. A chi-square test of independence was performed, including the three response options and the four countries, to evaluate the relationship between educators’ self-evaluated knowledge and country. The relationship between these variables was significant, χ2(6, N = 1323) = 221.17, p < .001). Post-hoc chi-square tests, using Bonferroni-Holm corrections, indicated that self-evaluated knowledge of dyscalculia was significantly higher in Italy than in the UK (p = .003). Additionally, UK educators reported significantly better knowledge of dyscalculia than educators in South Africa (p < .001), whilst educators in South Africa reported significantly better knowledge than educators in Vietnam (p = .015). Although in most countries less than half of the educators reported that they had a clear idea of what dyscalculia was, the majority of educators in each country reported that they had at least a rough idea. Educators who responded “I have no idea” to this initial question, also continued with answering the survey items about dyscalculia.
Educators’ DKAS Scores by Country
Next, we analysed educators’ level of agreement/disagreement with the 24 survey items. Overall, the total DKAS score (M = 88.88, SD = 9.50) indicated that educators demonstrated reasonable knowledge and awareness of dyscalculia. Scores ranged from 63 to 113 out of a maximum of 120 (see Table 3). A one-way analysis of variance (ANOVA) revealed that there was a significant difference in DKAS scores between educators from the four countries (F(3, 1322) = 217.09, p < .001). Bonferroni-corrected post-hoc tests showed that educators in the UK obtained the highest scores, followed by educators in Italy, South Africa and Vietnam, with all comparisons showing significant differences. For comparison, experts’ total DKAS score was (M = 105, SD = 6.30) (see Roulstone et al., 2025).
Educators’ Total DKAS Scores by Country and Overall.

Note: The max. DKAS score is 120.
Educators’ Responses to DKAS Items Overall
In addition to the total scores, we also analysed item-level data for the DKAS items to reveal patterns of accurate knowledge, knowledge gaps and misconceptions. Table 4 presents these results, with the DKAS statements arranged in descending order of overall proportion of correct responses (individual items analysed at country level can be viewed in the supplemental materials and on the Open Science Framework) 2 . Educators’ levels of correct endorsement/rejection (%) of the 24 DKAS items in the United Kingdom (UK), Italy (IT), Vietnam (VIE) and South Africa (SA) sorted from highest to lowest score are presented in Table 5.
Percentage of Agree, Neutral and Disagree Responses Across the 24 Statements About DD Based on the Combined Responses from the UK, Vietnam, Italy and South Africa, Sorted from Highest to Lowest Score.

Note: Percentage of correct responses to each statement is highlighted in bold. (R): negatively worded items.
Educators’ Levels of Correct Endorsement/Rejection (%) of the 24 DKAS Items in the UK, IT, VIE and SA Sorted from Highest to Lowest Score.

Note: (R): we were looking for disagreement rather than agreement; UK: United Kingdom; IT: Italy, VIE: Vietnam; SA: South Africa; DKAS: Dyscalculia Knowledge and Awareness Statements.
Educators showed good awareness of the basic characteristics of DD, as well as the problems associated with DD with somewhat more uncertainty regarding the causes of DD. Nevertheless, in the case of 18 out of the 24 statements, the majority of participants (i.e. more than 50% of educators) correctly agreed/disagreed with the statements. In the case of two additional questions (relating to the heterogeneity and developmental stability of DD), the correct response was still the most commonly selected option, although less than half of the sample selected this.
Educators also revealed some knowledge gaps (where the most often selected response was “neither agree nor disagree”). These questions referred to the prevalence of dyscalculia, gender differences, the level of intelligence of children with dyscalculia, and the efficacy of medication in treatments. In terms of misconceptions, the prevalence of incorrect responses ranged from 5% to 40%. The most prevalent misconception held by educators was that “all children with DD have similar difficulties in learning mathematics” (40% Item 16), followed by “dyscalculia is another name for maths anxiety” (Item 14), and that “over time children can outgrow dyscalculia” (Item 5), with 30% of the sample endorsing these incorrect statements. Nevertheless, there were no items where the dominant response was incorrect in the combined sample.
Educators’ Levels of Correct Endorsement/Rejection by Country
Finally, we also analysed the results broken down by countries. A chi-square test of independence was conducted to examine the associations between country and educators’ responses to each DKAS item separately (see Table 5). The analysis revealed a significant association between country and response patterns on all items (p < .001), except for item 19-Dyscalculia is characterised by difficulties in numerical processing. These analyses suggested significant heterogeneity between countries in terms of correct knowledge, knowledge gaps and misconceptions in relation to dyscalculia. Additionally, these results also showed that although UK and Italian educators generally had the best knowledge of dyscalculia, and Vietnamese educators had the lowest level of knowledge, on some items, Vietnamese educators showed better knowledge than educators from the other countries. Educators’ endorsement of items analysed by country can be found in the supplemental materials.
Associations Between Educators’ Demographic Characteristics and DKAS Scores by Country
One-way ANOVAs and correlational analyses were conducted to assess the impact of job role, educational setting, school type, teaching experience and highest level of education on educators’ DKAS scores in their respective countries. Results are reported separately for each country because of differences between education systems and the available data.
United Kingdom
One-way ANOVAs on DKAS scores indicated a significant effect (F (4, 602) = 6.82, p < .001, ηp2 = .04) of job role (school leadership/specialist teacher in SEN 3 /teacher/teaching assistant/another support role), with specialist teachers in SEN achieving significantly higher scores than educators in other job roles. There was also a significant effect of highest level of education (postgraduate/undergraduate/other (not degree-level) qualification) on DKAS scores (F (2, 598) = 4.77, p = .009, ηp2 = .02), Tukey's b test indicated that educators who had at least degree-level qualifications achieved higher scores than educators without a degree. However, there were no significant differences found in educators’ DKAS scores between educational settings (early years/primary/secondary/further education; p = .328) or school type (i.e. public vs. private schools; p = .134). Additionally, a correlational analysis indicated that educators’ teaching experience in years was not significantly related to their DKAS scores (r(605) = .02, p = .553).
Vietnam
One-way ANOVAs on DKAS scores indicated a significant effect (F (4, 445) = 7.53, p < .001), ηp2 = .06) of job role (school leadership/specialist teacher in SEN/teacher/teaching assistant/another support role), with specialist teachers in SEN achieving significantly higher scores than teachers and school leaders. The DKAS scores of teaching assistants and teachers in other support roles did not significantly differ from educators in any other job roles, including specialist teachers in SEN. There was also a significant difference (F (2, 447) = 4.64, p = .010, ηp2 = .02) in educators’ DKAS scores between educational settings (early years/primary/secondary) with post-hoc Tukey's b tests revealing that secondary school educators scored significantly higher than those in primary schools, but early years educators’ scores did not significantly differ from either of the other groups. There was also a significant difference in DKAS scores between school type, that is, public versus private (t(448) = 7.57, p < .001, Cohen's d = 0.94) with educators in private schools obtaining significantly higher DKAS scores than those in public school settings. Educators with higher qualifications, that is, having studied a master's or higher qualification obtained significantly higher DKAS scores than educators with a degree-level qualification or those who preferred not to report their highest qualification (F (2, 446) = 6.31, p = .002, ηp2 = .03). Educators with more teaching experience obtained lower DKAS scores (r(448) = −.20 p < .001).
Italy
There were no significant differences found in educators’ DKAS scores in Italy, between job roles (leadership/specialist teacher in SEN/teaching assistant; p = .151), educational settings (early years/primary/secondary/further education; p = .151), school types (public vs. private; p = .361), or level of education (postgraduate/undergraduate/other (not degree-level) qualification; p = .823). A correlational analysis indicated that educators’ teaching experience in years was also not significantly related to their DKAS scores (r(175) = −.09, p = .261).
South Africa
There were no significant differences found in educators’ DKAS scores in South Africa, between job roles (leadership/teacher/teaching assistant; p = .559), educational settings (early years/primary/secondary/further education; p = .145), or school types (public vs. private; p = .996). However, there were significant differences in DKAS scores (F (1, 75) = 5.35, p = .007, ηp2 = .13) between educators with different levels of education (postgraduate qualification/degree-level qualification/prefer not to say). Post-hoc comparisons using Tukey's b test revealed that educators with postgraduate and degree-level qualifications obtained significantly higher DKAS scores than those who preferred not to report their highest level of education. All other comparisons were non-significant. A correlational analysis indicated that educators’ teaching experience in years was not significantly related to their DKAS scores (r(77) = .11, p = .321).
Training Experiences and the Effects of Training
Next, we analysed educators’ training experiences in dyscalculia and dyslexia (Table 6). Pre-service training rates in DD were low in all countries (with the lowest proportion in the UK, with 3%, and the highest proportion in South Africa, with 6%). In-service training in DD was more common and ranged from 5% in Vietnam to 36% in the Italian sample. We conducted a chi-square test of independence to evaluate whether country of residence was associated with educator's access to training in dyscalculia (received any training/did not receive any training). The relationship between these variables was significant χ2(3, N = 1323) = 82.77, p < .001, indicating that access to training differed between countries. Follow-up analyses showed that the proportion of educators who had received dyscalculia-related training was significantly higher in Italy (51%) than in South Africa (25%), the UK (24%) and Vietnam (16%). There was no significant difference between the latter three countries in access to dyscalculia-related training.
Educators’ Training Experiences in DD and Dyslexia.
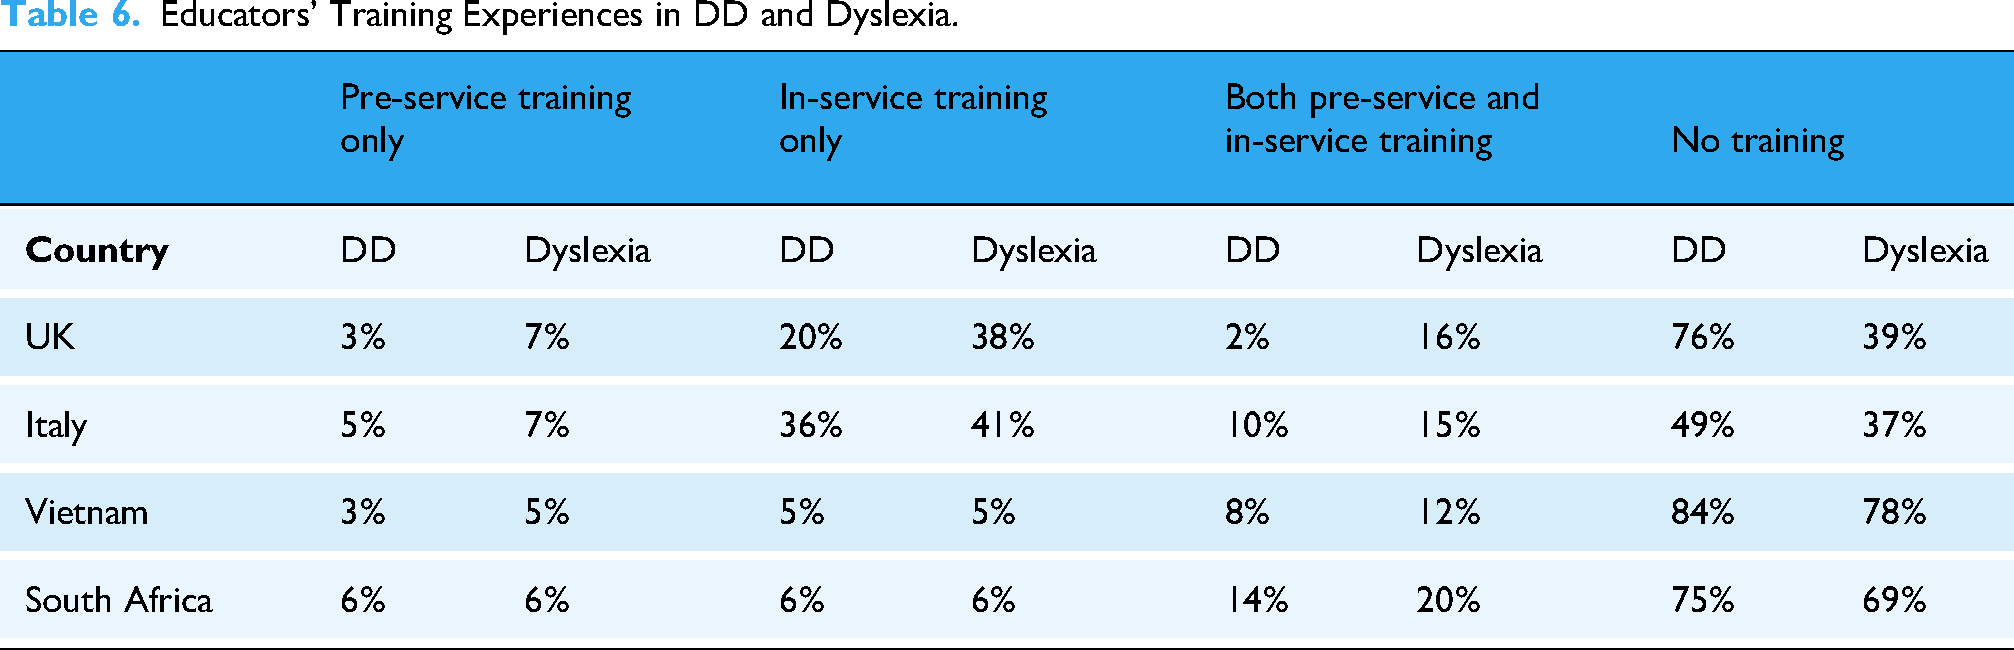
We also conducted a repeated measures ANOVA with access to training in dyscalculia versus dyslexia as a within-subjects factor, and country (UK/Vietnam/Italy/South Africa) as a between-subjects factor. There was a significant effect of training type (F (1, 1319) = 92.45, p < .001, ηp2 = .07), with more access to training in dyslexia than dyscalculia. Additionally, there was a significant main effect of country (F (3, 1319) = 53.01, p < .001, ηp2 = .11). Post-hoc comparisons using Bonferroni-Holm corrections showed that, across both training in dyscalculia and dyslexia, educators in Italy had the best access to training, followed by the UK, South Africa and Vietnam. All of these contrasts were significant. There was also a significant interaction between country and training type (F (3, 1319) = 51.43, p < .001, ηp2 = .11). Follow-up analyses showed that educators in all countries had more access to training in dyslexia than dyscalculia, with the exception of South Africa, where the difference was non-significant after applying Bonferroni-Holm corrections.
As a final step, a 2 × 4 between-subjects ANOVA was performed to examine the effects of country (UK/Italy/Vietnam/South Africa) and training in dyscalculia (received training in dyscalculia /no training) on educators’ DKAS scores (see Table 7). The results indicated a significant main effect of country (F (3, 1315) = 144.74, p < .001, ηp2 = .248) and a significant main effect of training (F (1, 1315) = 19.18, p < .001, ηp2 = .014) on educators’ DKAS scores. However, there was no significant interaction between country and training (p = .103). These results showed that across all countries, educators who had received dyscalculia-related training obtained higher DKAS scores, although the effect was small.
The Effect of Training on DKAS scores.

Discussion
The present study investigated educators’ understanding of dyscalculia in the UK, Italy, Vietnam and South Africa, highlighting any knowledge gaps and misconceptions. A secondary aim was to investigate associations between educators’ demographic characteristics and their knowledge and awareness of dyscalculia. A final aim was to report on dyscalculia-related training opportunities available to educators in each country, compare the training opportunities for dyslexia and dyscalculia and assess the effect of training on educators’ knowledge of dyscalculia. To achieve these aims, we developed a new, 24-item survey instrument, which was validated by a group of international research experts (see Roulstone et al., 2025).
Identifying common challenges can help to uncover disparities in educational approaches, training and support – critical factors when considering global priorities such as the United Nation's Sustainable Development Goals, which emphasise inclusive, equitable quality education and lifelong learning opportunities for all. Understanding and highlighting educators’ knowledge gaps, misconceptions and experiences of dyscalculia-specific training (namely, the lack of it) fosters empathy and strengthens international collaboration.
Educators’ Knowledge and Awareness of Dyscalculia
A high proportion of educators (87%) self-reported that they were familiar with the term dyscalculia. However, only 33% stated that they had a clear idea of dyscalculia. Overall, educators demonstrated a reasonable basic understanding of dyscalculia in their responses to the 24 Dyscalculia Knowledge and Awareness Statements (DKAS), obtaining an average score of 89 out of a maximum score of 120. This is in line with some earlier studies that also reported a reasonable knowledge of dyscalculia among educators (Chideridou-Mandari et al., 2016; Sousa et al., 2017). Educators in the UK had the highest DKAS scores, followed by Italian, South African and Vietnamese educators. Interestingly, even though they obtained lower scores on the DKAS, Italian educators had higher confidence in their knowledge of dyscalculia than educators in the UK, as reflected by their self-assessment of their knowledge. In the following, we discuss the patterns of responses across items and highlight typical strengths in educators’ knowledge, as well as common knowledge gaps and misconceptions. However, it should be recognised that response patterns differed substantially across countries, and using country-specific data (available in the supplemental materials) would be more useful when considering the training needs of educators in each country.
Educators across all four countries showed good knowledge of the basic challenges associated with dyscalculia, including an understanding that it affects various aspects of mathematics (e.g. memorising and recalling basic number facts, processing numerical information, fluent calculations and mathematical reasoning) and that its effect extends to everyday contexts outside of school education. They also agreed that dyscalculia was a neurologically based developmental condition which emerges in early childhood, and occurs across all languages, cultures, ethnicities and socio-economic groups. Most educators were also aware that dyscalculia is an underdiagnosed condition, that children with dyscalculia can learn mathematics, and that targeted interventions can improve their performance.
Knowledge Gaps Relating to Dyscalculia
Despite these positive findings, educators’ responses also revealed several knowledge gaps (although there was considerable variation between countries regarding each of these). These knowledge gaps relate to the prevalence of dyscalculia, gender differences, level of intelligence of children with dyscalculia and the efficacy of medication. The first three items are all highly relevant to identifying children at risk of dyscalculia. Specifically, with a prevalence of about 3–6% (e.g. Haberstroh & Schulte-Körne, 2019; Morsanyi et al., 2018), it is likely that there is at least one child with dyscalculia in every school class of 20–30 children. Yet, 45% of our sample were unsure if 1 in 100 children was a correct estimation of prevalence (even though this number would suggest that dyscalculia is six times less prevalent than it actually is). Awareness of a lack of gender differences in dyscalculia is also very important for diagnostic purposes. In the current sample, 54% of educators were unsure if dyscalculia was more common in girls than in boys. This is particularly interesting, as neurodevelopmental conditions are generally more common in males than in females (with ratios ranging from about 2:1 to 3:1; APA, 2013). Nevertheless, no gender differences in relation to dyscalculia are reported in the DSM-5 (APA, 2013) and ICD-11 (WHO, 2022). Dyscalculia experts (73%) who were recruited for the validation of our survey also reported that dyscalculia was not more common among girls than boys, and most studies on dyscalculia also report no gender differences in the prevalence of dyscalculia (e.g. Desoete et al., 2004; Devine et al., 2013; Gross-Tsur et al., 1996; Mazzocco & Myers, 2003; Morsanyi et al., 2018).
The statement that “children with DD often have higher than average IQ” (Item 10) also has strong relevance to the identification of children with dyscalculia. Traditionally, definitions of specific learning disorders have referred to an “unexpected” difficulty, and until the latest edition of the DSM-5 (APA, 2013), an expectation of a significant discrepancy between children's IQ and mathematics skills was a precondition for a diagnosis of dyscalculia. Indeed, an expectation of a discrepancy is still included in the ICD-11 (WHO, 2022), which states that the individual's performance in mathematics or arithmetic must be markedly below what would be expected for their chronological or developmental age and level of intellectual functioning. In contrast, the DSM-5 no longer uses measures of intellectual functioning as part of the diagnostic assessment, unless a child's needs are better explained by intellectual disabilities (i.e. an IQ score less than 70). Fifty-two per cent of educators indicated that they neither agreed nor disagreed with the statement that children with dyscalculia have higher than average IQ, suggesting uncertainty around this item. Whilst discrepancies between IQ and mathematics skills in dyscalculia may occur, this is not a useful way to identify dyscalculic individuals. One reason for this is that longitudinal studies have shown that discrepancies between IQ and mathematics skills are unstable over time (Mazzocco & Myers, 2003). Moreover, about 80% of children with profound and persistent mathematics difficulties do not show large discrepancies between their mathematics skills and level of intelligence (Morsanyi et al., 2018). In other words, although children with dyscalculia may have higher than average IQ, large discrepancies between mathematics skills and intelligence are uncommon, which means that most children with dyscalculia have average or low-average IQs.
A final significant knowledge gap related to the efficacy of medications in treating dyscalculia, where 48% of educators selected the neither agree nor disagree response. In fact, there is no indication in the literature that interventions other than behavioural ones could be efficacious or recommended for dyscalculia. Although dyscalculia may co-occur with other conditions, such as ADHD, anxiety and depression, where medication may be recommended (e.g., Kaufmann & von Aster, 2012), interventions for mathematics learning difficulties should focus on teaching mathematical skills and strategies that directly relate to dyscalculic people's profile of strengths and weaknesses in mathematics (see, e.g. Haberstroh & Schulte-Körne, 2019; Monei & Pedro, 2017).
Misconceptions Relating to Dyscalculia
The most prevalent misconception held by educators was that “all children with dyscalculia have similar difficulties in learning mathematics” (40% Item 16). Even though dyscalculia affects all aspects of mathematics learning (e.g. APA, 2013; Desoete, 2008; Landerl et al., 2021; Morsanyi et al., 2018; Roulstone et al., 2024; Simms et al., 2016), this does not mean that all learners with dyscalculia will experience similar levels of difficulties in all areas (e.g. Fias et al., 2013), or that exactly the same interventions would be recommended. Dyscalculia is a highly heterogeneous condition (Träff et al., 2017), with individuals presenting a wide range of cognitive profiles. Conversely, similar difficulties with mathematics may arise from diverging cognitive profiles. Contextual influences, such as language background and socio-economic status, may also influence cognitive profiles and outcomes. Co-occurring conditions can further complicate identification and support needs (Morsanyi et al., 2018). Given this complexity, it is essential to look beyond specific mathematics difficulties and consider both contextual factors and individual cognitive profiles during the diagnostic process and when designing personalised intervention plans (e.g., Haberstroh & Schulte-Körne, 2019).
Another common misconception held by educators was that “dyscalculia is another name for maths anxiety” (30% Item 14). This highlights a lack of understanding of the cognitive underpinnings and typical manifestations of both dyscalculia and mathematics anxiety. Even though mathematics anxiety is about twice as common among dyscalculic people than in the general population (Passolunghi, 2011), it is not the case that high mathematics anxiety necessarily relates to low mathematics performance. For example, Devine et al. (2018) found that among primary and secondary school students, 77% of pupils with high mathematics anxiety showed average or high mathematics performance. Mathematics anxiety and dyscalculia also differ in their developmental origins (e.g. O’Connor et al., 2023) and the way they impact mathematics performance. Whereas dyscalculic pupils experience difficulties even with basic mathematics concepts, mathematics anxiety most strongly impacts performance on more complex tasks that require working memory resources (e.g., Ashcraft & Krause, 2007; Beilock & Carr, 2005).
Another important misconception held by educators (30%, Item 5) was that “over time children can outgrow dyscalculia”. This shows that some educators had a limited understanding that, although lack of access to high-quality education can cause persistent difficulties in mathematics, this is different from DD, which arises due to endogenous reasons related to neurodevelopment, and involves persistent difficulties, which cannot easily be overcome by providing targeted support (APA, 2013). The misconception that children can outgrow dyscalculia may be particularly challenging, as it could lead to not providing pupils with the necessary resources and support, especially at higher levels of education. Overall, the diversity of knowledge gaps and misconceptions highlights the need for greater teacher training to improve knowledge about dyscalculia, especially with regard to the diagnostic criteria of dyscalculia and the cognitive characteristics of dyscalculic pupils.
Educators’ Demographic Characteristics and Their Relations with Knowledge of Dyscalculia
Our study provided a unique opportunity to investigate the effect of various demographic factors and the robustness of these effects across different countries. This is an important contribution as previous evidence regarding the relations between educators’ demographic characteristics and their knowledge of dyscalculia was sparse, and existing studies yielded contradictory results. For example, whereas some studies reported a positive relationship with more years of teaching experience (Dias et al., 2013; Kunwar & Sharma, 2020; Mekonnen, 2023), other studies did not find such a relationship (Albina, 2019; Chideridou-Mandari et al., 2016; Eyo & Nkanga, 2020; Sousa et al., 2017). Our study also yielded mixed results in this respect, with no relationship between DKAS scores and years of teaching experience in the UK, Italy and South Africa and a negative relationship between teaching experience and DKAS scores in Vietnam. These results clearly show that knowledge about dyscalculia cannot simply arise from contact with students, but educators need more formal, specialist training. Indeed, although there were variations across countries, we found that a higher level of education (in the UK, Vietnam and South Africa) and working as a teacher in a specialist support role with pupils (in the UK and Vietnam) were associated with higher DKAS scores. In Vietnam only, secondary school teachers and teachers working in private schools also had better knowledge of dyscalculia. Finally, teachers who had access to specialist training related to dyscalculia showed better knowledge across all countries. Although these findings are correlational, access to continuing professional development may help educators distinguish dyscalculia from general low attainment and mathematics difficulties that arise as a result of environmental reasons, enabling targeted support. Understanding dyscalculia as a neurodevelopmental learning difference may also foster inclusive and affirming classroom environments. Diagnostic insights can also empower educators to collaborate effectively with psychologists and families, to co-design and deliver support plans to help improve students’ attitudes, performance and achievement in mathematics, and to make decisions about intervention and support with more confidence.
The Availability of Specialist Training in Dyscalculia
As described in the previous section, teacher training is essential for inclusion and supporting students with dyscalculia. It is therefore highly concerning that the vast majority of teachers in our sample (over 75% in the UK, Vietnam and South Africa) did not receive any formal training in dyscalculia. The only exception was our educator sample in Italy, where 36% of the sample reported that they had received in-service dyscalculia-related training only. However, this group included a large proportion of teachers (44%) who worked in specialist inclusion and support roles. The lack of training in dyscalculia aligns with findings from other countries (Chideridou-Mandari et al., 2016; Dias et al., 2013; May et al., 2021). Our results also showed that educators received more training in dyslexia than dyscalculia, with the exception of South Africa, where educators had similar access to training related to both conditions.
It is also notable that, although educators with dyscalculia-related training obtained somewhat higher DKAS scores, this effect was small. This may mean that the training did not cover the fundamental questions assessed by the DKAS, or that it happened a long time ago, or that there were issues with the quality of training offered. For example, the Italian sample included a large proportion of specialist teachers and expressed the highest level of confidence in their knowledge of dyscalculia, yet they obtained lower scores on the DKAS than educators from the UK. These findings have important implications for policy and practice, highlighting the need for access to high-quality, research-informed training about dyscalculia, starting from initial teacher training.
Strengths, Limitations and Future Directions
Our study had several strengths, including the unique approach of including educators from four countries across three continents, the large overall sample size, the inclusion of educators from diverse job roles, and from a variety of settings (from early years to further education), and from both private and public schools. This is a significant addition to the existing literature, which mostly consisted of studies conducted in Asia, included small samples, and focussed on primary school settings (Albina, 2019; Fu & Chin, 2017; Karasakal, 2018; Sezer & Akin, 2011). We have also used a scale to measure knowledge and understanding of dyscalculia, which was not only informed by diagnostic manuals and the research literature but was also validated by a group of leading international research experts. We also believe that the DKAS statements represent well-established findings that are likely to remain valid in the future. Another strength of our method was that we used a rating scale that made it possible to discriminate between misconceptions (i.e. incorrect responses) and uncertainty about particular topics.
Nevertheless, our study also had some limitations that warrant consideration. As participation in our survey was voluntary, it is possible that educators with an interest in dyscalculia or those who had more knowledge about this topic were overrepresented in our sample. This was particularly evident in the Italian sample, where a large proportion of the participants were specialist teachers in SEN. Therefore, we may have overestimated educators’ knowledge and awareness of dyscalculia and their access to relevant training. Other limitations arise from the content of the DKAS. When developing the items, we aimed to focus on statements that we considered fundamental and at the same time uncontroversial. This meant that we did not address some important topics where there is less agreement in the research literature, including the aetiology of dyscalculia, the typical cognitive strengths and weaknesses in dyscalculia and the neurological basis of dyscalculia. Another limitation relates to the psychometric properties of the DKAS. Although the reliability of the scale was acceptable (α = .71) and appropriate for the purposes of computing total scores, we did not strive to create a scale with perfect psychometric properties, as our main focus was on the validity of the content of the scale.
We recognise that differences in knowledge and awareness could arise from cultural differences in survey completion. For example, in some cultures, respondents may avoid negative answers to maintain harmony or avoid perceived judgment. Some cultures may tend towards using the ends of Likert scales (e.g. strongly agree/disagree) while others prefer middle options. Nevertheless, to mitigate this risk, we collapsed scores across strongly agree/agree and strongly disagree/disagree. It is also important to reflect that national frameworks and educational policies for inclusion, assessment and neurodiversity can shape how educators perceive and report their experiences.
Future studies may use the DKAS in other countries and other settings. For example, knowledge of dyscalculia is not only important for educators but also for professionals working in healthcare, human resources and various roles relating to inclusivity. The DKAS could also be used for assessment purposes in education settings or in professional development programmes. Future work could also extend the DKAS to other aspects of dyscalculia. Finally, the current findings (especially in relation to knowledge gaps and misconceptions about dyscalculia) could inform the development of training programmes relating to dyscalculia.
A further interesting question is to what extent increased understanding of dyscalculia would improve teaching of dyscalculic pupils. For example, research on neuromyths (e.g. “We only use 10% of our brain.”) suggests that award-winning and non-award-winning teachers are equally susceptible to these misconceptions (Horvath et al., 2018), and student teachers’ endorsement of neuromyths was unrelated to their achievement on their first-year practical courses (Krammer et al., 2021). Would these conclusions extend to the relevance of the DKAS? Although our results do not address this question directly, as we have not assessed either teaching quality or pupil outcomes in our samples, we can try to comment on this issue. It is important to consider that some neuromyths, for example, the one that we cited above, do not have direct implications for teaching practice, whereas many of the statements in the DKAS (for example, relating to the causes and typical characteristics of dyscalculia, and the possibility to improve mathematics skills in dyscalculia) are directly relevant to teaching practice, and the identification of dyscalculic pupils. Thus, knowledge related to the DKAS statements may be more strongly related to teaching quality, as well as to access to diagnosis and targeted support than endorsement of general neuromyths. Future studies could investigate the links between scores on the DKAS and the quality of teaching, and access to diagnosis and specialist support.
Conclusions and Implications for Teacher Education and Education Policy
This study investigated educators’ knowledge and awareness of dyscalculia in the UK, Italy, Vietnam and South Africa. Although there were differences between these countries, our results were clear in that, across all these countries, educators showed significant knowledge gaps and misconceptions relating to some basic aspects of dyscalculia. Our results also clearly showed the lack of access to training in dyscalculia, including both pre-service and in-service training opportunities. Improved access to training may help to increase rates of identification and support for individuals with dyscalculia, ultimately enhancing mathematical outcomes for children and young people. Such efforts could be supported by the 24 DKAS statements, which provide a convenient, research-informed audit tool, allowing a quick assessment of knowledge and understanding of dyscalculia, helping to identify any knowledge gaps and misconceptions. Findings from the DKAS indicate that teaching experience alone is not associated with greater knowledge of dyscalculia. This suggests that professional development should not be limited to initial teacher education but should also extend to experienced educators. Ongoing, targeted training is essential to ensure that all teachers – regardless of career stage – are equipped with an up-to-date, neurodevelopmentally informed understanding to identify and support learners with dyscalculia effectively.
Supplemental Material
sj-pdf-1-ndy-10.1177_27546330251413328 - Supplemental material for What do educators know about dyscalculia in the UK, Italy, Vietnam and South Africa?
Supplemental material, sj-pdf-1-ndy-10.1177_27546330251413328 for What do educators know about dyscalculia in the UK, Italy, Vietnam and South Africa? by Alison Roulstone, Kinga Morsanyi, Mai-Liên LÊ, Carlo Tomasetto, Petro Erasmus, Wandile Tsabedze and Julia Bahnmueller in Neurodiversity
Footnotes
ORCID iDs
Funding
The authors disclosed receipt of the following financial support for the research, authorship, and/or publication of this article: This work was supported by funding from Research England and the Economic and Social Research Council (Grant Number ES/W002914/1), the University of Social Sciences and Humanities, Vietnam National University, Ho Chi Minh City, Vietnam (Grant Number NCM2023-01), Royal Society International Exchanges scheme (IES\R1\221220) to K.M. and P.E. and UKRI funder (grant number UKRI2713) to A.R.
Declaration of Conflicting Interests
The authors declared no potential conflicts of interest with respect to the research, authorship, and/or publication of this article.
Supplemental Material
Supplemental material for this article is available online.
Notes
References
Supplementary Material
Please find the following supplemental material available below.
For Open Access articles published under a Creative Commons License, all supplemental material carries the same license as the article it is associated with.
For non-Open Access articles published, all supplemental material carries a non-exclusive license, and permission requests for re-use of supplemental material or any part of supplemental material shall be sent directly to the copyright owner as specified in the copyright notice associated with the article.