
Abstract
Neurodivergent young people experience a higher risk of developing anxiety symptoms, which can negatively impact their social, educational and emotional functioning. Greater understanding of anxiety risk factors that specifically impact neurodivergent young people may contribute to improved awareness, recognition and accommodations. The aim of the current research was to investigate the relationship between neurodivergence and anxiety among 12-year-olds within a Aotearoa New Zealand context. Multiple regression analyses were used to explore associations between neurodivergence and anxiety, using data from 4563 young people in the Growing Up in New Zealand study. The Patient-Reported Outcomes Measurement Information System anxiety scale was completed at age 12. Predictor variables related to sleep, peer and parenting factors (measured at ages 8 and 12 years) were examined for neurodivergent young people in comparison to individuals with no known disability. Anxiety was also examined in participants with functional difficulties and an overall ‘any disability’ group. After adjusting for prenatal and sociodemographic covariates, the most significant predictors of anxiety for neurodivergent young people were sleep duration, sleep problems, bullying victimisation, peer–child trust and communication and parent–child trust. While neurodivergence was not significantly associated with anxiety after adjusting for covariates, having functional difficulties predicted higher anxiety at age 12.
Lay Abstract
Neurodivergent young people typically experience anxiety, and this can negatively impact their social, educational and emotional functioning. Greater understanding of anxiety risk factors that specifically impact neurodivergent young people may contribute to improved awareness, recognition and accommodations during the critical period of adolescence. Our research investigated the relationship between neurodivergence and anxiety among 4563 12-year-olds living in New Zealand. We also looked at sleep duration and sleep problems, as well as peer and parenting factors to see if neurodivergent young people had a greater risk of difficulties in these areas compared to those with no known disability and those with ‘other’ chronic disabilities. After factoring in multiple prenatal and sociodemographic variables, the most significant predictors of anxiety for neurodivergent young people were sleep duration, sleep problems, bullying victimisation, peer and parent trust issues. The group with the highest anxiety scores was those with a non-neurodevelopmental ‘other disability’.
Introduction
Neurodivergence is an inclusive term used to describe a range of neurological differences and conditions that are present from early development, including neurodevelopmental conditions such as autism, learning disabilities or difficulties and Attention-Deficit/Hyperactivity Disorder (ADHD) (American Psychiatric Association, 2013; Doyle, 2020; Whelpley et al., 2023). Neurodivergent (ND) people often share experiences of sensory sensitivities, sleeping issues and social difficulties, which may foster increased experiences of anxiety.
Anxiety disorders are the most prevalent type of psychiatric disorder: up to 33.7% of individuals may experience clinically significant anxiety at some point in their lives (Bandelow & Michaelis, 2015). Anxiety is characterised by excessive feelings of fear and perceptions or anticipation of a threat, often accompanied by strong emotional or physiological responses (American Psychiatric Association, 2013). Excessive anxiety may affect multiple areas of functioning, including social functioning, academic and occupational success and emotion regulation (American Psychiatric Association, 2013). Anxiety disorders can begin in childhood, making this a critical period for intervention and prevention (Kieling et al., 2024). The global prevalence of anxiety disorders in young people aged 5–24 years was recently reported as 3.35% (Kieling et al., 2024).
Neurodivergence and Anxiety
Strong associations exist between anxiety and neurodivergence, demonstrated in studies of autism (Adams et al., 2020; Neilson & Bond, 2023), learning disabilities (Mammarella et al., 2016; Santos et al., 2023) and ADHD (Rucklidge et al., 2016; Schatz & Rostain, 2006). Neurodivergence is also associated with a variety of psychological and psychosocial difficulties, including sleep disturbance (Bettencourt et al., 2024), bullying (Hunsche et al., 2022) and relationship difficulties and challenges with social identity (Botha et al., 2020; Cooper et al., 2023; Pearson & Rose, 2021). In addition, parental stress and strained parent–child relationships are associated with raising ND young people (Miranda et al., 2015). These common challenges may give way to unique experiences of anxiety in ND people, explaining why anxiety may be experienced at a greater rate than among neurotypical counterparts (Neilson & Bond, 2023; Santos et al., 2023; Schatz & Rostain, 2006).
Neurodivergence has historically been framed as a deficit: something to be changed or fixed, contributing to the marginalisation and dehumanisation of ND people (Kapp, 2019). Neurodivergent young people may experience stigma, discrimination and feelings of powerlessness from a young age; for example, being presumed to be incompetent or violent (Botha et al., 2020). Increased exposure to peer rejection, bullying and perceived negative judgement from peers has been linked to higher anxiety (Carpenter Rich et al., 2009; Den Houting et al., 2018). A study by Pavlopoulou et al. (2025) found that autistic and ADHD adolescents experienced alienation and social dislocation, often feeling the need to hide their true ND self instead of causing conflict amongst peers or at school. Neurodivergent people reported repeatedly being dismissed or misunderstood by others, leading to upsetting experiences of rejection or self-doubt (Pavlopoulou et al., 2025). Differences in emotional regulation for ND people have been highlighted as a potential mediator of increased emotional burden, resulting in mental health problems; for instance, secondary school students with ADHD and autism experienced upsetting experiences at school that were associated with increased anxiety and depression compared to their neurotypical peers (Lukito et al., 2025).
Few researchers have examined anxiety in young people under a broad ‘ND’ umbrella despite high levels of comorbidity. For instance, ADHD may co-occur in children diagnosed with autism 59% of the time (Stevens et al., 2016), while 25%–50% of children with dyslexia also have ADHD (McBride, 2019). Saltz (2017) summarised that ‘brain differences and the symptoms associated with them are not discrete’ (p. 10), highlighting the difficulty of trying to categorise and label the experiences of ND populations. In a systematic review of ND childhood conditions, Francés et al. (2022) suggested that ‘comorbidity is the norm’ (p. 1). Despite this, neurodevelopmental conditions have rarely been assessed collectively (Francés et al., 2022). In the present study, we aimed to explore anxiety scores in young people using a neurodiversity model, which promotes inclusion of a spectrum of ND experiences (Dwyer, 2022).
Young people with disabilities who do not fall into the ND label also experience heightened levels of anxiety. For example, young people with conventional hearing aids experience higher social anxiety and general anxiety compared to normally hearing children (Theunissen et al., 2012), and deaf young people have reported more total fears and anxieties than hearing people, including fear of the unknown, injury or medical procedures (Li & Prevatt, 2010). Visual impairment has also been associated with anxiety symptoms at a rate significantly higher than the general population (Hashemi et al., 2024). Similarly, young people with chronic pain and functional disability experience significant physiological anxiety, with fear of pain contributing to avoidance of activities such as school (Simons et al., 2011).
Biopsychosocial Model of Well-Being
The biopsychosocial model of well-being provides a framework for understanding health and well-being through multiple interacting layers or systems (Engel, 1977). This lens can be applied to neurodiversity (Whelpley et al., 2023) and used to understand the impact of biological, psychological and social factors on health outcomes such as anxiety. Neurodivergent life experiences may contrast deeply with neurotypical life experiences. On a biological level, for instance, young people who are ND may have differences in brain connectivity or neurotransmitter pathways; they may experience psychological variation from the norm in terms of attention, memory, focus or cognitive flexibility; and finally, neurodivergence is consistently associated with differences in social functioning (Doyle, 2020).
Factors Associated with Anxiety
Sleep disorders are often comorbid with anxiety conditions among young people (Iwadare et al., 2015). Several studies indicate a strong relationship between anxiety and sleep disturbance in ND individuals. For example, when Bettencourt et al. (2024) categorised study participants as either ‘regular’ or ‘poor’ sleepers, young people with ADHD, autism and learning disabilities were disproportionately represented in the poor sleep group. This may be due to biological or genetic differences, psychological features associated with neurodivergence or specific factors in the family or home environment (Richdale & Schreck, 2009). Sensory over-responsivity is often present in different forms of neurodivergence and is associated with both sleep problems and increased anxiety ( Mazurek & Petroski, 2015). Children with autism were shown to experience sensory problems, which were associated with sleep disturbance (Mazurek & Petroski, 2015). Some studies have found biological factors linking neurodiversity and sleep difficulties, for example, differences in grey matter volume and gene expression in people with ADHD (Shen et al., 2020). Poor sleep also had a strong negative relationship with emotion regulation, which is known to be associated with anxiety (Bettencourt et al., 2024).
Many researchers have linked differences in social functioning to experiences of anxiety in ND people. McVey et al. (2018) investigated the association between social difficulties in autistic young people in association with anxiety and ADHD symptoms. Parents reported higher social challenges for young people with a combination of autism, ADHD and anxiety. Acker et al. (2018) demonstrated that difficulties with social communication, a symptom of DSM-5 autism criteria, were a catalyst for high levels of anxiety. Milton (2012) suggested that non-autistic people may struggle to understand autistic people, reflecting a mutual social communication difficulty. A breakdown in mutual understanding can happen between groups with different experiences. Autistic people often experience the world in different ways, and challenges arising in social interactions may be due to a mismatch in social communication rather than autistic cognition alone. Being repeatedly misunderstood could increase anxiety in autistic young people, particularly as a social minority. Autistic young people worried about jeopardising friendships, causing arguments and being humiliated in social situations (Acker et al., 2018). Mammarella et al. (2016) theorised that higher social anxiety in young people with learning disabilities may be related to difficulty understanding non-verbal social cues, such as facial expressions. Fear of failure and judgement has been linked to ND anxiety. Den Houting et al. (2018) used an autism-specific measure of anxiety, the ASC-ASD, and found that 80% of parents reported that their autistic child sometimes or always worries about being judged negatively by peers if they do something poorly.
Havewala et al. (2022) found that higher peer support in children with ADHD was associated with lower anxiety symptoms, and peer support was also a protective factor for developing later anxiety symptoms. Lower quality social relations have been associated with higher anxiety levels in autistic children, suggesting that higher quality social relationships may help to reduce anxiety levels in this group (Eussen et al., 2012). Eisenberg et al. (2024) theorised that prosocial behaviours could be linked to reduced internalising problems like anxiety in autistic children through multiple mechanisms, such as positive feelings experienced when engaging in prosocial behaviour, improved social integration or providing positive meaning and value in the child's life.
Another potential contributor to anxiety in ND young people is bullying victimisation. The parents of 1121 young people with autism reported that those who were frequently bullied had higher levels of internalising problems and emotional regulation challenges (Zablotsky et al., 2013). Young people with autism were shown to experience higher rates of bullying victimisation. Those with comorbid ADHD were even more likely to be victims of bullying (Zablotsky et al., 2013). Peer rejection, teasing and other bullying behaviours could be related to differences in socialisation in ND young people. Young people with ADHD may have poorer relationships overall and engage less socially during leisure or hobby time (Harpin et al., 2016). Symptoms such as hyperactivity and impulsivity can be perceived as violating societal expectations, leading to difficulties in building strong relationships with peers and thus leaving ND children more vulnerable to bullying victimisation (Voltas et al., 2023).
The mental health of parents can influence anxiety development in young people through a range of mechanisms, including genetic and environmental factors (Jami et al., 2021). Parents of ND young people may experience higher anxiety and parenting-related stress, with lower psychological well-being scores than parents of neurotypical young people (Lai et al., 2019; Musa & Shafiee, 2007). Miranda et al. (2015) examined parenting stress levels for parents of ND 5- to 9-year-olds, finding significantly higher stress levels in comparison to the control group. Greater parenting demands and higher tension in the ND parent–child relationships may have had a role in this result (Miranda et al., 2015). Another study examining 6- to 8-year-olds with ADHD and their parents found that stress levels of primary caregivers were one of the strongest predictors of anxiety in their children (Mulraney et al., 2018). Parent mental health was measured by mother-reported prenatal stress, anxiety disorder diagnosis and depression or anxiety symptoms. Significant social and conduct issues in children with ADHD were found to be associated with poorer parent mental health and irritable parenting practices (Mulraney et al., 2018). For example, a parent punishing the child while feeling angry. Khan and Malik (2018) found that 7- to 12-year-olds with dyslexia exhibited significant behavioural-emotional problems which could be attributed to maternal stress and anxiety. They suggested that increased anxiety in dyslexic young people could be related to consistent stress and failure at school, leading to anxiety when faced with new situations. Maternal stress from navigating their child's challenges could then be connected to even more increased emotional problems ( Khan and Malik 2018). Further exploration is needed to determine how parent–child relationships may influence an ND child's emotional well-being and development.
We adjusted for a wide range of covariates, based on the current literature. Pacific and Māori children may be more vulnerable to higher anxiety (Anderson, 2021). Higher maternal education is also positively associated with mental health throughout adolescence (Meyrose et al., 2018). Maternal age, parity, gender and maternal BMI have all previously been linked to higher levels of childhood anxiety (Anderson, 2021; Bender et al., 2012; Kingston et al., 2015; Meyrose et al., 2018). Pregnant mothers who experienced higher depression symptoms, anxiety symptoms and overall distress also showed a greater risk of increased anxiety symptoms in their children (Kingston et al., 2015). Folate and vitamin intake, maternal smoking behaviour and prenatal alcohol consumption have also been associated with childhood anxiety (Anderson, 2021; Hill et al., 2000; Walker et al., 2024).
The Present Study
The present study aimed to examine associations between neurodivergence (as a broad umbrella term) and anxiety symptoms in young people 12 years of age, using data from the Growing Up in New Zealand (GUiNZ) study. We also sought to determine longitudinal predictors of anxiety in ND young people. Furthermore, we investigated anxiety scores between ND young people and their neurotypical peers. We also examined anxiety scores for their peers with disabilities other than neurodivergence, such as hearing or visual impairment, compared to a comparison group of young people with no known disability (NKD), to better understand how disability overall may impact anxiety at age 12. We also investigated the effects of sleep problems, social and peer problems and parenting issues on anxiety in 12-year-olds with and without neurodivergence. This research will help to better understand the overlap between neurodivergence and anxiety during this critical period of development, without focusing on a specific diagnosis.
We hypothesised that ND young people would have higher anxiety scores at age 12 relative to both the NKD group and the other-disability comparison group. We expected that more positive perceived peer communication and trust would be protective against anxiety, while sleep problems, poorer parent–child relationships, higher parental stress and bullying would be positively associated with anxiety in ND youth.
Method
Participants
Participants in the present study came from the GUiNZ research project. The GUiNZ is a longitudinal study with a large, socio-demographically representative sample of 6853 young people, who have been followed since their mothers’ last trimester of pregnancy, beginning in 2009 and 2010 in the Auckland, Counties Manukau and Waikato regions (Morton, 2019; Napier et al., 2023). Information about the child's physical and psychological well-being is routinely gathered through interviews and questionnaires involving the child and their parents. This includes gathering data about the parents’ own physical and mental health. The present study examined data obtained during the antenatal, age 8 and age 12 Data Collection Waves (DCW). Overall, 4563 participants (66.6%) completed the anxiety questionnaire at age 12 DCW and were included in the present study.
Measures
Neurodivergence and Disability
At the age 8 DCW, mothers reported on their child's general health, selecting all conditions that applied to their child. This included if their child was affected by ‘Autistic Spectrum Disorders (including Asperger's)’, ‘learning difficulties’ or ADHD. At age 12, mothers again reported whether their child had ever had one of several conditions, which included ADHD, ‘learning disability’ or ‘Autism Spectrum Disorder’. They were also asked to identify whether their child had a ‘learning support need or disability’ and to specify the reason for receiving support. Possible responses included specific learning disability (literacy), specific learning disability (numeracy), learning disability/intellectual disability, autism spectrum disorder and ADHD. Participants who responded affirmatively to any of the above conditions or difficulties at age 8 or 12 were classed as ND (n = 562; see Table 1).
Frequency Statistics for Each Condition Identified at Age 8 and/or 12.

Note: N = number of participants in the original sample who also completed the PROMIS anxiety questionnaire at age 12.
PROMIS: Patient-Reported Outcomes Measurement Information System.
A new two-level variable was created to indicate ‘Functional Difficulties’ (FD). Participants self-reported their functioning at age 12 using questions from the Washington Group Short Set (WG-SS), which is designed to identify people aged five years or over who may be experiencing disability (2022). They reported whether they had difficulties seeing, hearing or walking. Those who answered, ‘Yes - a lot of difficulty’ or ‘Cannot do at all’ were categorised in the ‘FD’ group. Questions from the Washington Group Child Functioning Module (CFM) (2020) were also used to identify disability at age 12. Mothers reported if their child had a learning support need or disability, including hearing impairment, vision impairment, physical disability, illness or speech or language impairment. Based on responses to these sets of questions, participants were coded either as ‘0’, if no disability was reported, or ‘1’ if any disability (AD) was reported. A total of 201 participants from our sample were categorised as having FDs.
Of note, 87 participants from our sample identified with both ND and FD. Individuals without a self-reported or primary caregiver-reported disability (N = 3800) were included in a NKD comparison group. To explore ND and FD experiences, the ND-only (N = 562) and FD-only (N = 114) groups were used for further modelling. A further comparison group, ‘AD’, was created by combining participants who had reported any kind of disability or neurodivergence into one category to help us understand the underlying mechanism contributing to anxiety (N = 763).
Anxiety at Age 12
Anxiety was assessed at age 12 through the validated Patient-Reported Outcomes Measurement Information System (PROMIS) paediatric anxiety 8a (version 2) short-form scale (Irwin et al., 2010). The 8-item self-report questionnaire is designed to measure children's (aged 8–17 years) experiences of anxiety over the last four weeks on a 5-point Likert-type scale (‘Never’ to ‘Almost always’). Items include asking if the child felt nervous, scared or worried. The PROMIS anxiety score is a standardised T-score (ranging from 33.50 to 83.30) with a mean of 50 and a standard deviation (SD) of 10 based on a reference population, allowing for meaningful comparisons across different populations and levels of anxiety. Higher PROMIS scores indicate greater levels of anxiety symptoms.
Predictor Variables
Sleep Problems
At age 8, mothers were asked, ‘How would you describe {NAME's} sleeping patterns or habits?’. Those who responded with ‘a small problem’, ‘a moderate problem’ or ‘a large problem’ were combined into one group and compared against those who reported ‘no problem’. The final dummy variable indicated whether sleep problems were present at age 8 (yes or no). Of the 4777 participants who responded, 1425 (29.8%) young people had sleep problems at age 8.
Sleep Duration
At ages 8 and 12, mothers reported the average amount of time their child spent asleep in a 24-h period, including any naps, to the nearest half hour. At age 8, the mean was 9.78 h with a SD of 1.06. The mean sleep duration at age 12 was 9.20 h, with a SD of 1.02 h. Hirshkowitz et al. (2015) report that 9–11 h of sleep is recommended for school-aged children.
Peer and Social Problems
The Strengths and Difficulties Questionnaire (SDQ), which measures emotional symptoms, peer relationship problems, hyperactivity/inattention, conduct problems and prosocial behaviour (Goodman, 2001), was completed by mothers at the age 8 DCW. A peer problems score was derived, ranging from 0 to 10. Higher scores indicate higher peer relationship problems; 1536 (39.2%) participants who completed the questionnaire reported no peer problems.
A self-report peer relationships questionnaire was completed by participants for the first time at age 12, consisting of two subscales: trust and communication (Armsden & Greenberg, 1987). Participants responded to statements such as ‘My friends sense when I’m upset about something’ and ‘My friends encourage me to talk about my difficulties’ using a rating system from 1 to 5, ranging from ‘almost always true’ to ‘almost never true’. An overall peer–child trust score and peer–child communication scores were derived from these responses. Lower scores indicated that a young person responded more positively about their experience of their relationship with their peers (GUiNZ, 2024). For peer–child trust, the mean score was 6.80 with a maximum score of 20, while the mean peer–child communication score was 10.14, also with a maximum score of 20.
Bullying Victimisation
At age 8, young people were asked how often they were bullied at school (Wellbeing@School student survey; Ferral et al., 2012). Of the 4936 respondents, 64.9% reported that they ‘never’ or ‘hardly ever’ were bullied at school; 14.7% reported experiencing bullying victimisation 1–2 times a year, 6.2% reported being bullied 1–2 times a month, 8.1% reported being bullied 1–2 times a week, while 297 participants or 6.0% described being bullied ‘almost every day’.
Parent–Child Relationship
At the age 12 DCW, a parent–child relationship tool was used to measure perceived trust and communication between the child and their parents (Armsden & Greenberg, 1987 ). Young people were asked to respond to statements such as ‘I trust my parent(s)’ and ‘My parent(s) accept me as I am’, on a 4-point scale ranging from ‘almost always true’ to ‘almost never true’. A parent–child trust and parent–child communication subscale score was derived from these questions, in which lower scores indicated more positive experiences. For parent–child trust, the mean score was 6.94, with a maximum score of 20. For parent–child communication, the mean score was 5.52 with a maximum score of 12.
Maternal Depression
Depression symptoms reported by the mother at the age 8 DCW were used as an indicator of mental health and distress. Mothers completed the self-reported Patient Health Questionnaire, which measures symptoms of depression, resulting in a sum score (Kroenke & Spitzer, 2002). This included items about feeling ‘down, depressed or hopeless’, feeling ‘that you are a failure or have let yourself or your family down’ and experiencing ‘thoughts that you would be better off dead or hurting yourself in some way’. Participants reported if they experienced these symptoms on a scale from ‘not at all’ (0) to ‘nearly every day’ (3) over the previous two weeks, with total possible scores ranging from 0 to 27. 61% of mothers scored 3 or less in total in our sample.
Covariates
Antenatal covariates included in the final regression models were maternal prioritised ethnicity (European or Other Ethnicity), maternal highest secondary school qualification (no secondary school qualification, a secondary school qualification or don’t know/refused), maternal age at child's birth (years), parity (first or sequential birth), deprivation index (1 – least deprived to 10 – most deprived), maternal body mass index (BMI, kg/m2), alcohol use during pregnancy (yes or no), regular pre-pregnancy smoking (yes or no) and antenatal perceived stress score. Sex assigned at birth (boy or girl), collected from perinatal health records, was also included. Rurality (urban or rural) was measured at age 12.
Data Analysis
Univariate and bivariate analyses were conducted to determine if the covariates and predictor variables were significantly associated with the primary outcome variable: anxiety score at age 12. For continuous variables, simple linear regression was used. For categorical predictor variables, t-tests and one-way ANOVA were used. Levene's test was used to assess homogeneity of variances (Levene, 1960). Covariates and explanatory variables were selected based on the literature review; variables significantly associated with anxiety scores at age 12 were included in the final modelling. Independent samples t-tests were completed for each disability condition using a unique binary categorical variable for each analysis, comparing anxiety scores for each group with those with NKD. To estimate the effect sizes for t-tests, Cohen's d was calculated. Effect sizes of d = 0.2 are generally considered small, d = 0.5 as medium and d = 0.8 as large (Cohen, 1988). Three multiple hierarchical regression models were completed.
The predictor variables included in the final regression analyses were sleep problems (age 8), sleep duration (age 12), peer problems (age 8), bullying victimisation at school (age 8), peer–child trust (age 12), peer–child communication (age 12), parent–child trust (age 12), parent–child communication (age 12) and maternal depression (age 8).
Sociodemographic and maternal variables formed the first block of the regression model to adjust for biological and prenatal factors that may influence the child's development. The second block contained predictor variables related to issues with sleep, which may be biological or psychological in nature. Predictor variables in the third block were related to social relationships, parenting and bullying victimisation, accounting for the social aspect of the biopsychosocial framework. Finally, a fourth block analysed differences in the comparison group (NKD) and each disability condition. Regression blocks were run in this order to align with the biopsychosocial model of well-being (Engel, 1977).
Assumption Testing
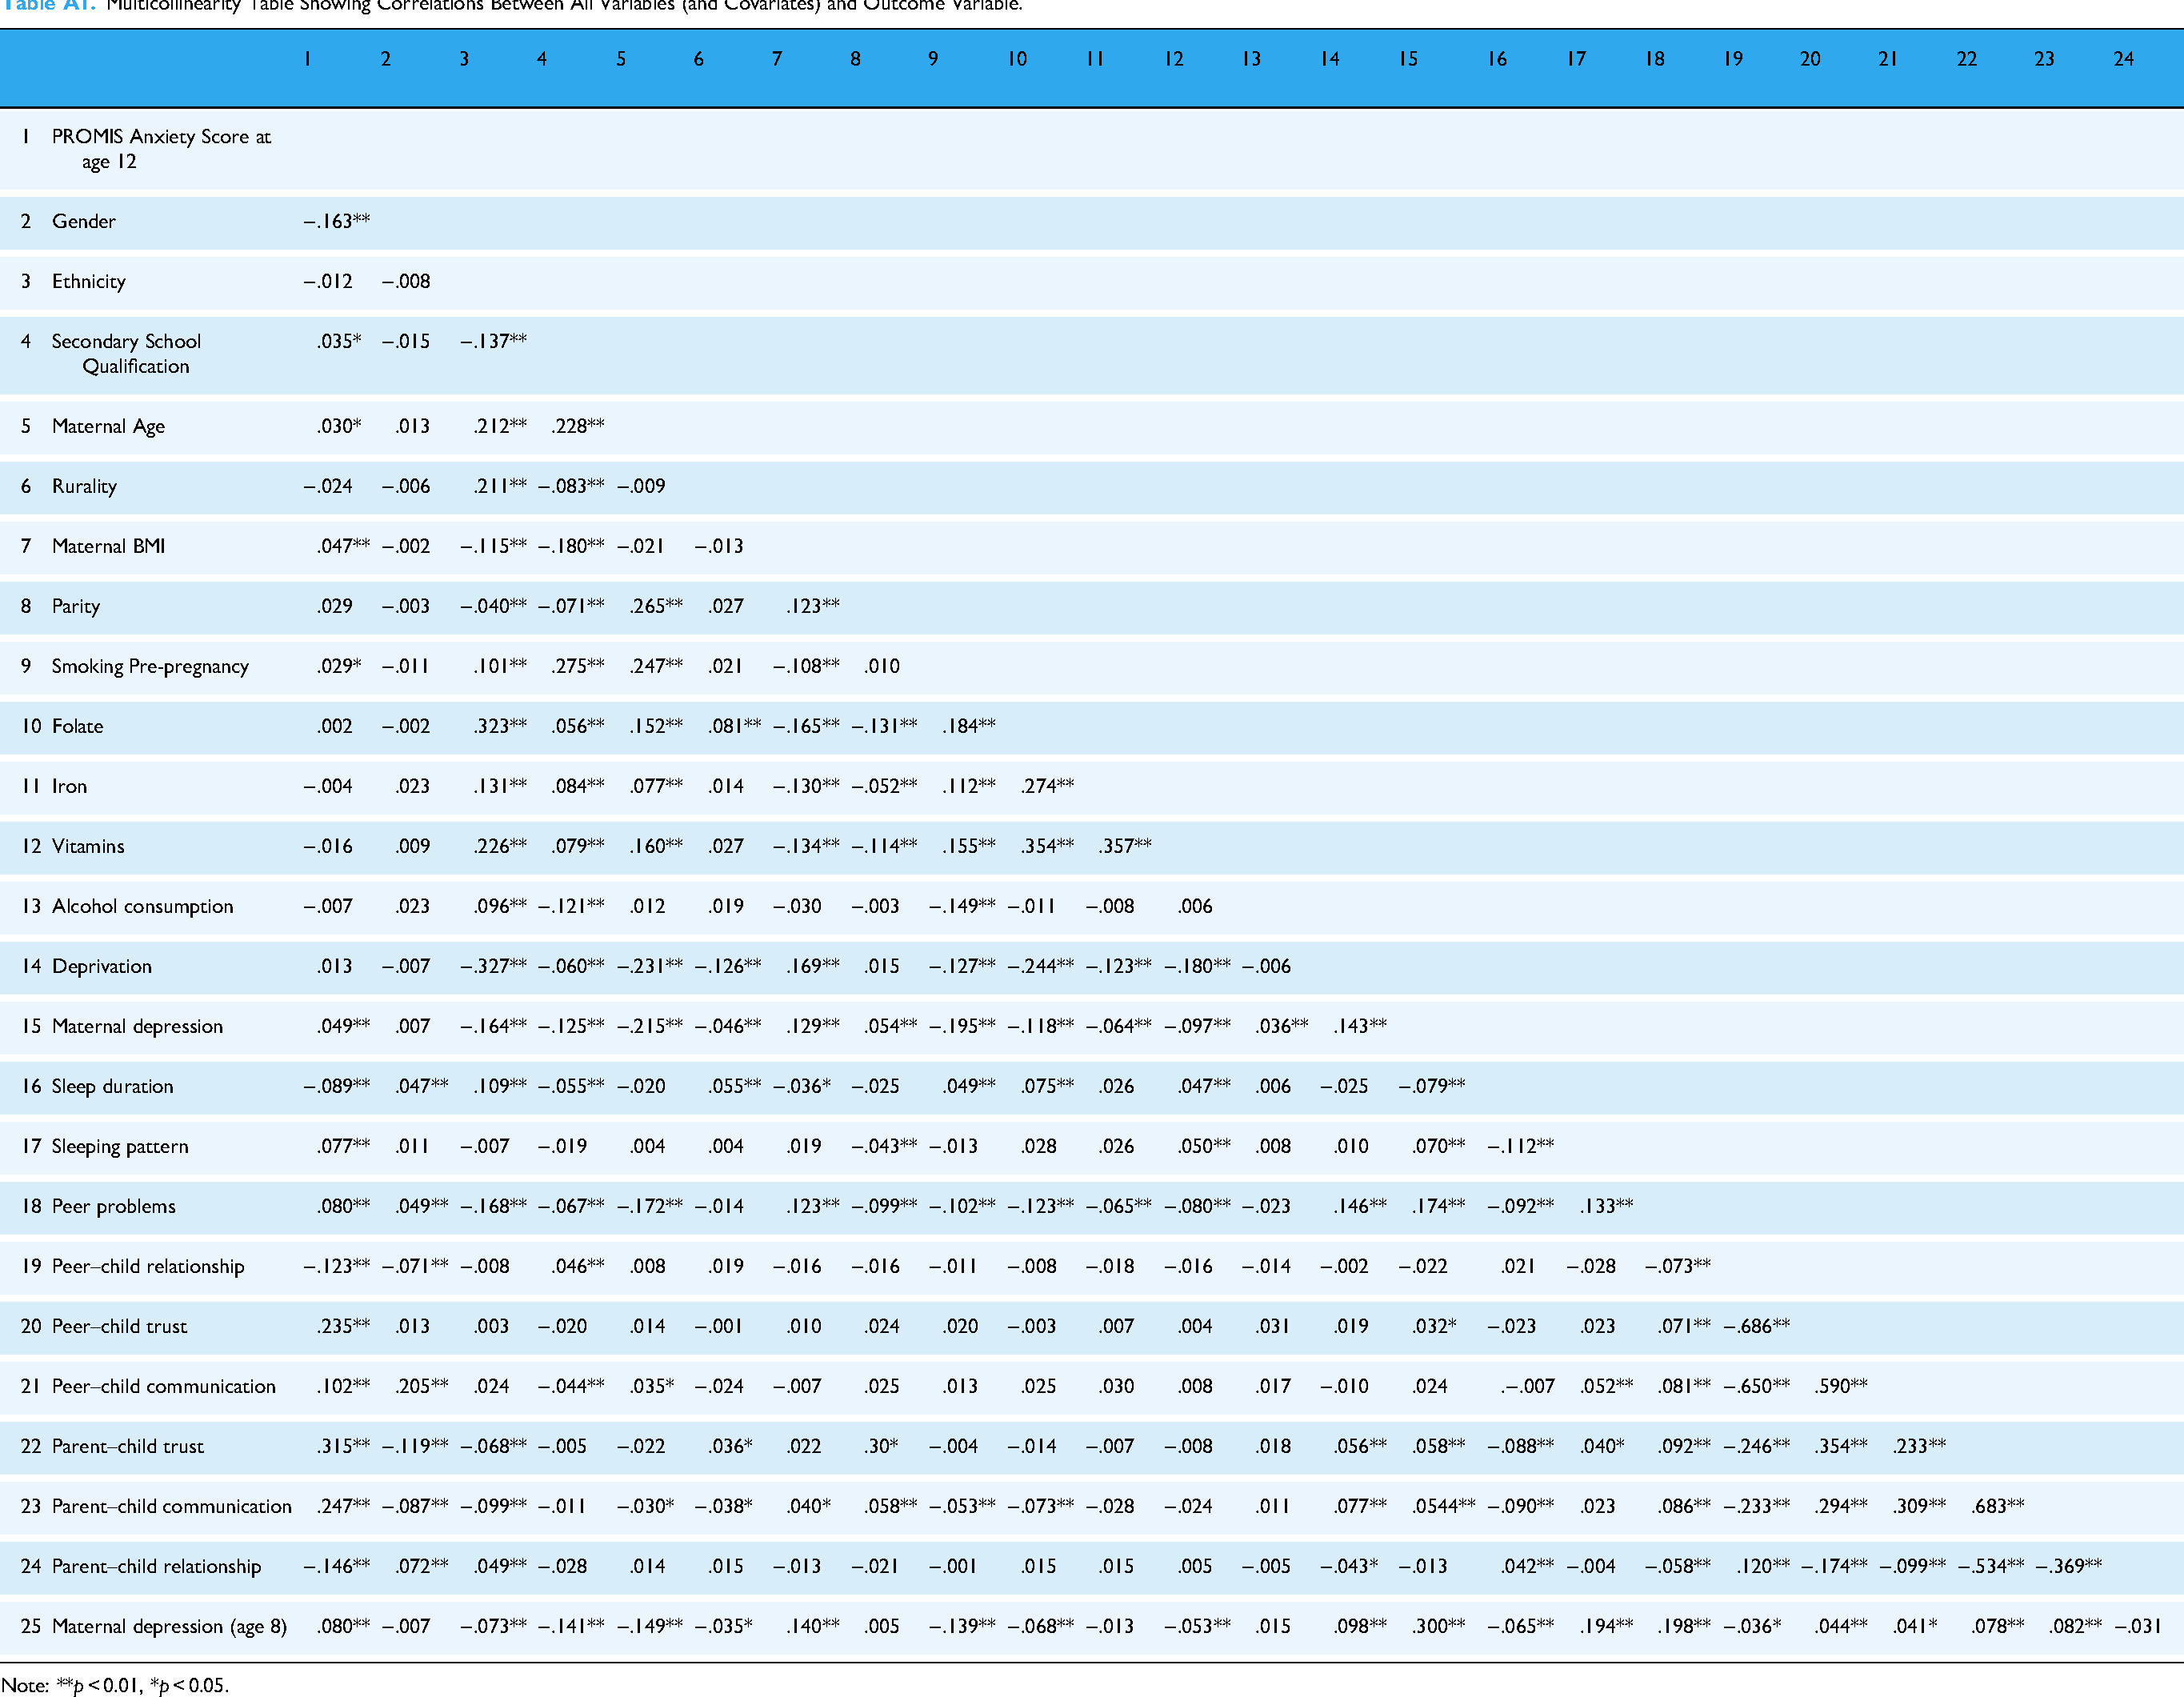
Before the regression model was run, assumptions were tested to ensure validity. The Durbin–Watson test statistic for the first analysis was acceptable at 1.998 for Analysis 1A, 2.028 for Analysis 1B and 2.012 for Analysis 1C (Durbin & Watson, 1950; Field, 2024). All variables were also screened for multicollinearity using a bivariate Pearson correlation analysis, with an exclusionary threshold of ≥0.7 (Tabachnick, 2007) (Table A1, Appendix A). The peer relationship sum score (age 12) and parent–child relationship sum score were removed due to high collinearity (>0.7) with other variables. All other correlations were within acceptable limits (<0.7). The anxiety scores’ residual histogram had a bell shape, though slightly skewed to the right. This made sense as only a minority of the population could be expected to have significant anxiety scores (Kieling et al., 2024). All other assumptions were met.
Missing Cases and Preliminary Analyses
Participants who did not complete the PROMIS Anxiety questionnaire at age 12 were more likely to be male, European, live in a more deprived area and not have FD (Table B1, Appendix B). Sleep duration at age 8 was not significantly correlated with anxiety at age 12, so was not included in the final multivariable model. The multiple linear regressions were run with missing cases excluded listwise. IBM SPSS Version 29 was used to conduct analyses, with a statistical significance level of α = .05.
Results
Table 2 shows bivariate associations between anxiety scores at age 12 and disability condition. Neurodivergent-only young people had a higher mean anxiety score than those with NKD, but this finding was not significant. Young people with NKD had significantly lower anxiety scores on average, while having a disability other than neurodivergence was significantly associated with greater anxiety. Those in the ‘AD’ group, including participants with neurodevelopmental and FDs, had significantly higher anxiety scores at age 12 compared to the baseline group.
Bivariate Associations Between Each Disability Group, Disability Condition and Anxiety Score at Age 12.

Note: N = number of participants in the original sample who also completed the PROMIS anxiety questionnaire at age 12.
**p < 0.01, *p < 0.05.
PROMIS: Patient-Reported Outcomes Measurement Information System.
Table 3 shows the descriptive statistics and bivariate associations for covariates and predictor variables significantly associated with anxiety scores. Anxiety scores were higher in girls than in boys. The presence of sleep problems and more frequent experiences of bullying victimisation at age eight were significantly associated with greater anxiety at age 12.
Descriptive Statistics, Cohen's d and Bivariate Associations for Categorical Covariates and Predictor Variables with Anxiety at Age 12.
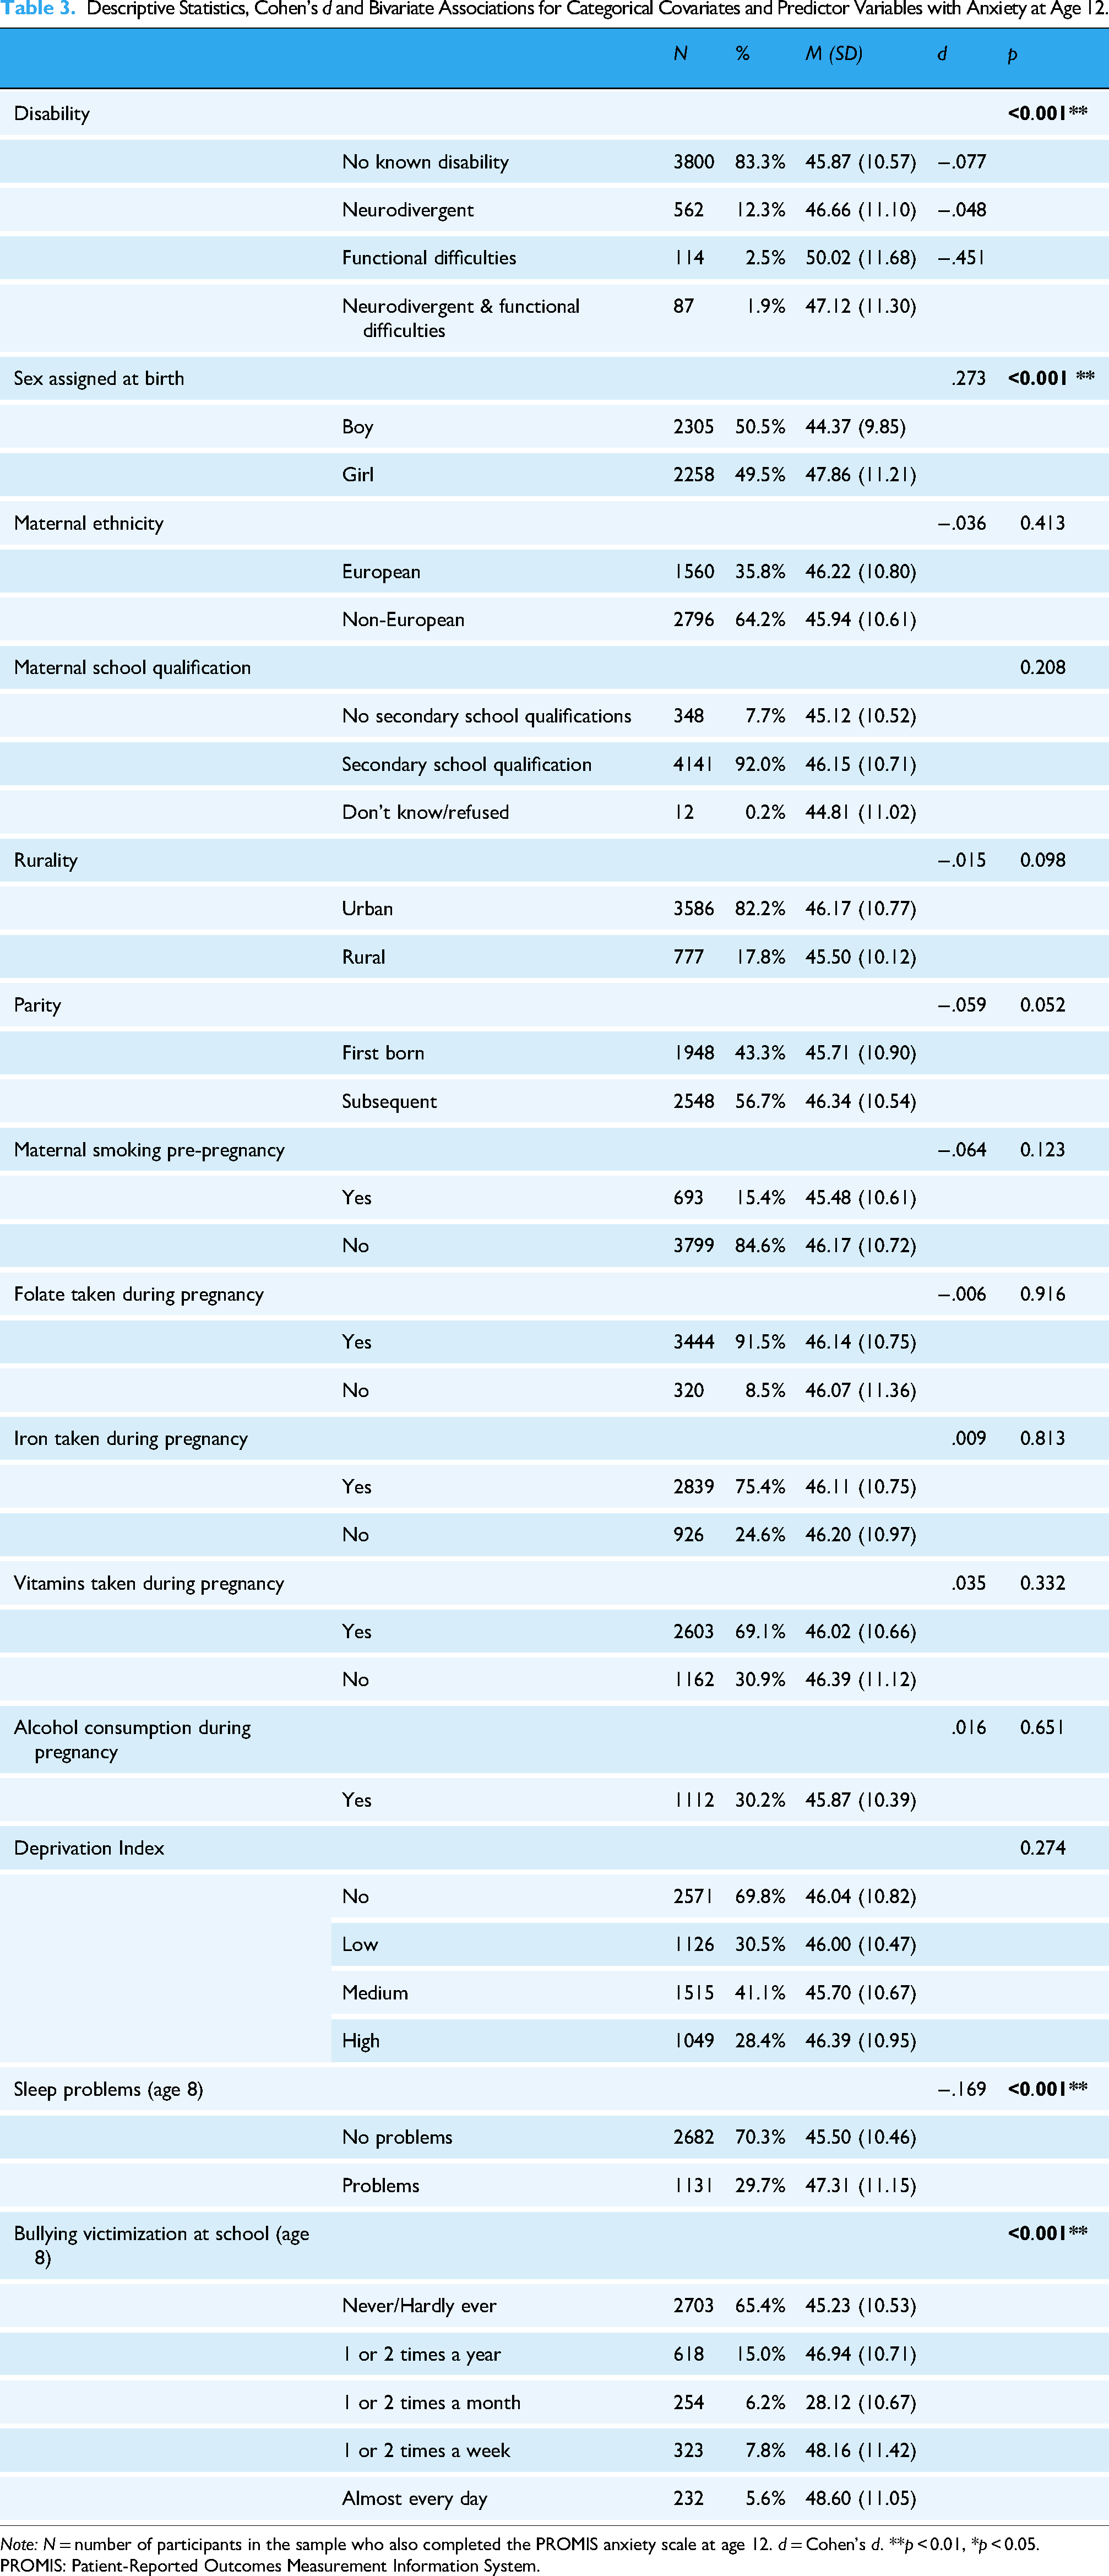
Note: N = number of participants in the sample who also completed the PROMIS anxiety scale at age 12. d = Cohen's d. **p < 0.01, *p < 0.05.
PROMIS: Patient-Reported Outcomes Measurement Information System.
As shown in Table 4, young people with higher anxiety scores at age 12 were more likely to have mothers who were older, had a higher BMI, higher prenatal perceived stress and higher depression scores. Shorter sleep duration, higher peer problems, lower trust in peers and lower trust in the parent were associated with higher anxiety. Poorer perceived communication with both peers and parents was associated with higher anxiety.
Descriptive Statistics and Bivariate Associations Between Anxiety Score at 12 Years and Continuous Covariates and Predictor Variables.
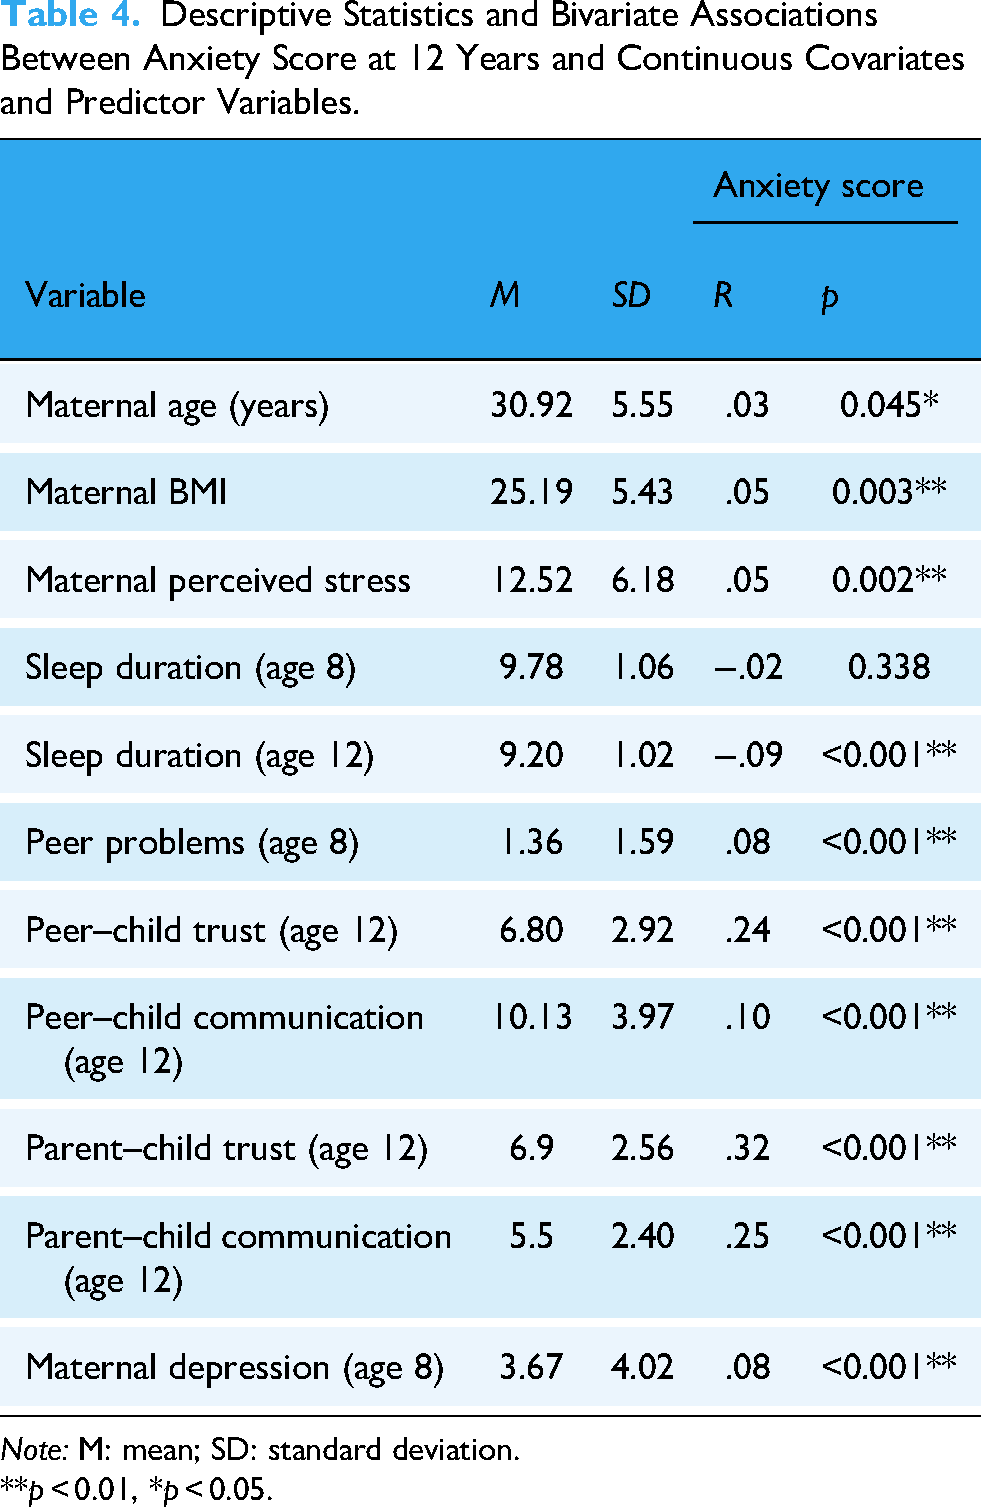
Note: M: mean; SD: standard deviation.
**p < 0.01, *p < 0.05.
Table 5 shows the results from the first hierarchical regression model. The first block, containing covariates, was significant and explained 2.7% of the variance in anxiety at age 12 (R2 = .027, F (14, 2245) = 4.466, p < 0.001). Being female was associated with higher anxiety. The second block, containing sleep-related factors, was significant. Young people with sleep problems and with shorter sleep duration experienced higher anxiety on average (R2 = .037, F (16, 2243) = 5.456, p < 0.001). Social factors and relationships also proved significant when added to the model (R2 = .155, F (23, 2236) = 17.800, p < 0.001). The final block added ND to the model and was not significant (R2 = .155, F (24, 2235) = 17.078, p = 0.455). The overall model proved significant and helped explain 15.5% of the variance in anxiety at age 12 years. Analysis 1B repeated this modelling, with the final block including FD (Table 6). Several sociodemographic variables, sleep duration, bullying victimisation, peer trust and communication and parent–child trust were significant predictors of anxiety within the model. Having an FD was associated with a .05-point increase in anxiety score at age 12, which was significant (R2 = .178, F (24, 2005) = 18.142, p = 0.012).
Analysis 1A. Hierarchical Multiple Regression Considering Covariates (Block 1), Biological Factors (Block 2), Social and Parenting Factors (Block 3) and Neurodivergence (Block 4) in Relation to Anxiety Scores in Young People at 12 Years.
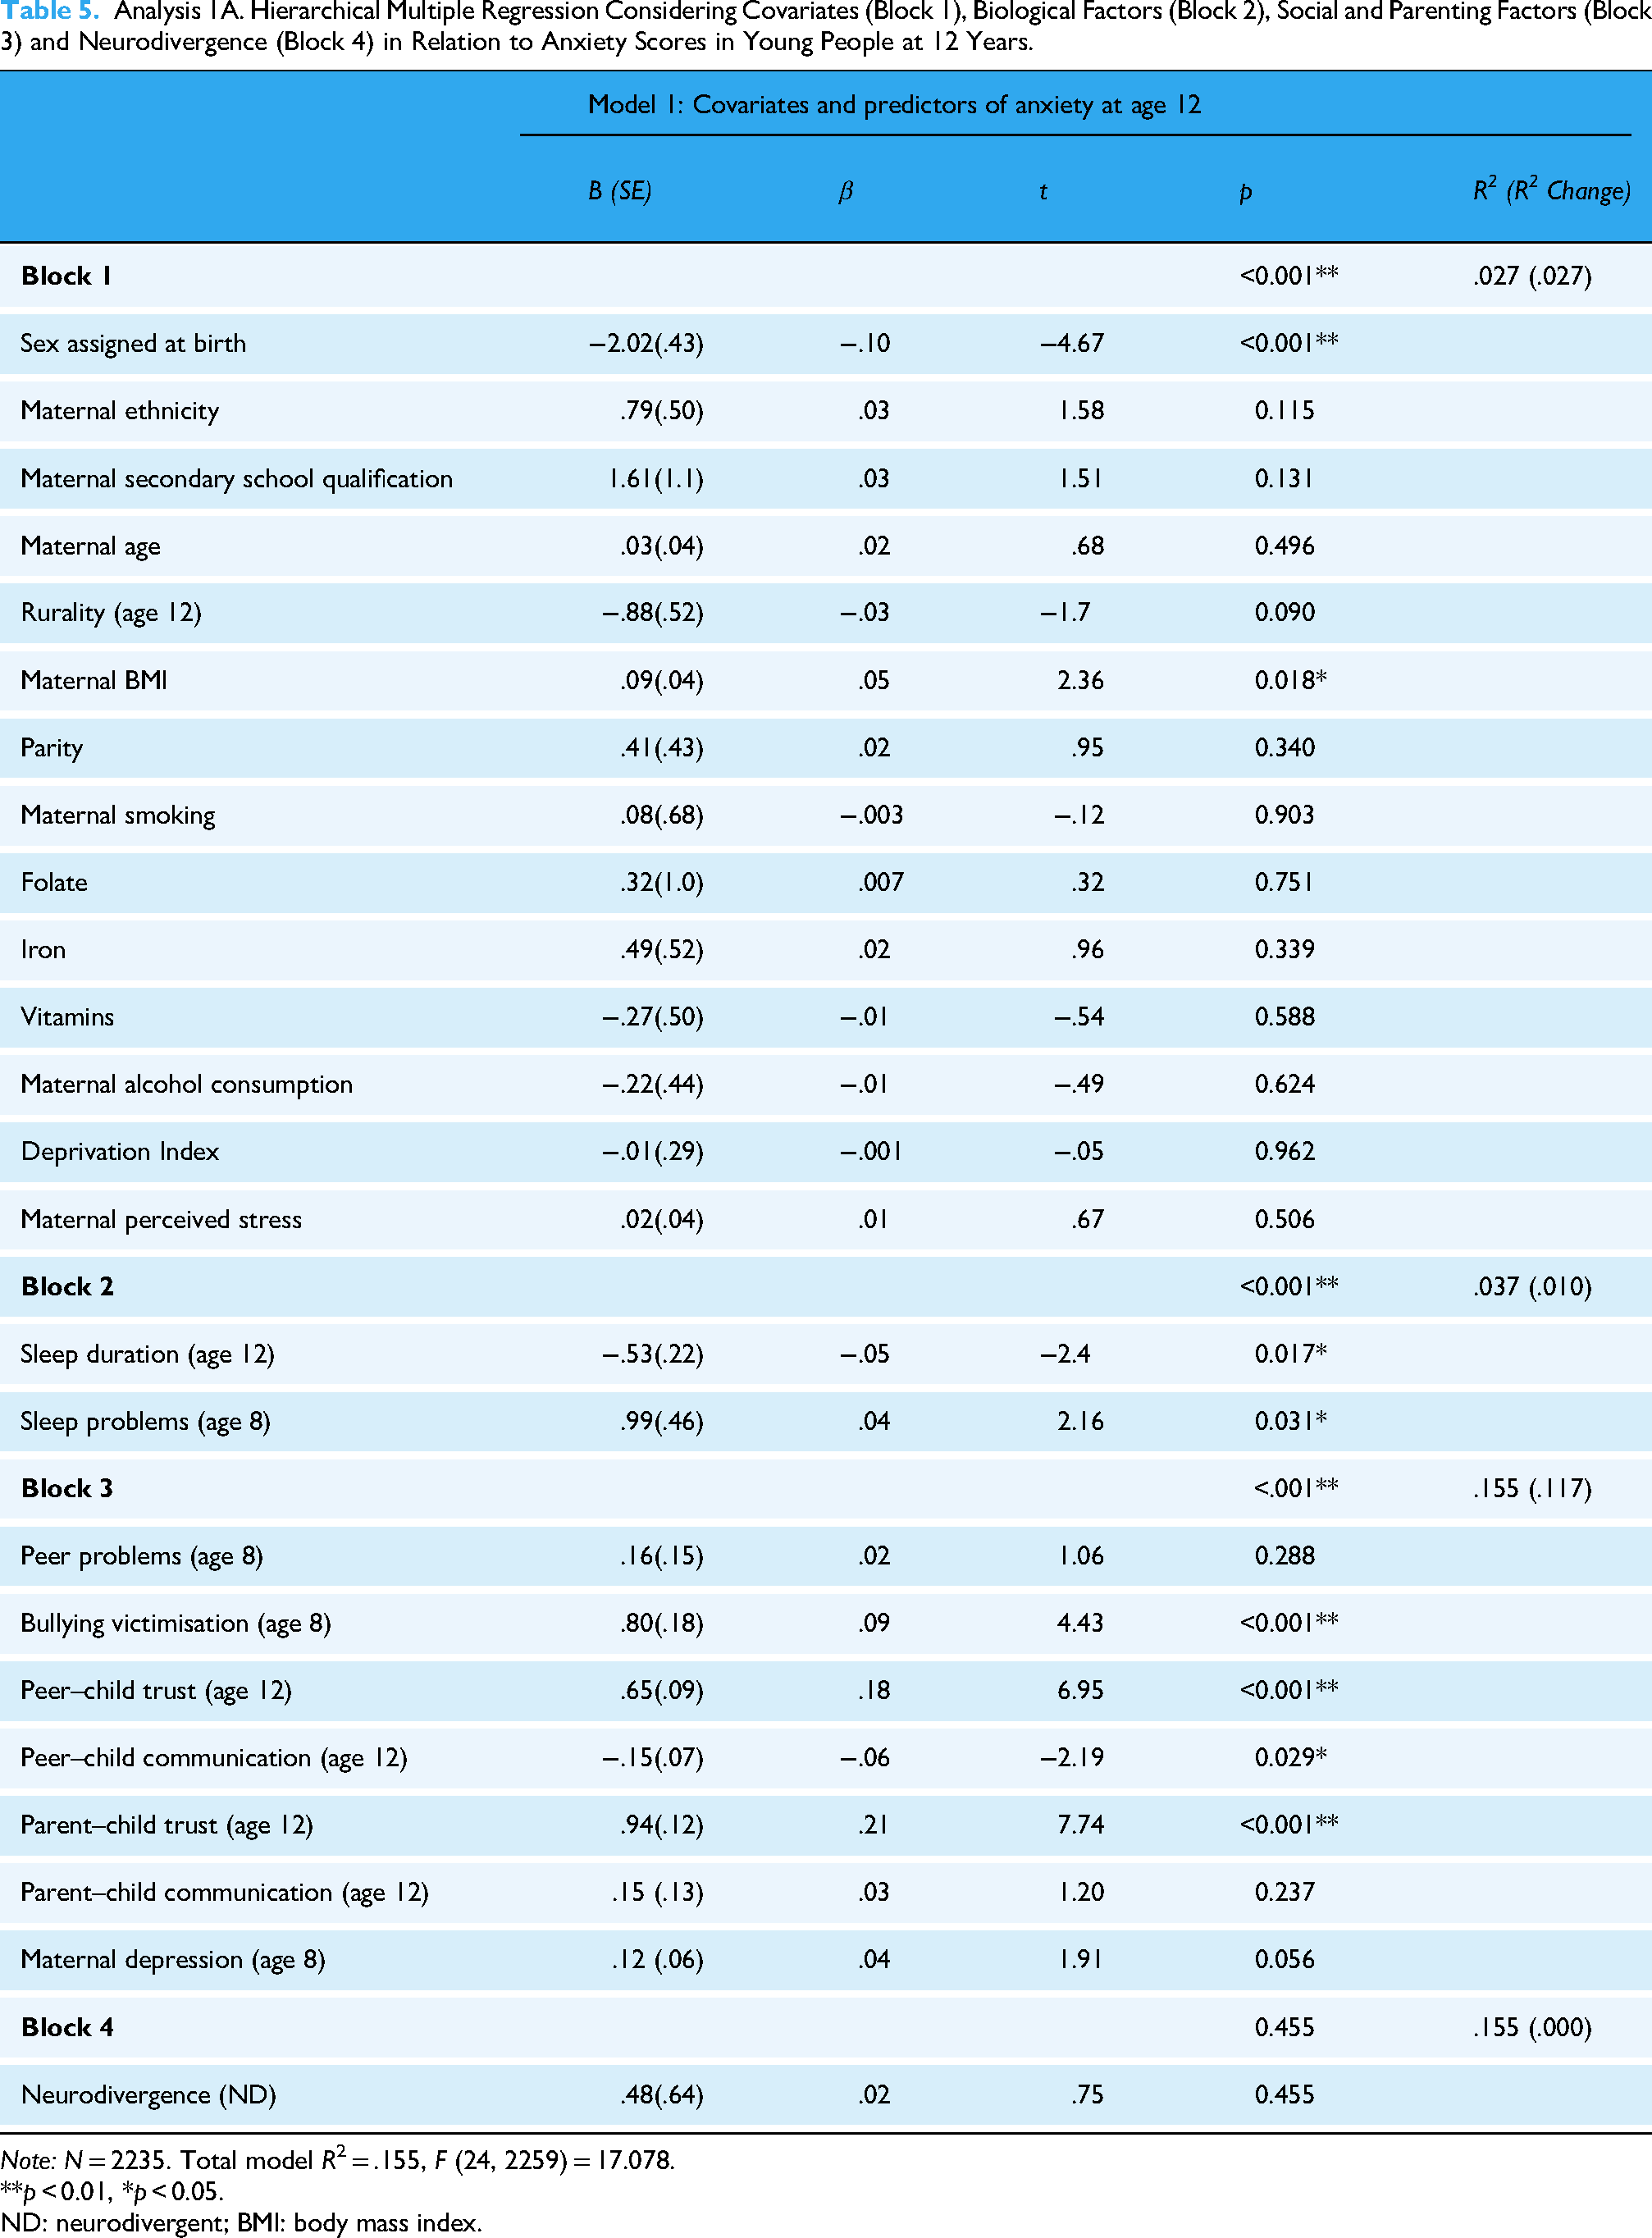
Note: N = 2235. Total model R2 = .155, F (24, 2259) = 17.078.
**p < 0.01, *p < 0.05.
ND: neurodivergent; BMI: body mass index.
Analysis 1B. Hierarchical Multiple Regression Considering Covariates (Block 1), Biological Factors (Block 2), Social and Parenting Factors (Block 3) and Other Disability (Block 4) in Relation to PROMIS Anxiety Scores in Young People at 12 Years.

Note: N = 2005. Total model R2 = .178, F (24, 2029) = 18.142.
**p < 0.01, *p < 0.05.
BMI: body mass index; PROMIS: Patient-Reported Outcomes Measurement Information System.
A final analysis explored AD and anxiety scores at age 12 (Analysis 1C, Table 7). Block four added AD as a predictor variable, which explained an additional 0.1% of the variance in anxiety at age 12; however, this result was not statistically significant (R2 = .165, F (24, 2317) = 19.076, p = 0.057). Having AD did not significantly increase anxiety scores at age 12 after maternal, prenatal, sleep and social factors were accounted for.
Analysis 1C. Hierarchical Multiple Regression Considering Covariates (block 1), Biological Factors (Block 2), Social and Parenting Factors (Block 3) and any Disability (Block 4) in Relation to Anxiety Scores in Young People at 12 Years.

Note: N = 2317. Total model R2 = .164, F (24, 2341) = 19.076.
BMI: body mass index.
**p < 0.01, *p < 0.05.
Discussion
The aim of the current research was to investigate the relationship between neurodivergence and anxiety among 4563 12-year-old members of the GUiNZ study. We hypothesised that ND young people would have higher anxiety scores at age 12 relative to their peers with NKD or with FDs. We instead found that young people with FDs had significantly higher anxiety scores than their non-disabled peers, while neurodivergence was not significantly associated with anxiety after multiple variables (including sleep, sociodemographic variables, social and parenting factors) were accounted for. In accord with our hypotheses, sleep problems, shorter sleep duration, parent-reported peer problems and difficulty trusting peers were all associated with higher anxiety scores. Poorer trust and communication with parents were also associated with higher anxiety.
As noted, in contrast with our hypothesis and earlier studies (Adams et al., 2020; Rucklidge et al., 2016; Santos et al., 2023), neurodivergence was not significantly associated with anxiety scores. While the ND youth in our study had higher average anxiety scores compared to those with NKD, this difference was not statistically significant after predictors and covariates were accounted for. The gap between these findings and the literature might be attributed to the underdiagnosis of neurodevelopmental disorders at this age. Underdiagnosis is a significant issue due to multiple challenges. These include comorbidities with mental health concerns, which may complicate accurate diagnoses, issues with available diagnostic instruments, access to healthcare, different cultural views of social development and poor training of staff (Hus & Segal, 2021). Another contributing factor may be masking, a defence mechanism in which people adapt to social situations by camouflaging their ND traits, either consciously or unconsciously suppressing their natural responses, often to attempt to reduce anxiety by relieving consequences such as judgement and bullying (Lei et al., 2024; Pearson & Rose, 2021). This can obscure ND in young children, even despite significant distress (Weissman, 2020). Camouflaging socially has been tied to poor mental health amongst ND girls aged 11–14 years (McKinney et al., 2024). Neurodivergent girls are also more likely to be undiagnosed due to subtler symptoms and other diagnostic limitations, despite internalising disorders proving extremely prevalent in ND girls (Mahone & Wodka, 2008). Gender bias may significantly impact the diagnostic process for young girls (Hus & Segal, 2021). As shown in our results, girls reported significantly higher anxiety scores at age 12; however, ND girls may have been misrepresented in our data, skewing the results.
Overall, disability condition was significantly associated with anxiety scores at 12 years, consistent with the literature. Once covariates, sleep, social issues and parenting were adjusted for, the AD group no longer significantly predicted anxiety scores at 12 years. Functional Difficulties, but not ND, were significantly associated with higher anxiety at age 12. This suggests that experiences specific to ND young people may not have a significant impact on anxiety scores at this age. It is important to note, however, that our sample size may have led to a Type I error, and therefore, our findings should be interpreted with caution. With all other variables accounted for, shorter sleep duration, being bullied at school, higher maternal depression scores, poorer peer–child trust and parent–child trust were all significantly associated with greater anxiety. Unexpectedly, perceiving peer–child communication as more positive at age 12 was associated with higher anxiety. However, this finding was consistent with other research that showed that better-quality friendships were associated with higher anxiety for autistic children (Mazurek & Kanne, 2010). The researchers theorised that differences in skills like perspective-taking or self-awareness in ND young people could influence anxiety levels. These social skills may be influential in the development of particular anxious cognitions. For instance, lower self-awareness of negative social interactions may mean the child is less likely to feel anxious about the experience. Higher symptom severity, which was associated with lower anxiety, may be related to difficulty with these skills (Mazurek & Kanne, 2010). More research is needed to determine the mechanisms associated ND anxiety and social relationships.
These findings support the idea that specific factors and experiences lead to elevated anxiety, rather than general disability. The impact of different disabilities can vary significantly. In this study, anxiety was significantly higher in participants who reported a doctor diagnosis of autism, ADHD-related support needs, difficulty seeing or difficulty walking and climbing. Blindness has been shown to increase psychosocial difficulty in children (Ishtiaq et al., 2016) while disabilities affecting ease of walking or climbing have been associated with higher anxiety and stress due to issues such as impaired social participation (Mckechnie & John, 2014; Rushton et al. 2015). Zhu et al. (2024) found that higher anxiety was positively associated with greater disability severity among people with varied disabilities.
Sleep problems and shorter sleep duration were significantly associated with increased anxiety at age 12, in accordance with our hypothesis. Roberts and Duong (2017) similarly found that shorter sleep duration was associated with twice the risk of developing an anxiety disorder in adolescence, suggesting that genes, cognitive arousal and other biological and cognitive influences may have been important mechanisms. Sleep problems are also frequently associated with anxiety in children; Iwadare et al. (2015) found that sleep disorders were common amongst young people aged 4–12 years with diagnosed anxiety disorders.
Peer problems at age 8, as measured by the SDQ, were associated with higher anxiety scores. This aligned with the literature (Anderson, 2021; Armitage et al., 2023). Poorer friendship quality, fewer positive peers and poorer social skills have previously been associated with higher levels of social anxiety (Flanagan et al., 2008). Victims of school bullying also had significantly higher anxiety, as shown previously in studies of young ND people (Carpenter Rich et al., 2009; Zablotsky et al., 2013). Poorer trust with peers at age 12 was associated with greater anxiety scores, aligning with previous research. Children with extreme trust beliefs in their peers, including too little trust, are at greater risk of psychosocial maladjustment, particularly anxiety (Rotenberg et al., 2014; Starr & Davila, 2008).
Poorer trust and communication scores between young people at age 12 years and their parents were associated with greater anxiety. Parental mental health diagnoses are generally associated with higher childhood anxiety, due to a range of possible factors: parental depression and anxiety are strongly associated with both internalising and externalising behaviours in their children through genetic transmission and environmental factors (Jami et al., 2021). High comorbidity across mental health conditions also suggests a strong genetic influence (Jami et al., 2021). Depression symptoms may impact parenting characteristics and behaviours, which consequently impact mental health outcomes. For instance, lower individual autonomy within the mother–child relationship was associated with higher offspring anxiety (Asselmann et al., 2015), while harsh parenting was associated with higher internalising problems in the child (Jami et al., 2021) and may have influenced trust scores in the present study.
An important limitation of the present study is participant retention: just 66.6% of the overall cohort completed the PROMIS anxiety questionnaire at 12 years of age. Young people who were male, European, living in deprived areas and who had no FD were less likely to complete the anxiety questionnaire, possibly impacting our results. Noteably, only 2235 participants had complete data for variables collected at the age 8 and 12 DCW (Table 5). Future research may also benefit from larger samples of each disability condition. Another limitation was accurately capturing ND in the study population. Young people without a formal diagnosis by the age 12 DCW may have been incorrectly coded as having no disability. Neurodivergent girls may be especially vulnerable to underdiagnosis (Hus & Segal, 2021; McKinney et al., 2024).
To our knowledge, this study is the first to examine the impact of neurodivergence on mental health in NZ. Our evidence that young people with FD or AD have significantly elevated anxiety scores compared to their NKD peers has significant clinical implications and demands further investigation. This study was also novel in using the broad ND and FD categories to compare anxiety scores across different disability conditions in New Zealanders at 12 years. Future research should consider potential protective factors such as school support available, parent education about disability and the number of peers with disabilities in the community (Halstead et al., 2018). School-related factors such as school social support, school engagement and a sense of belonging at school have previously been associated with resilience in ND people, which could be important protective factors for reducing anxiety (Clark & Adams, 2022; Dvorsky & Langberg, 2016). These findings have significant implications for further research. Environmental and family factors such as sleep problems, communication with peers and parent–child communication have a key role in anxiety development for young people with disabilities. This study also challenges deficit models of disability, which suppose that young ND and disabled people have something ‘wrong’ with them that needs to be addressed or ‘fixed’.
In summary, our findings suggest that having a functional disability is associated with high anxiety symptoms in 12-year-olds, after adjusting for multiple sociodemographic and prenatal factors. These findings are likely due to the unique impacts of disability-related factors on numerous levels, including biological influences, psychological differences and social factors. The impact of disability on children's mental health throughout development is evident and requires further study. Sleep, social and parenting factors likely play an important role in the development of anxiety in young people with disabilities.
Footnotes
Acknowledgements
The authors acknowledge the contributions of the original study investigators (Susan M.B. Morton, Polly E. Atatoa Carr, Cameron C Grant, Arier C. Lee, Dinusha K. Bandara, Jatender Mohal, Jennifer M.Kinloch, Johanna M. Schmidt, Mary R. Hedges, Vivienne C. Ivory, Te Kani R. Kingi, Renee Liang, Lana M. Perese, Elizabeth Peterson, Jan E.Pryor, Elaine Reese, Elizabeth M. Robinson, Karen E. Waldie and Clare R. Wall).
Funding
The author(s) disclosed receipt of the following financial support for the research, authorship, and/or publication of this article: The study was designed and conducted by the Growing Up in New Zealand study team led by the University of Auckland. Professor Karen Waldie was funded by the Royal Society of New Zealand Marsden (Grant number 3718586) and The University of Auckland. Growing Up in New Zealand has been funded by the New Zealand Ministries of Social Development, Health, Education, Justice and Pacific Island Affairs; the former Ministry of Science Innovation and the former Department of Labour (now both part of the Ministry of Business, Innovation and Employment); the former Ministry of Women's Affairs (now the Ministry for Women); the Department of Corrections; the Families Commission (now known as the Social Policy Evaluation and Research Unit); Te Puni Kokiri; New Zealand Police; Sport New Zealand; the Housing New Zealand Corporation; and the former Mental Health Commission, The University of Auckland and Auckland UniServices Limited. Other support for the study has been provided by the NZ Health Research Council, Statistics New Zealand, the Office of the Children's Commissioner and the Office of Ethnic Affairs.
Declaration of Conflicting Interests
The author(s) declared no potential conflicts of interest with respect to the research, authorship, and/or publication of this article.
Appendix A
Multicollinearity Table Showing Correlations Between All Variables (and Covariates) and Outcome Variable.
| 1 | 2 | 3 | 4 | 5 | 6 | 7 | 8 | 9 | 10 | 11 | 12 | 13 | 14 | 15 | 16 | 17 | 18 | 19 | 20 | 21 | 22 | 23 | 24 | ||
|---|---|---|---|---|---|---|---|---|---|---|---|---|---|---|---|---|---|---|---|---|---|---|---|---|---|
| 1 | PROMIS Anxiety Score at age 12 | ||||||||||||||||||||||||
| 2 | Gender | −.163** | |||||||||||||||||||||||
| 3 | Ethnicity | −.012 | −.008 | ||||||||||||||||||||||
| 4 | Secondary School Qualification | .035* | −.015 | −.137** | |||||||||||||||||||||
| 5 | Maternal Age | .030* | .013 | .212** | .228** | ||||||||||||||||||||
| 6 | Rurality | −.024 | −.006 | .211** | −.083** | −.009 | |||||||||||||||||||
| 7 | Maternal BMI | .047** | −.002 | −.115** | −.180** | −.021 | −.013 | ||||||||||||||||||
| 8 | Parity | .029 | −.003 | −.040** | −.071** | .265** | .027 | .123** | |||||||||||||||||
| 9 | Smoking Pre-pregnancy | .029* | −.011 | .101** | .275** | .247** | .021 | −.108** | .010 | ||||||||||||||||
| 10 | Folate | .002 | −.002 | .323** | .056** | .152** | .081** | −.165** | −.131** | .184** | |||||||||||||||
| 11 | Iron | −.004 | .023 | .131** | .084** | .077** | .014 | −.130** | −.052** | .112** | .274** | ||||||||||||||
| 12 | Vitamins | −.016 | .009 | .226** | .079** | .160** | .027 | −.134** | −.114** | .155** | .354** | .357** | |||||||||||||
| 13 | Alcohol consumption | −.007 | .023 | .096** | −.121** | .012 | .019 | −.030 | −.003 | −.149** | −.011 | −.008 | .006 | ||||||||||||
| 14 | Deprivation | .013 | −.007 | −.327** | −.060** | −.231** | −.126** | .169** | .015 | −.127** | −.244** | −.123** | −.180** | −.006 | |||||||||||
| 15 | Maternal depression | .049** | .007 | −.164** | −.125** | −.215** | −.046** | .129** | .054** | −.195** | −.118** | −.064** | −.097** | .036** | .143** | ||||||||||
| 16 | Sleep duration | −.089** | .047** | .109** | −.055** | −.020 | .055** | −.036* | −.025 | .049** | .075** | .026 | .047** | .006 | −.025 | −.079** | |||||||||
| 17 | Sleeping pattern | .077** | .011 | −.007 | −.019 | .004 | .004 | .019 | −.043** | −.013 | .028 | .026 | .050** | .008 | .010 | .070** | −.112** | ||||||||
| 18 | Peer problems | .080** | .049** | −.168** | −.067** | −.172** | −.014 | .123** | −.099** | −.102** | −.123** | −.065** | −.080** | −.023 | .146** | .174** | −.092** | .133** | |||||||
| 19 | Peer–child relationship | −.123** | −.071** | −.008 | .046** | .008 | .019 | −.016 | −.016 | −.011 | −.008 | −.018 | −.016 | −.014 | −.002 | −.022 | .021 | −.028 | −.073** | ||||||
| 20 | Peer–child trust | .235** | .013 | .003 | −.020 | .014 | −.001 | .010 | .024 | .020 | −.003 | .007 | .004 | .031 | .019 | .032* | −.023 | .023 | .071** | −.686** | |||||
| 21 | Peer–child communication | .102** | .205** | .024 | −.044** | .035* | −.024 | −.007 | .025 | .013 | .025 | .030 | .008 | .017 | −.010 | .024 | .−.007 | .052** | .081** | −.650** | .590** | ||||
| 22 | Parent–child trust | .315** | −.119** | −.068** | −.005 | −.022 | .036* | .022 | .30* | −.004 | −.014 | −.007 | −.008 | .018 | .056** | .058** | −.088** | .040* | .092** | −.246** | .354** | .233** | |||
| 23 | Parent–child communication | .247** | −.087** | −.099** | −.011 | −.030* | −.038* | .040* | .058** | −.053** | −.073** | −.028 | −.024 | .011 | .077** | .0544** | −.090** | .023 | .086** | −.233** | .294** | .309** | .683** | ||
| 24 | Parent–child relationship | −.146** | .072** | .049** | −.028 | .014 | .015 | −.013 | −.021 | −.001 | .015 | .015 | .005 | −.005 | −.043* | −.013 | .042** | −.004 | −.058** | .120** | −.174** | −.099** | −.534** | −.369** | |
| 25 | Maternal depression (age 8) | .080** | −.007 | −.073** | −.141** | −.149** | −.035* | .140** | .005 | −.139** | −.068** | −.013 | −.053** | .015 | .098** | .300** | −.065** | .194** | .198** | −.036* | .044** | .041* | .078** | .082** | −.031 |
Note: **p < 0.01, *p < 0.05.
Appendix B
Associations Between Missing Data and no Missing Data for Anxiety Score at Age 12.

| No missing data N (%) or M | Missing data n (%) or M | p | |
|---|---|---|---|
| Gender | 4563 (100%) | 0 (0%) | - |
| Maternal ethnicity | 4356 (93.6%) | 207 (6.4%) | 0.121 |
| Maternal education | 4501 (96.7%) | 62 (3.3%) | 0.162 |
| Rurality | 4363 (93.8%) | 200 (6.2%) | 0.203 |
| Parity | 4496 (96.6%) | 67 (3.4%) | 0.103 |
| Smoking | 4501 (96.7%) | 62 (3.3%) | 0.162 |
| Folate | 3764 (80.1%) | 799 (19.9%) | 0.624 |
| Iron | 3765 (80.9%) | 798 (19.1%) | 0.600 |
| Vitamins | 3765 (80.9%) | 798 (19.1%) | 0.600 |
| Alcohol | 3683 (79.1%) | 880 (20.9%) | 0.174 |
| Deprivation | 3690 (79.3%) | 873 (20.7%) | 0.171 |
| Sleep problems | 3813 (81.9%) | 750 (18.1%) | 0.419 |
| Child–peer relationships | 3835 (82.4%) | 728 (17.6%) | 0.001** |
| Parent–child relationship | 4297 (92.3%) | 266 (7.7%) | 0.000** |
| Maternal age | 30.92 | 28.36 | 0.000** |
| BMI | 25.19 | 25.83 | 0.000** |
| Stress | 12.52 | 14.58 | 0.000** |
| Sleep duration | 9.20 | 9.05 | 0.060 |
| Peer–child trust | 6.79 | 8.04 | 0.115 |
| Peer–child communication | 10.13 | 10.95 | 0.322 |
| Parent–child trust | 6.93 | 7.52 | 0.317 |
| Parent depression | 3.67 | 4.66 | 0.000** |
Note: N = number of participants, M = mean. **p < 0.01, *p < 0.05.