
Abstract
Causation is a fundamental way to make sense of both social and non-social domains. High levels of autistic traits have been linked to enhanced rationality, suggesting a more normative way of reasoning. We aimed to systematically compare causal reasoning tendencies across social and non-social domains and evaluate their relation to self-reported autistic traits and thinking styles. We used a causal reasoning task with three binary (present/absent) variables forming common cause networks (X←Z→Y) representing social and non-social domains. Causal mechanisms in the social domain represented social relationships, while causal mechanisms in the non-social domain represented economics and meteorology. We recruited 76 participants from the general population and measured their levels of autistic traits and thinking styles on self-reports. We found that participants consistently violated the normative rules of causal reasoning. We also identified systematic differences across domains. However, we did not identify meaningful differences between clusters of reasoners in their levels of self-reported autistic traits and thinking styles. We conclude with that people violate the normative rules of causal reasoning differently across domains. However, we cannot conclude that this relates to levels of autistic traits or thinking styles.
Lay Abstract
We regularly think about cause-and-effect relationships in the world around us. Previously, researchers reported that people with higher levels of autistic traits reason more consistently and rule-based. However, they have not compared social, involving living things, and non-social, involving non-living things, worlds in relation to people's levels of autistic traits. We used a causal reasoning task to test this. In this task, there were causal scenarios with binary variables, meaning a variable can be either present or absent. The scenarios either reflected a non-social mechanism, for example, economics, or a social mechanism, for example, an interpersonal relationship. Our participants, who did not necessarily have a clinical diagnosis, completed this task and two self-report questionnaires. We found that people did not follow the rules of causal reasoning. We also found that people's responses differed between social and non-social scenarios. We found that this was unrelated to people's self-reported autistic traits and thinking styles. We are confident that people differ in their use of reasoning rules in their causal reasoning, and this happens differently between social and non-social scenarios.
Highlights
People consistently violate the normative rules of causal reasoning. This happens differently across social and non-social domains. Neither the levels of self-reported autistic traits nor thinking styles differ between the clusters of decisive and indecisive reasoners, yet further exploration is suggested.
Causation is a fundamental way to make sense of both the social and non-social realms. Causal reasoning refers to the process of understanding and explaining the cause-and-effect relationship between variables or events. There is a growing literature on reasoning in relation to autism and autistic traits, translating tools and techniques of causal reasoning into this field, by recruiting either clinical or non-clinical samples. Even though autism is diagnosed as a clinical condition (American Psychiatric Association, 2013), autistic traits, measured by self-report questionnaires, are manifested in the general population (Ruzich et al., 2015). Higher levels of autistic traits have been linked to enhanced rationality, suggesting preferences for and proficiency in greater deliberation and reduced intuition (Morsanyi & Byrne, 2020; Rozenkrantz et al., 2021). However, there has not been a systematic comparison of causal reasoning across social and non-social domains in relation to autistic traits.
Causal reasoning
As a simple example of causation, smoking (X) causing lung cancer (Y) indicates a direct causal relationship between the variables of X and Y. However, introducing a third variable might complicate this relationship. In such cases, X and Y are causally indirectly related through another variable, Z. An example of this arises when both X and Y are the effects of Z, which is called a common cause network. For instance, smoking (Z) causing lung cancer (X) and yellow fingers (Y). This can be shown as X←Z→Y. See Figure 1 for an illustration of a common cause network.

A common cause network formed with three variables: X, Y, and Z.
Causal graphical models (CGMs) formalise the normative rules of causal reasoning, using nodes for variables and arrows for relations between those variables (Pearl, 2009). The causal Markov condition, as determined by CGMs, defines conditional independence between variables in a causal system (Woodward, 2021). Given a set of variables, each variable is independent of its non-effects, given its direct causes. According to the causal Markov condition, in a common cause network of X←Z→Y, the variables of X and Y have no impact on each other as they are screened off by their direct cause, which is Z. For instance, take an example of three variables – Z (smoking), X (lung cancer), and Y (yellow fingers). When we know that a person is smoking (Z), the likelihood of this person having lung cancer (X) becomes irrelevant to whether the person has yellow fingers or not (Y). 1 This is because knowing whether the person has yellow fingers (Y) won’t provide additional information about their lung cancer state (X), because the direct cause (Z) already accounts for that information. Figure 2 presents this principle with eight causal cases.

Equivalence classes for common cause network cases.
Based on the CGMs, Figure 2 shows that cases within the same group (or equivalence class) provide equal support for determining the state of Y. In Class I (A, B, and C), because Z is known to be present (Z = 1), knowing the state of X provides no additional information for determining the state of Y, because Z screens off Y from X. The same happens in Class IV (F, G, and H), where Z is known to be absent (Z = 0). Similarly, Z screens off Y from X, resulting in equal support for determining the state of Y in these classes. These classes demonstrate the causal Markov condition.
As we move from Class I to IV, the support for Y weakens. Class I (A, B, and C) provides the strongest support for Y, in which Z is known to be present (Z = 1). In Class II (D), in which Z is unknown (Z = x), but X is present (X = 1), making the support for Y slightly weaker than in the earlier classes. However, the strength of causal relations also plays a role here. If the link between X and Z is deterministically necessary (the cause and its effect always linked), then the presence of Z in Class II is certain, making the probability of Y the same as in Class I. Therefore, Class I and II can be grouped as a single class. The distinction between these classes is shown with a dashed line.
Class III (E) provides even weaker support for determining the state of Y compared to Class II (D), as the absence of X (X = 0) suggests the absence of Z, and consequently Y is also likely absent. Finally, Class IV (F, G, and H) provides the weakest support for Y, because Z is known to be absent (Z = 0). However, if the causal link between X and Z is deterministically sufficient (the cause and its effect always occur together), the absence of Z in Class II can be inferred with certainty, making the absence of Y as certain as in Class IV. Therefore, Class III and IV can be grouped as a single class. The distinction between these classes is shown with a double dashed line.
Some studies of causal reasoning have used causal networks, employing both qualitative (e.g., Griffiths et al., 2011; Park & Sloman, 2013; Rehder, 2014; Rehder & Burnett, 2005) and quantitative approaches (e.g., Rehder, 2018; Rottman & Hastie, 2016). These studies have consistently demonstrated that people often deviate from the normative – purely rational – rules of causal reasoning (Buchanan & Sobel, 2014; Rehder & Burnett, 2005; for a review, Rottman & Hastie, 2014). For instance, people tend to reason as if having yellow fingers (Y) remains relevant to the diagnosis of lung cancer (X) above and beyond knowing whether the person is a smoker or non-smoker (Z).
Dual process theories
Several theories have been suggested to explain why people might deviate from the normative rules of causal reasoning, and whether reasoners who deviate from normative rules share some common and distinct characteristics. Many of these theories have focussed on multiple possible routes to a given answer – employed by different people consistently or by same people under different circumstances. To understand this better, two types of thinking processes have been suggested: ‘fast’ intuition and ‘slow’ deliberation (De Neys, 2018, 2022; Evans, 2008; Evans & Stanovich, 2013; cf. Grayot, 2020; Osman, 2004). Although this approach has recently been challenged (De Neys, 2021), broadly, intuition is a fast, low-effort, and relatively automatic process, while deliberation is slower, more effortful, yet more careful (De Neys, 2018; Evans, 2008). Within the domain of causal reasoning, Rehder (2014, Experiment 1) identified clusters of reasoners, as ‘associative’ and ‘causal’ reasoners, who reasoned similarly within their cluster but distinctly from the other cluster. Causal reasoners are defined as more deliberative, effectively considering the complex information of the normative rules of reasoning. Conversely, associative reasoners are defined to be more intuitive, being influenced by information that appears relevant but in fact is not.
Reasoning in the social versus non-social domains
A key distinction between the social and non-social domains is that while the former encompasses animate objects, the latter does not. Glick (1978; reported in Shultz, 1982) proposed that logical strategies are essential for non-social knowledge, while intuitive strategies are more suited for social knowledge, based on several key reasons: First, the behaviour of objects is more consistent compared to that of people, as people not only react but also act – take independent actions. Second, object behaviour, and therefore physical inference, is strictly deterministic, whereas human behaviour is probabilistic. Lastly, social knowledge, due to the unpredictable nature of human behaviour, is inherently uncertain and context-dependent, unlike the sometimes-certain knowledge of objects. Additionally, Shultz (1982) suggested that moral responsibility is attributed to people rather than objects, leading to the expectation that people engage in more intuitive reasoning within the social domain compared to the non-social domain.
Additionally, Gelman and Spelke (1981) suggested that when perceiving non-social objects, we focus on their physical properties, which are often determinate and accurate. On the other hand, when perceiving social objects, we focus on their behaviours and mental states, which are often indeterminate, making this domain more unpredictable. For instance, Strickland, Silver and Keil (2017) found that participants generated a higher number of causes for psychological events compared to physical ones, suggesting a more detailed and sophisticated reasoning approach in relation to psychological events. These findings suggest a distinction between these two domains in perception, potentially resulting in different reasoning strategies. It is important to always implement a structurally equivalent non-social component when studying a social phenomenon (Lockwood et al., 2020) to understand the social phenomenon better. Therefore, this study deals with reasoning tendencies across social and non-social domains.
Developmental perspective in causal reasoning
Although the study presented here is not a developmental one, exploring this different perspective highlights some of the conceptual questions around causal reasoning. Developmentalists generally agree that causal reasoning – the capacity to recognise and comprehend the relationship between cause and effect – emerges in childhood and gradually becomes more sophisticated as cognitive capacities, such as cognitive growth, language acquisition, and social interactions, evolve. One view, represented by Gopnik and Glymour (2001) holds that even 2-year-olds have understanding of causal relationships, allowing them to make predictions, draw inferences, and engage in screening off reasoning about novel situations based on observed patterns. On this account, this initial causal reasoning is primarily influenced by domain-specific learning mechanisms, allowing children to develop causal models based on their experiences. However, other accounts emphasise the contribution of domain general cognitive processes in supporting children's reasoning (McCormack et al., 2013). Between three to four years, children begin to demonstrate more sophisticated causal reasoning, including the ability to infer unobserved causes and differentiate between direct and indirect causal relationships by showing the relation between screening off reasoning and CGM framework (Gopnik et al., 2004). Sobel and Munro (2009) expanded on this developmental trajectory, showing that as children mature, they become more sophisticated at using causal information, especially in novel situations, and show sensitivity to domain type – particularly as being social or non-social.
Reasoning in relation to autistic traits
Autistic traits, as assessed by self-report questionnaires, are believed to be measurable in the general population at varying levels (Ruzich et al., 2015) and linked to several outcomes, such as negative mental health scores (Waizbard-Bartov et al., 2023). Research suggests a link between higher levels of autistic traits and enhanced deliberation, alongside diminished intuition, resulting in a more normative and logically consistent reasoning style (Brosnan et al., 2016, 2017; Brosnan & Ashwin, 2022; Levin et al., 2015; Morsanyi & Byrne, 2020; for a review, Rozenkrantz et al., 2021). The literature also demonstrates associations between higher autistic traits and an ability to avoid common reasoning biases, such as jumping to conclusions (Brosnan et al., 2014), the framing effect (De Martino et al., 2008), optimistic bias (Kuzmanovic et al., 2019), and the conjunction fallacy (Morsanyi et al., 2010). Yet, there are now null and contradictory results from more recent studies to challenge these conclusions (e.g., Bastan et al., 2024; Morsanyi & Hamilton, 2023; Taylor et al., 2022). For instance, in line with Taylor et al. (2022), Morsanyi and Hamilton (2023) reported no significant relationship between the levels of autistic traits and analytical thinking, suggesting caution when emphasising enhanced rationality in autism. We do not yet know whether the associations between reasoning styles and autistic traits are consistent across domains and whether it extends to causal reasoning.
The social realm, broadly, is thought to require more engagement in intuition, and non-autistic people often engage in this type of processing (Robic et al., 2015). On the other hand, the non-social realm might require more engagement in deliberation. It might be the case that autistic people face difficulties in certain types of information processing, specifically for situations that involve social communication and interaction, or that autistic people prefer engaging in intuition less (and/or deliberation more). In both cases, understanding autistic people's reasoning style can help us to understand more about day-to-day difficulties autistic people experience. Exploring this with a sample from the general population can be a reasonable first step before translating this approach to a sample with autistic people.
This study
We adapted a task which was employed in previous research (e.g., Kolvoort et al., 2021; Rehder, 2014; Rottman & Hastie, 2016) involving common cause network mechanisms in economics and meteorology. We created a structurally equivalent task in the social domain using social relationship mechanisms. This study explored:
whether people violated the normative causal reasoning rules, if so, whether the degree of violation was affected by the domain type (social versus non-social), if so, whether the degree of violation was associated with individual differences, such as thinking style (rationality and/versus experientiality) and autistic traits. following Rehder (2014), our participants would be clustered into two groups: causal reasoners and associative reasoners, with the latter demonstrating a greater number of violations, causal reasoners would self-report higher levels of rationality and autistic traits, compared to associative reasoners.
Based on the degree and style of violations, we predicted that:
Method
See https://osf.io/hxrwk/?view_only=b6c12edf91f34e2096b360b658b85798 for pre-registration, data, syntax, and material. This project was conducted following the ethical guidelines of the British Psychological Society and was approved by the Science, Technology, Engineering, and Mathematics Ethical Review Committee at the University of Birmingham (ERN_09-719AP31).
Participants
Sample size and effect size calculations
The sample size was determined based on a previous data analysis plan. However, after data collection, the data analysis plan underwent a change due to relatively small number of participants giving enough normatively correct responses to pass the chance level. Nevertheless, the existing sample was still deemed adequate for two reasons. First, Rehder (2014, Experiment 1) employed the same data analysis procedure and achieved statistically meaningful results using 2 × 5 analysis of variance (ANOVA) with 63 participants. Second, a post-hoc power analysis using G*Power (Faul et al., 2007) indicated that 76 participants would provide 99% power to detect a medium effect size (0.06) and 78% power to detect a small effect size (0.1) at α = 0.05 for a 2 × 5 ANOVA. Regarding cluster analysis, Dalmaijer et al. (2022) suggested that for equal or similar-sized clusters, a total sample size of 40–60 with at least 20–30 observations in each cluster would be sufficient. Again, in Rehder's study (2014, Experiment 1), cluster analysis was conducted with 63 participants. Assuming a similar distribution of participants across clusters, we expected cluster analysis to be an appropriate approach to analyse our data. Comparing the clusters via a t-test suggests a sufficiently large sample to give 93% chance of identifying a large effect size (d = 0.8) and a 56% chance of identifying a medium effect size d > 0.5 (via a G*Power calculation using the final sample sizes at α = 0.05). These effect sizes are consistent with those found in other studies of autistic traits and reasoning (e.g., Brosnan et al., 2016); and smaller effect sizes may be less likely to translate to meaningful differences in the real world.
Sample
We recruited 76 participants, consisting of 59 females (77.6% of the sample), 13 males (17.1%), and 3 identified as non-binary (3.9%). One participant chose not to disclose their gender identity. All participants were 18 years of age or older (Mage = 19.87, SDage = 2.63, [18–32]). All participants were university students, based in the United Kingdom, and fluent in English. Participants identified with a range of ethnicities, with a plurality identifying as White (N = 35, 46.1%; see Appendix 1 for ethnicity information). Participants were recruited through a web-based research participant recruitment scheme at the University of Birmingham. No specific inclusion or exclusion criteria were applied regarding clinical diagnosis.
Materials
The Adult Autism-Spectrum Quotient (AQ; Baron-Cohen et al., 2001)
The AQ is a 50-item self-report questionnaire, measuring the levels of autistic traits in adults (≥16 years of age) with average or higher levels of intelligence. This questionnaire is scored on a four-point scale with response options of ‘definitely agree’, ‘slightly agree’, ‘slightly disagree’, and ‘definitely disagree’. Statements in the direction of autistic traits are scored as 1, while statements in the opposite direction are scored as 0. There is no value distinction between responses of ‘definitely agree’ and ‘slightly agree’ or between ’slightly disagree’ and ‘definitely disagree’ in scoring. Total scores range from 0 to 50, with higher scores indicating higher levels of autistic traits. The AQ is widely used in both clinical and non-clinical samples, showing strong internal consistency (α ≥ 0.7) and test–retest reliability (r ≥ 0.8; Stevenson & Hart, 2017).
The Rational–Experiential Inventory (REI; Epstein et al., 1996)
The REI is a 40-item self-report questionnaire, measuring perception of ability and engagement in thinking style. The REI includes four components, each comprising 10 items: rational ability, rational engagement, experiential ability, and experiential engagement. For this study, participants received two scores: ‘rationality’ (rational ability + rational engagement) and ‘experientiality’ (experiential ability + experiential engagement). The rationality sub-scale measures the level of deliberation, while the experientiality sub-scale measures the level of intuition. The REI is scored on a five-point scale, with options ranging from ‘1 – definitely not true of myself’ to ‘5 – definitely true of myself’. Each sub-scale ranges from a minimum score of 20 to a maximum of 100. The REI shows strong internal consistency (rationality, α = 0.90; experientiality, α = 0.87) and test–retest reliability, with correlations ranging between 0.86 and 0.91 for rationality and between 0.87 and 0.90 for experientiality (Pacini & Epstein, 1999). In this study, this measure is used to examine whether people's objective reasoning performance aligns with their subjective perception of thinking style. We anticipated that people who self-score higher on the rationality sub-scale to reason more normatively, while those who self-score higher on the experientiality sub-scale to reason less normatively.
The Binary Inference Test (BIT; adapted from Rehder, 2014)
The BIT consisted of three binary variables (X, Y, and Z), forming common cause networks (X←Z→Y) within the domains of social and non-social reasoning. For the non-social domain, the causal scenarios of economics and meteorology were directly taken from Rehder's (2014) study (see Table 1). The social domain was created with two social relationship scenarios (see Table 2) in the same structure (see Appendix 2 for variables and Appendix 3 for causal scenario mechanisms).
Example causal relationship as Economics, in the non-social domain.

Note. Taken from Rehder (2014) with permission.
Example causal relationship as Social Relationship–1, in the social domain.

The BIT covers 20 pairs of situations for each scenario, with five choice problems repeating for each variable (x2), and their order reversed (x2). Adhering to the causal Markov condition, choice problems in this test are A versus B, B versus C, D versus E, F versus G, and G versus H. Participants are asked to indicate the likelihood of a particular variable being present in a pair of situations. The response options are 1 for the first situation (e.g., option ‘A’ in ‘A vs. B’), 2 for the second situation (e.g., option ‘B’ in ‘A vs. B’), and 3 for the ‘equally likely’ response. Participants are supposed to choose ‘equally likely’ option if they think the likelihood of situations having the particular variable is equal.
Procedure
Participants received an information sheet and provided consent to participate prior to data collection. This study involved remote and in-person parts. The remote part took approximately 30 min and was completed in participants’ own time through Qualtrics online survey platform (https://www.qualtrics.com/uk/). During this part, participants completed a demographics form and two self-report questionnaires: the AQ, to self-report their levels of autistic traits, and REI, to self-report their reasoning styles.
The in-person part involved completing the BIT, a computerised reasoning task, which was designed on E-Prime 3.0. This part took approximately one hour to complete. Prior to the computer task, participants received brief verbal instructions from the researcher. The instructions were also displayed on the computer screen. The BIT had three parts: study phase, multiple-choice pre-test, and main task.
The study phase involved learning about causal mechanisms from vignettes with three binary variables which formed common cause networks: one mechanism for economics and one mechanism for meteorology as the non-social domain (see Table 1) and two mechanisms for social relationships as the social domain (see Table 2). Participants were presented with a diagram on the computer screen for each causal mechanism. Throughout the study, participants also had printed diagrams for each causal mechanism in front of them. Following the study phase, participants had to take a forced-choice pre-test in a multiple-choice format to assess their understanding of the presented causal mechanisms for each scenario. The multiple-choice test consisted of eight questions, each presented with five options. Participants used the keyboard keys (1, 2, 3, 4, or 5) for answering these questions. There was no time limit for the pre-test. Participants received feedback after each question indicating whether their response was correct or incorrect. To proceed to the main task, participants had to complete the pre-test without any errors. If an error was made, they had to review the causal mechanism from study screen again and retake the pre-test. Once the pre-test was completed without error, participants proceeded to the main task. During the main task, participants were presented with pairs of situations and asked to determine which situation was more likely to have a specific value. Participants were required to choose between two situations or select the ‘equally likely’ option to indicate that the likelihood of the situations to present the specified value was equal. The task followed a forced-choice design with no time limit. Each question appeared at the top of the screen, with two situations stacked vertically, followed by the ‘equally likely’ option. The question, situations, and options remained on the screen until the participant provided a response using the keyboard keys (1, 2, or 3). Following the Markov assumptions presented in the Figure 2, the pairs of situations were presented as five choice problems: A versus B, B versus C, D versus E, F versus G, and G versus H. Here, if we take the choice problem of A versus B as an example for the economics scenario, we could re-call that (1) in a common cause network of (X←Z→Y), X and Y are the effects of Z, which is a cause. We can also re-call that (2) in the situation of A (X = 1, Z = 1, Y=?), the variables X (trade deficits) and Z (interest rates) both has a value of 1, which means that they are both present. Finally, we can also re-call that (3) in the situation of B (X = x, Z = 1, Y=?), we do not know the value of X (trade deficits), which means that it can be either present or absent, and the variable Z (interest rates) has a value of 1, which means, again, that it is present. In both situations, as all the situations on this figure, we do not know the value of the variable Y, thus, it is the variable which we are trying to answer the probability of absence/presence about. Therefore, for instance, in a choice problem of A versus B, asking ‘Which economy is more likely to have
The five choice problems were repeated twice, for the values X (e.g., retirement savings) and Y (e.g., trade deficits) which were also presented in reverse order (e.g., A vs. B was also presented as B vs. A). In total, participants completed 80 choice problems, with 20 problems for each scenario in randomised order. The domain order (social and non-social domains) and scenario order (economics and meteorology for non-social domain, and social relationship – 1 and social relationship – 2 for social domain) were counterbalanced across participants. Participants received course credits as compensation and a debrief form upon completion of the study.
Data analysis
We used SPSS 29.0 for all statistical analyses and set α at 0.05. Following Rehder's (2014) approach, participants’ categorical responses for the main task (BIT) were summarised into a single choice score. For this, choices in favour of the first alternative (e.g., A choice for A vs. B problem) were coded as 1, choices in favour of the second alternative (e.g., B choice for A vs. B problem) were coded as 0, and the ‘equally likely’ choices were coded as 0.5. These choice scores were modelled as an overall measure of reasoning style, rather than modelling individual responses. The final choice score was therefore calculated from eight responses, so varied from 0 (for instance, a participant who consistently chose B as more likely for A vs. B comparisons) to 8 (for instance for participants who always chose A as more likely for A vs. B comparisons). This score was used for all analyses.
Before the main analysis, to check whether participants’ responses were affected by the scenario type within each domain, we ran two 2 × 5 ANOVAs for the social and non-social domains separately, using participants’ choice scores as the dependent variable (DV). For the non-social domain, we ran a 2 × 5 ANOVA with within-subjects factors of scenario type (Economics, Meteorology) and problem type (A vs. B, B vs. C, D vs. E, F vs. G, G vs. H). For the social domain, we ran a 2 × 5 ANOVA with within-subjects factors of scenario type (Social relationship – 1, Social relationship – 2) and problem type (A vs. B, B vs. C, D vs. E, F vs. G, G vs. H).
Then, we first ran a mixed 2 × 2 × 5 ANOVA with within-subjects factors of domain type (Social, Non-social), problem type (A vs. B, B vs. C, D vs. E, F vs. G, G vs. H), and between-subjects factor of domain order (Social Domain First, Non-social Domain First) to check whether participants’ responses were affected by the domain order. For the main analysis, we ran a 2 × 5 ANOVA with within-subjects factors of domain type (Social, Non-social) and problem type (A vs. B, B vs. C, D vs. E, F vs. G, G vs. H), using participants’ choice scores as the DV.
Next, following Rehder's (2014) approach, we ran a two-step cluster analysis on participants’ choice scores to identify sub-groups reflecting individual differences, after transforming the data for normal distribution, using Log10 transformation. This analysis aimed to evaluate whether participants’ responses were demonstrated by all participants or resulted by averaging over participants with different patterns. We ran two-tailed independent sample t-tests to compare the levels of autistic traits (measured by the AQ) and rationality and experientiality (measured by the REI) between clusters. Outliers on the AQ were removed for this comparison. Finally, we ran cluster comparisons across social and non-social domains using two-tailed independent samples t-test.
Results
See Figure 3 for normative predictions and participants’ choice scores. See Table 3 for participants’ responses.

The comparison of normative predictions and participants’ choice scores.
Results of participants’ choices.

Note. Normative choices are in bold.
Causal reasoning performance
The pattern of participants’ responses was consistent with having followed normative rules of causal reasoning in some situations, especially when the state of Z was known to be absent. The choice scores for the problems of F vs. G and G vs. H were 0.55 and 0.53, respectively. Additionally, for the dependent choice problem (D vs. E), participants avoided the ‘equally likely’ response in D versus E more often, scoring 0.74. Their score was significantly different from 0.50, as compared with chance; t(75) = 11.65, p < 0.001, d = 1.34, two-tailed, indicating that participants were willing to make indirect inferences. When the state of Z was unknown, they tended to indirectly infer X from Y or Y from X.
Participants regularly violated the independence rule for the independent choice problems. For the independent choice problems (A vs. B, B vs. C, F vs. G, and G vs. H) the average score was 0.57, which was significantly different from 0.50, as compared with chance; t(75) = 6.75, p < .001, d = 0.77, two-tailed. This indicates that participants responded as if the presence of one variable made the other variable more likely to be present, even though they were supposed to be screened off from each other, because the state of Z was known. Participants scored significantly lower on these problems compared to D versus E; t(75) = 8.21, p < .001, d = 0.94, two-tailed, indicating that participants showed some sensitivity to the difference between independence and dependence. However, participants still responded ‘equally likely’ to the dependent choice problem (D vs. E) almost as frequently as they responded ‘equally likely’ to independent choice problem of B vs. C. This was unexpected and resulted in many students failing to pass chance level which was included in a previous data analysis approach (see Appendix 4 for details).
Participants’ choice scores were not affected by the scenario type within each domain and by the domain order of social and non-social domains (see Appendix 5 for details). Therefore, we proceeded with the main analysis. The results from 2 × 5 ANOVA revealed a significant effect of domain type; F(1, 75) = 8.32, p = .005, ηp2 = 0.10), with participants scoring higher for the non-social domain (M = 2.49, SEM = 0.05) compared to the social domain (M = 2.36, SEM = 0.05). We also found a significant effect of problem type; F(1, 75) = 40.43, p < .001, ηp2 = 0.35; see Appendix 6 for details. However, we did not find a significant interaction between domain type and problem type; F(1, 75) = 1.87, p = .115, ηp2 = 0.02; (Figure 4).
Participants’ choice scores across domains for each problem type.
Individual differences
Following Rehder's (2014) approach, participants were clustered into sub-groups based on their reasoning performance on the causal reasoning task, BIT. The two-step cluster analysis 2 revealed two sub-groups. The first cluster consisted of 36 participants (47.4% of the sample, see left side of Figure 5). These participants tended to choose the alternative option when more causally related variables were presented. The second cluster consisted of 40 participants (52.6% of the sample, see right side of Figure 5). These participants showed less violation of the normative rules for independent choice problems, as they chose the correct ‘equally likely’ option in 68.98% of independent choice problems, in comparison to 57.60% for the other cluster. However, this cluster showed more violation for the dependent choice problem (choice score for D vs. E for this cluster was 0.63), compared to the other cluster (0.85). For labelling our clusters, we did not follow Rehder's (2014) approach, who used ‘causal reasoners’ and ‘associative reasoners’ as labels for their clusters. Our clusters were more clearly defined by a tendency to respond frequently with the option ‘equally likely’ and a tendency to make a decisive choice (normatively for dependent choice problems and non-normatively for independent choice problems). We therefore labelled our clusters as ‘decisive reasoners’ and ‘indecisive reasoners’ instead.

Participants’ choice scores as clusters of decisive and indecisive reasoners.
All participants completed the Adult Autism Spectrum Quotient (AQ; Baron-Cohen et al., 2001) to self-report their levels of autistic traits (M = 19.96, SD = 6.95, [4–42]). All participants also completed the Rational-Experiential Inventory (REI; Epstein et al., 1996) to self-report their engagement and ability in rationality (M = 69.80, SD = 10.19, [47–92]) and experientiality (M = 66.62, SD = 10.96, [22–86]). Contrary to our hypothesis, the independent-samples t-test revealed no significant difference between decisive and indecisive reasoners on their levels of self-reported autistic traits; t(72) = 1.34, p = .185, d = 0.31, two-tailed. Two outliers on the levels of autistic traits measure, both scoring 43 out of 50, were removed before this test. Due to some reservations about excluding outliers on this measure, where scores may reflect expected distribution, we conducted an additional analysis that included them. Both participants were clustered into the decisive reasoners group, but there was no change to the significance of the results (see Appendix 7A).
Furthermore, we also did not identify significant differences between the clusters based on their levels of self-reported experientiality; t(74) = 0.91, p = .368, d = 0.21, two-tailed; and rationality; t(74) = 0.72, p = .476, d = 0.16, two-tailed. Exploratory analysis, controlling for multiple comparisons, did not show that the clusters differed on the sub-scales of the AQ either, though did show trends for a difference in the imagination sub-scale, t(72) = 2.11, p = .038, d = 0.49, two-tailed, with decisive reasoners scoring higher (see Appendix 7B for full analysis).
Both clusters responded significantly differently for the dependent choice problem compared to the independent choice problems, suggesting that they both showed sensitivity to the dependency of choice problems. The decisive reasoners responded significantly higher for the dependent choice problem (M = 3.41, SEM = 0.09) compared to independent choice problems; M = 2.57, SEM = 0.07; t(35) = 6.54, p < .001, d = 1.09, two-tailed. Similarly, the indecisive reasoners responded significantly higher for the dependent choice problem (M = 2.54, SEM = 0.09) compared to independent choice problems; M = 2.05, SEM = 0.02; t(39) = ‒5.33, p < .001, d = ‒0.84, two-tailed.
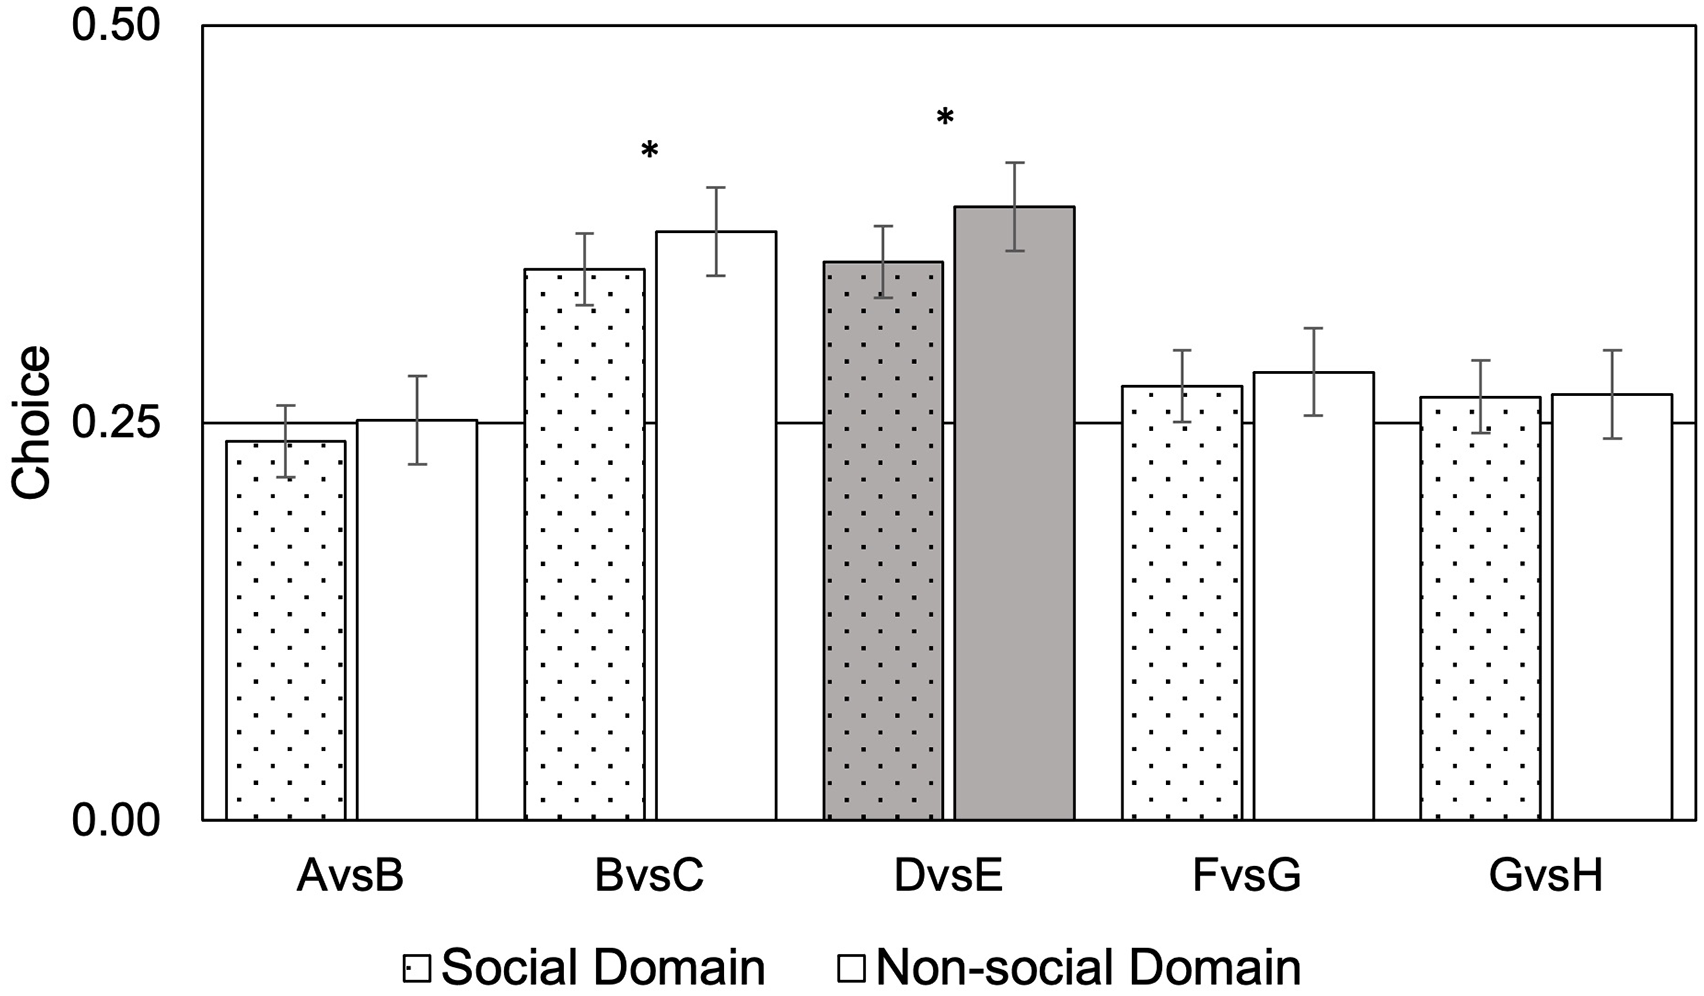
In terms of domain-specificity, the responses between the non-social domain (M = 2.79, SEM = 0.06) and social domain (M = 2.68, SEM = 0.07) did not significantly differ for the decisive reasoners; t(35) = 1.40, p = .169, d = 0.23, two-tailed. In contrast, the indecisive reasoners responded significantly higher for the non-social domain (M = 2.22, SEM = 0.03) compared to the social domain; M = 2.08, SEM = 0.03; t(39) = 3.10, p = .004, d = 0.49, two-tailed. See Figure 6 for the decisive and 7 for the indecisive reasoners.

Decisive reasoners’ choice scores across domains for each problem type.
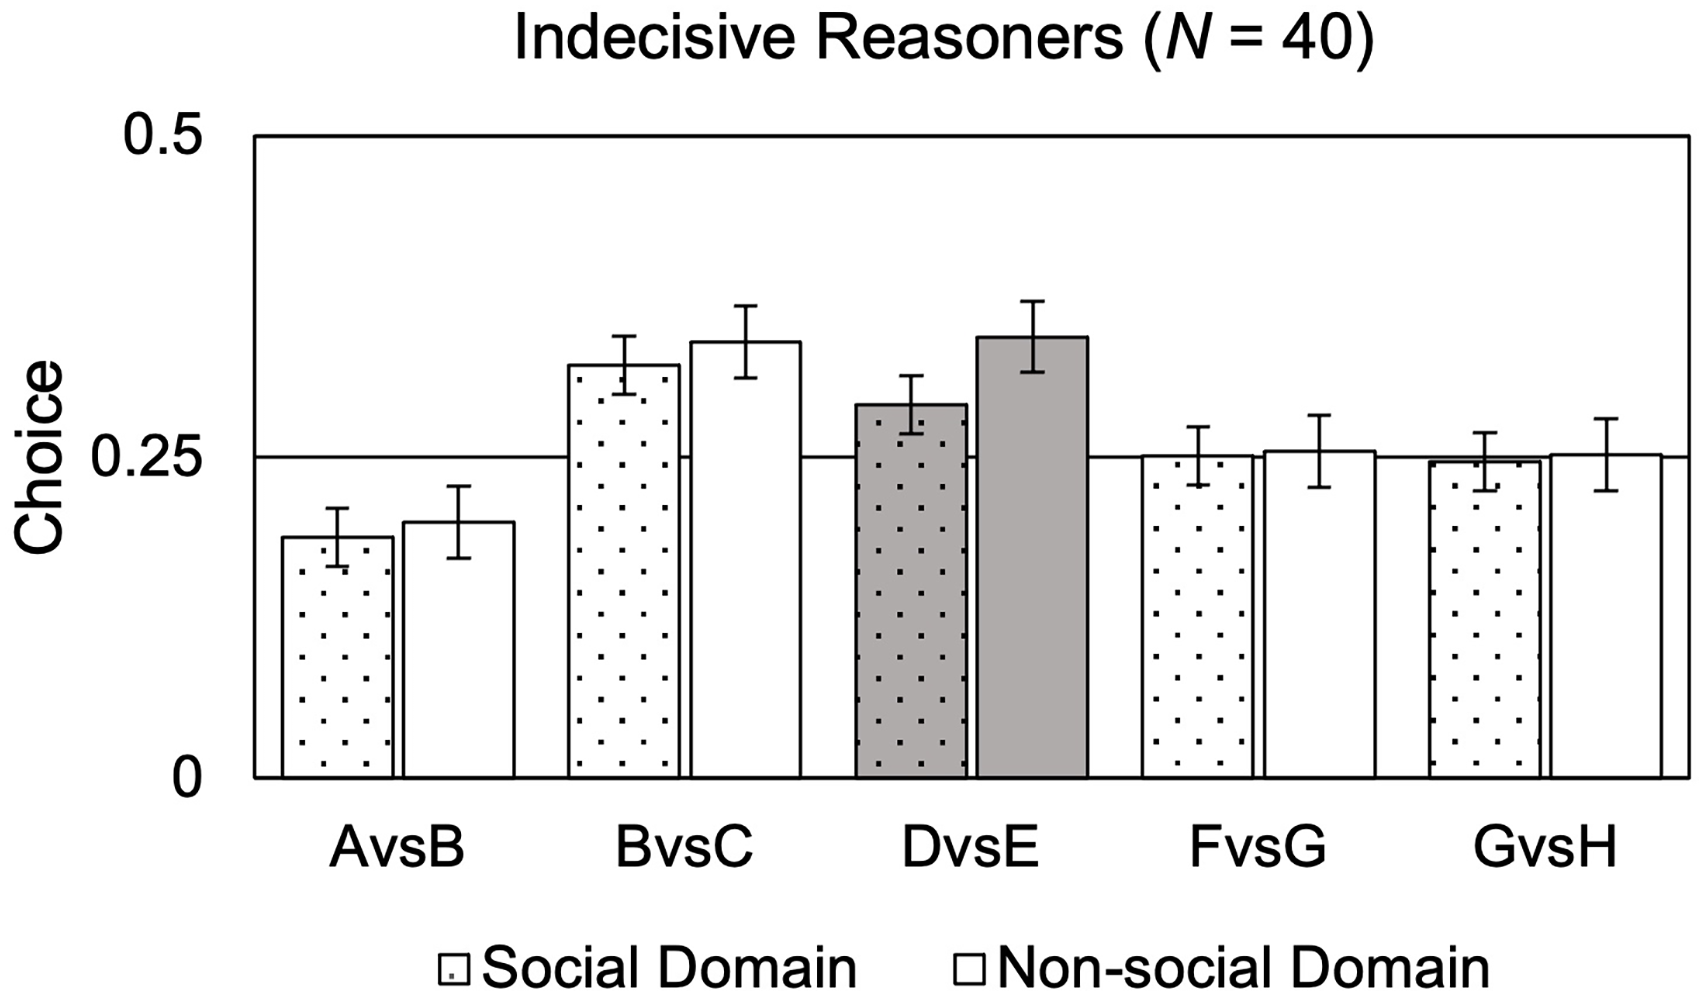
Indecisive reasoners’ choice scores across domains for each problem type.
Discussion
Consistent with the literature (Davis & Rehder, 2020; Kolvoort et al., 2022; Park & Sloman, 2013; Rehder, 2014, 2018; Rehder & Waldmann, 2017; for a review, Rottman & Hastie, 2014), participants regularly violated the normative rules of causal reasoning. We observed different reasoning strategies across domains. In the social domain, compared to the non-social domain, participants violated the causal Markov condition less, but they also failed to correctly use the causal information given to them. In terms of individual differences, we did not identify a clear distinction between clusters based on reasoning more causally or associatively. Therefore, we were not able to test our hypotheses stating statistical differences based on self-reported levels of autistic traits and thinking styles between causal and associative reasoners. However, we did report these differences between clusters of ‘decisive’ and ‘indecisive’ reasoners. After identifying two clusters of reasoners, we did not observe significant differences between these clusters in their self-reported levels of autistic traits and thinking styles.
Replication of previous findings
For the dependent choice problem (D vs. E), participants responded correctly 53% of the time, choosing D over E. However, they also responded incorrectly for this choice problem by choosing the ‘equally likely’ option. Participants chose the correct D answer 53% of the time, and this was lower than Rehder's (2014) participants’ score which was reported to be 67%. For the independent choice problems (A vs. B, B vs. C, F vs. G, and G vs. H), participants responded correctly 64% of the time, choosing ‘equally likely’. This is consistent with Rehder (2014) who showed that participants honoured the independence of the variables in two-thirds of the trials.
Participants provided the highest accuracy when the cause was absent (Z = 0, in F vs. G and G vs. H). However, when the cause was present (Z = 1, in A vs. B and B vs. C), they seemed to engage in higher levels of associative reasoning by not choosing the correct ‘equally likely’ response as often. These findings are also in line with Rehder (2014) who found a more normative reasoning strategy when the state of the cause was absent (Z = 0) compared to present (Z = 1). This could be explained by ambiguity aversion (Camerer & Weber, 1992), which states that participants tend to choose the ‘equally likely’ option when they feel ignorant under high uncertainty.
Some theories have been suggested to explain why people might violate the normative rules of causal reasoning. For instance, the leaky gate model proposes that information non-normatively flows across the causal network's nodes (Rehder, 2018). Rehder (2014) also suggested that people reason associatively by assuming a shared disabler (D; see Figure 8). Disablers refer to causes that might prevent the event from occurring (Strickland et al., 2017). This is in line with our results, showing a larger violation when Z was present versus absent.
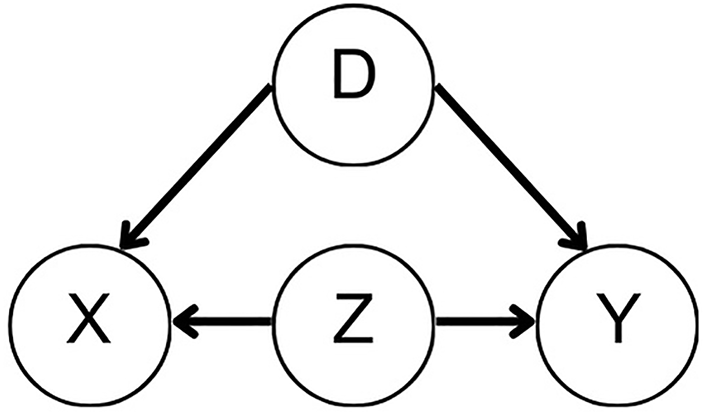
Shared disabler for a common cause network.
The violations might also occur due to participants not fully accepting what is provided by the experimenter. This might lead to adding additional events (variables, nodes) and causal relations to the provided causal networks (Park & Sloman, 2013; Rehder, 2014; Rehder & Burnett, 2005; Rottman & Hastie, 2016). Furthermore, time, motivation, and sampling have previously been suggested as natural reasons for violations (Rehder, 2014). For instance, the motivation of our sample might not be a willingness to engage in analytical reasoning, but rather to complete the study quickly to gain course credits. However, it is important to note that Rehder (2014) showed that violations sometimes arise even when participants are told to engage in deliberative and careful reasoning. It is also important to note that our reasoners did pass the pre-test which was used to check their understanding of the provided causal mechanisms, yet still responded in a fixated manner on the option of ‘equally likely’.
Besides mostly resulting in a highly similar pattern of choices to Rehder (2014), our participants violated the normative rules more often for A versus B and B versus C, by choosing the B option more for both. This was an unexpected result, particularly for A versus B, since although the correct answer for this choice problem was ‘equally likely’, A provides more information than B. This remains as an open question to follow up in future studies.
Domain-specific causal reasoning
In the non-social domain, compared to the social domain, participants responded more accurately for the dependent choice problem (D vs. E), by choosing the correct D option significantly more often. Conversely, for the independent choice problems (A vs. B, B vs. C, F vs. G, and G vs. H), participants responded more accurately in the social domain by choosing the ‘equally likely’ option more often compared to the non-social domain. This might be due to default responding and would be explained by participants selecting the ‘equally likely’ option more frequently for both these problem types. Gelman and Spelke (1981) proposed that when perceiving social objects, we tend to consider behaviours and mental states, which are often indeterminate, suggesting the social domain to be more unpredictable compared to non-social. Additionally, Strickland et al. (2017) showed that participants tend to generate a higher number of causes for psychological events compared to physical events. Relatedly, for our task, this might be explained by generating alternative responses for the social causal scenarios and not using the information provided by the experimenter, i.e., choosing ‘equally likely’ option more frequently due to the potential existence of unknown factors.
Individual differences
We identified two clusters of participants, which we labelled as decisive and indecisive reasoners. The indecisive reasoners showed higher consistency by choosing the ‘equally likely’ response across choice problems, compared to decisive reasoners. This pattern also shows less confidence and more indecisiveness among this cluster. Rehder (2014) found that associative reasoners committed more violations compared to causal reasoners, however, causal reasoners also committed a significant number of violations. Associative and causal reasoners were not appropriate labels for our clusters. In Rehder's (2014) study, both clusters still tended to choose the correct D option over E for the dependent choice problem. However, in our study, the biggest difference between our clusters was that one cluster scored higher on all choice problems, labelled as decisive reasoners, while the other cluster scored low on all choice problems by choosing ‘equally likely’ response most of the time, labelled as indecisive reasoners. Moreover, indecisive reasoners differed in their reasoning strategy significantly across social and non-social domains, whereas decisive reasoners followed a similar strategy by showing more consistency across domains.
Previous studies have shown high variability in participants’ responses (e.g., Rehder, 2014, 2018; Rottman and Hastie, 2016), alongside significant violations by even highly veridical reasoners. Our results are generally consistent with these findings. Kolvoort et al. (2021) showed that there is variability in causal reasoning within participants, and higher variability predicts larger violations of normative rules. This is in line with the literature showing that the normative rules suggested by CGMs do not accurately reflect how people actually causally reason (Rehder, 2014; Rottman & Hastie, 2016). Future studies can identify whether the associative and/or indecisive reasoners tend to show higher variability in their responses compared to causal and/or decisive reasoners.
Exploring individual differences in relation to causal reasoning has often been neglected, given that even some of the most influential papers in this area often do not report demographic specifics about their samples, such as age, gender, and ethnicity. Furthermore, it has been suggested that higher violation of the normative rules might be associated with a lower tendency of engagement in deliberative thinking style (Trueblood et al., 2017). Contrarily, our clusters did not differ in their rationality, indicative of deliberation, and experientiality, indicative of intuition, on self-reported measures.
Reasoners’ levels of autistic traits were not significantly different between clusters. To our knowledge, this is the first study evaluating causal reasoning, by using specific causal mechanisms, such as common cause network, in relation to autistic traits. Although we cannot conclude that autistic traits are linked or unlinked to a more normative causal reasoning, it is important to note that the reasoning differences between people with higher and lower levels of autistic traits might be subtler than previously thought or might be due to a specific characteristic those with higher levels of autistic traits share. Notably, there is growing evidence struggling to replicate previous findings on reasoning differences between these groups, suggesting these differences might not exist or might exist in a subtler way (Morsanyi & Hamilton, 2023; Taylor et al., 2022). Here, evidence suggested that there was not a large difference between decisive and indecisive reasoners on the AQ, but that does not preclude smaller, less consequential differences being observable. Notably, exploratory analysis (including outliers), suggested a pattern that could be considered was more consistent with our initial hypotheses – in this case that decisive reasoners might show higher autistic traits. One possibility is that differences may reflect a non-linear pattern, with significant differences only observed between those with particularly high autistic traits (such as autistic people) and those without. Future studies may look to model such an effect. Similarly, there were no significant differences with respect to sub-scales of the AQ, but a trend for a difference in the imagination sub-scale, that may warrant specific testing in future studies.
Limitations
Our experiment is limited to only one type of causal network, the common cause network. Future studies could employ other widely used causal networks, such as common effect (X→Z←Y) and chain (X→Z→Y), to study causal reasoning extensively across domains in relation to individual differences. Additionally, the variables in our experiment have a binary nature (occur/does not occur or present/absent). However, in real life, the causation often links to a continuous or interval concept of cause-and-effect, such as temperature or back pain intensity (Rottman & Hastie, 2016). The uncertainty model proposes that the reason for participants committing violations might be due to their disbelief in perfect observations of the variables presented in a binary nature (Rehder & Burnett, 2005). Nonetheless, it is important to note that Rottman and Hastie (2016) found that participants violated the Markov condition at the same level for binary and numerical variables.
By using abstract or unfamiliar materials (Rehder & Burnett, 2005; Rehder, 2014) or counterbalancing the materials (Rehder, 2014, 2018; Rottman & Hastie, 2016), prior knowledge has been controlled in some of the previous studies to prevent participants importing their own knowledge. Although we carefully counterbalanced the domain order across participants, we did not measure prior knowledge, and our participants made judgments on single directions for each scenario. For instance, for economics, they learned that ‘Low interest rates cause small trade deficits.’ and ‘Low interest rates cause high retirement savings.’
Our novel social scenarios were developed to control for structural similarity to Rehder's (2014) non-social stimuli (including scenarios about economics and meteorology). By this, we mean that vignette lengths, the number of cause(s) and effect(s) for each scenario, and the form of the causal network (in our case, common cause network) were controlled. It is, of course, difficult to be confident on how representative each set of vignettes are to their domain. One positive reason to think that they might be is that no significant differences were found between scenarios presented. A further factor for consideration is the varying ways in which social and non-social scenarios differ. In the simplest sense, we defined this as comparing the relationship between two people (social), to the relationship between two inanimate factors (non-social). This distinction, however, overarches a range of other differences that are likely existent in our stimuli and in real-world social versus non-social comparators. For example, social scenarios are often more emotive, often smaller/more local in scale, and may be more likely to be familiar to participants. Future research may investigate the factors that contribute to differences in causal reasoning between social and non-social scenarios, for which the overarching categorisation may not provide the most parsimonious explanation.
Finally, our sample might be biased given it is dominated by young female students enrolled in higher education. Future studies can recruit a diverse sample, while considering and controlling individual differences, such as age and gender. It is also important to note that our results from a general population cannot be generalised to autism as a clinical diagnosis (Sasson & Bottema-Beutel, 2021), i.e., though we find no link between the continuous autistic traits variable and reasoning style, this does not necessarily mean autistic people do not reason differently for these sorts of causal problem in real life.
Conclusion
We replicated previous findings suggesting that people often violate the normative rules of causal reasoning. Our study revealed a distinction in reasoning strategies across domains, with higher accuracy for the dependent choice problem in the non-social domain and an opposite pattern in the social domain. We did not identify significant differences between clusters of reasoners in their self-reported levels of autistic traits and thinking styles. However, we showed that people tend to heavily default to respond ‘equally likely’ even when they had enough information. Neither the normative rules of causal reasoning nor the previously proposed theories fully explain people's non-normative responses to causal reasoning tasks (Rottman & Hastie, 2016). Therefore, it appears that people exhibit irrationality, but in different ways that might be linked to their individual differences.
Supplemental Material
sj-sps-1-ndy-10.1177_27546330241308542 - Supplemental material for Causal reasoning in social versus non-social domains and its relation to autistic traits
Supplemental material, sj-sps-1-ndy-10.1177_27546330241308542 for Causal reasoning in social versus non-social domains and its relation to autistic traits by Elif Bastan, Sarah R. Beck and Andrew D. R. Surtees in Neurodiversity
Supplemental Material
sj-docx-2-ndy-10.1177_27546330241308542 - Supplemental material for Causal reasoning in social versus non-social domains and its relation to autistic traits
Supplemental material, sj-docx-2-ndy-10.1177_27546330241308542 for Causal reasoning in social versus non-social domains and its relation to autistic traits by Elif Bastan, Sarah R. Beck and Andrew D. R. Surtees in Neurodiversity
Supplemental Material
sj-xlsx-3-ndy-10.1177_27546330241308542 - Supplemental material for Causal reasoning in social versus non-social domains and its relation to autistic traits
Supplemental material, sj-xlsx-3-ndy-10.1177_27546330241308542 for Causal reasoning in social versus non-social domains and its relation to autistic traits by Elif Bastan, Sarah R. Beck and Andrew D. R. Surtees in Neurodiversity
Supplemental Material
sj-xlsx-4-ndy-10.1177_27546330241308542 - Supplemental material for Causal reasoning in social versus non-social domains and its relation to autistic traits
Supplemental material, sj-xlsx-4-ndy-10.1177_27546330241308542 for Causal reasoning in social versus non-social domains and its relation to autistic traits by Elif Bastan, Sarah R. Beck and Andrew D. R. Surtees in Neurodiversity
Footnotes
Authors’ contribution
EB and ADRS designed the project and prepared the main task. EB collected and analysed the data, completed the first draft of the manuscript, and led the revision. ADRS and SRB co-supervised this project and provided critical feedback on the drafts. All authors contributed to the final manuscript.
Declaration of conflicting interests
EB was funded by the Ministry of National Education of Republic of Türkiye.
Funding
The authors received no financial support for the research, authorship, and/or publication of this article.
Supplemental material
Supplemental material for this article is available online.
Notes
References
Supplementary Material
Please find the following supplemental material available below.
For Open Access articles published under a Creative Commons License, all supplemental material carries the same license as the article it is associated with.
For non-Open Access articles published, all supplemental material carries a non-exclusive license, and permission requests for re-use of supplemental material or any part of supplemental material shall be sent directly to the copyright owner as specified in the copyright notice associated with the article.