
Abstract
The implicit association test (IAT) provides a sensitive measure of attitudes to social dimensions such as race, gender or disability using a response speed procedure. The automatisation deficit account of dyslexia attributes the reading (and broader) difficulties of dyslexic people to reduced speed and strength of stimulus–response habit formation and, therefore, predicts reduced implicit bias for individuals with dyslexia. This novel prediction was tested using the ‘Project Implicit’ IAT database on attitudes to disability. Data from over 460,000 respondents was analysed, including 22,747 with physical disability (PD), 14,700 with dyslexia, and 1721 with dyscalculia. The dyslexia group did indeed show significantly less ‘Disability Bias’ than both the PD and no disability groups. Intriguingly, the dyscalculia group showed significantly less disability bias even than the dyslexia group. The results are interpreted within the learning framework of broader automatisation deficit and have ramifications for understanding both conditions and the processes of development of implicit bias in neurodiverse and neurotypical populations.
Lay Abstract
The implicit association test (IAT) provides a sensitive measure of attitudes using images associated with social groups, and asking participants to categorise them quickly, most often revealing a subtle, implicit bias. The well-established automatisation deficit account of dyslexia attributes the reading (and broader) difficulties of dyslexic children to reduced ability to form associations. It, therefore, predicts reduced implicit bias for individuals with dyslexia. This prediction was tested using the ‘Project Implicit’ IAT database on attitudes to disability. Data from over 460,000 respondents was analysed, including 22,747 with physical disability (PD), 14,700 with dyslexia, and 1721 with dyscalculia. The dyslexia group did indeed show significantly less ‘Disability Bias’ than both the PD and no disability groups. Intriguingly, the dyscalculia group showed significantly less disability bias even than the dyslexia group. The results suggest that in line with the neurodiversity paradigm, there may be reduced social biases in people with dyslexia and dyscalculia.
Keywords
Developmental dyslexia may be broadly defined as a ‘learning difficulty that primarily affects the skills involved in accurate and fluent word reading and spelling. Characteristic features of dyslexia are difficulties in phonological awareness, verbal memory, and verbal processing speed…’ (Rose, 2009). An extensive ‘consensus’ definition is provided by Carroll et al. (2024). It is generally accepted that dyslexia is a lifelong condition, in that even if adults with dyslexia have learned to read, their reading remains more effortful and laboured than it does for most readers (Reis et al., 2020). The major framework for educational intervention for dyslexia is that of phonological deficit – difficulty in identifying and combining the sounds in words (Stanovich, 1988), but the initial hope that early school support for phonology would remedy the reading problems of children with dyslexia has not been fully successful (Bowers, 2020; Wyse & Bradbury, 2022) with reading fluency remaining elusive.
There is high ‘comorbidity’ (overlap) between developmental disorders (Peterson & Pennington, 2015) and a particularly strong overlap between dyslexia (reading disorder) and dyscalculia (mathematics disorder), with a meta-analysis (Daucourt et al., 2020) establishing average genetic, shared and nonshared environmental correlations between reading and mathematics of .71, .90, and .56, respectively. Dyscalculia can be defined as ‘a specific and persistent difficulty in understanding numbers which can lead to a diverse range of difficulties with mathematics’ (Butterworth et al., 2011). One explanation for this overlap is a shared difficulty in phonological processing and arithmetic fact retrieval (De Smedt & Boets, 2010). For instance, spelling difficulties are a characteristic and long-lasting feature of dyslexia (Galuschka et al., 2020). An interpretation of a ‘triple deficit’ in arithmetic facts, phonological processing, and spelling is provided by the dyslexia automatisation deficit (DAD) account (Nicolson & Fawcett, 1990) which posits that children with dyslexia have difficulty ‘automatising’ reading skills and, hence, related non-reading skills, including not just cognitive skills such as letter shapes and number bonds but also physical skills such as manual dexterity and general physical coordination.
Automatisation is the process – which typically extends over many months – of developing a skill to the point at which it can be executed smoothly and fluently without the need for thought. Automatisation is required for all our skills, from speaking to catching to thinking. Still, adults may be most familiar with the process of becoming automatic at driving, where the beginner has to think about and execute each movement separately but eventually automatise the skills, becoming able to drive and talk simultaneously (Mondada, 2012). DAD provides a simple and intuitive explanation of the range of reading and non-reading difficulties and also generates a neuroscience-based explanation in terms of ‘cerebellar deficit’ (Nicolson et al., 2001). The cerebellum is a major brain structure originally thought only to be central to the development and monitoring of physical skills and development, but is now known to interact directly with cognitive skills from executive function to language to reading (Prati et al., 2024). While initially criticised as being too broad (Zeffiro & Eden, 2001), the theory has been supported following recent developments in neuroscience that have confirmed the key role of the cerebellum in skill automatisation and execution of cognitive skills as well as physical skills (Alvarez & Fiez, 2018). There is also evidence for a preponderance of adults with dyslexia in creative industries and especially in entrepreneurial activities (Logan, 2009). These outcomes were interpreted recently as a potential upside for dyslexia (Nicolson & Fawcett, 2019) – a lack of skill automatisation should mean that habits are less entrenched for adults with dyslexia, and therefore they may be less susceptible to fixed patterns of thought.
Once a skill or habit is automatised, it operates at a level below conscious awareness and is no longer mentally accessible. This leads to the possibility that these delays in habit formation also occur for the formation of implicit attitudes. The implicit association test (IAT) was designed to measure implicit attitudes: ‘introspectively unidentified (or inaccurately identified) traces of past experience that mediate favourable or unfavourable feeling, thought, or action toward social objects’ (Greenwald & Banaji, 1995). The IAT exploits the finding that it is faster to classify a two-item stimulus if both items are congruent than unrelated, so, turning this around, the speed of response measures the implicit association between them. In addition to response speed, a scaled within-participant measure (‘D’) can be derived by dividing the difference between congruent and neutral means by the standard deviation of the responses. D is a score between −2 and +2, which essentially shows the strength of an implicit bias between category and target (i.e. good/bad black/white). A D score of −2 shows the strongest possible association in one direction (i.e. white-bad and black-good) a D score of +2 shows the strongest possible association in the opposite direction (i.e. white-good and black-bad) a d score of 0 shows no implicit association. D score is essentially a combination of error rates and reaction times when relevant attributes are categorised together and are independent of the individual's speed and has been taken as an index of their implicit attitude to the dimension investigated – see Greenwald and Lai (2020) for an exposition and evaluation of the varied analysis approaches.
The IAT has been used in a wide variety of contexts, including demonstrating implicit racial bias in the US (Greenwald & Banaji, 1995), gender bias in autism (Brickhill et al. 2023), implicit bias towards the Roma in Hungary (Atherton et al., 2019), and implicit bias regarding immigrants in the UK (Lynott et al. 2019). There is good evidence that an implicit bias towards disabled people can be measured using the IAT. A review by Wilson and Scior (2014) identifies how even though relatively fewer studies have previously utilised the disabilities IAT (compared to the gender and race IATs), those have show a consistent moderate to strong implicit bias. This was supported by a more recent meta-analysis showing a significant moderate implicit bias toward people with disabilities using the IAT (Antonopoulos et al., 2023). Similar findings for moderate implicit biases against disabled people have even been found among healthcare professionals (Derbyshire & Keay, 2024; VanPuymbrouck et al., 2020).
DAD findings – significantly weaker performance than younger children matched for reading age – have been established in a wide range of domains including phoneme segmentation, picture naming speed, tachistoscopic word recognition, speeded bead threading and some balance tasks (Nicolson & Fawcett, 1994). Therefore, a similar pattern of delays, reflecting a reduced level of automaticity in the categorisations, should result both in slower responses and a diminished D score on the IAT. Furthermore, given the high comorbidity between dyslexia and dyscalculia and the strong link to learning number facts, we predict a similar pattern of findings for dyscalculia. To our knowledge, this hypothesis and specific prediction have never been tested in the psychological literature.
The development of the open science framework (OSF) database of IAT performance allows this hypothesis to be tested. In the current study, we tested DAD using IAT data from Project Implicit (https://implicit.harvard.edu), testing the implicit associations in individuals with dyslexia and individuals with dyscalculia compared to those with physical disabilities (PDs) and no disabilities (NDs).
DAD predicts that individuals with dyslexia will show a smaller D score (closer to 0) than other individuals. Those with a PD were also included as a comparison group since it is established that those who belong to a relevant group show reduced D scores compared to non-members of that group (Nosek et al., 2007). Based on the above analyses, one might predict that individuals with dyscalculia would also show a smaller D score. Still, in the absence of studies investigating automaticity in dyscalculia, we stick to the conservative hypothesis that their performance will be equivalent to those with PD. All specific hypotheses are given in the Methods section.
Methods
This preregistered study (https://aspredicted.org/∼11NKbRr6Ws) was conducted on secondary data from Project Implicit (https://implicit.harvard.edu), an online resource of IAT data. This dataset contains IAT data, associated demographics, and explicit attitude questions from a range of studies containing over 2.5 million respondents from 41 countries. Respondents answered self-reported demographic questionnaires including self-reporting of their diagnosis of specific disabilities, along with age, gender, and ethnicity. In order to test the DAD, all data from the database that specified fine-grained disability data (rating of disability type of respondents, which included dyslexia as an option) were isolated. The data utilised the disability IAT from the year 2016–2021, with a total of 461,950 respondents matching the below criteria. Data from 2022 onwards was not used as the IAT stimuli changed this year.
Respondents were grouped into one of four categories based on the type of disability. All respondents who had both dyslexia and dyscalculia (N = 1262) or did not fit into one of the above categories (N = 74249) were excluded. For a specific breakdown of respondents, see Table 1.
Number of respondents in the data with the indicated disability types, and the age and gender demographics.
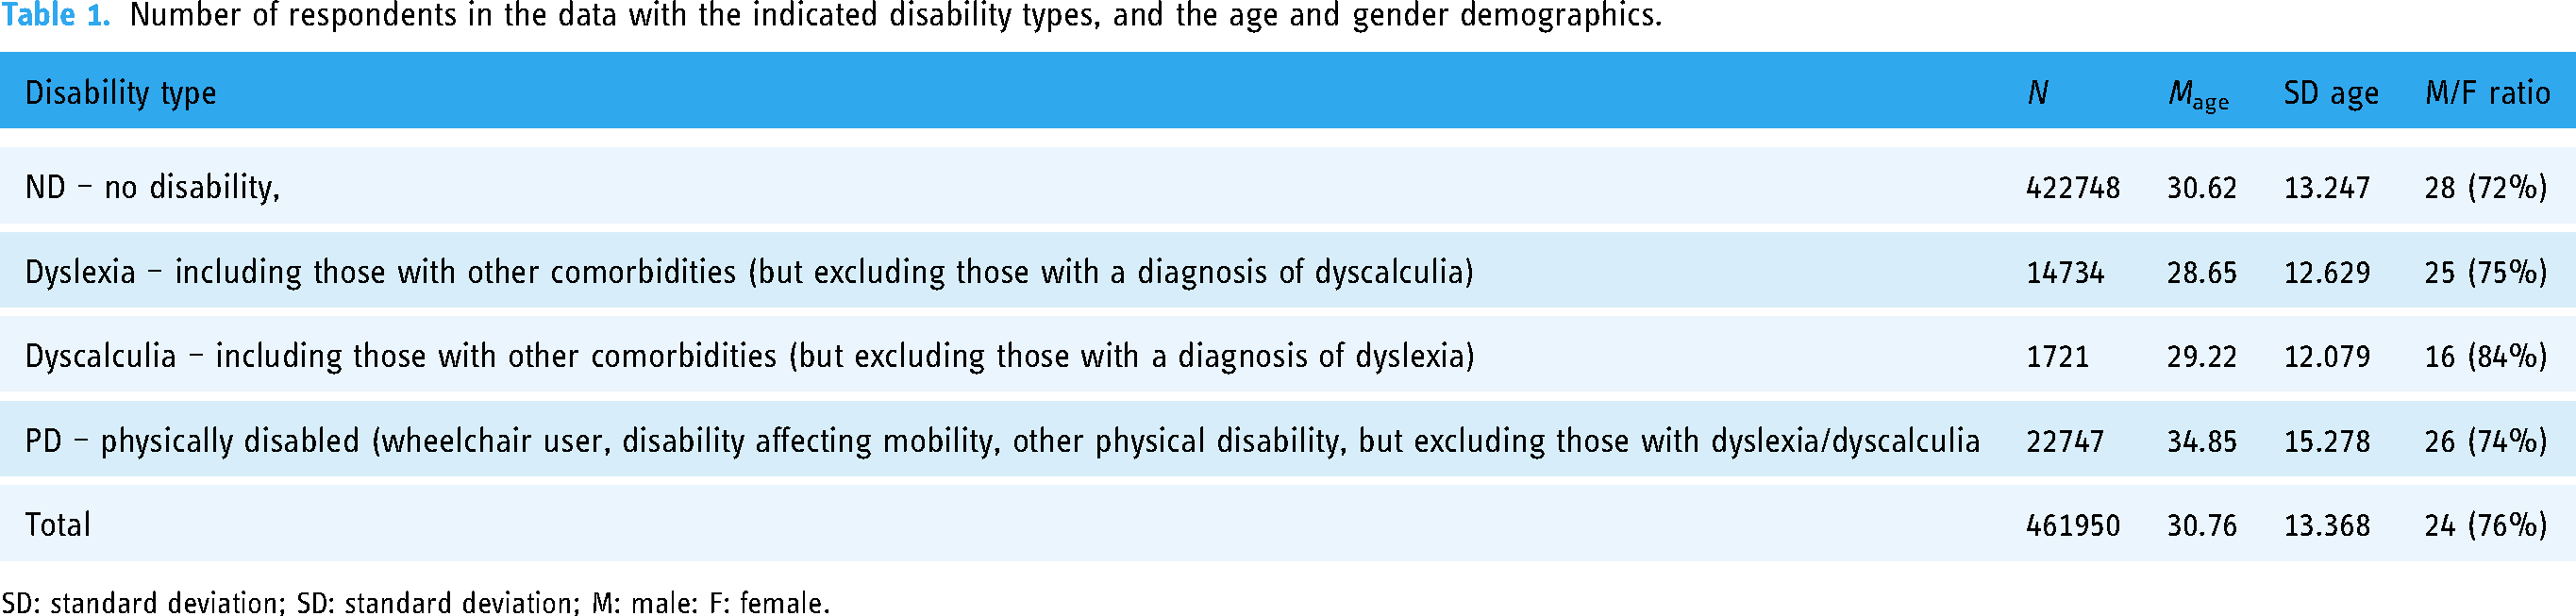
SD: standard deviation; SD: standard deviation; M: male: F: female.
Table 1 details the number of respondents in the data with the indicated disability types, and the age and gender demographics.
Respondents in this dataset had previously completed the Disability IAT, measuring the association between disability and evaluative concepts. The evaluative items were ‘Joy’, ‘Love’, ‘Glorious’, ‘Pleasure’, ‘Peace’, and ‘Wonderful’ for the ‘Good’ Category and ‘Evil’, ‘Agony’, ‘Nasty’, ‘Terrible’, ‘Rotten’, and ‘Bomb’ for the ‘Bad’ category. The disability items were four pictures each for the categories ‘Abled/Disabled’ can be found in Figure 1. The trial structure for the IAT can be found below in Table 2.
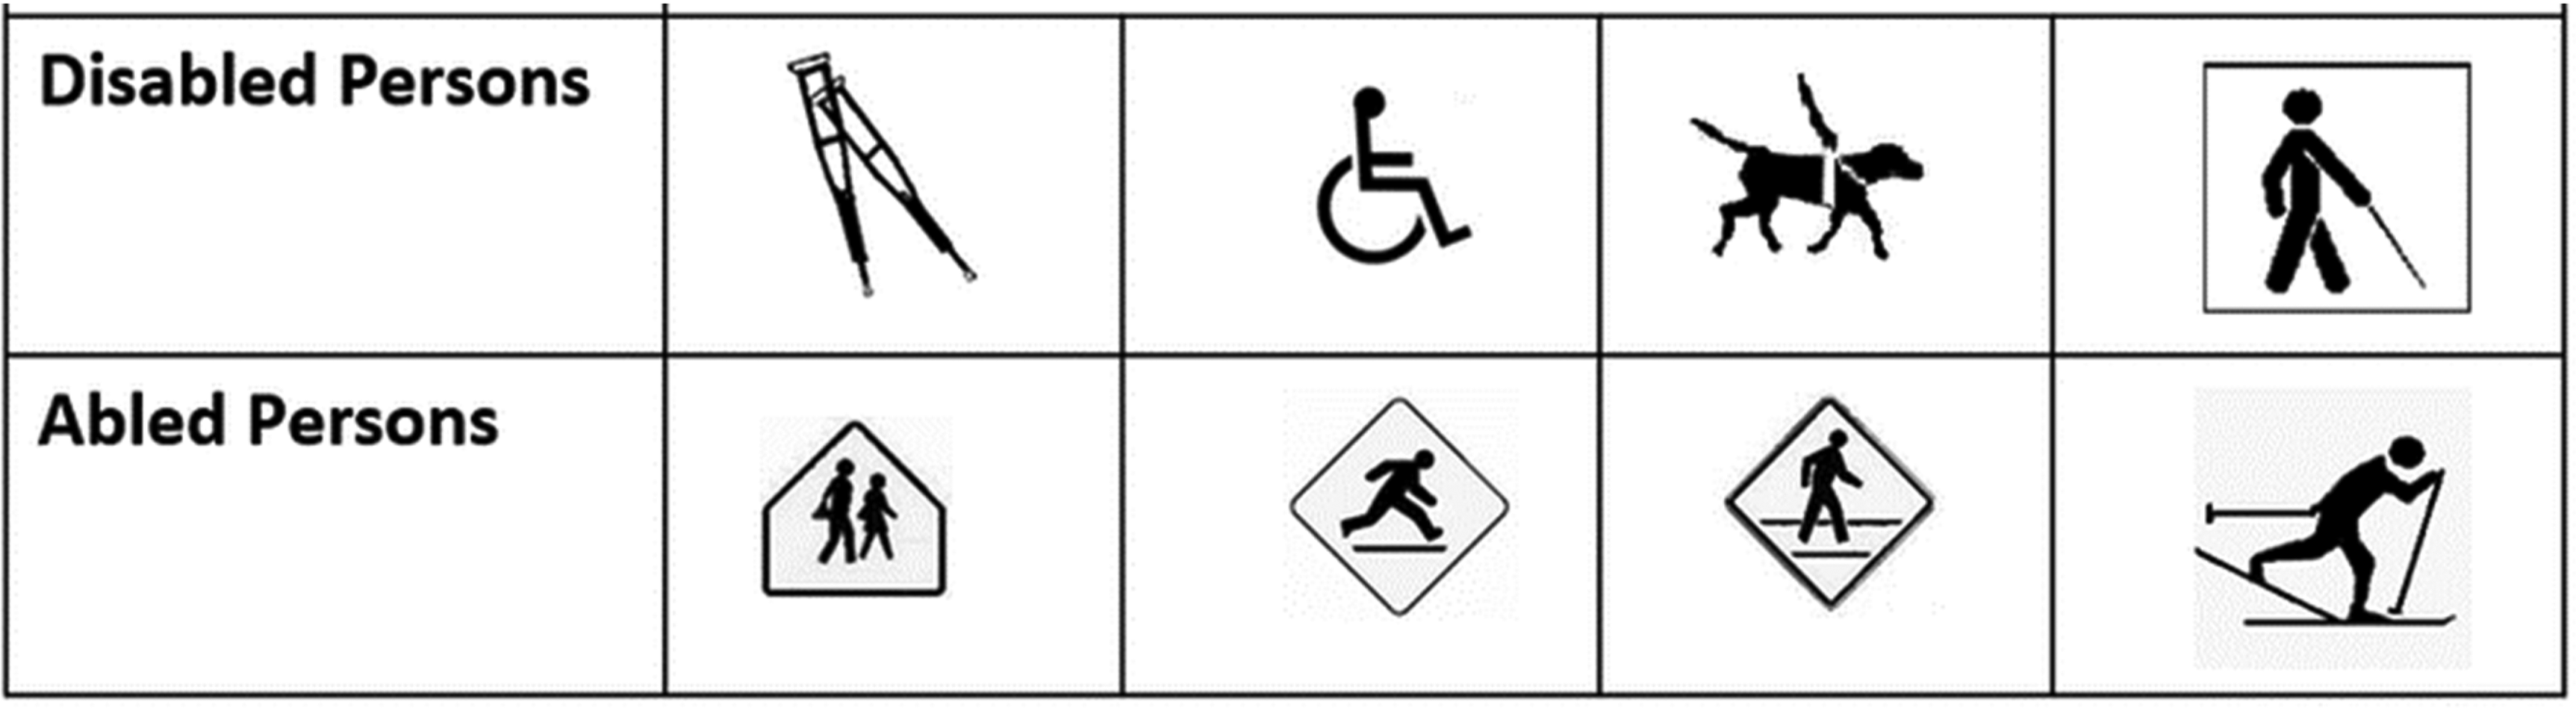
Items included in the disability IAT. IAT: implicit association test.
The preregistered hypothesis.

RT: response time; ND: no disability; PD: physical disability.
Figure 1 shows the relevant items for each category used in the IAT.
Table 1 details the block order for the IAT.
For a full breakdown of this dataset see the relevant OSF page (https://osf.io/tx5fi/). Essentially in an IAT participants are presented with a series of target words such as white/black or male/female and attributes good/bad business person/parent serially in the centre of the screen. Respondents must categorise each item as quickly and accurately as possible to the relevant side of the screen (marked by the category header) using a keyboard press. Reaction times and error rates when processing, for example, white-good/black-bad in the same space are compared to when those pairings are reversed (black-good/white-bad). The preregistered hypotheses are shown in Table 3.
Grouped median and IQR of the response times and D scores broken down by disability type.

RT: response time; IQR: interquartile range; ND: no disability; PD: physical disability.
Results
Kolmogorov–Smirnov tests were first run on both the response times (RTs) and D scores (separately for each disability category) to check if data failed the assumptions of normality, which all cells did (all ps < .005) as is typical with response times and D scores. Consequently, non-parametric tests were undertaken. Descriptive statistics can be found in Table 3.
Table 3 shows the grouped median and interquartile range (IQR) of the response times and D scores broken down by disability type.
An independent sample Kruskal–Wallis test was then conducted on response times across all trials with the disability category as the condition. There was a main effect of disability type on RTs H(3) = 470.45, p < .001. All pairwise comparisons were significant with adjusted p values except dyslexia versus dyscalculia and dyslexia versus physically disabled, though the latter was significant before p values were adjusted. All pairwise comparisons are shown in Table 4.
Adjusted p values for each pairwise comparison for both response times and D scores.

DV: diversity; ND: no disability; PD, physical disability.
A second independent sample Kruskal–Wallis test was conducted on D scores across all trials with the disability category as the condition. There was a main effect of disability type on D scores H(3) = 2024.08, p < .001. All pairwise comparisons were significant with adjusted p values except dyslexia versus physically disabled, though this was significant before p values were adjusted.
Three follow-up Bayesian between-group tests were run using JASP (JASP Team, 2024), with default priors where null results were found following the procedure of Cross et al. (2021). Bayes factors express the probability of the data given the research hypothesis relative to the null hypothesis. Where directional predictions were made, the alternative hypothesis was set. BF01 is the Bayes factor relating to the null hypothesis where a BF01 of below 1 provides no evidence for the null, 1–3 provides anecdotal evidence, 3–10 moderate, 10–30 strong, 30–100 very strong, and above 100 is considered extreme. The results of these tests can be found after the p values (in brackets) where appropriate.
Table 4 shows the adjusted p values for each pairwise comparison for both response times and D scores, along with the direction of difference found and whether or not the hypothesis was supported.
Discussion
Ignoring for the present the individuals with dyscalculia, the predictions from DAD for the individuals with dyslexia show that, as hypothesised, they were significantly slower overall than ND individuals and those with PD. Furthermore, their degree of ‘Disability Bias’ as indexed by the D scores of the IAT, was significantly lower than the ND individuals but not those with PD (which is perhaps not surprising as those with PD are the group the target pictures directly represent). Interestingly, the results for individuals with dyscalculia were even more striking. They had slower RTs than the other groups, in line with the RTs from those with Dyslexia. However, dycalculics showed even less disability bias than any of the other groups. By contrast, individuals with PD responded as fast as – but showed less disability bias than – ND controls.
Starting with the most predictable findings, the individuals with PD responded as fast as the ND group but showed less disability bias. This is as expected intuitively and supported by a regression analysis in a recent IAT study (Derbyshire et al., 2023).
It is difficult for any respondent to ‘fake’ the results, and indeed this is considered a major strength of the IAT (Greenwald & Banaji, 1995). Furthermore, while one might well expect a slower response to the written stimuli for dyslexic participants, it is difficult to envisage how a ‘pure’ phonological deficit could account for the D results since a general proportionate slowing of response would lead to an equal value of D. By contrast, the DAD provides a natural explanation of both aspects. The response is slowed and the bias is reduced due to reduced association strength.
Before interpreting the results, it is important to acknowledge this study's limitations. First and foremost, the respondents were self-identified (rather than formally classified) within the disability categories, so due care should be taken over the interpretation. However, it is important to note that one would expect this to dilute the findings, meaning that a group of formally classified individuals with dyslexia or dyscalculia would provide even more differentiated results. That said, given that there is overlap between dyslexia and dyscalculia, screening for each condition pre-trial may help further elucidate differences between the conditions and reduce the risk of misdiagnosis (such as a dyslexic mistakenly believing themselves dyscalculic). Second, the findings are limited to the disability IAT rather than including further tests of implicit association learning. It might be that the effects are association-specific and do not generalise to other implicit associations. It is notable, however, that the respondents with PD showed significantly less bias reduction than those with dyscalculia. Furthermore, impaired association building – for any association – is the core principle of the automatisation deficit account. The generality of these findings for dyslexia was supported by a study (Brachacki et al., 1995) that demonstrated impaired recognition of (purely iconic) traffic signs by drivers with dyslexia.
The reduced disability bias results for the individuals with dyscalculia contradicted our original, conservative, predictions. Reduced implicit bias was even more pronounced for dyscalculics than for the individuals with dyslexia – they were equally slow but with even less bias. Note that these participants explicitly ruled out having dyslexia, and so should have been at no disadvantage in reading the stimuli. A ‘dyscalculia automatisation deficit’ framework could account for these findings.
One important question is why this ‘reduced implicit bias’ effect should be even more marked for dyscalculia than dyslexia. One possibility is that the participants with dyscalculia were more homogeneous than those with dyslexia. As discussed below, significant early disadvantage at school or home or generally lower cognitive function would be expected to lead to challenges in both literacy and arithmetic. Thus, our exclusion of participants with both dyslexia and dyscalculia went some way to excluding these ‘low opportunity’ groups. Once this is done, there will be a 'purely-language-impaired Dyslexia’ group whose difficulties are limited to phonological development, as claimed by the phonological deficit theorists (Vellutino et al., 2004) and these will not show differences in IAT bias. However, comorbidity analyses (Daucourt et al., 2020) indicate that this subgroup is in fact a minority of those with dyslexia, and the expectation is that the majority will show deficits in many other areas, as predicted by the multiple deficits framework (Pennington, 2006). In short, the respondents with dyslexia are likely more heterogeneous than those with dyscalculia, as also suggested by the much smaller numbers in the database, thereby weakening the mean reduction in implicit bias.
Overall, this study raises a range of novel and important issues. First, the study supports the DAD framework, extending it to dyscalculia. As discussed in Nicolson and Fawcett (2007), it is high time to ‘reunite the learning disabilities’ by looking for common frameworks such as an automatisation deficit that can be used not only for understanding but also as a methodology for supporting interventions for children with learning disabilities. Finally, turning the findings around, what are the societal implications of this ‘reduced implicit bias’ for these two groups? This supports the argument (Nicolson, 2015) that all high-level decision-making groups should explicitly aim to include neurodiverse members, not only to avoid the dangers of groupthink and entrenched habits but also for the reduced bias that they show.
Footnotes
Declaration of conflicting interests
The authors declared no potential conflicts of interest with respect to the research, authorship, and/or publication of this article.
Funding
The authors received no financial support for the research, authorship, and/or publication of this article.