
Abstract
The current report provided some indicators of comparative perceptions of autism spectrum disorder (ASD) provision across five diverse countries (Bangladesh, Greece, Kenya, the United Kingdom and Zambia) in terms of parent perceptions of ASD and its diagnosis, school provision, and predictors of satisfaction of school provision. It was hoped that the use of a single procedure to collect such data would provide needed information from low-to-middle-income countries, in comparison to the better studied higher-income countries. Two hundred parents of children diagnosed with ASD (40 in each country) completed a series of scales about the ASD characteristics and school provision. The results suggested more similarities than differences, with key concerns being the lack of support on offer from authorities, and the quality of the provision provided, irrespective of how that provision was provided. There were some differences between the countries in terms of speed of diagnosis, and the factors relating to those could be interestingly explored in terms of social and religious attitudes to disability.
Lay Abstract
The current report provided some indicators of comparative perceptions of ASD provision across five diverse countries (Bangladesh, Greece, Kenya, UK, Zambia) in terms of parent perceptions of ASD and its diagnosis, school provision, and predictors of satisfaction of school provision. It was hoped that this would provide needed data from low-to-middle-income countries, in comparison to the better studied higher-income countries. 200 parents of children diagnosed with ASD (40 in each country) completed a series of scales about the ASD symptoms and school provision. The results suggested more similarities than differences between the countries, with key concerns being the lack of support on offer from authorities, and the quality of the provision provided, irrespective of how that provision was provided. There were some differences between the countries in terms of speed of diagnosis, and the factors relating to those could be interestingly explored in terms of social and religious attitudes to disability.
Autism spectrum disorder (ASD) 1 is a pervasive developmental issue affecting social interactions, and restricting the types of behaviours and interests that are readily expressed (DSM-5-TR, APA, 2022). Prevalence estimates for ASD have risen over the past 10 years, and currently are around 1.6% to 1.8% of the population (Chiarotti & Venerosi, 2020; Knopf, 2020). However, such estimates differ widely across the world, and figures are mainly based on higher-income countries (Chiarotti & Venerosi, 2020; Salari et al., 2022), with much less information being available for prevalence in low-to-medium-income countries (Aderinto et al., 2023; Qiu et al., 2020). Although there are differences in prevalence, strategies to provide help for children with ASD remain largely within the remit of education in most areas of the world (Gómez-Marí et al., 2021), with schools often taking the lead in provision (Osborne & Reed, 2011; Ye, 2022).
Much of the information that is easily available about the impact of these educational strategies on children with ASD is based on data from higher-income countries (Reed, 2016). However, although there are sometimes financial, social and political barriers to the application of educational practices for ASD in some parts of the world (de Leeuw et al., 2020; Liu et al., 2021), many local communities have found ways of adapting such strategies (see Choueiri et al., 2023; Jani et al., 2021). As a result, educational strategies for ASD are not dissimilar for low-to-medium income countries to those in higher-income countries (Alnusayri, 2021; Choueiri et al., 2023; Kopetz & Endowed, 2012). Yet, whereas a growing amount is known about the ways in which ASD services are experienced and perceived by parents from higher-income countries (Locke et al., 2020; Marsack-Topolewski & Weisz, 2020), few data are available for these purposes from lower-and-middle-income countries (Ayinla, 2019; Makino et al., 2021; Viljoen et al., 2019, 2021).
This lack of knowledge represents a barrier to the development of evidence-based strategies in low-to-medium-income countries (Bakare & Munir, 2011; Hossain et al., 2017), and prevents cross-country comparisons that may be of importance when developing scales of wide usefulness (see Matson et al., 2017). The current study aims to provide some exploratory data on the perceived educational situation for children with ASD across five different countries: the United Kingdom and Greece in Europe; Kenya and Zambia in Africa; and Bangladesh in Asia. This approach follows from a similar comparison across a different set of countries reported by Matson et al. (2017), but which focused on key aspects of behaviour indicated as important in the diagnosis of ASD. However, adding to the knowledge base is vital at this early stage of cross-country comparisons (Bakare & Munir, 2011; Hossain et al., 2017; Nyoni, 2022). In addition, the current set of countries, although partially reflecting opportunity, also allows comparisons between different stages of service development for ASD, as well as involving countries in which there has already been some study of ASD. It is important to note that this study is a cross-country, not cross-cultural or cross-ethnic, as provision is mainly delivered at the level of a country, not a culture.
The two European countries studied in this report both represent higher-income nations, with relatively well-developed, although different, educational provision for children with ASD, and about which much is known. The United Kingdom is one of the leading centres for ASD research, and has provided innumerable research papers on the topic. Much is also known about ASD provision in Greece (e.g. Kossyvaki, 2021; Makrygianni et al., 2018; Ntre et al., 2018; Sevaslidou et al., 2019). However, despite both being higher-income European countries, with some level of state-run health and educational provision for ASD, there are differences between these nations: for example, a much greater proportion of the population in Greece identifies with a religious belief (overwhelmingly Greek Orthodox), and reports suggest greater levels of barrier-inducing stigma around having a child with ASD in Greece than the United Kingdom (cf. Veroni, 2019).
In both the African and Asian continents (although neither should be regarded as homogenous), there is much less literature available. The effects of ASD provision in African countries are not well explored (see Bakare & Munir, 2011), nor has this received great attention in Asia (Hossain et al., 2017). Nevertheless, there is a nascent qualitative literature on parents’ and educators’ perceptions of ASD in both Zambia (Nyoni, 2022; Washington-Nortey & Serpell, 2021), Kenya (Gona et al., 2015; Kamau, 2017; Masaba et al., 2021) and Bangladesh (Rahman et al., 2019). All of these countries have range of ASD provision available, but public knowledge remains generally poor (Masaba et al., 2021; Nyoni, 2022) and social stigma is an issue (Nyoni, 2022; Washington-Nortey & Serpell, 2021; Rahman et al., 2019). Culturally, ethnically and religiously Kenya represents a more diverse population than Zambia, but both have ASD provisions in the first stages of development. Bangladesh is a relatively culturally and religiously monolithic society, with a developing provision for ASD (Mannan, 2017), but one which remains uneven across the country (Hossain et al., 2017; Rahman et al., 2019).
There are clearly many areas that could be examined in regard to parent perceptions of ASD provision, but three were chosen in this study, based on their importance in the literature. Firstly, the diagnosis system was thought important as parents’ perceptions of this have been investigated widely in higher-income countries (Chamak et al., 2011; Goh et al., 2021; Reed & Osborne, 2019). Several such factors are important for child and parent functioning: when parents first notice a difference/problem with their child's behaviour leading them to seek a diagnosis (Reed et al., 2019); child age at diagnosis (Chamak et al., 2011) and time between the two (Osborne et al., 2008; Reed et al., 2019). In addition, the perceived level of ASD traits in the countries is also of interest, as is the relative importance of behaviours comprised by ASD, which has been examined for some countries (Matson et al., 2017), and may have importance for the development of scales that capture the ASD experiences thought to be important (Viljoen et al., 2021). There is some literature that is relevant to these topics in each of the studied countries (e.g. Kamau, 2017; Nyoni, 2022; Reed et al., 2019; Veroni, 2019). However, the procedures involved in each of these surveys have been widely different, making it useful to have the same types of data and procedure applied in each context to facilitate comparisons.
Secondly, it is of importance to understand the types of provision the counties are providing, such as type of school (mainstream and special), as this has been found to impact satisfaction (Osborne & Reed, 2011). Particularly important for legal reasons are issues such as whether children spend time in school, and are included with children who do not have specific or particular needs (Buchner et al., 2021). Moreover, the current study evaluated how this provision is perceived by the parents in the different countries. There are varying amounts of data available from the chosen countries, but not in a form that can be easily compared, and they originate from different methods of survey. Finally, there may be differences in the ways school provision is perceived across countries, and it is important to determine whether there are any common predictors of satisfaction (or lack thereof), such as teacher training and experience with ASD (Osborne & Reed, 2011).
In summary, the study examines parent perceptions of ASD and its diagnosis, school provision and predictors of satisfaction of school provision, across five different countries. It was hoped that the use of a single procedure to collect such data would facilitate comparisons, and be of use in subsequent development of cross-country comparisons.
Method
Participants and recruitment
Participants were recruited via a variety of means, including word-of-mouth and electronic. Advertising was placed through social media groups, social media pages in all five countries. Additionally, organisations working with people with ASD in each of the countries shared the information on their social media sites, and in any face-to-face meetings with parents (although they did not enter into personal communication with the parents about the study). The recruitment criteria were: having a child diagnosed with ASD using the DSM-5; being aged over 18 years old; having experience (i.e. being a caregiver for a person) seeing or dealing with behavioural needs in a neurodiverse population (such as externalising and internalising behaviour problems); and being involved from diagnosis in the up-bringing of child with ASD. The exclusion criteria included any parent aged below 18 years; any co-occurring psychiatric diagnosis so that the perceptions related only to experience of ASD and of its support provision/s; and only one parent per child was allowed to participate in the research. Ethical approval was obtained from the Psychology Department Ethics Committee of the University.
Two hundred participants (40 from each country) were given full information about the study, and agreed to participate. Of these participants, 196 (98%) completed the questionnaires; 2 participants from Zambia, and 2 from Greece, did not supply the full data set, and were excluded.
Family characteristics/background
Of the participants, there were 134 mothers (62 fathers), with a mean age of 39.9 (SD ± 8.1; range 18–65) years. The numbers of participants responding to particular questions varied, and proportions falling into the various categories for each demographic variable are expressed as percentages of those who provided the information. Of the sample: 26/183 (14%) were single; 141/183 (77%) were married; 10/183 (5%) were widowed and 15/183 (8%) separated. The number of members in the families of the participants was given as: 2 = 10/181 (6%), 3 = 38/181 (21%), 4 = 72/181 (40%), 5 = 39/181 (22%), 6/181 = 13 (7%), 7/181 = 4 (2%), 8 = 3/181 (2%) and 10/181 = 2 (1%). The number of siblings of the child with ASD about whom the questions were answered were given as: 0/186 = 36 (19%), 1 = 84/186 (45%), 2 = 51/186 (27%), 3 = 11/186 (6%), 5 = 3/186 (2%), and 6/186 = 1 (5%). Of the participants 47/181 (32%) reported that a family member had a similar problem to ASD, this included any other neurodevelopmental diagnosis or diagnoses of social or pragmatic problems, but the range of issues identified by parents was very wide within this bracket. The fathers’ education was reported as: up to 16 years = 11/186 (6%); up to 18 years = 27/186 (15%); college/university = 98/186 (53%) and postgraduate = 50/186 (27%). Mothers’ educational levels were reported as: up to 16 years = 13/182 (7%); up to 18 years = 31/182 (17%); college/university = 110/182 (60%) and postgraduate = 28/182 (15%). The fathers’ occupations were reported as: labourer/clerical = 35/188 (19%); skilled/technical = 27/188 (14%); managerial/professional = 105/188 (56%) and unemployed/houseworker/strike = 21/188 (11%). The mothers’ occupations were reported as: labourer/clerical = 26/187 (13%); skilled/technical = 11/187 (6%); managerial/professional = 91/187 (49%) and unemployed/houseworker/strike = 59/187 (32%). The breakdown of the family demographics by country can be seen in Table 1.
Mean (standard deviation) demographic characteristics of the parents in each country.

Note: Age = parent's age; No. in family = family members; sibling = number of siblings; married = percentage married; father degree = percentage fathers with degree; mother degree = percentage mothers with degree; father skill/prof = percentage fathers employed in professional or skilled occupations; mother skill/prof = percentage mothers employed in professional or skilled occupations.
Children's characteristics
Of the 196 children with an ASD diagnosis about whom the questionnaires were completed, 150 (77%) were male, with a mean age of 8.9 (± 3.7; range = 3–16) years. Of the parents, 70/178 (40%) reported that this child also had a physical medical diagnosis, 87/183 (48%). Parents reported they first noticed an issue with their child when the child was 2.3 (±1.9; range = birth – 9) years, that an ASD diagnosis was received when the child was 3.8 (±1.4; range = 1–9) years, with a mean time from noticing to diagnosis of 1.4 (±1.2; range = 1–7) years. The children's characteristics for each country can be seen in Table 2.
Mean (standard deviation) demographic characteristics of the children in each country.

Countries
Bangladesh is located in South Asia, and covers 147,570 km2. The population is over 163 million, and it is the eighth most populated country globally. Dhaka is the capital and primary urban centre, encompassing the greatest population and holding prominence in economic, political and cultural domains. Bangladesh is the second largest economy in South Asia. Islam is the predominant religion (> 90% adherence). Education is divided into three sectors: primary (6–11 years); secondary (11–18 years) and tertiary (universities and other institutions of higher learning). Every child is entitled to free, compulsory education, with a fulfilment rate of over 80%. There are 33 schools specifically catering to individuals with ASD, with a collective student population of 4850.
Greece is in Southeast Europe, covering an area of 131,957 km2. It has a population of approximately 10 million. Athens is the capital, political and administrative centre, and the most populous urban area. Greece has a democratic political system, and an advanced high-income economy, being the second largest economy in the Balkans. The Greek Constitution acknowledges Eastern Orthodoxy as the predominant religion, but safeguards freedom of religious conviction. Ethnically, Greece exhibits a degree of homogeneity, and a significant majority of its indigenous populace employs Greek as their primary, or exclusive, means of communication. Compulsory education encompasses primary schools and gymnasiums, and is mandatory for children aged 4 and above. Children commence elementary education at 6, and continue studies for 6 years. Enrolment at the gymnasium typically occurs at 12 for 3 years.
Kenya is in East Africa, with an area of 582,646 km2. Its population is 53 million. Nairobi is the capital and major urban centre. Economically, Kenya has a low ranking on the Fragile States Index, and faces challenges fulfilling fiscal responsibilities. There is significant human diversity, with 42 ethno-racial and linguistic groupings who communicate in their native languages inside their own social groupings. English and Swahili are the designated official languages, with English extensively utilised in education and governance. The majority of individuals in Kenya are Christian (85%), with Islam the second most widely practiced religion (11%). Healthcare is low priority, but education is an inherent entitlement, and the education system is ranked as the most robust in Africa.
The United Kingdom is on the northwestern coast of Europe, encompassing the landmass of Great Britain, the northeastern region of Ireland, and smaller islands situated within the British Isles. The land area of is 242,500 km2, with a population of approximately 68 million. London is the capital and most populous city, and a prominent global centre for finance. The United Kingdom has the fifth-largest economy globally. It is a democratic monarchy, with safeguarded religious freedom, although no one religion is practiced by more than 40% of the population. The United Kingdom is composed of four constituent countries (England, Scotland, Wales, and Northern Ireland), each with devolved governments with autonomy over health and education. Education is mandated for those 5 to 16 years, with the onus of providing education falling upon local government. The proportion of individuals possessing a degree is 38%, the highest ratio in Europe. Universal healthcare is extended to all individuals who hold permanent residency, and is accessible without charge at the time of requirement. A developed social care structure is currently in place across all four nations of the United Kingdom.
Zambia is in southern Africa, covering an area of 753,614 km2. The population is 19 million, mostly located in the southern region of Lusaka and the northern region of Copperbelt. Lusaka is the capital city. Over 50% of the Zambian population are below the officially recognised national poverty threshold. Unemployment and underemployment are significant. The majority of individuals in rural areas engage in subsistence farming. Zambia is currently facing widespread HIV/AIDS, with a prevalence of over 12%. Zambia exhibits a notable degree of racial and ethnic diversity, with over 70 ethnic groupings. The nation is legally designated as Christian, but safeguards religious freedom. English is the official language. The constitution guarantees rights to equitable and sufficient education.
Materials
Demographic/background questions
There were questions relating to the gender and age of the parent completing the form: whether they were married, number of family members, numbers of siblings of the child with ASD, and whether any family members had similar problems. Respondents were asked about the father's and mother's educational levels and current occupations. In terms of the child, they were asked about age, gender, when they first noticed a problem with the child, and when the diagnosis occurred. They were asked what sort of school the child attended, when they had started the school, whether the parents were satisfied with the school (0 = ‘not at all’ and 4 = ‘very satisfied’), about the quality of the school (0 = ‘poor’ and 4 = ‘very good’), and whether the parents had any problems or difficulties with the teachers.
Autism behaviour checklist (ABC; Krug et al., 1980) is a widely used and easy to administer, suitable from 18 months to 35 years. It contains a list of behaviours associated with ASD, which parents tick if they have ever been shown by the child. Each behaviour gives a weighted score indicative of ASD (4 indicates the highest predictor, and 1 the lowest). The behavioural descriptors are grouped into five symptom areas: sensory, relating, body and object use, language, and social and self-help (Miranda-Linne & Melin, 2002). The intra-rater reliability of the test is .94, and the intra-rater reliability agreement score is 95%. Its validity is satisfactory (Eaves et al., 2000; Krug et al., 1980). For each country the ABC was translated from English to the needed language, and was then back translated by an independent person competent in both languages to ensure the translation did not affect the integrity of the checklist. There were no items that caused specific difficulties in terms of the language into which it was translated not having an appropriate term, or similar, to the English. However, some items did require several translation iterations to gain agreement about their meaning/connotations. The internal reliability (coefficient alpha) ranged between .81 and .88 for the different countries.
Parent satisfaction scale (Clare & Pistrang, 1995) measures parent satisfaction with specific teaching services for children with specific or particular needs. Parents rate their satisfaction with the school on 8 items, each scored on a five-point scale (0 = strongly disagree to 4 = strongly agree). Clare and Pistrang (1995) suggest that the measure may be considered to have adequate face and content validity because it appears to be acceptable to parents, easy to complete, and contains questions related to the educational services (Harris & Poertner, 1998). The scale was translated, as described above, with no specific difficulties being encountered. For the current data, the alpha coefficient ranged from .89 to .93 for the countries.
Procedure and data analysis
If parents wished to participate, they clicked a consent button, and were taken to an online survey. There was no set time limit to complete the survey, but this generally took about 15 min. Once completed, parents were shown a debrief page on-screen.
Visual inspection of histograms and Q–Q plots demonstrated the data were normally distributed on all continuous variables. Prior to analyses, data were cleaned and screened for missing values and outliers. Missing data were replaced using the person-mean substitution method for any questionnaire measure where ≤10% of the items were missing (Hawthorne & Elliott, 2005). There were 26/198 (13%) participants who has some missing data; this usually amounted to no more than three items from the entire survey. The data were also screened for outliers, employing a criterion of three standard deviations above and below the mean, and none were found.
To analyse the results, a number of statistical approaches were taken dependent on the data collected. Parent reports of aspects of diagnostic process; their perception of ASD characteristics; and their perception of school provision, were analysed using analysis of variance (ANOVA) or chi square comparing across the countries. Predictors of satisfaction with school provision were analysed using Pearson correlations. G-Power calculations indicated that for a medium effect size (r = .3), a rejection criterion of p < .05, and 80%, that 67 participants would be needed for Pearson correlations. For an ANOVA between the five countries, with a medium effect size (f’ = .25), rejection criterion of p < .05, and 80% power, that 200 participants would be needed. For a chi square analysis between the five countries, with a medium effect size (w = .30), rejection criterion of p < .05, and 80% power, that 133 participants would be needed.
Community involvement statement
In developing the aspects to be covered in this survey, people with ASD, as well as their caregivers, were involved in establishing the range of topics to be covered.
Results
Time to diagnosis
Table 3 presents the mean (standard deviations) for child ages when the parents first noticed a difference/problem; child age when the ASD diagnosis was given; and the time between these two points. These data reveal some differences between the countries, with parents in Greece noticing an issue earlier than parents in the other countries; diagnosis taking place at an earlier age in Greece and Bangladesh; and time between first noticing and diagnosis being shorter in Bangladesh compared to other counties. There were no other significant differences except for those highlighted above.
Mean (standard deviation) years old when parents first noticed an issue with the child, when the child was diagnosed with ASD, and the time between the two, along with the ANOVA analyses.

ANOVA: analysis of variance; ASD: autism spectrum disorders; HSD: honestly significant difference.
Parent perception of ASD characteristics
Table 4 presents the mean total ABC score for each country, along with the mean percentage of total scores possible for each subscale. These data and analyses reveal that the prominence of ASD traits was rated highest in the United Kingdom, and this was true for all of the subscales. Parents in Kenya tended to rate ASD features as more severe than in the other remaining countries. Comparison of the relative importance of the different groups of characteristics in the five countries was analysed through a two-factor mixed-model ANOVA (country × subscale), which revealed a significant main effect of country, F(4,185) = 51.78, p < .001, η2 p = .528, a main effect of subscale, F(4,740) = 9.88, p < .01, η2 p = .051, and a significant interaction between the countries, F(16,740) = 3.72, p < .001, η2 p = .075. Separate pairwise analysis for each country, using Tukey's honestly significant difference (HSD) tests, between the characteristics revealed no difference between the importance for Zambia, that Bangladesh and Greece rated relating and social features as more severe, Kenya rated relating and body features as more severe, and the United Kingdom rated social and language features as more severe.
Mean (standard deviation) of total ABC score, along with the mean (standard deviation) of percentage of subscale scores possible. ANOVA results are presented for each scale.

ANOVA: analysis of variance; ASD: autism spectrum disorders; HSD: honestly significant difference.
Perceptions of school provision
Inspection of Table 5 shows the majority of pupils were educated in special schools in Bangladesh and Grece, with the opposite being true for Zambia, Kenya and the United Kingdom. This is also the case for children included with neurotypical pupils. In all countries there was near full-time (5 days/week) and over 4 hours a day at school for the children with ASD, with only some minor (although significant) differences between the countries. There was no difference in the levels of teachers with training and experience with ASD across the countries.
Percentage pupils in special school, mean (standard deviation) days per week and hours per day in school, percentage teachers with ASD training and experience, as well as percentage of pupils included with neurotypical children and having LSA support.
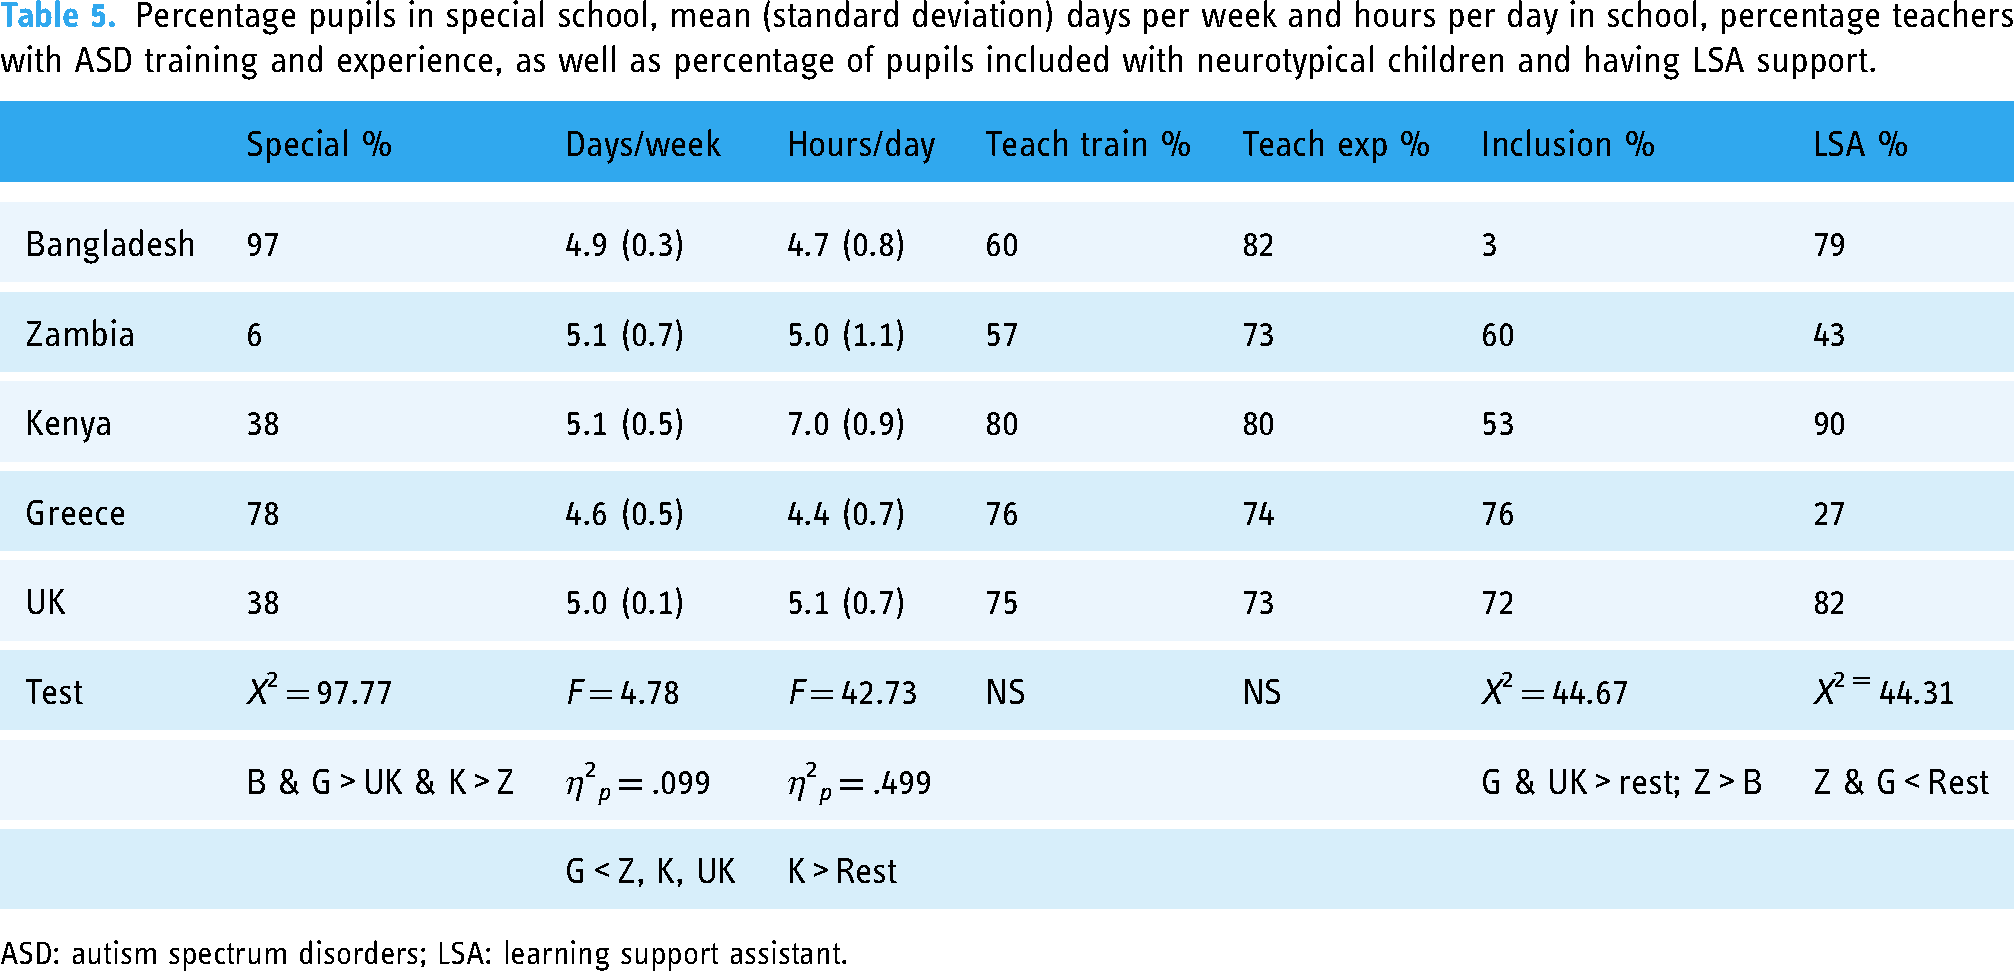
ASD: autism spectrum disorders; LSA: learning support assistant.
Table 6 shows that the percentage of pupils who used augmented communication across the five countries was not significantly different (although higher percentages in Greece and the United Kingdom used some form of augmented communication). There were higher reported levels of help available from the school for the parents in Bangladesh and Kenya than in the other countries. No country, except Greece, reported high levels of help available form the local authority (other than the school).
Types of help reported by the parents of the children with ASD across the five countries.
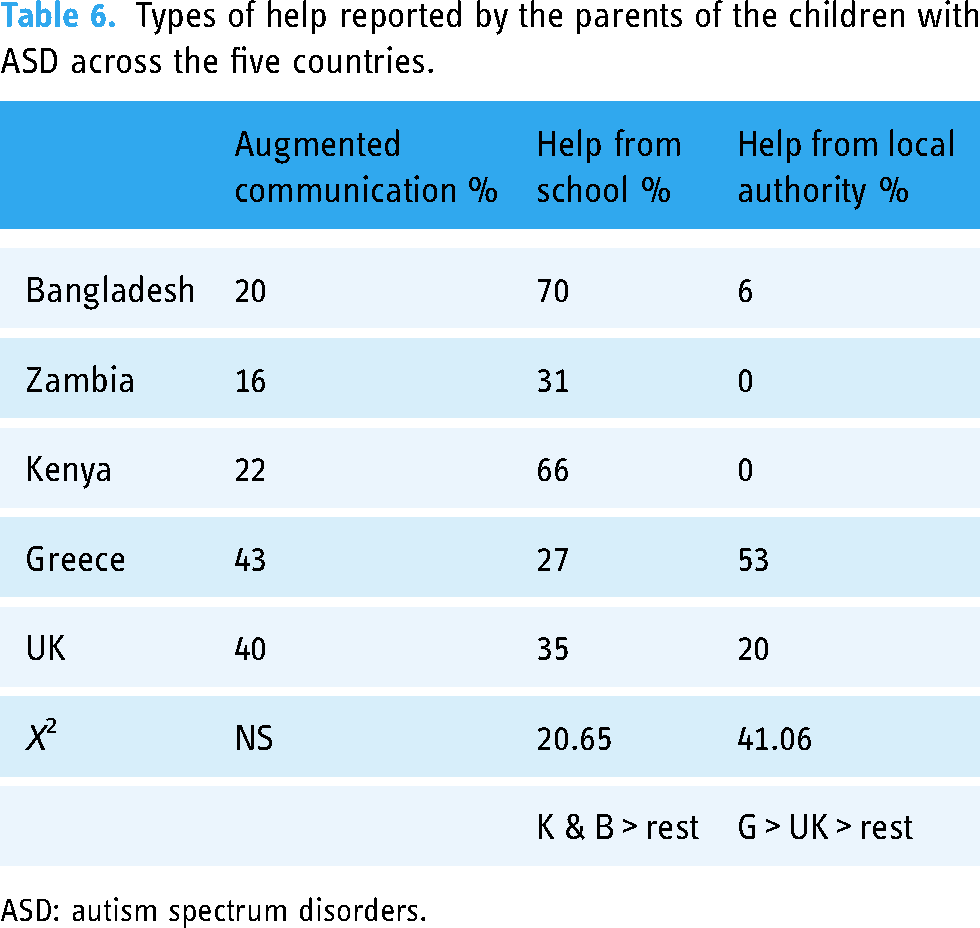
ASD: autism spectrum disorders.
Table 7 shows the parents’ perceptions of school provision for their children with ASD. A higher percentage of parents in the United Kingdom and Greece report having difficulties with their children's teachers than in the other countries. However, parents in Greece report greater satisfaction with their child's school (on a 0–4 scale) than any other country, as well as thinking the quality of the school (along with the United Kingdom) was higher than the other countries. In terms of the school satisfaction scale, parents in Greece reported being more satisfied than parents in Zambia and Kenya.
Parents’ perceptions of school support and satisfaction.

HSD: honestly significant difference.
Predictors of school satisfaction
In addition to analysis by country, separate correlation analyses were conducted to determine if any of the ASD, background, or school characteristics were related to the school satisfaction score. Relationships were taken to be meaningful and reported only if they had a significance level of p < .001 (given the large number of correlations involved).
The level of ASD features (total ABC score) was not related to School Satisfaction Scale score. This lack of relationship between perceived ASD features and satisfaction with the school held true for each country when tested separately.
Of the parent and child backgrounds (parent age, child age, parent and child genders, child age at first noticing an issue, age at diagnosis, and noticing to diagnosis time), only parent age was related to school satisfaction (r = .116). However, this relationship between parent age and school satisfaction was true in Bangladesh (r = .341), but not in the other countries, when analysed separately.
A number of school factors were important in determining school satisfaction, which did not differ across countries. There were positive relationships between school satisfaction scores and teacher training (rpb = .268), receiving parent support from the school (rpb = .190), and receiving local authority support (rpb = .157). The type of school (special or mainstream), and being included with children with no specific or particular needs, were not predictors of satisfaction.
Discussion
The most notable feature to emerge from this study of diverse countries was similarity in perceptions, rather than difference. The study was conducted in response to suggestions of a paucity of data for low-to-medium income countries, which may inhibit development of services (Bakare & Munir, 2011; Hossain et al., 2017). Although there is a developing literature in some of the countries included (e.g. Kamau, 2017; Masaba et al., 2021; Nyoni, 2022; Rahman et al., 2019; Washington-Nortey & Serpell, 2021), most data come from higher-income countries (Chiarotti & Venerosi, 2020; Salari et al., 2022). Moreover, the procedures used in the former studies are widely different from one another, making comparison difficult, and it was hoped that the use of a single procedure to collect such data would facilitate comparisons (Matson et al., 2017). The current striking similarities give some cause for optimism in terms of generalisation of results and techniques.
In terms of ASD diagnostic systems and their perceived workings and characteristics, parents across the countries tended to report first noticing an issue of difference for their child at the same age (around 1.5 years), although parents in Greece reported noticing such differences earlier. That time to recognising these differences was similar suggests that apparent discrepancies in ASD knowledge in the countries (e.g. Nyoni, 2022), does not translate into any lack of recognition of a potential problem on the part of the parent. There were differences in time to receive a formal diagnosis, with their being a speedier process in Greece and Bangladesh. That low-to-middle-income countries do not seem to lag behind higher-income European counterparts in this regard argues against any lack of effective provision, even though there may be lack of data (Bakare & Munir, 2011; Hossain et al., 2017).
The reasons for any differences are unclear, and could reflect the demand on, and availability of, healthcare systems in the various countries; as less demand and greater availability could both speed the process. The presence of widespread access to early intervention or screening programmes across these countries (in addition to the diagnostic systems) maybe an issue underlying some of the differences. For example, it may be that Greece has a different system of developmental monitoring than Bangladesh, or allow different types of providers to make a diagnosis. The relative proportions of individuals in urban or rural areas, may also differentially impact service access differentially in the countries. These issues could not be addressed based on the current data, but certainly warrant further and more intensive exploration. One thing in common between Bangladesh and Greece is a greater presence of a monolithic religion, widely shared among the population, compared to Kenya, the United Kingdom, and Zambia, which tend to be religiously more diverse. Whether this feeds into experienced stigma, which is high in both Bangladesh and Greece (Rahman et al., 2019; Veroni, 2019), could be investigated in subsequent studies. High experienced stigma and consequent shame may lead to a rush to diagnosis, which is not always helpful (Reed et al., 2019).
The level of ASD features was rated as highest by parents in the United Kingdom, relative to all other countries. Following the United Kingdom, parents in Kenya rated ASD features as more severe than in the other countries. In terms of the key characteristics perceived as important, both Bangladesh and Greece rated relating and social features as more severe than the other countries. Whether this is related to speed of diagnosis is unclear. Kenian parents rated relating and body features as more severe, and parents in the United Kingdom rated social and language features as more severe. These data reflect and extend what has previously been suggested by Matson et al. (2017), and develop understanding of the key areas that parents find challenging in those different cultures.
As these data were parent-rated, there is no way of knowing whether characteristics were objectively more pronounced in individuals with ASD in the United Kingdom. All children did have a diagnosis based on the DSM-5 criteria, which provides some form of baseline, but not necessarily any insight into specific abilities. It could be that strain of services means only the most severe cases receives a diagnosis in the United Kingdom, and other countries with less demand, or more available services, give diagnoses more liberally. This would be important to establish going forward. It may be that parents in the United Kingdom, because of putative greater awareness of ASD, may over-interpret the characteristics – certainly having greater levels of stress can be related to perceptions of having a problem (Fong, 1991), and such greater stress can increase ratings of behavioural challenges (Reed & Osborne, 2013). Challengingly, this may imply that awareness is not always a good thing, if coupled with a lack of understanding of the consequences of having ASD. Alternatively, anxiety may be higher in the United Kingdom than in the other counties, making parents less resilient to challenge, anxiety has been found to range from around 5% in African cultures to over 10% in Euro/Anglo cultures (Baxter et al., 2013).
In terms of education and provision, there was remarkable similarity across the countries – and sometimes marking the similarities is as vital as marking the differences. No country except Greece reported very high levels of help available form the local authorities, other than the school. This mirrors previous claims that the main impact of support for ASD, irrespective of country, falls on the school and parents (Gómez-Marí et al., 2021; Osborne & Reed, 2011; Ye, 2022). There were differences in the place of provision for help, with the majority of pupils being educated in special schools in Bangladesh and Grece, and the opposite being true for Zambia, Kenya, and the United Kingdom. This also may be related to the speed of diagnosis in those countries, and a disturbing possibly is that it implies a need to remove the child from typically developing peers; alternative it may just imply better special school provision. However, whatever the place of training, parents perceived no difference in teacher training and experience. Data on parent perceptions of the quality of school were clear, in that the higher-income countries felt more satisfaction with school provision, but also reported having more difficulty with the teachers. This may reflect greater levels of expectation and involvement with the education process. Across all countries several factors predicted satisfaction, such as level of teacher training, level of received support from the school, and from local authorities. The type of school (special or mainstream), and being included with children with no specific or particular needs, were of no consequence to parent satisfaction. In particular, the latter finding indicating that parents’ satisfaction with school provision is not impacted by the degree of contact with neurotypical pupils, suggests that focusing on inclusion in mainstream education as a goal in its own right, irrespective of the pupil or parent wishes, may be harmful to parents’ relationships with the school.
In drawing conclusions from these data, it may be worth noting that the situation for the sample from Greece did seem to be a little different to that from the other countries. For example, the parents tended to have fewer children, and be less qualified and in less professional or skilled occupation. The diagnosis of the children with ASD also occurred earlier than for the other counties. It is unclear why this is the case, and whether it is truly representative of Greece. Given this, some caution may be needed. A challenge when conducting such data is to be able to recruit adequately across the counties involved. Having a network of people, based in each country, each with good contacts across a range of locations and systems, would seem to be key in developing further exploration of these types of data.
One important limitation to consider when making such cross-country comparison, is that responses to the items on questionnaires ideally should be tested for invariance across countries (Stevanovic et al., 2022). This can be important as ASD may be perceived differently cross-culturally, in some respects, by parents, causing individual items to be regarded differently. A problem with applying such an analysis to the current data is that, given the nature of responses to the ABC, assessing individual items that constitute lower or higher indicative scores for ASD is not possible in the same way as it is for the MCHAT (Stevanovic et al., 2022).
The current report provided some indicators of comparative perceptions of ASD provision across five countries of diverse natures. The results suggested more similarities than differences, with key concerns being the lack of support on offer from authorities, and the quality of the provision provided, irrespective of how that provision was provided. There were some differences between the countries in terms of speed of diagnosis, and the factors relating to those could be explored in terms of social and religious attitudes to disability.
Footnotes
Declaration of conflicting interests
The authors declared no potential conflicts of interest with respect to the research, authorship, and/or publication of this article.
Funding
The authors received no financial support for the research, authorship, and/or publication of this article.