
Abstract
Sleep plays a major role in child development and sleep problems have been implicated in several neurodevelopmental conditions. However, its exact role in these conditions remains unknown. Co-occurrence is a core challenge of the existing diagnostic framework, with many advocating for a transdiagnostic approach to studying neurodevelopment. In this exploratory investigation, we look at a transdiagnostic sample of 299 children to (1) identify and compare data-driven sleep profiles and explore their links to behaviour, cognition and learning and (2) use a network approach to simultaneously characterise the relationship between sleep and symptoms of behaviour, communication and mental health. Cluster analysis identified two sleep profiles – regular sleepers and poor sleepers. Between-group comparisons showed that poor sleepers disproportionately experienced poorer emotion regulation, peer relationships and structural language. The network analysis suggested that after statistically accounting for the overlap between symptoms of behaviour, communication and mental health, sleep remained directly linked to multiple symptoms, with a particularly strong relationship with emotion regulation. These findings advance our knowledge of the role of sleep in neurodevelopmental conditions, highlighting its importance as a transdiagnostic process and priority in neurodevelopmental research.
Lay abstract
Sleep quality and quantity are essential in children’s development. Children diagnosed with neurodevelopmental conditions tend to present more sleep problems. However, the exact interaction between sleep and these conditions is still under discussion. Here, novel statistical approaches were used to explore the relationship between sleep and aspects of children’s behaviour, communication, and mental health. These methods identified two groups of children based on their sleep quality: poor sleepers and regular sleepers. The two groups were compared across a broad set of measures including neurodevelopmental difficulties, learning outcomes and mental health. The regular sleepers performed better than those with sleep problems on all measures, with poor sleepers presenting crucial difficulties in emotion regulation, peer relationships and structural language. Using network models, an explorative global analysis of all the participants together reiterated the influence of structural language on other behaviours and uncovered a strong connection between sleep and emotion regulation. Overall, this study improves our knowledge of the role of sleep in conditions affecting brain development and its relationship with behaviour, communication and mental health.
Introduction
Sleep and neurodevelopment
Sleep is a fundamental human behaviour, with almost a third of our lives being spent asleep (Shanahan et al., 2021). Regular and sufficient sleep has clear benefits for human physiology (Gadie et al., 2017), and during childhood is crucial for mental well-being, behaviour, and effective learning (Alfonsi et al., 2020; Gadie et al., 2017; Quach et al., 2018). According to the 2018 World Health Organization report on the health behaviour of school-aged children in the United Kingdom, 27% of children reported insufficient sleep to feel awake and focus on school, with older adolescents being more likely to report inadequate sleep (up to 42% of over 15-year-olds) (Brooks et al., 2020). Sleep disturbances in youngsters can have an impact on multiple cognitive and neurobehavioural systems, such as the regulation of emotions and attention (Krause et al., 2017). Additionally, poor sleep can impact reaction times, elevate inattention, decrease cognitive processing speed and worsen memory performance (Astill et al., 2012; de Bruin et al., 2017; Reynaud et al., 2018; Short et al., 2018). Alongside these cognitive links, poor sleep is commonly linked to increased mood changes and irritability (Shanahan et al., 2021).
Over the past two decades, our knowledge of the role of sleep in child and adolescent well-being has increased substantially (Shochat et al., 2014). However, debate remains over the exact role of sleep in cognition and behaviour (Reynaud et al., 2018). There are multiple hypothetical roles for sleep within behaviour and cognition in youngsters. One hypothesis postulates sleepiness as an intermediate link; poor sleep induces sleepiness which in turn causes problems in areas of behaviour and cognition (Calhoun et al., 2012; Vriend et al., 2015). Other hypotheses argue that the lack of sleep has a more active role, directly affecting memory consolidation or synaptic plasticity (Reynaud et al., 2018). Research has demonstrated that sleep duration in school-aged children is negatively associated with externalising and internalising behaviours and positively associated with many dimensions of cognition (Astill et al., 2012; Quach et al., 2018; Vriend et al., 2015). Additionally, excessive daytime sleepiness has been hypothesised as a mediating factor for obesity in attention deficit hyperactivity disorder (ADHD), suggesting alterations in orexin, a hormone commonly known to regulate wakefulness, to be at the core of impaired sleep and feeding behaviours in people with ADHD (Cortese, Konofal, Dalla Bernardina, et al., 2008; Cortese, Konofal, & Lecendreux, 2008). This emphasises the clinical relevance of sleep difficulties and the need for further research into its role in neurodevelopment.
Sleep problems can affect all children. However, they are more prominent in those with neurodevelopmental conditions (Becker et al., 2019; Heller & Ruby, 2019; Johnson et al., 2018). Children with ADHD encounter increased sleep problems and daytime sleepiness compared to peers (Becker et al., 2019; Martins et al., 2019; Scarpelli et al., 2019). Sleep has also been associated with autism (Johnson et al., 2018; Thomas et al., 2018). About 70–80% of children diagnosed with ADHD or autism report sleep problems, including excessive daytime sleepiness, bedtime resistance, decreased sleep efficiency and night waking (Johnson et al., 2018; Shanahan et al., 2021; Thomas et al., 2018). Evidence suggests that sleep problems may aggravate key clinical symptoms but may also be a marker of higher symptom rates in autistic children (Johnson et al., 2018) and those with ADHD (Becker et al., 2019; Cortese et al., 2007). Therefore, sleep-related factors may be important in driving other neurodevelopmental symptoms, but they can also arise as part of the conditions’ symptomatology (Bondopadhyay et al., 2022). Importantly, these two possibilities are not mutually exclusive. Sleep disturbances are common in several neurodevelopmental conditions and poor sleep quality is increasingly recognised as an important, yet understudied, component in the escalation of symptoms. As such, sleep disturbance could be a transdiagnostic process (Harvey et al., 2011) and has been identified as a research priority in neurodevelopmental conditions (Becker et al., 2019; Heller & Ruby, 2019; Johnson et al., 2018; Smith et al., 2018).
A transdiagnostic approach to developmental science
Co-occurring difficulties are one of the core challenges of the current diagnostic system, further aggravated by the high levels of variability within diagnostic categories (Astle et al., 2019; Kushki et al., 2019). Over 80% of children with ADHD meet the criteria for at least one additional diagnosis (Willcutt & Pennington, 2000). Most studies recruit children with independently diagnosed conditions or difficulties in a single dimension, failing to accommodate the high rates of co-occurrence across conditions (Coghill & Sonuga-Barke, 2012; Kessler et al., 2006; Kotov et al., 2017) and heterogeneity within conditions (Duinmeijer et al., 2012; Germanò et al., 2010; Rommelse et al., 2011). Moreover, this selective approach does not capture the majority of struggling learners who present complex and co-occurring difficulties, yet do not receive a formal diagnosis. Prevalence rates of ADHD, autism and learning disorders range from 2% to 10% (Norbury et al., 2016; Sayal et al., 2018; Tromans et al., 2018; Vahia, 2013), however, the number of children who struggle at school is far higher. In the United Kingdom, around 30% of the school population fail to achieve the expected targets in maths, reading or writing by age 11 (Department of Education, 2022). This has led to widespread recognition of the limitations of the diagnostic frameworks, with many advocating for a shift towards transdiagnostic methods in the study of neurodevelopmental conditions (Astle et al., 2022).
One common transdiagnostic approach is to apply a looser sampling frame, designed to capture complex and co-occurring needs of children experiencing neurodevelopmental difficulties (Mareva et al., 2023). This allows any subsequent inference to extend beyond the confines of any particular diagnostic group. This alternative sampling approach is sometimes combined with a data-driven analytic framework allowing a better understanding of the underlying nature of relationships between symptoms. Network models focus on symptom-level associations, allowing for the possibility that symptoms could interact to activate or causally affect one another (Cramer et al., 2010; Kendler et al., 2011). Unlike traditional correlation tables, which provide an overview of pairwise relationships, the network analysis used here captures relationships between symptoms accounting for the influence of all other symptoms included in the network, allowing for a better understanding of how they might work together to mutually influence one another. This is achieved by plotting symptoms as network nodes connected by edges, whereby the edges represent the partial correlation coefficients summarising the relationship between each pair of nodes after the influence of all other network nodes has been statistically controlled for. The implementation of relationships within a network also allows us to ask questions about the organisation of that network, such as whether certain nodes act as hubs within the network. This is not possible by looking at correlations alone. This framework is particularly suited to explore how sleep relates to many different symptoms simultaneously allowing us to explore which links are direct and which may be due to shared associations with other neurodevelopmental symptoms.
The current study
In the current study we assessed sleep quality using parent-reported measures in a cohort of children and adolescents from the Centre for Attention, Learning and Memory (CALM) (Holmes et al., 2019). CALM is a transdiagnostic cohort including children with and without diagnoses and/or identified difficulties. Our initial aim was to explore the sleep profiles represented within the CALM sample. For this, we employed a clustering algorithm that grouped children based on their sleep quality. This data-driven approach allowed us to explore how many different types of sleep profiles were present in the sample and how the participants were distributed among these groups. The derived subgroups were then compared to explore differences in mean levels of behaviours. Our second goal was to understand the relationship between sleep and other common neurodevelopmental symptoms in a broad transdiagnostic sample by taking advantage of network-based approaches.
Methods
Recruitment
The data were collected as part of the CALM study (between 2014 and 2021), where children with ongoing challenges in attention, learning, memory, or poor school progress were referred by practitioners in clinical or educational services. Some children had diagnoses of neurodevelopmental conditions, others had multiple diagnoses, but the vast majority remained undiagnosed despite having difficulties affecting school progress.
In brief, two groups were recruited, the first, a cohort of children aged 5 to 18 years who were referred by education or healthcare practitioners for difficulties with attention, memory, and/or learning; the second, a smaller open recruitment group of the same age who were not referred for difficulties but attended the same schools as those referred. Children in both groups were recruited irrespective of performance cutoffs or diagnosis, provided they met the following inclusion criteria: (1) native English speaker, (2) no uncorrected sensory impairments, and (3) no confirmed presence of genetic or neurological conditions. Full recruitment details, inclusion criteria, and ethical and testing procedures are outlined in the CALM study protocol (Holmes et al., 2019).
Participants
The sample consisted of 299 children of the overall 992 CALM members, including only participants who had sleep data available, as these measures were only introduced to the testing protocol at a later stage. Eighty-one percent of participants were referred (N = 243) while the other 19% (N = 56) belonged to the open recruitment group. For the purpose of this study, we included all 299 children (Table 1) since we wanted to capture the full breadth of variability present within the cohort. Given the exploratory nature of our study and the use of data-driven methods, we chose to make our sample as inclusive as possible, including diagnosed children, those with identified difficulties, and those without any apparent difficulties. To explore the consequences of the decision to combine the referred and open recruitment groups, we repeated all analyses excluding the latter group (leaving N = 243). The comparisons are reported in the supplementary materials. Overall, no substantial differences were observed in the clustering (Supplemental Table S2) or network analysis (Supplemental Figures S1 and S2). Therefore, only the analyses based on the full sample (N = 299, including both the referred group and the open recruitment) are reported below.
Participant characteristics of sample.

Note. N = 299, ADHD = attention deficit hyperactivity disorder; SLT = speech and language therapy. Education referrers included special educational needs coordinators, educational psychologists, specialist teachers, SLTs, family workers and private tutors. Healthcare referrers included paediatricians, clinical psychologists, child psychiatrists and ADHD nurse practitioners. Some participants presented more than one diagnosis. Percentages are rounded.
The sample (Mage = 9.11 years, SDage = 2.32) contained 197 boys (66%). An elevated proportion of males is consistent with prevalence estimates for different developmental conditions in cohort studies (Russell et al., 2014). Within our sample, the majority of the participants (68%) were undiagnosed, 29% had a single diagnosis and 3% had more than one diagnosis. Among those diagnosed, ADHD was the most common (41, 14%) with a further 7% of children under assessment, followed by 25 autistic children (8%), see Table 1. Participants under speech and language therapy (SLT) received support within 2 years prior to testing. Participant characteristics of our sample were comparable to the full CALM cohort (Supplemental Table S1).
Questionnaire measures
The current analysis is based on the parent ratings of behaviour, mental health, communication and sleep described below. These questionnaires are administered routinely in healthcare and education in the United Kingdom to capture children's natural day-to-day behaviours and communication (further details in supplemental materials).
Conners-3, the Conners Parent Rating Short Form 3rd edition (Conners, 2008) was introduced to measure behavioural difficulties specifically related to ADHD and common comorbidities. Other social and emotional functioning difficulties were assessed by the Strengths and Difficulties Questionnaire (SDQ) (Goodman, 1997). Additionally, communication was assessed using the Children's Communication Checklist 2nd edition (CCC-2) (Bishop, 2003), which focuses on communication problems, language difficulties and identifying communicative profiles characteristic of autism. Finally, sleep measures were collected from the Family History Questionnaire (FHQ), an in-house questionnaire generated by the CALM team (Holmes et al., 2019), which included questions adapted from the Pittsburgh Sleep Quality Index (Buysse et al., 1989). From these, three questions were examined as a baseline measure for sleep: (1) ‘On how many days in the past 30 days has your child had trouble falling asleep?’, (2) ‘On how many days in the past 30 days has your child woken up after their usual amount of sleep feeling tired or worn out?’ and (3) ‘On average, how many hours of sleep does your child get per night?’.
Cognitive and learning assessments
Cognitive and learning assessment data were not included in the main analysis. These assessments were introduced to provide a more comprehensive description of the sleep-dependent subgroups identified in the study. The Peabody Picture Vocabulary Test (Dunn & Dunn, 2007) was administered to measure receptive vocabulary knowledge, along with the Wechsler Individual Achievement Test II (Wechsler, 2005) which examined three main learning domains: Spelling, Reading, and Maths, to measure children's academic abilities (details in supplemental materials).
Analysis plan
The analysis comprised three main steps: (1) sleep profile identification, (2) sleep subgroups comparison and (3) exploratory network estimation. For the first step, we used a clustering method to identify and characterise the distinct sleep profiles present in our sample based on the sleep quality data. Subsequently, the identified subgroups, separated by sleep type, were compared in terms of behaviour, communication, mental health and learning measures. Finally, on a more exploratory basis, a network was estimated to understand the overall associations between sleep and the measured behaviours.
Sleep profile identification
Prior to analysis, missing data were imputed, Z-scored and some measures were log-transformed to address skewness (see supplemental materials). A k-means clustering algorithm was then applied to the FHQ sleep data to identify subgroups of children with similar sleep profiles (Sinaga & Yang, 2020). This data-driven method allowed us to identify how the participants segregated based on their sleep profiles. No a priori assumptions were made about how many sleep subgroups would be derived and the behaviours that may differentiate them. The optimal number of subgroups was selected using the silhouette method, a cluster quality measure which computes a coefficient based on each data point's closeness to the points in neighboring clusters (Rousseeuw, 1987).
Sleep subgroups comparison
Upon identification of the sleep profiles, demographics and diagnostic characteristics compared across the derived subgroups. Subsequently, mean levels of behaviour, communication, mental health and academic performance measures were statistically compared across subgroups. Additionally, clinical cutoff percentages were also calculated, reflecting the proportion of children that, for a specific measure, presented scores outside the bounds of the clinically recommended threshold. The distribution, variance and mean difference of each behavioural subscale were compared. Finally, full and partial correlation matrixes were generated for each subgroup.
Exploratory network estimation
As a final step in the analysis, to explore the interrelationships between sleep and behavioural, communication and mental health measures, a network model was estimated for the full sample. For this network, FHQ sleep scores were included as a single sleep measure generated through principal component analysis (PCA) on all sleep items (Abdi & Williams, 2010). The optimal number of components was determined using parallel analysis on the variance–covariance matrix. A regularised partial correlation network including the Conners-3, CCC-2 and SDQ subscales as well as the FHQ sleep component was estimated for the full sample following the hereunder described procedure.
Most subscales included in the network deviated from normality per Kolmogorov–Smirnov tests, prompting nonparanormal transformation (Liu et al., 2009). This transformation uses cumulative distributions to transform the observed variable into the distribution of the latent normally distributed variable (Epskamp & Fried, 2018; Liu et al., 2009). The network was estimated using the graphical variant of the least absolute shrinkage and selection operator (glasso) (Friedman et al., 2008) to avoid including spurious edges. The best-fitting model was selected based on the Extended Bayesian Information Criterion (Chen & Chen, 2008), which has been reported to accurately retrieve the true network structure (Foygel & Drton, 2010; Janková & Van De Geer, 2018). Finally, centrality strength indices, representing the sum of edge weights (regularised partial correlations) linked to a node, were examined (Epskamp et al., 2018; Epskamp & Fried, 2018). Centrality strength measures the number of connections a node has. Nodes with high centrality are often considered important hubs within the network.
In network models, sample sizes can impact the reliability of results. However, due to the exploratory nature of this analysis, we had no a priori assumptions about which edges would be included or their overall strength, making it challenging to estimate statistical power in advance. Instead, we used bootstrapping to explore the reliability of the estimated network structure and centrality measures (see supplemental materials).
Results
Clustering and subgroup profiles
The K-means clustering algorithm identified two clusters of participants with different sleep profiles (silhouette score for two-cluster solution = 0.62). The optimal solution resulted in a split of 185 (62%) participants in Cluster 1 and 114 (38%) in Cluster 2. There were significant between-group differences in all sleep subscales (p < .001). Specifically, in Cluster 1 the mean number of hours slept per night was approximately 10 and children had trouble falling asleep and/or waking up tired only, on average, 2–3 days a month. While for Cluster 2, children slept approximately less than 8 h a night and had trouble falling asleep and/or waking up tired, on average, over 17 days a month. Given the clear difference in profiles and for ease of interpretation, Cluster 1 is referred to as “regular sleep” and Cluster 2 as “poor sleep” throughout. Age and sex distribution did not differ between clusters, but significant disparities existed in the number of children with diagnoses, diagnosed ones being overrepresented in the poor sleep subgroup (Table 2). Additionally, there was also a statistically significant overrepresentation of the open recruitment participants in the regular sleep subgroup.
Characteristics of each subgroup.
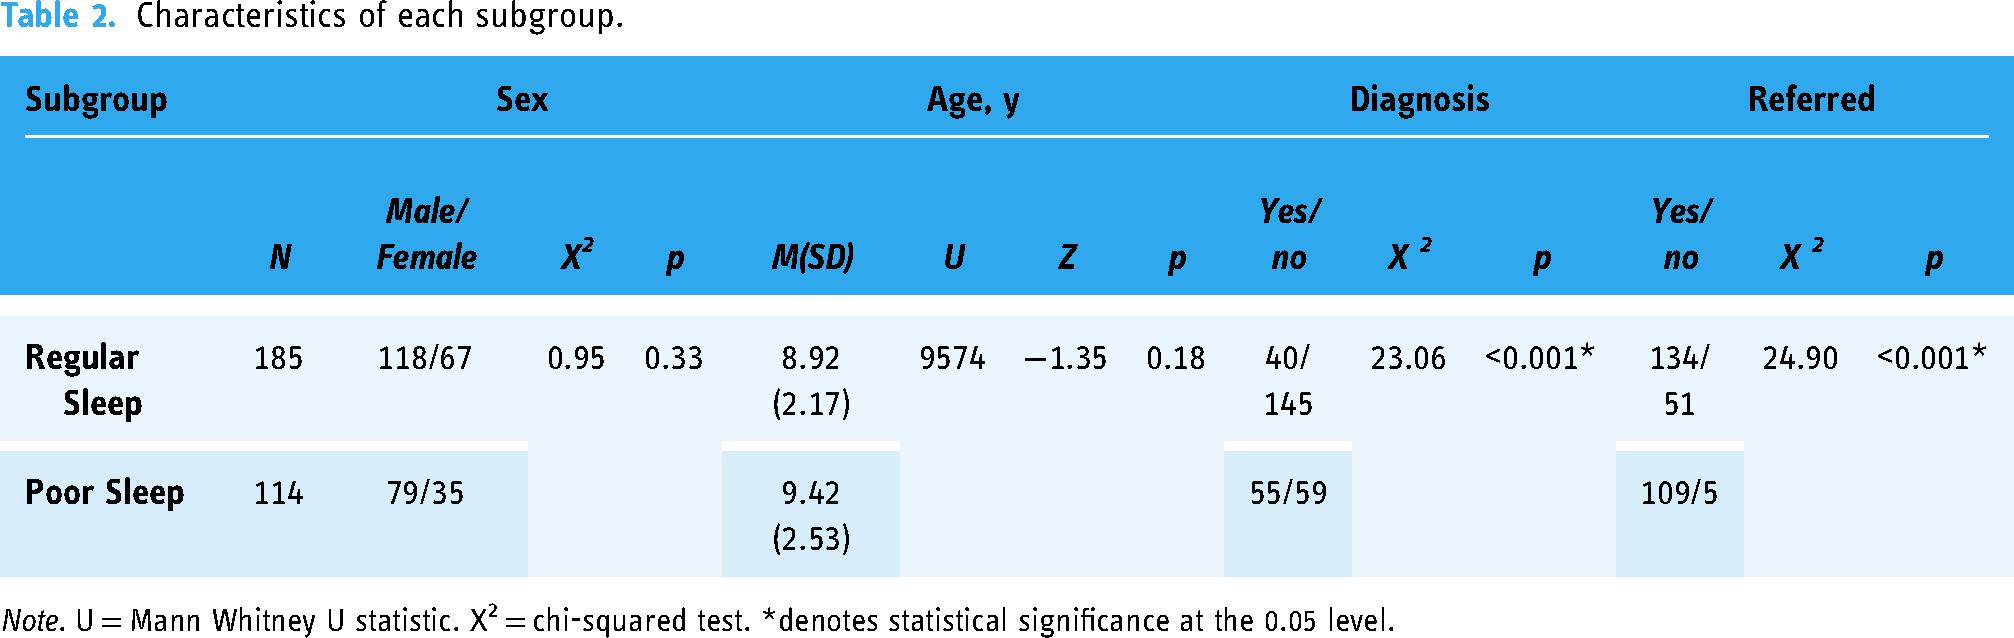
Note. U = Mann Whitney U statistic. X2 = chi-squared test. *denotes statistical significance at the 0.05 level.
Comparison of sleep subgroups
Summary statistics were calculated on behaviour, communication, mental health and learning measures for each subgroup. Additionally, the prevalence of scores within the clinical cutoff range was calculated, quantifying the number of children who scored outside the bounds of the clinically recommended threshold for that assessment (Table 3). Both subgroups presented varied results in this measure, however, direct comparison between subgroups showed a higher number of children within the poor sleep subgroup scoring within the clinical cutoff range. All subscales presented around a 1.5 to 2.5-fold increase in the percentage of children within the clinical range in the poor sleep subgroup when compared to the regular sleep subgroup. Pearson correlations and respective significances (p-values) for both subgroups were calculated in Supplemental Figure S3.
Summary statistics and clinical range prevalence for all measures.

Note. Raw scores are shown for SDQ. Standardised T-scores are shown for Conners-3, CCC-2 and learning measures. For Conners-3 and SDQ emotion, higher values indicate more difficulties. For CCC-2, learning measures and SDQ prosocial, lower values indicate greater difficulties. Clinical range levels (% clinical cutoff) were determined based on specific criteria: T-scores ≥ 70 for Conners-3 (Conners, 2008); T-scores 2 SD below assessment mean for CCC-2 composite scores (Bishop, 2003); raw scores ≥ 5 for SDQ emotion and ≤ 4 for SDQ prosocial behaviour (Goodman, 1997) and T-scores ≤ 70 for cognitive and learning measures (Dunn & Dunn, 2007; Wechsler, 2005). Percentages are rounded. SDQ = Strengths and Difficulties Questionnaire; CCC-2 = Children's Communication Checklist 2nd edition.
The derived subgroups were compared on behaviour, communication, mental health and learning measures through statistical testing to examine group differences. Wilcoxon Rank Sum tests (see supplemental materials) revealed strong significant differences between the two subgroups in all Conners-3, CCC-2, and SDQ subscales (p < 0.001) and showed a significant difference at the 0.05 level for the learning measures (Table 4). Notably, structural language, emotion and peer relations showed the largest effect sizes in difference between the two subgroups (0.43, 0.40, 0.39, respectively).
Between-group comparisons on all measures.

Note. RS = regular sleep; PS = poor sleep; Diff. = difference in variances; SDQ = Strengths and Difficulties Questionnaire; CCC-2 = Children's Communication Checklist 2nd edition.
Normality was assessed with Kolmogorov–Smirnov tests and variance with Levene's tests. The mean difference was examined with non-parametric Wilcoxon Rank sum tests, with Bonferroni correction for variables with unequal variance.
*denotes statistical significance at the 0.05 level.
Exploratory network analysis
To further explore the role of sleep in our cohort and the associations between sleep and behavioural, communication and mental health measures, a regularised partial correlation network of the full sample was estimated for all measures, Conners-3, CCC-2, SDQ, and FHQ (Figure 1). To include sleep as a single node, all FHQ subscales were reduced to a sole measure through PCA (Abdi & Williams, 2010), extracting a single sleep factor, with 64% of variance explained.

Regularised partial correlation network across behavioural, communication, mental health and sleep measures for the full sample. Thicker edges represent stronger associations. Red edges reflect negative correlations and blue edges reflect positive correlations.
The estimated network comprised 11 nodes, with a mean edge weight (mean of all associations between behaviours) of 0.063. This result indicates a moderate level of association between the measures within the network, suggesting a somewhat distributed or moderately interconnected network structure (Van Borkulo et al., 2023). The network also presented a 60% network density, meaning 33 out of 55 possible connections between nodes are actually observed. This indicates a relatively high density, suggesting a more interconnected network where many variables are directly or indirectly related to each other, demonstrating complex relationships among the measures studied. In this full sample network, sleep established multiple direct links with other measures, namely aggression, inattention, hyperactivity/impulsivity, executive function, structural language, peer relations and emotion, the latter having the highest positive correlation with sleep (Figure 1).
Strength centrality indices quantify the inter-connectedness of each node, examining the importance of nodes within the network (Epskamp et al., 2018). In Figure 2, we can observe that structural language presented with the overall highest strength followed by executive function. Stability analyses for the full sample network indicated the network was estimated with good accuracy and the stability of edge weights was small to moderate, suggesting acceptable stability (Supplemental Figure S8). Further exploratory network analyses were conducted by estimating individual networks for each sleep subgroup following the same procedures described above, these can be found in the supplements (Supplemental Figure S4) along with associated centrality measures (Supplemental Figure S5) and stability analyses (Supplemental Figures S6 and S7).

Strength centrality index for the full sample network. Standardised Z-score values are shown on the x-axis. Larger scores indicate greater centrality.
Discussion
The present study assessed the association between sleep quality and difficulties in behaviour, communication and mental health in a diverse transdiagnostic sample, striving for a broader exploration of the relationship between sleep problems and neurodevelopmental symptoms in a heterogeneous sample of children with complex and co-occurring difficulties.
Two subgroups of sleepers
The data-driven clustering method identified two subgroups of children with distinct sleep profiles, with a strong silhouette score, showing these subgroups were well separated. Using a clustering algorithm, no a priori assumptions about how many clusters (sleep profiles) were needed or would be inferred (Bathelt et al., 2018; Sinaga & Yang, 2020). Upon analysis of each subgroup's sleep measures, one group presented a regular sleep quality while the other had poor sleep quality, including an average of hours of sleep per night below the recommendations for youngsters (Hirshkowitz et al., 2015). No known characteristics, like age, sex or referral route, were predictive of the sleep profiles.
The subgroups did show a significant difference in the distribution of diagnoses. The poor sleep subgroup showed an overrepresentation of children with diagnoses of ADHD, autism and learning difficulties. This is perhaps unsurprising, given that poor sleep quality is commonly reported in these neurodevelopmental conditions (Becker et al., 2019; Heller & Ruby, 2019; Johnson et al., 2018). However, neither subgroup aligned with the diagnostic features of a specific condition, and diagnosed children were present in both subgroups, although in different proportions. This suggests that, although sleep is associated with these conditions, it is not specifically linked with any established diagnostic entity, supporting the growing transdiagnostic impetus within neurodevelopment research and further establishing sleep difficulties as a transdiagnostic risk factor (Harvey et al., 2011).
Between-group comparison of children's behaviour, communication and mental health showed clear and statistically significant differences. Children with poorer sleep experience more difficulties in all domains (Astill et al., 2012; Calhoun et al., 2012; Quach et al., 2018; Reynaud et al., 2018; Vriend et al., 2015). In our sample, almost double the children with sleep problems presented scores within the clinical range (a reference range used in diagnosis). Particularly, vocabulary and structural language presented the largest discrepancy between the two subgroups with children in the poor sleep subgroup clearly demonstrating higher difficulties in these areas.
Notably, the same pattern of differences emerged when looking at the cognitive and learning measures, which were assessed directly by the participants and not provided by parents. Both assessed learning outcomes and parent ratings ran in the same direction and presented equivalent percentages of children within the clinical range. This further validates the distinction between the derived subgroups, demonstrating that the difficulties reported by parents are concurrent with other learning difficulties and providing robustness to the behavioural questionnaire data used. Nonetheless, we do not know that sleep plays a causal role in these associations. With these data alone, we cannot distinguish the possibility that poor sleep directly exacerbates other symptoms, or is itself just one of many symptoms experienced by these children.
Exploratory network
A network was estimated to explore the associations between sleep, behaviour, communication and mental health measures. This network, including the full sample, presented good overall stability, which allowed an accurate interpretation and understanding of the associations between behaviours. Additionally, it enabled us to assess the importance of sleep and its relationship with other behaviours, as well as how these behaviours are associated with one another. Network centrality indices suggested structural language and executive function as key features associated with multiple other symptoms. This is in line with our finding that vocabulary and structural language also showed the biggest differences in terms of children within the clinical cutoff range. Both these notions are consistent with a wider literature (Cortese et al. 2013; Ketelaars et al., 2010; Leonard et al., 2011; Norbury et al., 2016) in which language, communication and executive function are important characteristics, that can shape many clinical outcomes.
Emotional symptoms appeared to be a low-impact measure as well as prosocial behaviour, however, the node with the lowest centrality across all indices was sleep. Although not presenting with high strength centrality, sleep was still directly connected to numerous behaviours across the network. The observation that sleep does not exhibit high centrality within the network should be interpreted with caution. Network strength centrality is inherently relative, quantifying how strong the edge weights of a given node are relative to the other nodes in the network. Specifically, the lower centrality of sleep within the network does not necessarily mean that sleep is unimportant. Rather it suggests that relative to the relationships among the various behavioural difficulties, sleep's association with these behaviours is somewhat weaker.
It is noteworthy, however, that sleep maintains direct connections with numerous nodes in the network, implying its potential to both influence and be influenced by various behavioural difficulties. This demonstrates that several distinct impactful behaviours appear to vary in line with sleep quality. Behaviours such as aggression, impulsivity, hyperactivity and inattention appeared to be all weakly but directly associated with sleep quality. Sleep had the strongest relationship with emotion, underscoring a direct relationship between sleep and mental health. Sleep further showed prominent associations with structural language and executive function, suggesting key associations between sleep quality and these behaviours, which is in line with our clustering results. Observing that sleep is directly related to many different behavioural difficulties supports previous literature suggesting its clinical relevance and potential as a key target in transdiagnostic interventions (Harvey et al., 2011; Heller & Ruby, 2019; Johnson et al., 2018).
Limitations
Some limitations should be considered with our findings. Firstly, the CALM cohort, while diverse, had limited sleep data available for children, potentially limiting our ability to detect smaller group differences due to insufficient power. A larger sample size is recommended in future studies, particularly if applying network analysis, as it would enhance stability even more and increase the power to identify subtler yet potentially significant differences. Secondly, the age range and the cross-sectional nature of the CALM cohort prevented us from understanding age-specific associations and establishing the development continuity of these relationships.
Another caveat is the reliance on parent-reported measures in our study, which is prone to subjective bias (Kagan et al., 2003). However, some validity to the parent ratings was provided by the same differences being observed in learning outcomes. Future studies should strive for more precise measures of behaviour and communication, taken by multiple observers where feasible for increased accuracy. Additionally, sleep profiles were generated based only on three questions about sleep quality from a single questionnaire. Literature on sleep presents an inherent problem with the validity of subjective sleep measures such as self/parent-reported questionnaires compared to objective measures (e.g., actigraphy or polysomnography) (Matricciani, 2013). While objective quantifiers are generally considered higher quality, these are costly and challenging to employ. However, Landry et al. (2015) suggested that despite drawbacks, subjective measures capture complementary aspects of sleep quality overlooked by objective measures. Therefore, to achieve a better overview of sleep quality, it would be recommended in future studies to include broader assessments of sleep, ideally incorporating both subjective and objective measures.
Despite these limitations, the current study showed the value and benefits offered by combining data-driven and network-based approaches with a transdiagnostic sample. This method allowed us to simultaneously study how sleep relates to multiple neurodevelopmental difficulties, which is key for understanding its role as a potential transdiagnostic process beyond its relevance to specific outcomes and/or neurodevelopmental conditions.
Conclusion
In this study, data-driven subgrouping identified two groups with distinct sleep profiles. The identified subgroups provided further evidence of the co-occurrence of sleep problems in neurodevelopmental conditions. Struggling learners with sleep problems presented intensified difficulties in several areas of behaviour, communication, mental health and learning outcomes. The between-group comparison suggested stronger overall difficulties among poor sleepers, especially regarding vocabulary and structural language. We combined this with an exploratory network approach to better understand the associations between these difficulties. Here, structural language skills again appeared as a key feature in the network, in line with previous literature suggesting language and communication as important features, that can severely influence or be influenced by changes in other behaviours. Additionally, sleep had its strongest relationship with emotional symptoms, consistent with the broader literature suggesting a close link between sleep quality and mental health. This study demonstrates the value of data-driven clustering combined with network approaches to understand complex and co-occurring difficulties across neurodevelopmental conditions.
Supplemental Material
sj-docx-1-ndy-10.1177_27546330241255119 - Supplemental material for Sleeping soundly? Testing the links between sleep quality and neurodevelopmental characteristics
Supplemental material, sj-docx-1-ndy-10.1177_27546330241255119 for Sleeping soundly? Testing the links between sleep quality and neurodevelopmental characteristics by Madalena V. Bettencourt, Silvana Mareva, and Duncan E. Astle in Neurodiversity
Footnotes
Acknowledgements
We would like to thank all the members of the CALM Team for their help with recruitment, data collection and management, including lead investigators Duncan Astle, Kate Baker, Susan Gathercole, Joni Holmes, Rogier Kievit and Tom Manly. As well as the team of researchers and PhD students that includes Danyal Akarca, Joe Bathelt, Marc Bennett, Madalena Bettencourt, Giacomo Bignardi, Sarah Bishop, Erica Bottacin, Lara Bridge, Diandra Brkic, Annie Bryant, Sally Butterfield, Elizabeth Byrne, Gemma Crickmore, Edwin Dalmaijer, Fánchea Daly, Tina Emery, Laura Forde, Grace Franckel, Delia Furhmann, Andrew Gadie, Sara Gharooni, Jacalyn Guy, Erin Hawkins, Rebeca Ianov-Vitanov, Christian Iordanov, Agnieszka Jaroslawska, Sara Joeghan, Amy Johnson, Jonathan Jones, Silvana Mareva, Jessica Martin, Elise Ng-Cordell, Sinead O’Brien, Cliodhna O’Leary, Joseph Rennie, Andrea Santangelo, Ivan Simpson-Kent, Roma Siugzdaite, Tess Smith, Stepheni Uh, Maria Vedechkina, Francesca Woolgar, Natalia Zdorovtsova, Mengya Zhang. Ethical approval for this study was provided by the UK's National Health Service Research Ethics Committee (REC approval: 13/EE/0157).
Declaration of conflicting interests
The authors declared no potential conflicts of interest with respect to the research, authorship, and/or publication of this article.
Funding
The CALM research clinic is based at and supported by funding from the MRC Cognition and Brain Sciences Unit, University of Cambridge (Grant No. MC-A0606-5PQ41).
Data availability statement
Supplemental material
Supplemental material for this article is available online.
References
Supplementary Material
Please find the following supplemental material available below.
For Open Access articles published under a Creative Commons License, all supplemental material carries the same license as the article it is associated with.
For non-Open Access articles published, all supplemental material carries a non-exclusive license, and permission requests for re-use of supplemental material or any part of supplemental material shall be sent directly to the copyright owner as specified in the copyright notice associated with the article.