
Abstract
Ecosystem services (ES) and basic public services (BPS) are two pillars that support human well-being. However, previous research has paid insufficient attention to their coupling characteristics during urbanization process, making it difficult to effectively guide the coordinated socio-ecological development of cities. With the Yangtze River Delta (YRD) as a case study, this research employed the root mean square deviation (RMSD) approach to quantify the evolution of ES-BPS trade-off intensity from 2000 to 2020, and explored influencing mechanisms of urbanization process (population growth, economic development, and urban expansion) on the trade-off intensity using geographically weighted regression. Our analysis revealed that out of 26 cities, 15 showed an increase in their comprehensive ES, while 17 exhibited an increase in their comprehensive BPS. The ES-BPS trade-off intensity was relatively high in southwestern Anhui and Shanghai, while relatively low in Jiangsu. During the study period, nearly 50% of cities’ trade-off intensity increased, 42% decreased, and 8% stayed essentially stable. Different urbanization factors exerted varying influence on the ES-BPS trade-off. Population growth mitigated trade-off intensity in approximately 90% of cities, whereas economic development exacerbated it in about 80% of cities. The impact of urban expansion exhibited regional divergence, with the western regions experiencing mitigation and the eastern regions facing intensification. This study revealed the mechanism by which urbanization influences the ES-BPS trade-off, providing a robust scientific basis for promoting socio-ecological synergistic development across the YRD.
Keywords
Introduction
With the accelerated pace of urbanization, the quality of human life has been gradually improved, and the demand for ecosystem services (ES) and basic public services (BPS) has become increasingly intense. ES are the natural environmental circumstances and processes supplied by ecosystems that underpin human existence and development (Costanza et al., 1997), which were categorized into four types: provisioning services, regulating services, supporting services, and cultural services (MEA, 2005). BPS are defined as equitable, universally accessible fundamental safeguards and public goods delivered by governments to safeguard the basic rights of citizens to survival and development (Zhao et al., 2022), which include education, healthcare, social security, cultural amenities, and public infrastructure (Li et al., 2022a; Ocampo et al., 2019). In the rapid urbanization process, ES and BPS often exhibit a pronounced functional trade-off relationship (Li et al., 2024a), where the enhancement of one may lead to the degradation of the other. To enhance the level of the BPS, it is necessary to convert ecological land into construction land. Although this process improves the level of BPS in the short term, it directly weakens the supply and regulatory functions of ES (Li et al., 2025). Meanwhile, ecological spaces designated to enhance ES—such as establishing ecological conservation areas and developing urban green space systems—may constrain the flexibility and coverage efficiency of public service facility layouts, thereby impacting the accessibility and equity of BPS (Wang et al., 2025). In the absence of scientific coordination, the trade-off between ES and BPS is likely to compromise one at the expense of the other. It may weaken the ecological foundation of urban development through environmental degradation or undermine public welfare through inadequate service delivery, ultimately impeding the realization of sustainable development goals.
Extensive research on ES and BPS has been conducted by scholars both domestically and internationally. In the field of ES, numerous studies have focused on assessing the physical quantity of ES (Schwartz et al.,2022; Wu et al., 2013), the trade-off/synergy among ES (Feng et al., 2021; Lee and Lautenbach, 2016), and ES flows (Bagstad et al., 2013; Li et al., 2022b), forming a relatively mature analytical framework (Cord et al., 2017). Regarding BPS, current research primarily focus on topics such as service accessibility and spatial equity (Jang et al., 2017; Logan et al., 2019). However, previous research still predominantly adopted a single perspective, either ES or BPS, and rarely employed a socio-ecological coupling or systemic approach to quantitatively assess the ES-BPS relationship (Cao et al., 2025; Peng et al., 2015). This research gap limits a comprehensive understanding of the interconnections among multidimensional human well-being needs within urban environments from a coupled socio-ecosystem perspective. Therefore, it is essential to conduct a systematic assessment of ES and BPS, as well as their potential trade-offs.
Urbanization serves as the core driving force reshaping the structure and functions of socio-ecological systems, profoundly influencing the ES-BPS interrelationship (Chen et al., 2015; Zhang et al., 2017). The extension of built-up land during the urbanization process directly leads to a decline in the total volume of ES. For example, Xue et al. (2025) found that rapid urbanization poses significant challenges to food security and water quality safety in the Yangtze River Delta; Liu et al. (2024) revealed that the comprehensive urbanization process has resulted in a decline in ES supply and an increase in ES demand across Shaanxi Province. Meanwhile, rapid urbanization has intensified demand for BPS and exacerbated their uneven spatial distribution. For instance, Fan et al. (2022) and Xu et al. (2022) revealed that urbanization, characterized by population growth and urban expansion, leads to imbalanced distribution of BPS, thereby triggering social inequality. It has been found that different urbanization factors, including population growth, economic development and urban expansion, varied in their influence on ES and BPS (Peng et al., 2017).
The Yangtze River Delta (YRD) is a hub of urbanization and economic development in China, yet it also faces significant challenges stemming from the tension between population growth and land resources. Within the constraints of limited spatial resources, this region faces the dual demands of maintaining and enhancing ES while meeting the growing societal need for high-quality BPS. During rapid urbanization process, conflicts between ES and BPS have intensified in areas such as land use allocation, resource optimization and spatial layout planning. The lack of coordination between these two elements has become a major obstacle to regional sustainable development. Given this, this paper took the YRD as study area, quantifying the spato-temporal evolution of ES and BPS during 2000-2020. Subsequently, the Root-Mean-Square Deviation (RMSD) method was employed to illustrate the ES-BPS trade-off intensity. Finally, a geographically weighted regression (GWR) approach was employed to systematically deconstruct the differentiated impacts of multidimensional urbanization factors (population growth, economic development, and urban expansion) regarding the ES-BPS trade-off. This study primarily addressed the following questions: (1) How has the association between ES and BPS evolved in the YRD? (2) How have population growth, economic development, and urban expansion influenced this relationship throughout the urbanization process?
Data and methods
Study area
In this study, the YRD region is defined according to the boundary specified in the “Development Plan for the Yangtze River Delta Urban Agglomeration”, which was ratified by the State Council in May 2016, covering 26 cities such as Shanghai, Hangzhou, Nanjing and Hefei (Figure 1). The region is characterized by an intricate network of rivers and lakes, where ecologically sensitive areas are intertwined with densely developed zones. The permanent resident population increased from approximately 110 million to over 240 million between 2000 and 2020, increasing by 3.8% per year. GDP soared from less than 2 trillion yuan to over 29 trillion yuan, and its economic density ranks among the highest nationwide. With the rapid agglomeration of economic activities and population, the area of construction land has expanded from approximately 22,000 square kilometers to 52,000 square kilometers (Yao et al., 2025). During the urbanization process, the YRD has seen continuous improvements in urban infrastructure, yet this progress has been accompanied by ecological challenges, such as water quality degradation and biodiversity loss (Li et al., 2024b). Consequently, the tension between social welfare and ecological well-being has become increasingly prominent. Therefore, exploring the evolution of the ES-BPS association in the YRD and its urbanization-driven mechanisms can lay a scientific basis for sustainable development in the YRD.
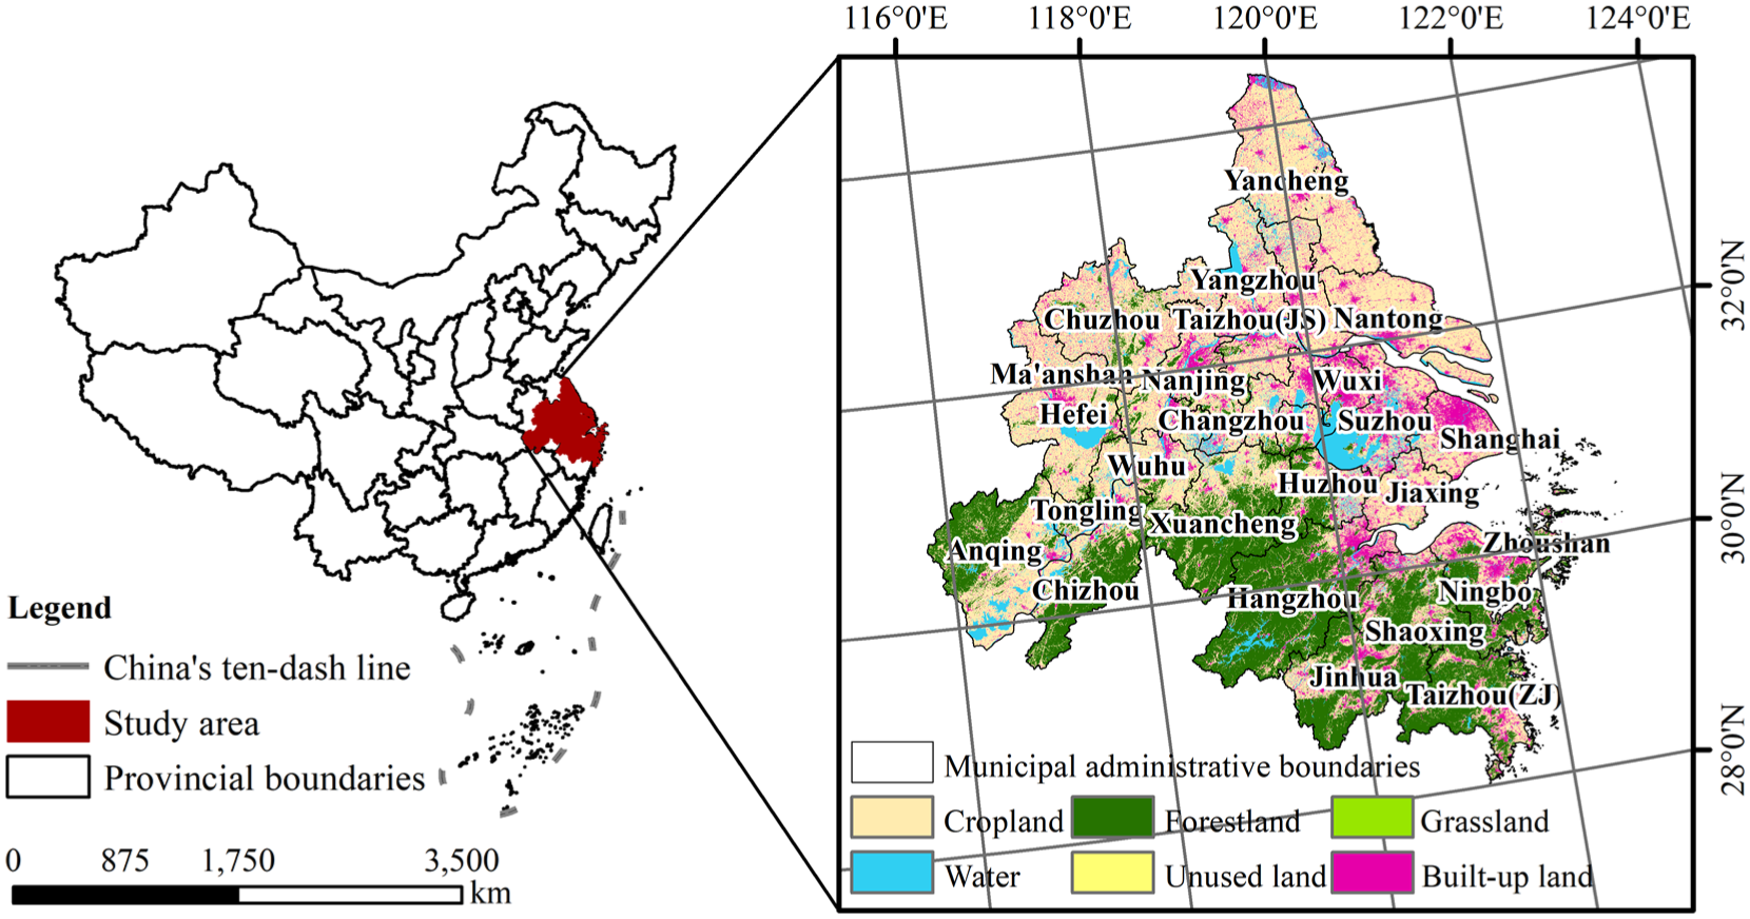
Overview map of the study area.
Data sources
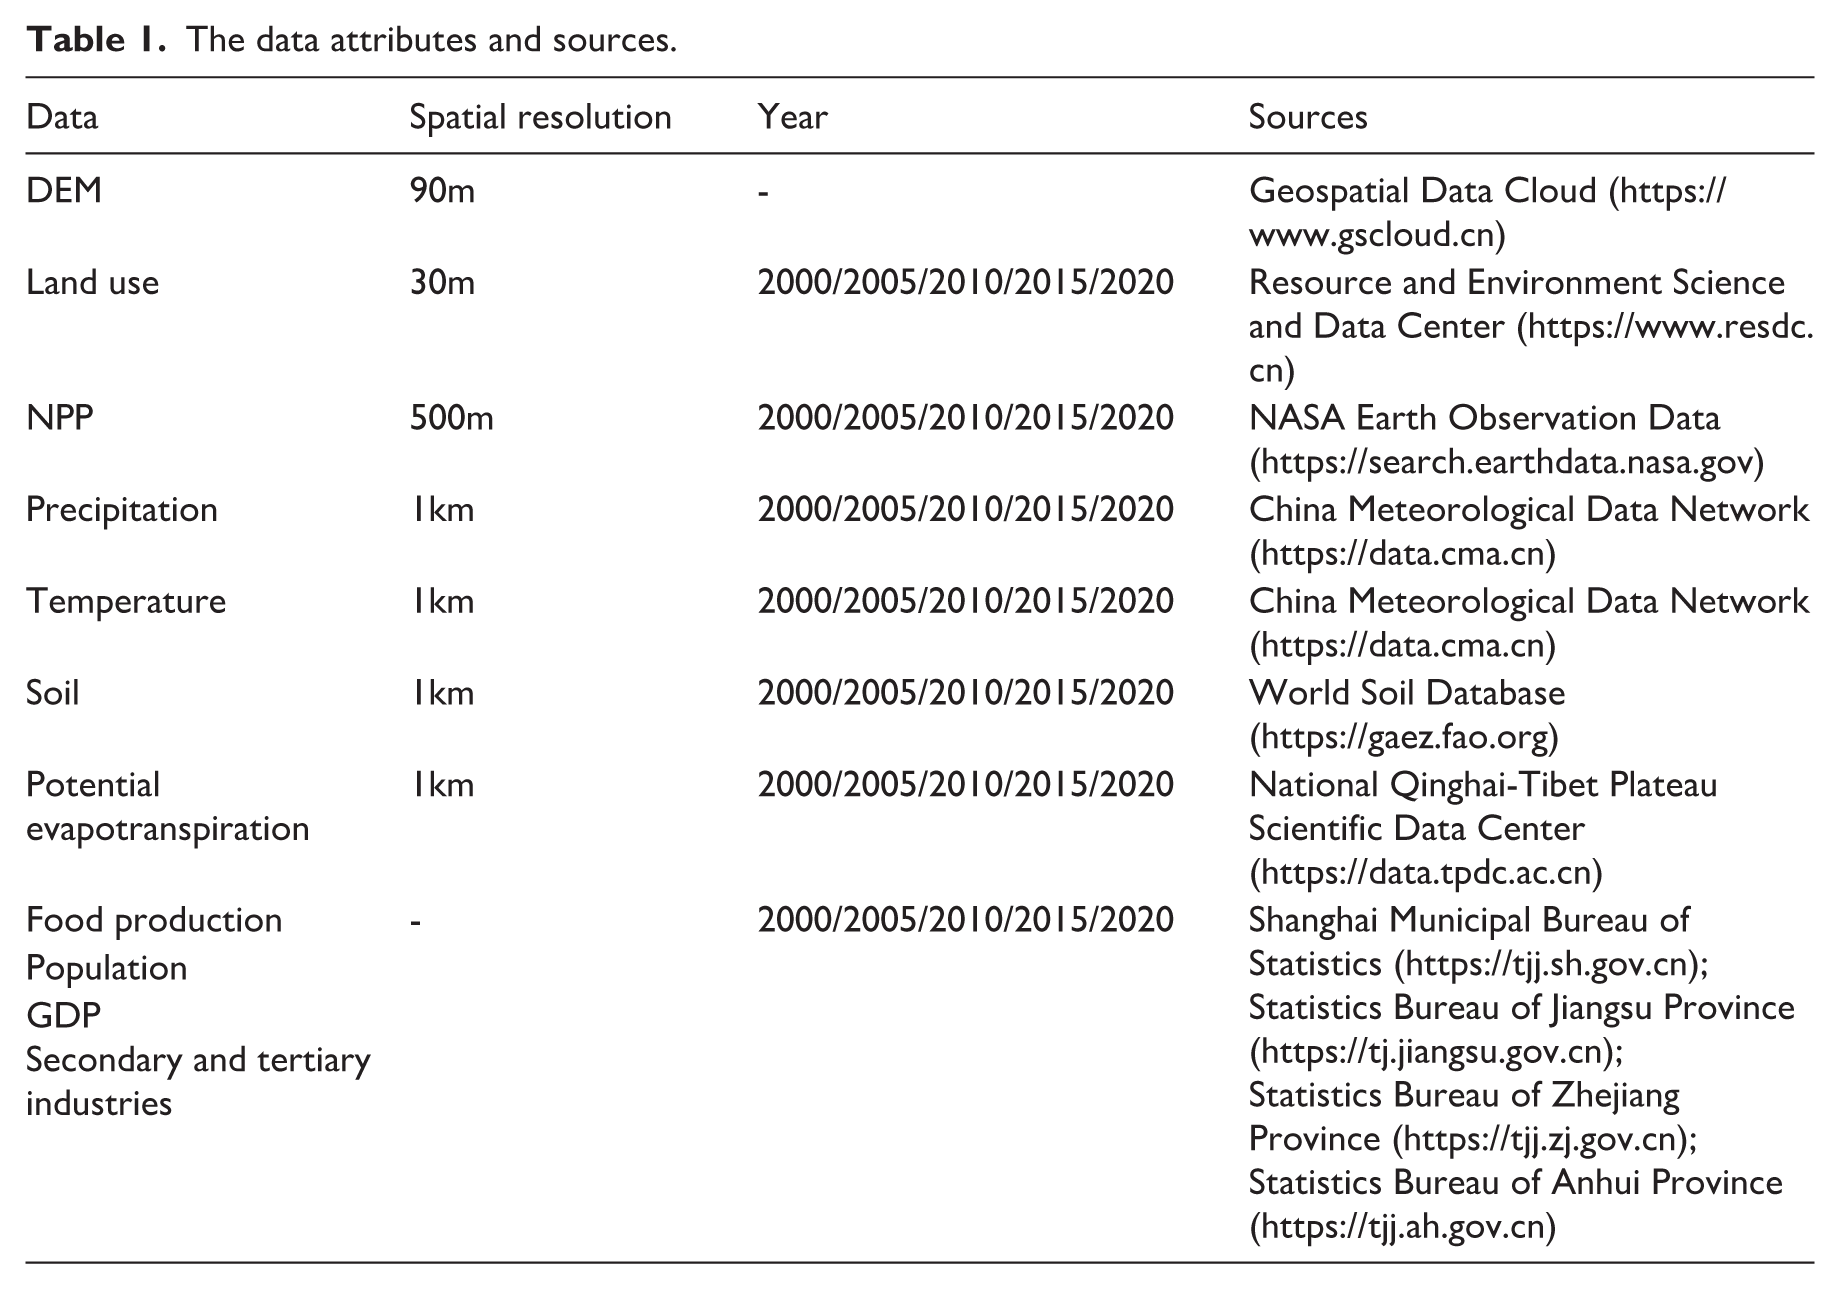
The data employed in this research primarily included digital elevation model (DEM) data, land use data, net primary productivity (NPP), precipitation, air temperature, soil properties, evapotranspiration and socio-economic data. All data were standardized to a 30m×30m spatial resolution through resampling, and aggregated to the municipal administrative unit. Detailed information is provided in Table 1.
The data attributes and sources.
Methods
The analytical framework of this study involved the following sequential steps (Figure 2): (1) Quantitative assessment was conducted of six ES and of four BPS, followed by an analysis of their spatio-temporal evolution from 2000 to 2020; (2) RMSD was applied to explore the ES-BPS trade-off intensity; (3) GWR model was employed to analyze the differential impacts and spatial heterogeneity of multidimensional urbanization factors (population growth, economic development, urban expansion) on the ES–BPS trade-off intensity.
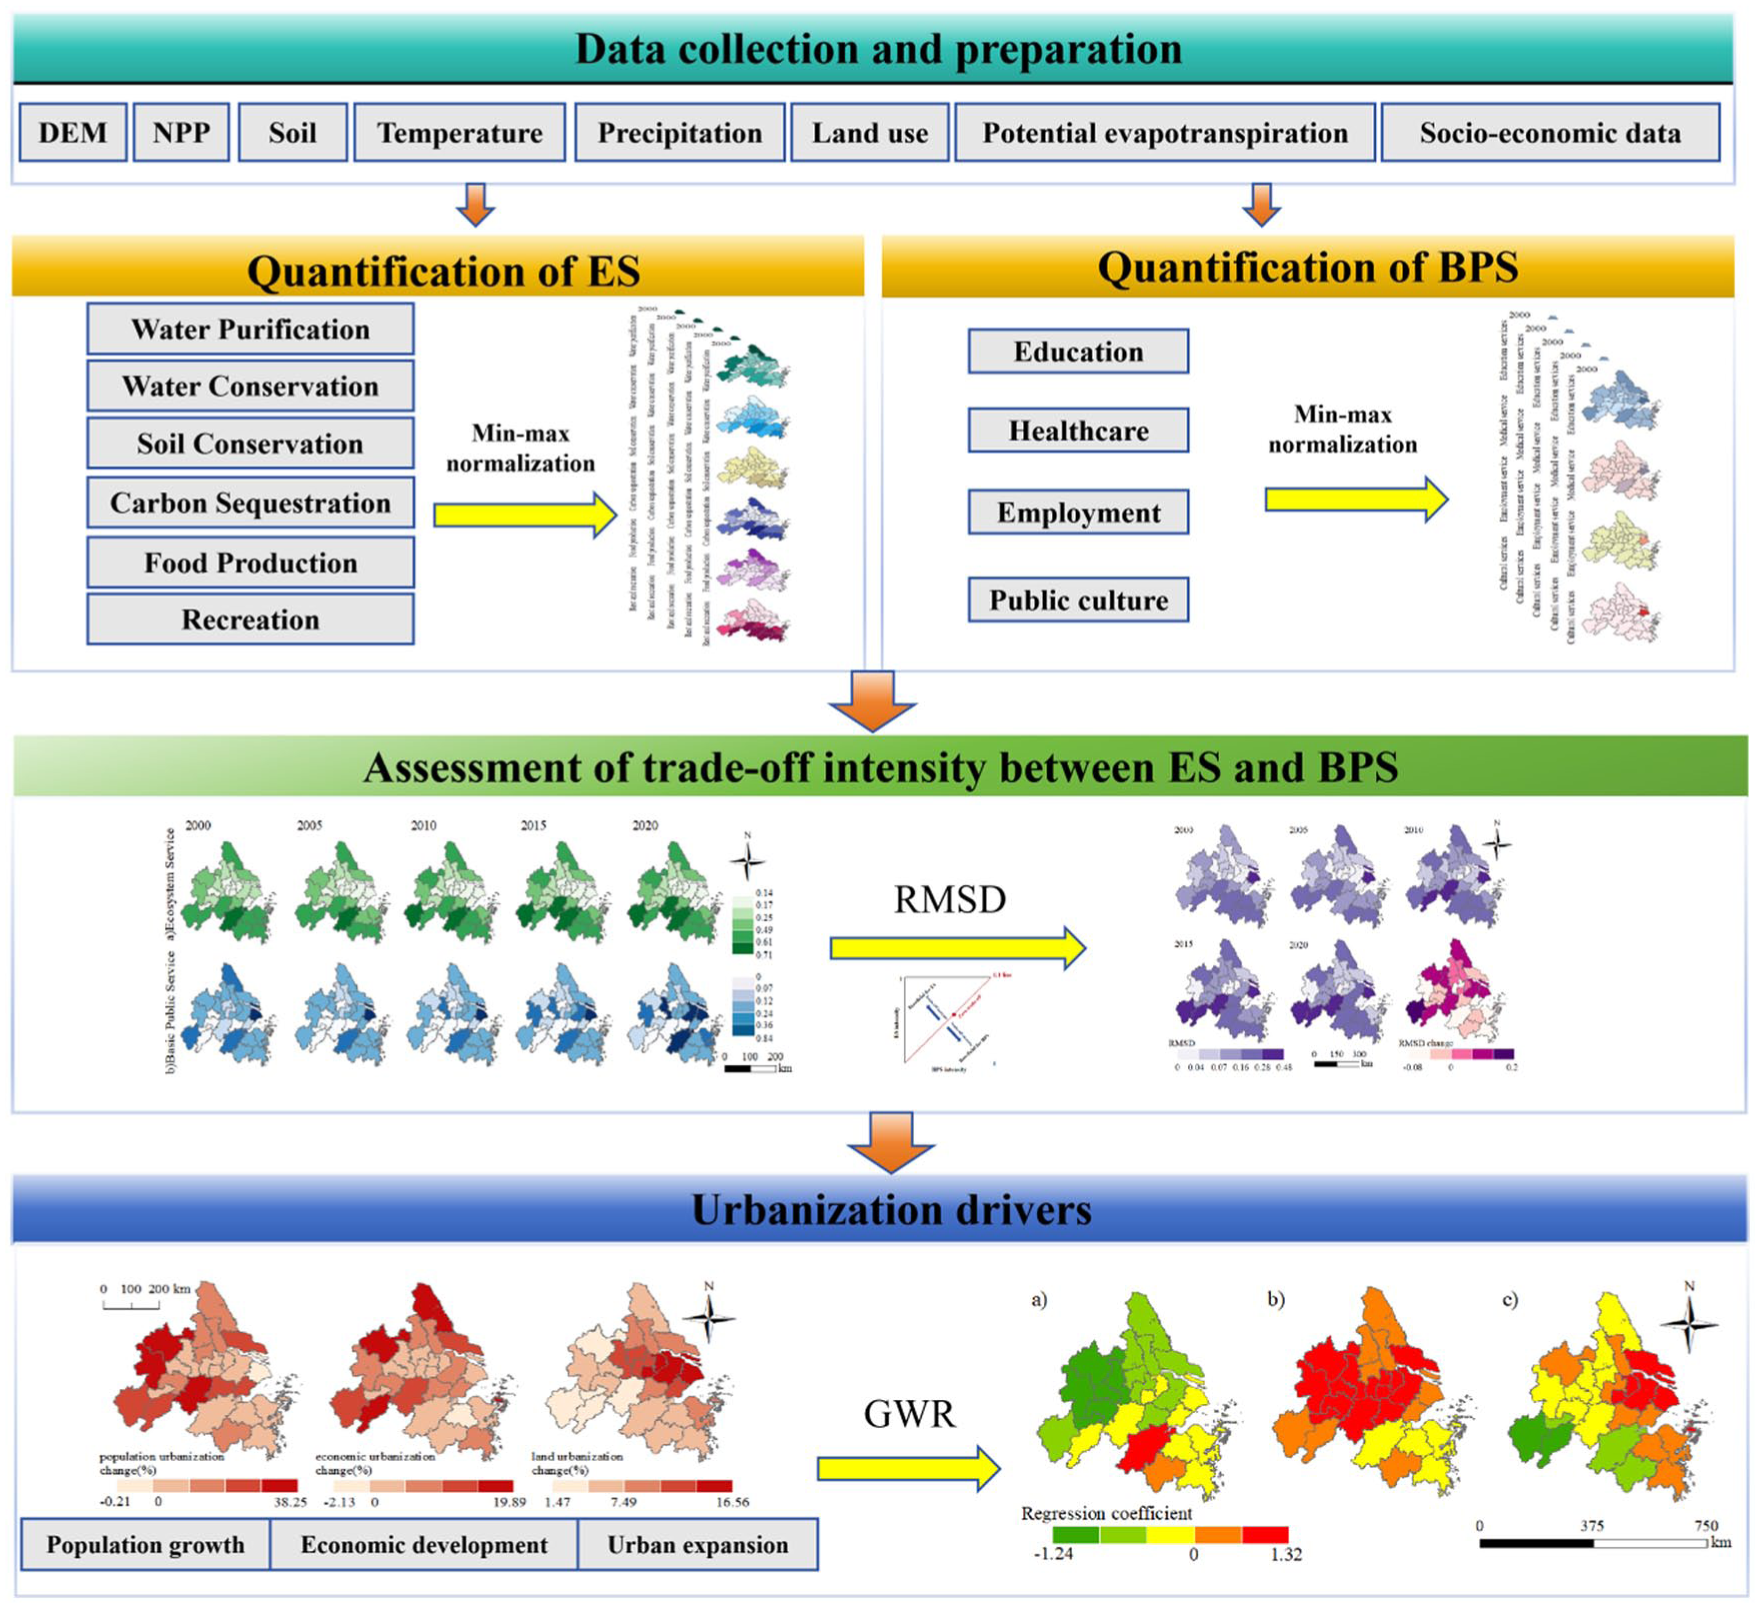
Framework of this study.
Quantification of ES
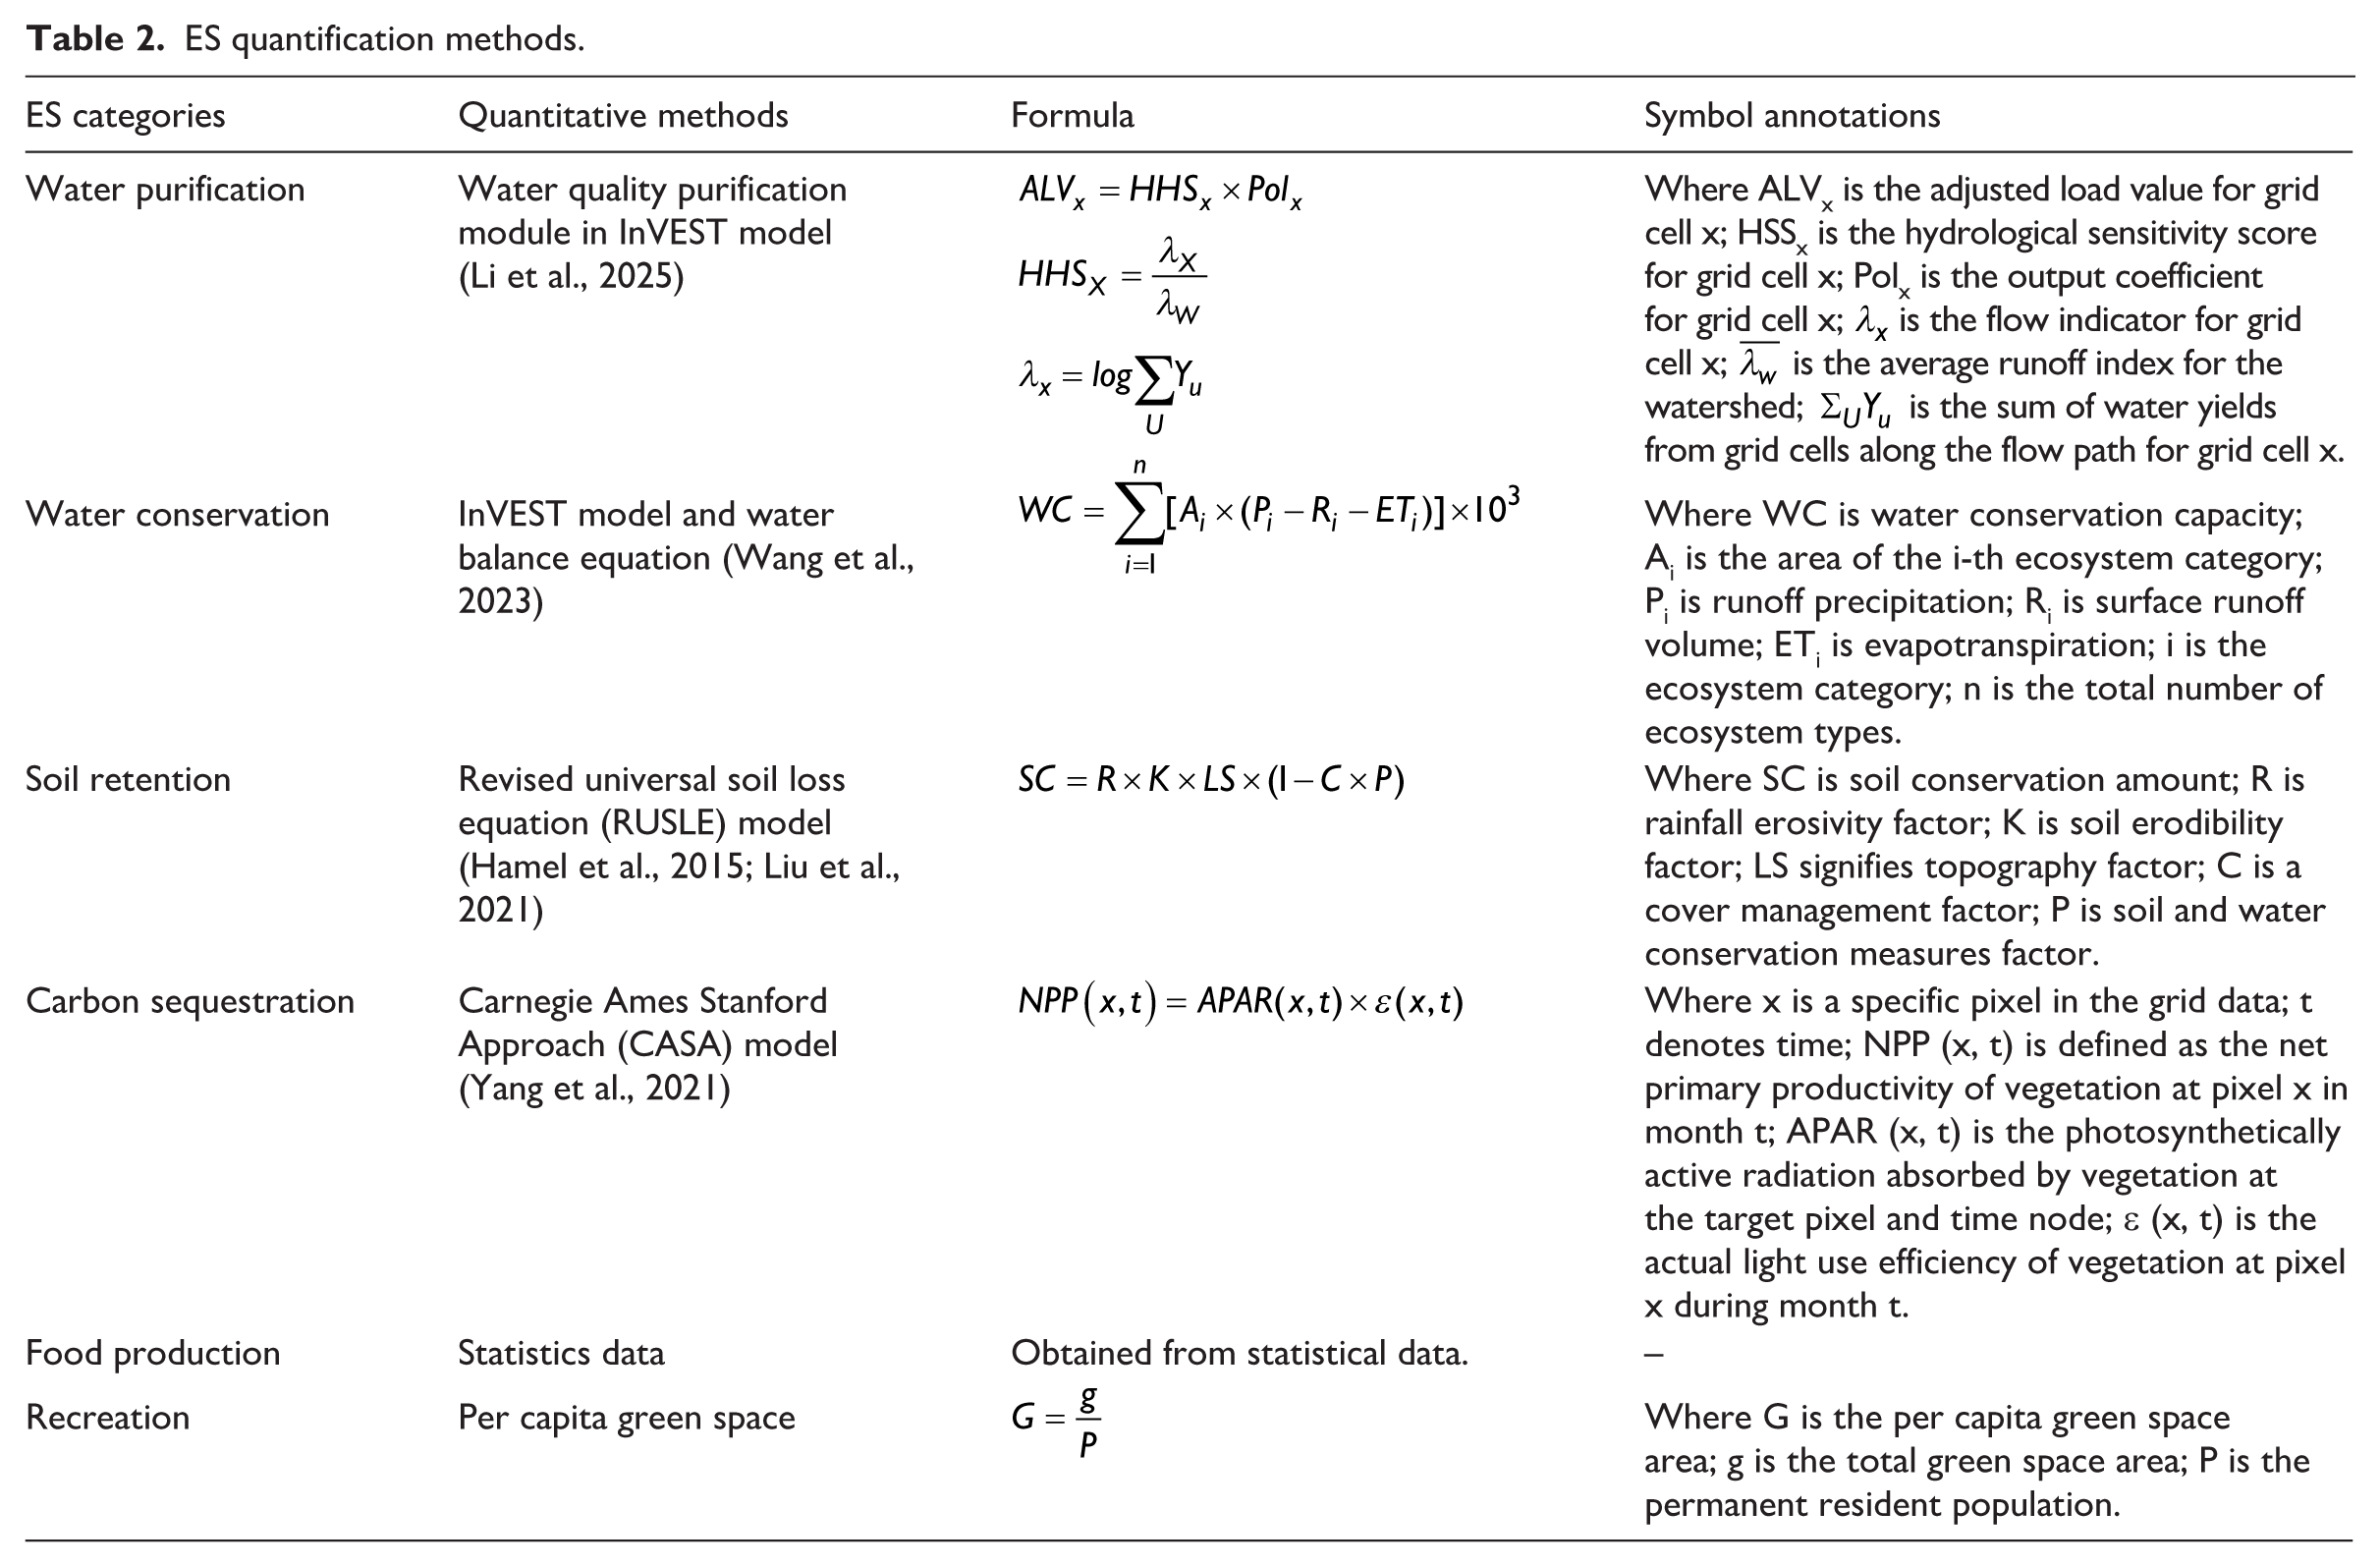
This research selected six ES, including water purification, water conservation, soil retention, food production, carbon sequestration and recreation, for quantitative assessment. The above selections aimed to systematically cover key categories such as regulation, provisioning and cultural services, thereby comprehensively reflecting the multidimensional role of natural capital in supporting human well-being in the YRD (Li et al., 2024a). This region features a dense river network, concentrated farmland and high urbanization intensity, facing multiple pressures including water quality safety, flood storage, farmland protection and carbon neutrality. The selected ES directly address the prominent ecological and environmental challenges and key policy priorities of the area. Additionally, these ES were assessed using mature quantitative models and multi-source data, ensuring the scientific rigor and comparability of assessment outcomes. This establishes a reliable basis for subsequent research into the interconnection of ES to BPS. Descriptions of ES quantification are listed in Table 2.
ES quantification methods.
Quantification of BPS
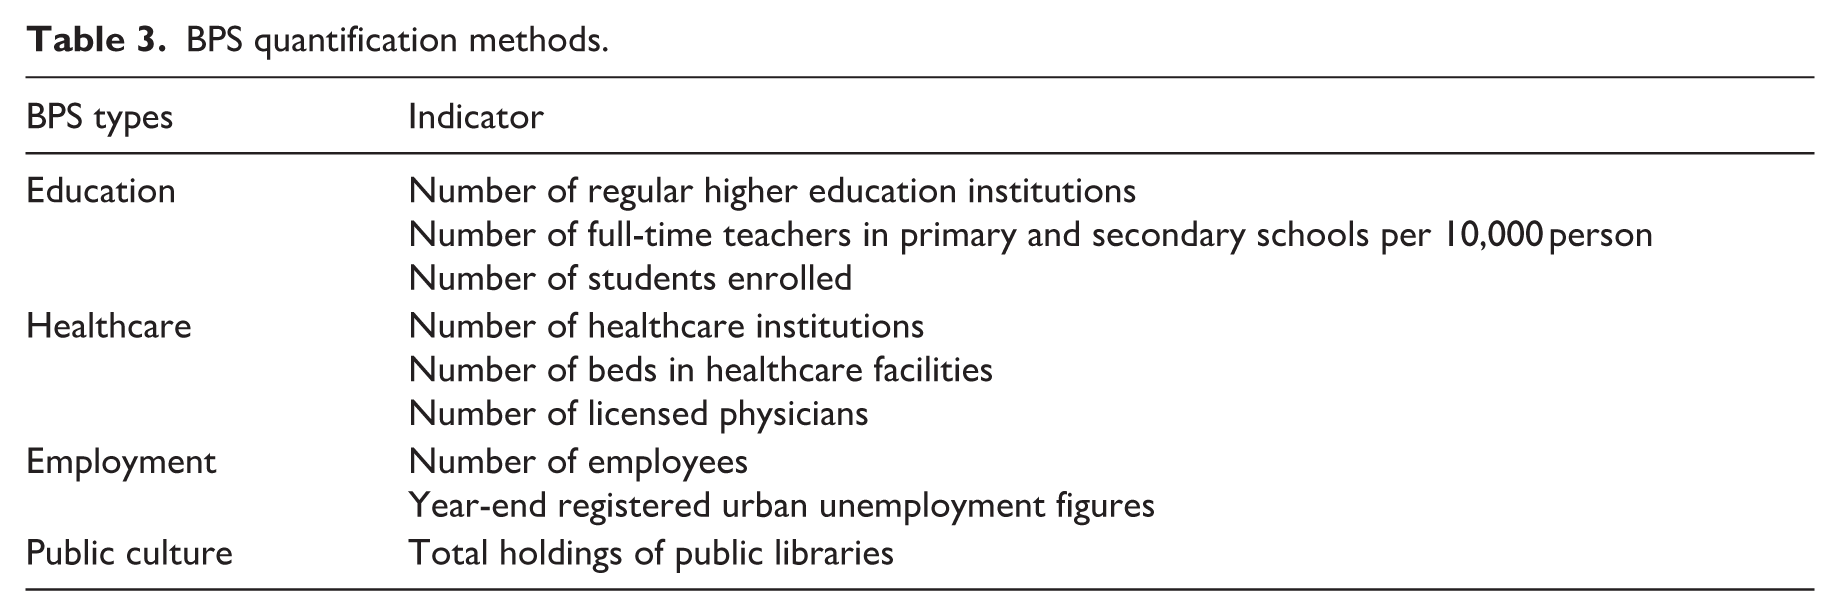
The BPS quantitative assessment in this study focused on four core dimensions: education, healthcare, employment, and public culture. It is based on the population concentration characteristics, livelihood security needs, and regional coordinated development objectives of the YRD (Li et al., 2022a, 2024b). Educational services are pivotal to regional innovation vitality and long-term development, serving as the core driver for enhancing human capital. Healthcare services safeguard residents' well-being, aligning with the region's high urbanization and population density. Employment services bridge labor supply with industrial development, influencing workforce allocation efficiency and social stability. Public cultural services meet residents' spiritual needs and align with the appeal of regional high-quality development. To ensure the scientific rigor, comparability, and data accessibility of the indicators, the quantification process strictly relied on authoritative statistical yearbook data. The specific indicators were established as presented in Table 3.
BPS quantification methods.
Comprehensive assessment of ES and BPS
To mitigate the interference caused by inconsistent units and dimensions, ES and BPS indices were subjected to normalization prior to further analysis, with the conventional min-max normalization procedure utilized in this research (Zhang et al., 2022). This method linearly transforms data from different scales into the [0, 1] interval while preserving the distribution relationships among the original data points. The specific calculation formula is as follows:

where X denotes the raw value of a certain indicator; Xmax and Xmin stand for the maximum and minimum values of the corresponding indicator across all samples, respectively; and Xnorm is the normalized result.
Then, a weighted summation approach was adopted to synthesize the magnitudes of the six ES indicators and four BPS indicators into a composite score, which reflects the overall ES and BPS performance of each municipal unit. The calculation formulae are as follows:


where ESCIj and BPSCIj represent the ES composite index and BPS composite index for spatial unit j, respectively; Wi and Wk denote the weights for service categories i and k
Assessment of ES-BPS trade-off intensity
RMSD measures the deviation between the standardized figure for a single service category and the mean standardized value of all categories. Through measuring the deviation of each paired service coordinate point from the 1:1 line, it determines whether trade-off exist between services (Figure 3) (Li et al., 2024b). This method has been extensively utilized in ES trade-off studies (Xue et al., 2025). This study employed the RMSD at the city-level scale to explore the ES-BPS trade-off relationship across cities (Xue et al., 2025), which is calculated as follows:

where Ca-k denotes the standardized magnitude of ES or BPS in year k, while Cn-k represents the annual average value of the combined ES and BPS, where n = 2. The RMSD value can present the ES-BPS trade-off intensity. That is, relatively high RMSD values indicate a stronger ES-BPS trade-off intensity, whereas lower RMSD values reflect a weaker trade-off intensity between the two (Xue et al., 2025).
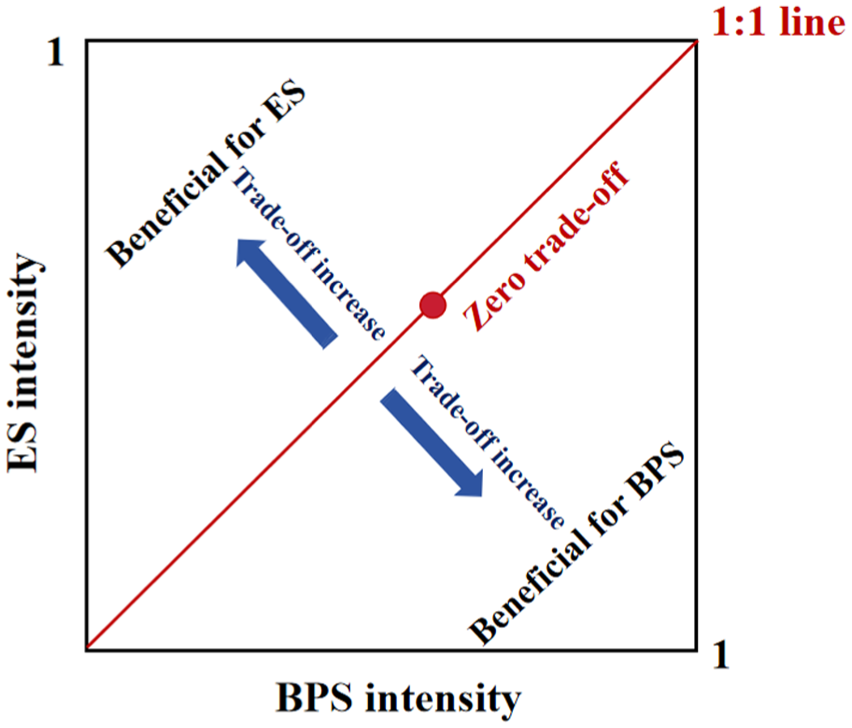
ES-BPS trade-off intensity illustration according to the RMSD.
Evaluation of the impact of urbanization
In the field of urbanization studies, population growth, economic development, and urban expansion are three core dimensions that characterize the urbanization process (Ding et al., 2021). This study examined the effects of urbanization from these three aspects. In detail, population growth was measured by the proportion of urban residents (%); economic development was characterized by the percentage of GDP contributed by the secondary and tertiary industries; urban expansion was quantified as the percentage ratio of urban construction land area to the total regional land area (%).
GWR is an analytical tool for exploring the quantitative correlations among two or more variables with spatial distribution attributes. It is based on conventional linear regression and embeds geographic location with the regression coefficients which can reveal the regional heterogeneity (Wang et al., 2021). This study employed GWR to analyze the driving forces behind the ES-BPS trade-off intensity. The changes in ES and BPS from 2000 to 2020 were applied as the dependent variable, and the changes in population growth, economic development, and urban expansion were set as the independent variables. The calculation formula is as follows:

where yi, xi and εi refer to the dependent variable, independent variable and random error term at point i, respectively; μi and νi denote the geographic coordinates of point i; k is the number of independent variables; βk is the regression coefficient at point i; β0 is the intercept. In the GWR model, a positive regression coefficient indicates that the corresponding urbanization characteristic intensifies the ES-BPS trade-off, while a negative coefficient suggests that this urbanization characteristic mitigates the ES-BPS trade-off (Li et al., 2021).
Results
Spatio-temporal dynamics of ES and BPS
From 2000 to 2020, different ES showed obvious spatial heterogeneity (Online Appendix Figure 1). Specifically, food production was higher in northern areas and lower in southern regions, but the other five ES, i.e, water purification, water conservation, soil retention, carbon sequestration, and recreation, were consistently higher in the south and lower in the north. The comprehensive ES ultimately formed an overall pattern characterized by relatively high value in the north and south, and low value in the central region (Figure 4a). From a spatial perspective, southern cities, such as Hangzhou, Xuancheng and Anqing, along with Yancheng in the north, exhibited relatively high comprehensive ES. In contrast, central cities including Shanghai, Suzhou, Jiaxing, Wuxi, Changzhou and Zhenjiang showed lower levels. From a temporal perspective, between 2000 and 2020, the comprehensive ES demonstrated an increase in the west and a decrease in the east. Among the 26 cities, 15 exhibited an upward trend in comprehensive ES, whereas 11 witnessed a decline (Figure 5a).
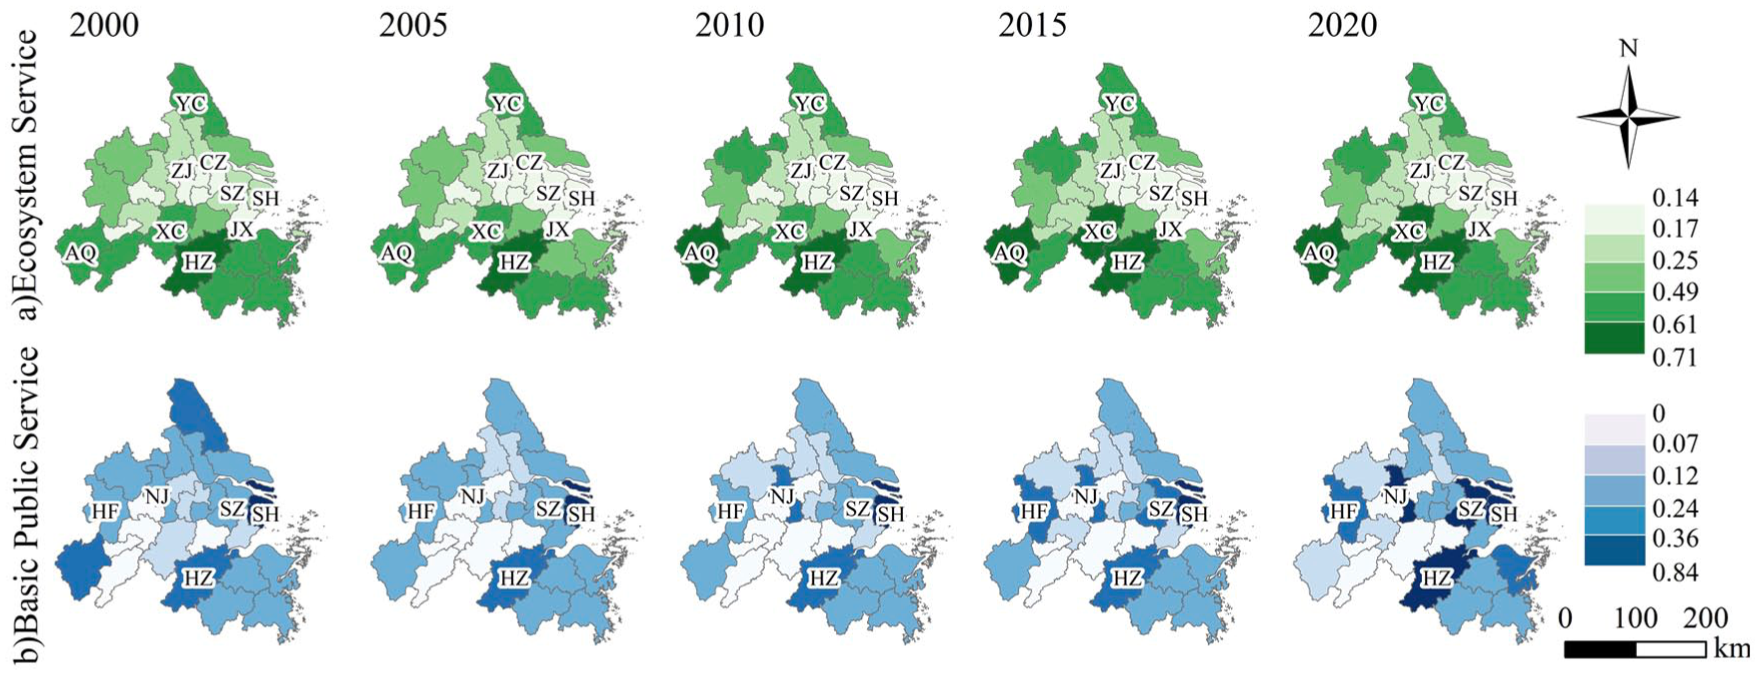
Spatial distribution of comprehensive ES and BPS from 2000 to 2020. (a) Ecosystem service. (b) Basic public service.
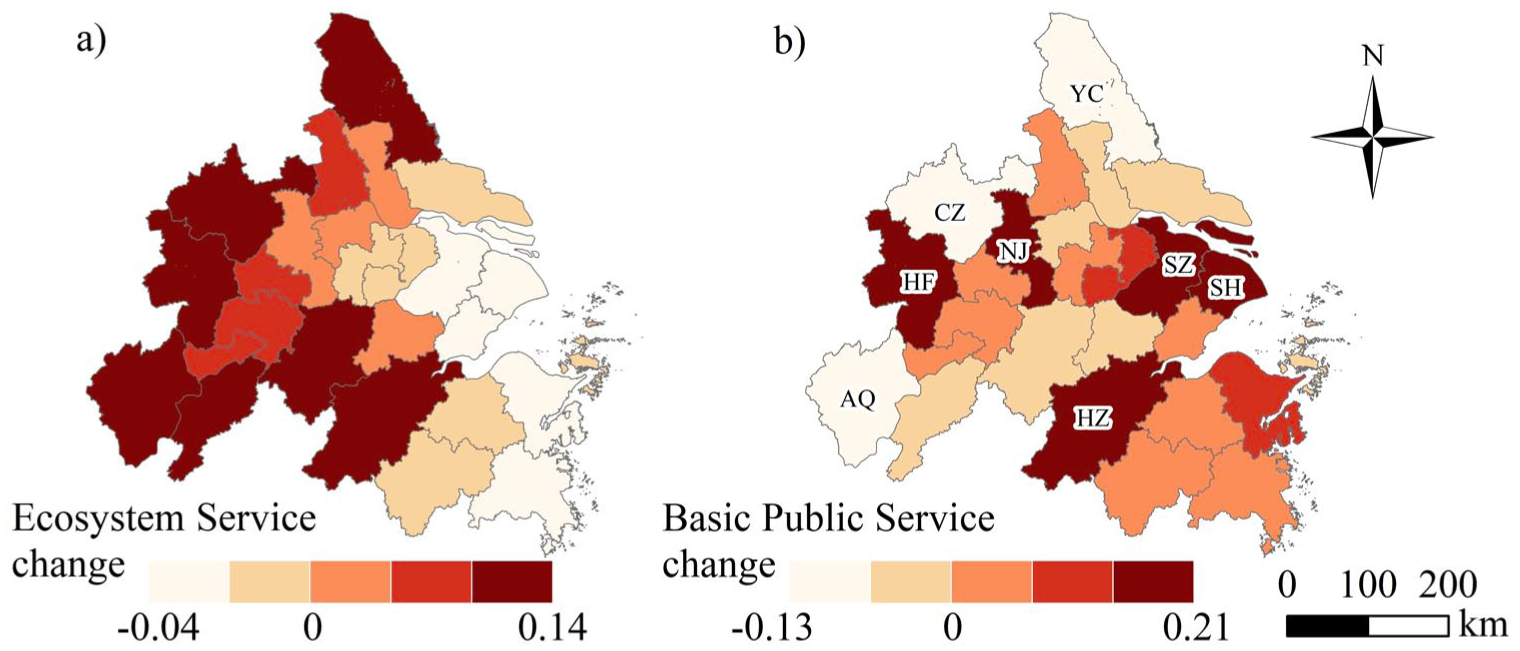
Time variation of comprehensive ES and BPS from 2000 to 2020. (a) Ecosystem service change. (b) Basic public service change.
The spatial pattern of various BPS revealed a consistent pattern across education, healthcare, employment, and public cultural services from 2000 to 2020 (Online Appendix Figure 2). Shanghai consistently ranked the highest in each element, followed by cities such as Hangzhou, Nanjing, Hefei and Suzhou, while other cities generally scored lower. Thus, the comprehensive BPS was relatively high in the eastern coastal areas, but relatively low within the central and southern zones in the YRD (Figure 4b). Among these, Shanghai recorded the highest comprehensive BPS. Meanwhile, provincial capitals such as Hangzhou, Nanjing and Hefei, along with Suzhou, also witnessed significant improvements in 2020. In contrast, cities such as Huzhou, Xuancheng and Chizhou demonstrated relatively lower comprehensive BPS. Regarding temporal variation, the comprehensive BPS showed an upward trend in the central and southeast, while it declined in the west and north. Among the 26 cities, 17 cities experienced an increase in comprehensive BPS, while nine cities saw a decrease. Specifically, cities like Shanghai, Suzhou, Hangzhou, Nanjing, and Hefei demonstrated significant growth, whereas cities such as Yancheng, Chuzhou and Anqing showed notable declines (Figure 5b).
Changes in the ES-BPS trade-off intensity
Figure 6 demonstrates that the ES-BPS trade-off intensity was relatively high in the south and low in the north during 2000-2020. Moreover, this disparity gradually increased throughout the study period. In 2000, 96% of cities had ES-BPS trade-off intensities ranging from 0 to 0.28. The number of cities within the highest trade-off intensity range (0.28-0.48) increased from one (Shanghai) in 2000 to four (Shanghai, Xuancheng, Chizhou, and Anqing) in 2020. However, the number of cities within the lowest intensity range (0-0.04) decreased from four (Nanjing, Suzhou, Wuxi, Taizhou-JS) in 2000 to three (Wuxi, Hefei, Jiaxing) in 2020.
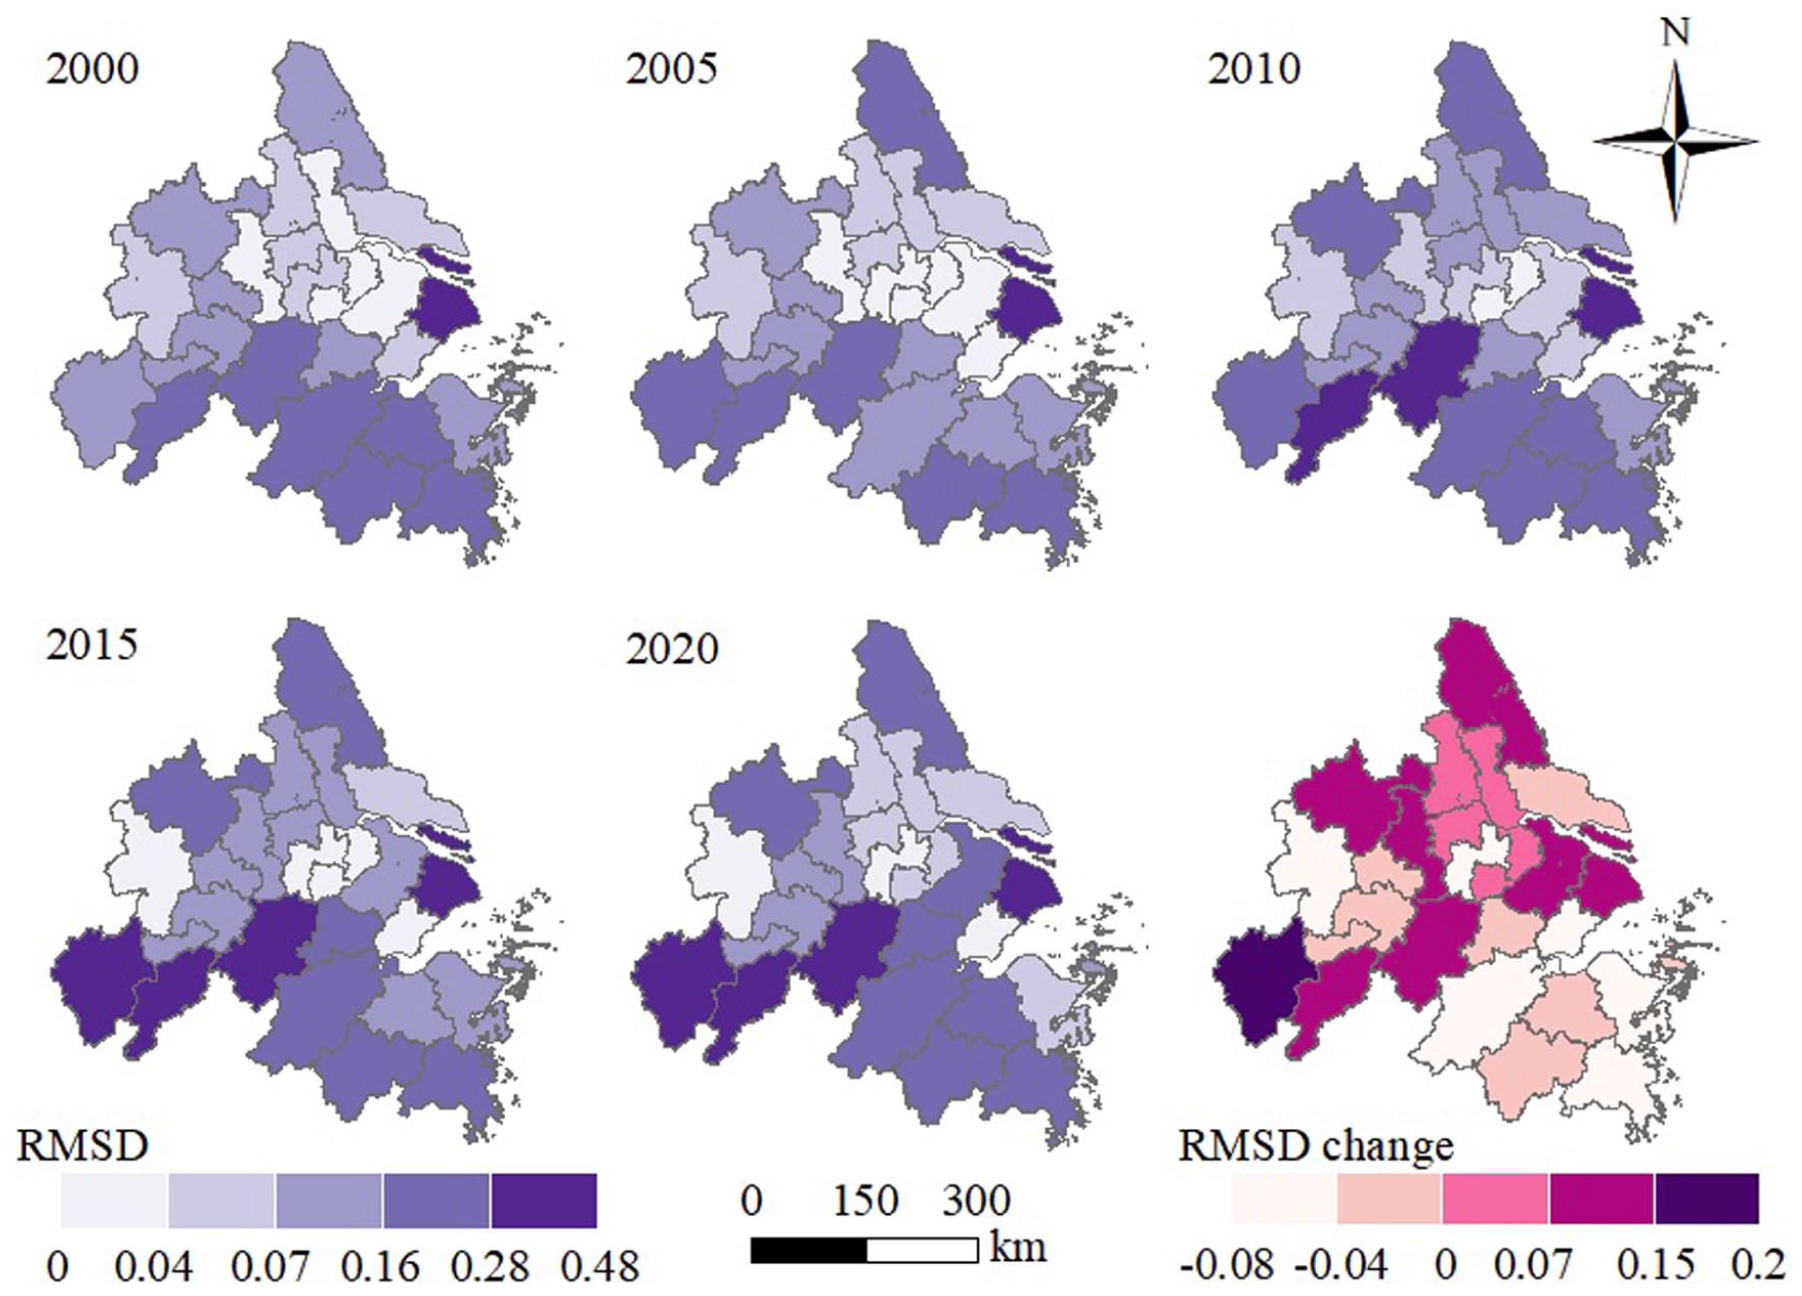
Spatial and temporal distribution of ES-BPS trade-off intensity between 2000 and 2020.
Temporally, the trade-off intensity of ES and BPS increased in 13 cities, decreased in 11 cities, and remained stable in two cities during 2000-2020. Among them, Anqing city witnessed the largest increase in ES-BPS trade-off intensity, while Hangzhou, Hefei, Changzhou, Ningbo, and Taizhou-ZJ experienced significant declines. Ma'anshan and Tongling showed no change in their ES-BPS trade-off intensity. Overall, the ES-BPS trade-off in most cities of the YRD showed an increasing trend during 2000-2020, suggesting that the conflict between ES and BPS gradually intensified during this period.
The influence of urbanization on the ES-BPS trade-off intensity
From 2000 to 2020, most cities experienced upward trends in population growth, economic development, and urban expansion in the YRD (Figure 7). The cities with the highest population growth rates were Hefei, Chuzhou, and Xuancheng. Meanwhile, Shanghai experienced a slight decline in population growth (-0.21%) as it had already reached its peak population growth rate (91%) in 2005. In terms of economic development, all cities showed an upward trend, except for Shaoxing, which experienced a decline (-0.23%). Areas with significant increases in urban expansion were primarily concentrated around Shanghai and in coastal regions (7.49%-16.56%). Cities, such as Shanghai (16.56%), Suzhou (16.08%) and Wuxi (14.81%), experienced substantial growth, while western and southern cities showed relatively smaller increases (1.47%-7.49%).
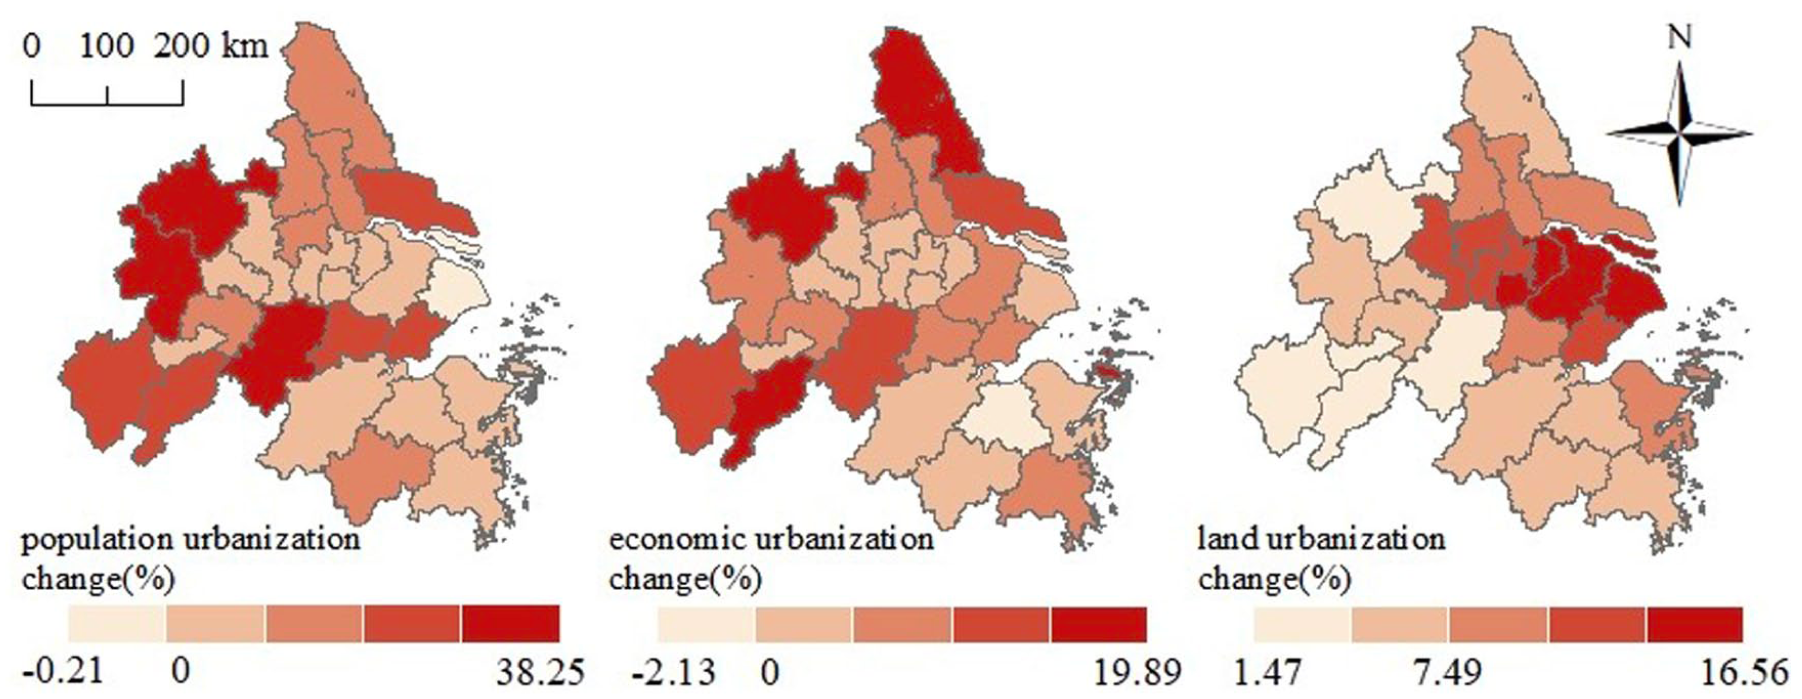
Changes in urbanization characteristics from 2000 to 2020.
It was evident that spatial variation occurred in the influence of urbanization characteristics on ES-BPS trade-off intensity (Figure 8). Population growth had a negative impact in 24 cities, indicating its mitigating influence on ES-BPS trade-off intensity in most cities. However, Hangzhou and Jinhua owned positive regression coefficients, suggesting that population growth exacerbated ES-BPS trade-off intensity in these two cities (Figure 8a). Economic development exhibited negative regression coefficients in Hangzhou, Shaoxing, Ningbo, Taizhou, and Zhoushan, indicating that economic growth alleviated ES-BPS trade-off intensity in these cities. Conversely, economic development exacerbated the trade-off in the other 21 cities (Figure 8b). The regression coefficients for urban expansion exhibited significant east-west divergence. Western cities showed negative regression coefficients, indicating that urban expansion had alleviated the trade-off intensity in these regions. The positive regression coefficient for eastern cities indicated that urban expansion had intensified the trade-off in these regions. The regression coefficients for urban expansion were negatively large in Anqing and Chizhou, indicating that urban expansion moderated the trade-off most severely in these two cities. Conversely, positively large regression coefficients were observed in Shanghai, Suzhou, Wuxi, and Nantong, suggesting that urban expansion intensified the trade-off most markedly in these cities (Figure 8c).
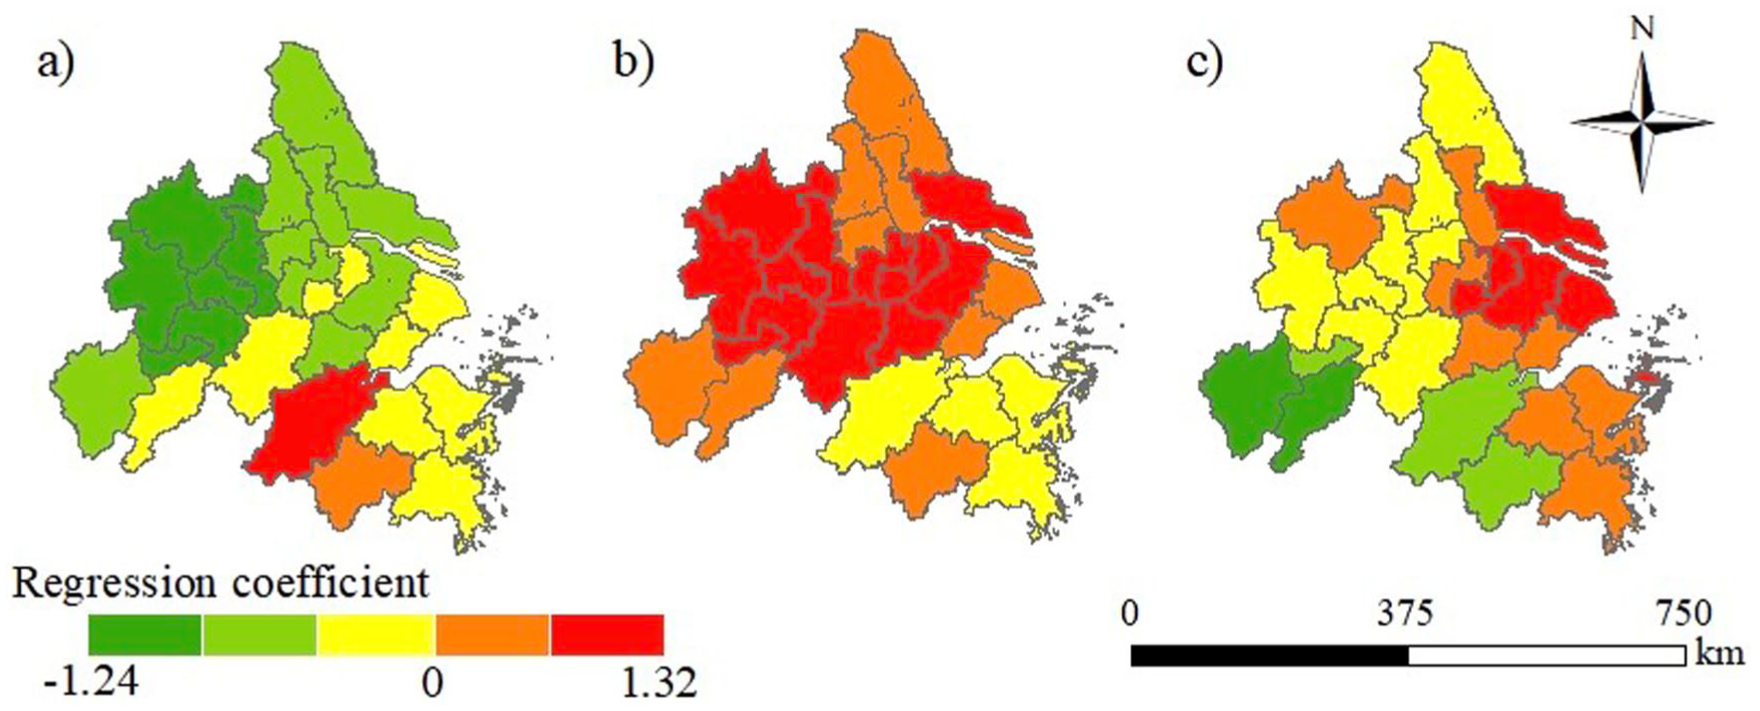
Regression coefficients of GWR. (a) Regression coefficients for changes in population urbanization. (b) Regression coefficients for changes in economic urbanization. (c) Regression coefficients for changes in land urbanization.
Discussion
The YRD experienced an intensifying ES-BPS trade-off
This research revealed that between 2000 and 2020, the ES-BPS trade-off intensity increased in 50% of the cities in the YRD, while it decreased in 42% of the cities. This trend in the change of trade-off intensity was largely consistent with the localized synergistic conclusion of the weakened trade-off intensity of ES and BPS in the YRD, as reported in the case study by Li et al. (2024a). The enhanced trade-off may stem from two scenarios. The first is the conflictual trade-off, commonly observed in areas of intensive development like Shanghai, Suzhou and Nanjing, where rapid urbanization exerts pressure on ecological lands, leading to a classic development-versus-environment conflict (Zhang et al., 2023). The second is asynchronous synergy, as seen in Anqing, Chizhou and Xuancheng. Here, robust ecological protection policies (e.g., reforestation, wetland conservation) have driven significant ES improvements (Bennett et al., 2015; Gómez-Baggethun and Barton, 2013). However, their BPS, constrained by lagging economic development or infrastructure investment, could not keep pace. This widening gap, while underscoring the region's robust ecological foundation, also reveals that its ecological dividends have yet to be effectively converted into improvements in human well-being (Hou et al., 2021; Ouyang et al., 2017).
In contrast, most cities of Zhejiang Province and cities such as Hefei, Tongling, Wuhu and Ma'anshan in Anhui Province showed a trend of diminishing trade-off. The primary mechanism lay in the synchronized and coordinated improvement of the ES and BPS, with the gap between the two gradually narrowing. This reflected the feasibility of promoting socio-ecological synergistic development through systematic policy interventions (Guan and Rowe, 2016). This pathway offered significant insights for regional sustainable development. Spatial planning and governance mechanisms needed to be innovated to simultaneously enhance BPS and prioritize ecological conservation and restoration. Actively exploring pathways to integrate nature-based solutions into public service delivery was essential (Van Der Jagt et al., 2019), which could advance ES and BPS to transfer from trade-off to synergy.
How urbanization characteristics drive the trade-off of ES and BPS
This study indicated that the influence of population growth, economic development, and urban expansion on ES-BPS trade-off exhibited significant variations within the YRD. Population growth alleviated the trade-off intensity of ES and BPS in 92% of cities, while it only exacerbated this intensity in Hangzhou and Jinhua. In contrast, economic development intensified the trade-off of ES and BPS in 81% of cities, but mitigated them in Hangzhou, Ningbo, Shaoxing, Taizhou, and Zhoushan. As for urban expansion, its impact on ES-BPS trade-off intensity showed distinct spatial differentiation, with mitigation observed in the west and intensification in the east.
Guiding population concentration toward urban areas has promoted the intensive development of infrastructure and facilitated the restoration of ecological space in rural regions, thereby reducing the scattered pressure of human activities on ecosystems (Mascarenhas et al., 2019). This dual mechanism creates structural potential for mitigating ES-BPS trade-offs. First, declining rural populations reduce pressure on natural ecosystems. Second, population concentration in cities enables more efficient use of public services through economies of scale. Whether this potential is realized, however, depends critically on urban governance. Effective governance can transform population density into improved BPS delivery without requiring proportional land expansion, thereby preserving ecological space (Li et al., 2024b). Conversely, in cities like Hangzhou with strong population attraction, the rapid concentration of people within a short period exceeded the city's ecological carrying capacity and governance capabilities. This intensified resource consumption and spatial competition, leading to intensifying trade-off linking BPS and ES (Li et al., 2017; Yu et al., 2021). Thus, population redistribution offers the structural potential for mitigating the ES-BPS trade-off, but governance quality determines whether that potential is realized as synergy or devolves into intensified conflict.
Economic development played an opposing role and intensified the trade-off between ES and BPS, likely because many cities are reliant on traditional industries, such as chemicals and textiles. Economic growth remains dependent on resource consumption and pollution emissions, this directly leads to the degradation of critical ES, such as clean water sources and air regulation, further exacerbating conflicts between ES and BPS (Marques et al., 2019). Moreover, the benefits of economic growth have not been sufficiently directed toward improving BPS, nor have they been distributed evenly across space. As a result, BPS fails to keep pace with the demands of a growing economy, widening the gap between ES degradation and BPS development and further intensifying their trade-off. Cities, like Hangzhou and Ningbo, have transformed their industrial structures toward digital economies, green manufacturing, and modern services. Combined with proactive environmental governance and ecological compensation mechanisms, their economic development no longer sacrificed ES. Economic development helped to reduce the trade-off between ES and BPS (Guan and Rowe, 2016; Kemkes et al., 2010).
Urban expansion demonstrated distinct effects on the trade-off between ES and BPS in the eastern and western YRD, which may result from disparities in resource endowments and expansion models. The built-up land expansion in the east frequently occurred at the expense of ecologically valuable wetlands and forests, given the scarcity of natural land resources. This directly undermined ES and intensified the trade-off between ES and BPS (He et al., 2022). From a socio-economic perspective, the eastern region's development model has long been driven by rapid industrialization and foreign investment, prioritizing economic output and built-up land expansion, which further accelerated ecological occupation. Western regions, however, possessed relatively abundant natural land resources, which provided greater flexibility in spatial planning. Urbanization in these areas could therefore proceed with more selective and controlled use of natural land, while also emphasizing the revitalization of existing developed areas and the optimization of urban-rural layouts. Socio-economically, the western region's development has been more reliant on ecological conservation policies and green industry transitions, which have curbed extensive land expansion and reduced pressure on ecosystems (Zeng et al., 2025). As a result, the ecological foundation remained largely intact, and the decline in ES was less pronounced, thereby mitigating the overall ES-BPS trade-off intensity.
Limitations and prospects
This research examined the ES-BPS trade-off in the YRD, revealing its spatial patterns and urbanization-driven mechanisms. However, several limitations were identified. First, the measurement of BPS primarily relied on statistical yearbook data, which are limited in their ability to capture nuanced differences in service accessibility and spatial equity. Furthermore, these data are constrained by their update cycles and spatial resolution. In the future, it should integrate multi-source geospatial data (Points of Interest, nighttime light patterns, and transportation networks), social perception information, and field research materials to establish a BPS evaluation system. Secondly, this research focused on identifying the current state and driving forces of ES-BPS trade-off, without delving into the synergistic thresholds and tipping points between ES and BPS. Subsequent research may incorporate marginal analysis and inflection point identification methods to explore the trade-off and synergy thresholds linking ES and BPS under various scenarios.
Conclusions
This study quantified ES and BPS in the YRD during 2000-2020, and investigated the spatio-temporal evolution of their trade-off intensity, as well as the driving mechanisms of urbanization. It was found that 65% of cities exhibited an increase in comprehensive BPS, while approximately 40% showed a decrease in comprehensive ES. ES-BPS trade-off intensity was relatively high in the south and low in the north. 50% of cities displayed an increasing trend in trade-off intensity, 42% showed a decreasing trend, and the remaining 8% remained stable, indicating that the YRD had not yet attained a state of coordinated socio-ecological development. The influence of urbanization factors on trade-off intensity showed significant divergence: population growth mitigated the ES-BPS trade-off in 92% of cities, while economic development exacerbated this intensity in 81% of cities. The effect of urban expansion exhibited spatial variation, with mitigation in the west and intensification in the east. This study deepened the understanding of ES-BPS trade-off and its drivers, and provided scientific insights for the coordinated governance of ES and BPS in rapidly urbanizing regions.
Supplemental Material
sj-docx-1-tee-10.1177_2754124X261440281 – Supplemental material for Balancing ecosystem services and basic public services in the Yangtze River Delta: Spatial trade-off intensity and urbanization drivers
Supplemental material, sj-docx-1-tee-10.1177_2754124X261440281 for Balancing ecosystem services and basic public services in the Yangtze River Delta: Spatial trade-off intensity and urbanization drivers by Nana Wang, Yi’na Hu, Fei Xue and Shiqiang Du in Transactions in Earth, Environment, and Sustainability
Footnotes
Author Contributions
Nana Wang and Yi’na Hu designed the study; Nana Wang performed the analyses and prepared the figures; Nana Wang and Yi’na Hu wrote the paper; Fei Xue and Shiqiang Du revised and edited the manuscript. All authors approved the final version of the article.
Funding
The authors disclosed receipt of the following financial support for the research, authorship, and/or publication of this article: This work was financially supported by the National Natural Science Foundation of China (No. 42201102).
Declaration of conflicting interests
The authors declared no potential conflicts of interest with respect to the research, authorship, and/or publication of this article.
Supplemental material
Supplemental material for this article is available online.
Author biographies
References
Supplementary Material
Please find the following supplemental material available below.
For Open Access articles published under a Creative Commons License, all supplemental material carries the same license as the article it is associated with.
For non-Open Access articles published, all supplemental material carries a non-exclusive license, and permission requests for re-use of supplemental material or any part of supplemental material shall be sent directly to the copyright owner as specified in the copyright notice associated with the article.