
Abstract
Land cover changes (LCCs) influence land surface temperature through biogeophysical (BGP) and biogeochemical (BGC) processes. Yet, their combined, spatially varying effects remain inadequately quantified for major LCCs in China over the past two decades. This study integrates biogeophysical and biogeochemical processes to assess how LCCs affect local land surface temperature (LST) across China from 2000 to 2020, leveraging satellite-derived LST data and transient climate response estimates from CMIP5 models. We find that LCCs occurred in 5.87% of China’s land area, driven by ecological restoration, cropland expansion, and urbanization. These LCCs caused a BGP warming of 0.000181°C nationally, which was counteracted by a BGC cooling of -0.000199°C (a magnitude equivalent to 110% of the BGP warming) associated with a net carbon sink of 1.33 GtCO2. The resulting combined net cooling effects indicate that LCCs overall played a mitigating role against background warming. Regionally, the combined effects showed strong warming in eastern China, linked to urbanization and cropland degradation, and cooling in western China, driven by ecological restoration. BGC effects dominated the local LST response over BGP effects in most (80%) LCC areas except urbanization. Local synergy between BGP and BGC was observed in 61% of LCC areas, where they intensify each other’s local effects. These findings reveal distinct synergistic and tradeoff relationships between BGP and BGC effects associated with LCCs and their spatial patterns. It also highlights the potential of effective land use/cover management as a natural climate solution for climate mitigation.
Keywords
Introduction
Human-induced land cover changes (LCCs) are one of the primary driving forces of climate change at global and regional scales through biogeochemical cycles (BGC) and biogeophysical processes (BGP) (Bathiany et al., 2010; Feddema et al., 2005; Kalnay and Cai, 2003; Luo et al., 2020; Pan et al., 2011). LCCs contributed approximately 30% of historical anthropogenic emissions through biogeochemical processes and are responsible for 0.2°C of global warming (Friedlingstein et al., 2022; Intergovernmental Panel on Climate Change (IPCC), 2023). Meanwhile, LCCs alter biogeophysical processes and influence regional and local climate by changing evapotranspiration (ET), albedo, turbulent fluxes, and surface roughness, generating biogeophysical effects (Bonan, 2008). Different from BGC effects, which operate at global scale, the BGP effects of historical LCC vary regionally and even with opposite signs (either warming or cooling) for the same land conversion, creating synergy or tradeoff between these two effects (Arrouays et al., 2006; Bellamy et al., 2005; Don et al., 2011; Guo and Gifford, 2002; Sanderman et al., 2017). Failing to account for these effects may undermine the climate-mitigation benefits of land management, such as afforestation (Hasler et al., 2024; Kristensen et al., 2024). Therefore, incorporating both BGC and BGP effects is a necessity for a more comprehensive assessment of LCC impacts on land surface temperature (LST).
Since 2000, China has undergone accelerating and diverse changes in land cover, driven by rapid economic growth, urbanization, and land-use policies including ecological restoration and conservation of cultivated lands (Fan et al., 2025; Liu et al., 2010; Wu et al., 2024a). For example, ecological restoration programs (e.g., the Grain to Green program) and afforestation efforts in China increased forest area by 494,317 km2 from 2006 to 2016 (Guo et al., 2022), positioning China as a leader in vegetation greening (Chen et al., 2019). Rapid urbanization has expanded construction land by 13.6 times from 1978 to 2017 (Gong et al., 2019). Meanwhile, the cultivated land balance policy preserved cropland by limiting its conversion to other land uses (Song, 2017).
The climate impacts of these land cover changes have been extensively studied, focusing on either the BGC or the BGP perspective. Recently, there has been growing attention to the synergy and trade-off between the BGP and BGC effects, which can either enhance or counteract each other at the regional and local levels (Li et al., 2024b; Shen et al., 2025). It is known that the BGC cooling of boreal afforestation through carbon sequestration would be largely offset by BGP warming because of increased albedo, while the BGP effects would enhance the BGC cooling of tropical afforestation through evaporation cooling (Li et al., 2015; Montenegro et al., 2009; Windisch et al., 2021). Similar synergy and trade-off patterns are reported for various land conversions in China. Forest expansion produced a carbon sink of 99.2 TgC yr-1 from 2001 to 2020 (Liao et al., 2024), accounting for nearly 49% of the national terrestrial carbon sink (Yue et al., 2024). Such BGC cooling of forestation is strengthened by the BGP cooling of forests south of 48°N but counteracted by BGP warming in forests in northeast China (Li et al., 2024b). In contrast, urbanization, which converts natural land to impermeable surfaces, led to a direct loss of terrestrial carbon storage of 13.89 TgC in China from 2000 to 2020 (Wu et al., 2024b) and substantial CO2 emissions (Liu et al., 2019b), resulting in significant BGC warming. The urbanization-induced BGC warming is also enhanced by BGP warming, driven by reduced evapotranspiration, lowered albedo, anthropogenic heat emissions, and urban morphology (Manoli et al., 2019; Ouyang et al., 2022). Furthermore, BGP cooling resulting from the expansion of irrigated croplands (Liu et al., 2022b) could be offset by the BGC warming due to carbon losses when croplands replace forests, grassland, and wetlands (Chaplin-Kramer et al., 2015; Molotoks et al., 2018).
To combine the BGP and BGC effects of LCC, earth system models and satellite data analyses have attempted to evaluate them within a consistent methodological framework. On the one hand, Earth system models with carbon cycles can dynamically simulate and compare the climatic effects of BGP and BGC directly through numerical experiments (Bathiany et al., 2010). On the other hand, the evaluation of BGC and BGP effects based on satellite data relies on specific metrics that translate these two processes into comparable units, such as radiative forcing (Arneth et al., 2010), CO2-equivalent (Montenegro et al., 2009; Windisch et al., 2021), and local LST changes (Duveiller et al., 2018; Li et al., 2024b). However, most metrics only consider radiative processes, neglecting non-radiative processes and atmospheric feedback (Bright et al., 2017). Transient climate response to emissions (TCRE) derived from fully coupled Earth system models includes various Earth system feedbacks. It serves as an integrated measure that best characterizes the Earth system’s temperature response to CO2 emissions and has been used to convert the carbon metric of BGC effects into the temperature metric of BGP effects, making them comparable (Amali et al., 2025; Li et al., 2024b; Windisch et al., 2021).
The majority of previous studies in China have focused on specific land conversions, such as forestry (Huang et al., 2018; Li et al., 2024b; Mykleby et al., 2017), leaving other prevalent LCCs unquantified with respect to their BGP and BGC effects. This study addresses the gap by providing a comprehensive assessment of the BGC and BGP effects of various LCCs in China from 2000 to 2020 on local LST, a more intuitive metric for informing climate consequences. The BGC effects were quantified by LCC-induced changes in carbon density, which were translated into local LST changes through transient climate responses from CMIP5 models, while BGP effects were assessed using LST changes from MODIS satellite LST data. Our findings provide a qualitative assessment of the combined effects of the BGC and BGP for different LCCs and their spatial patterns. This knowledge helps design and improve the effectiveness of land use/cover management as a natural climate solution through its biogeophysical and biogeochemical effects.
Data and methods
Data
Land cover data
We used the European Space Agency Climate Change Initiative (ESA CCI) land cover dataset at 300m (Harper et al., 2023) to extract land cover changes in China from 2000 to 2020 (https://doi.org/10.5194/essd-15-1465-2023, last access: 31 March 2023). We combined 33 land cover types into seven broad categories: cropland, forest, grassland, water, urban areas, sparse vegetation, and bare land (Online Supplementary Table S1). Note that shrubland was included as forests following the definition of forests in China (State Administration for Market Regulation and Standardization Administration of the People’s Republic of China, 2017, 2020; Zeng et al., 2015), and wetlands were grouped into water bodies due to their similar physical characteristics.
Land surface temperature (LST)
The MODIS Aqua LST (MYD11A2, https://doi.org/10.5067/MODIS/ MYD11A2.061, last access: 4 February 2024) data (Wan et al., 2021) at 1km were used to quantify the potential biogeophysical effects of LCC. The original eight-day data from 2003 to 2019 were averaged to a multi-year daily mean LST to reduce the influence of climate variability.
Carbon density
The biomass carbon density map at 300m for the year 2010 was obtained from the Oak Ridge National Laboratory DAAC (https://doi.org/10.3334/ORNLDAAC/1763, last access: 22 April 2020). The aboveground biomass is produced by land-cover-specific remotely sensed data with input parameters from the literature; the belowground biomass map is made by integrating matching data and empirical models (Spawn et al., 2020). Above and belowground biomasses were summed to obtain total biomass carbon for this analysis.
The soil carbon density map at multiple depths in 2010 (Liu et al., 2020, 2022a) is available from the National Earth System Science Data Center of China at a 1km resolution (http://soil.geodata.cn, last access: 8 March 2022; Soil SubCenter, National Earth System Science Data Center, National Science & Technology Infrastructure of China, 2022).
Transient Climate Response to Emissions
Transient Climate Response to Emissions (TCRE) data from CMIP5 describe the LST responses to cumulated CO2 emissions in doubling CO2 experiments, which translates the carbon fluxes from BGC effects into LST changes consistent with the BGP effects. Here we used TCRE calculated by Windisch et al. (2021) from 21 CMIP5 models at 1° resolution (ACCESS1-0, bcc-csm1-1, BNU-ESM, CCSM4, CNRM-CM5, CSIRO-Mk3-6-0, EC-EARTH, FGOALS-s2, GFDL-ESM2G, GISS-E2-H, HadGEM2-ES, ACCESS1-3, BCC-CSM1-1-M, CanESM2, CNRM-CM5-2, CSIRO-Mk3L-1-2, FGOALS-g2, GFDL-CM3, GFDL-ESM2M, GISS-E2-R, and INM-CM4).
All the above datasets were resampled from their original spatial resolutions to 0.01° for categorical variables, such as land cover data, using the majority method, and for continuous high-resolution variables, including land surface temperature, soil density, and biomass carbon density, using the average method. For TCRE data with coarse spatial resolution, the nearest neighbor method was used.
Methods
Detection of land cover changes
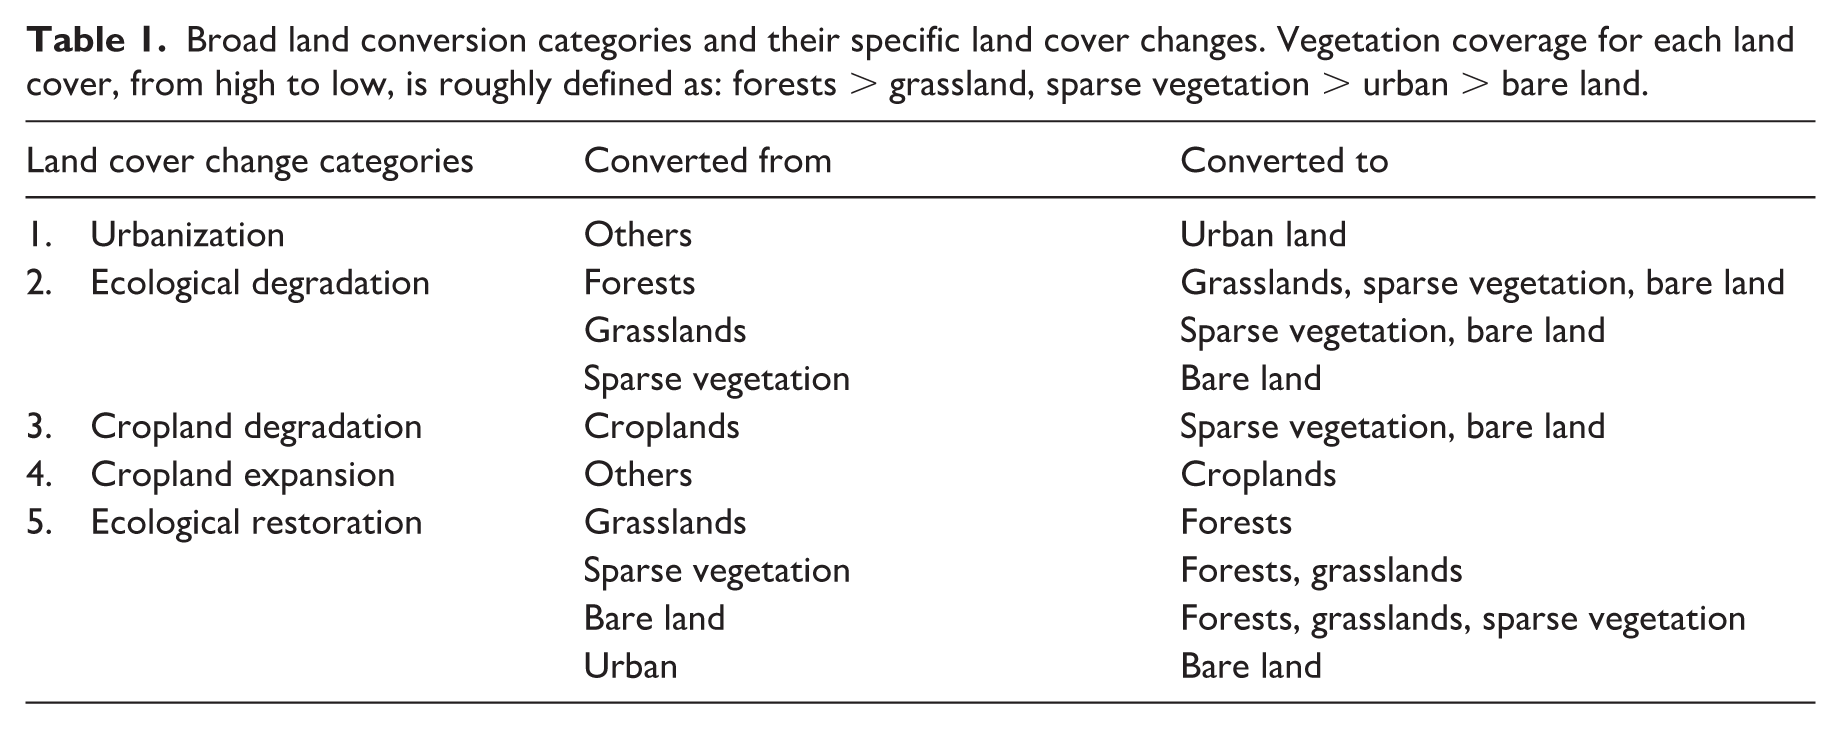
Land cover changes are identified using land cover data between 2000 and 2020 at a resolution of 0.01°. The large number of specific land conversions were grouped into five broad categories (Table 1), including urbanization (from other to urban land), ecological degradation (from higher to lower vegetation coverage), cropland degradation (from croplands to lower vegetation coverage), cropland expansion (from other to croplands), and ecological restoration (from lower to higher vegetation coverage). Land conversions with water bodies were excluded from our analyses because they have distinct biogeophysical and biogeochemical effects compared to terrestrial land cover.
Broad land conversion categories and their specific land cover changes. Vegetation coverage for each land cover, from high to low, is roughly defined as: forests > grassland, sparse vegetation > urban > bare land.
Estimation of BGP effects
The biogeophysical effects of LCCs refer to the LST changes induced by conversion from land type M to type N due to their different biogeophysical properties. The potential biogeophysical effects of LCC can be estimated using a space-for-time approach to control for the influence of long-term climate change, decadal variability, and other factors on the observed LST changes (Li et al., 2016b). The potential effect is calculated as the mean LST differences between adjacent stable land cover (without LCC) type M and N within a 10×10 pixel window (i.e., window size of 0.1°×0.1°) to exclude the influence of non-LCC factors, as shown in Equation (1):

where

where
Estimation of BGC effects
The BGC effects of LCC arise from its associated carbon fluxes (emission or absorption), which influence the global climate through climate sensitivity (the LST response to a unit change in atmospheric CO2, as reflected in TCRE). We first defined the susceptible carbon density (SCD) to land cover changes as the sum of aboveground, belowground biomass, and the top 30 cm soil carbon following Windisch et al. (2021). The potential SCD changes induced by land conversion from type M to N

where

where
Translating BGC effects to local LST changes
We used TCRE from CMIP5 to translate the BGC effects from carbon emissions to local LST changes. Here, TCRE is estimated from 1pt CO2 experiments (Windisch et al., 2021) as in Equation (5):
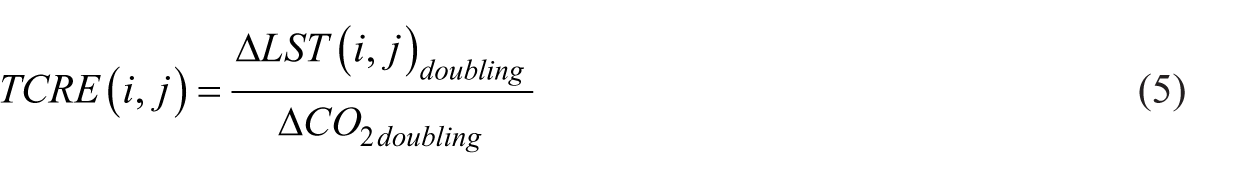
where TCRE(i,j) stands for transient climate response to cumulative emission (unit: °C/ppm) in grid cell (i,j), ∆
Next, we calculated changes in global CO2 concentration (∆
where
The global-level LST change caused by a specific amount of CO2 emission

Since the BGC effects of LCC on LST through carbon emission in terms of CO2, which is well-mixed in the atmosphere and affects climate at the global scale, we used grid cell area Area(i,j) and Earth’s surface area to scale global LST changes to the equivalent local LST changes at the grid level following Equation (8):

where
Results
Land cover changes from 2000 to 2020
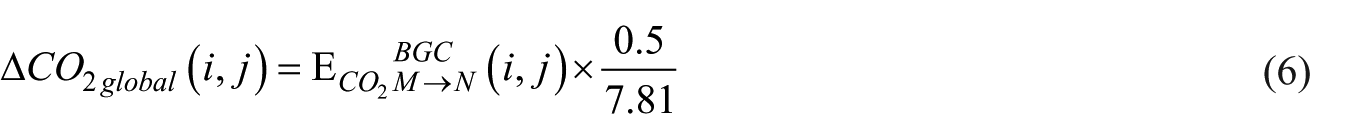
China experienced significant land cover changes from 2000 to 2020, with a total change area of 557,411 km2, equivalent to 5.87% of China’s land area. The top three LCC categories, collectively accounting for 85% of changes, were ecological restoration (43% of the LCC area), cropland expansion (24% of the LCC area), and urbanization (18% of the LCC area) (Figure 1).
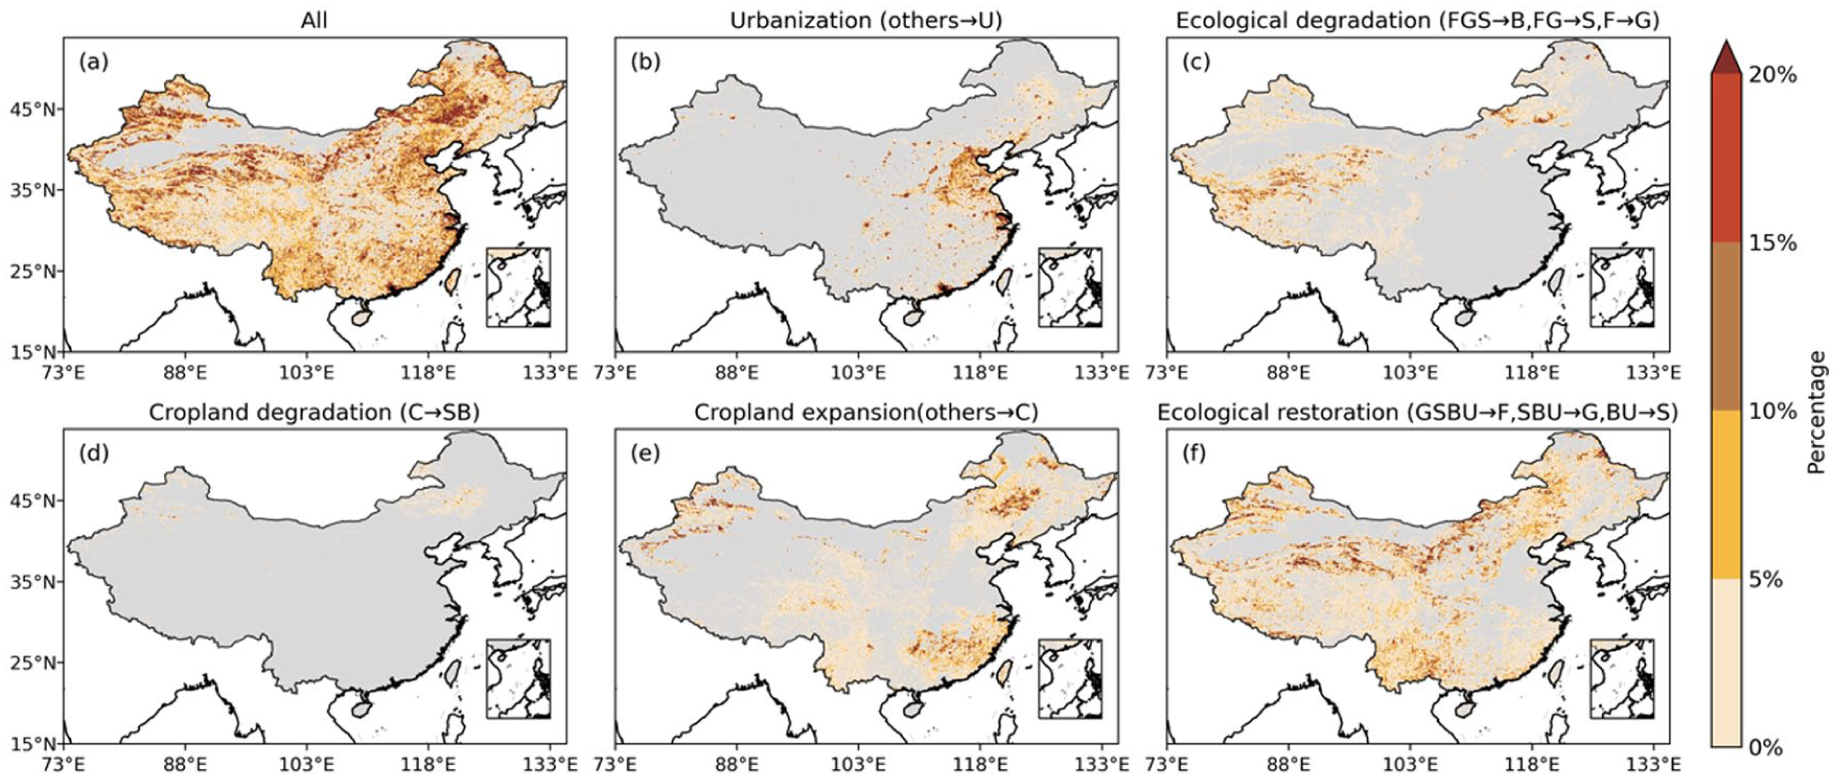
Land cover changes in China between 2000 and 2020. Maps show the areal percentage of all land cover changes (a), and different land conversion categories, including urbanization (b), ecological degradation (c), cropland degradation (d), cropland expansion (e), and ecological restoration (f). Land cover changes are aggregated to be displayed at 0.1°. Land conversions in each subplot are denoted as cropland (C), forests (F), grassland (G), urban land (U), sparse vegetation (S), and bare land (B).
The ecological restoration LCCs (i.e., land conversions from lower to higher vegetation coverage) have been widely occurring in China (245,356 km2; Figure 1f), with primary conversions from croplands and bare land to forests and grasslands due to the “Grain to Green” and afforestation policies (Figure 2). Cropland expansion LCCs were prominent in the Northeast China Plain and northeastern regions (129,066 km2; Figure 1e), mainly from forests and grasslands (Figure 2). Urbanization LCCs were mostly converted from croplands and grasslands (99,919 km2; Figure 2), and were primarily located in East China, including the North China Plain, Yangtze River Delta, and Pearl River Delta (Figure 1b). Ecological degradation LCCs (i.e., land conversions from higher to lower vegetation coverage) occurred across China (84,178 km2; Figure 1c), which involved conversions from grasslands to sparse vegetation and bare land (Figure 2). Cropland degradation LCCs were mainly found in parts of northwestern and northeastern regions (5,287 km2; Figure 1d), where croplands were converted to sparse vegetation and bare land (Figure 2).
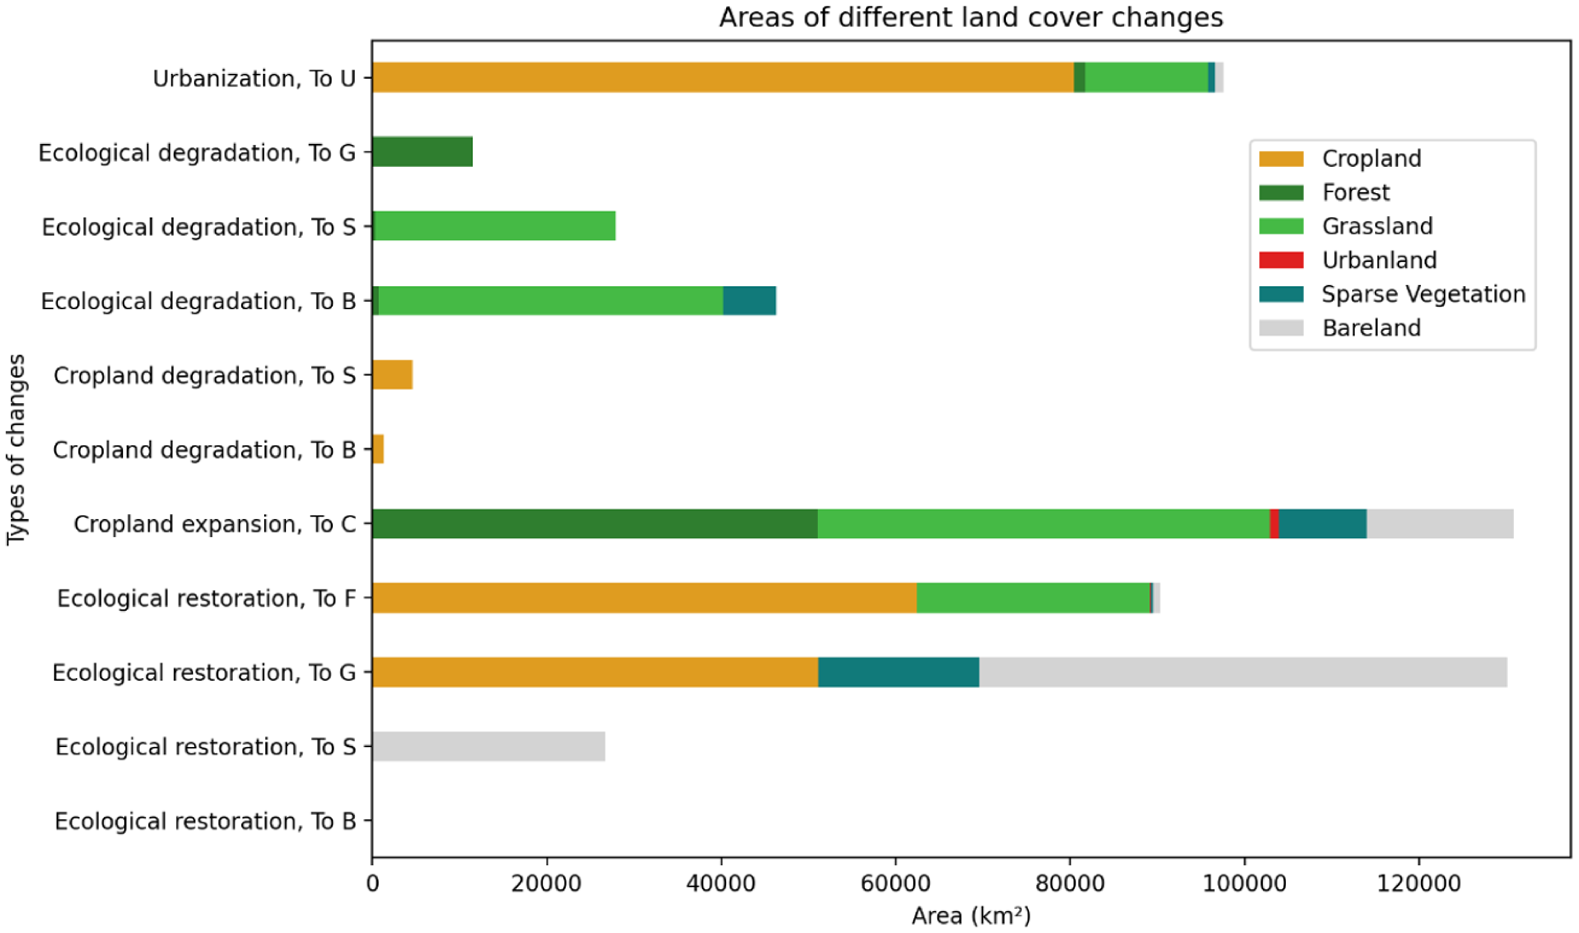
Area statistics of land conversion in China from 2000 to 2020. Each bar represents the area of specific land conversion. Capital letters stand for land cover converted to U (urban area), G (grassland), S (sparse vegetation), B (bare land), C (cropland), and F (forest). The color of each bar indicates the original land cover that has been converted.
For individual land cover, there was an overall increased area of forests (24,524 km2), urban lands (103,336 km2), and sparse vegetation (22,510 km2), but decreased area of cropland (78,401 km2) and grassland (-19,210 km2) from 2000 to 2020 (Online Supplementary Table S2).
Biogeophysical effects of land cover changes
Land cover changes in China resulted in a BGP warming at the national level (0.000181°C, averaged across China’s land) (Figure 3a), with significant variations across land conversion categories and regions. The spatial pattern of BGP effects reflects the effects of individual land conversion categories and their spatial distribution. Specifically, the dominant BGP warming in eastern China was driven by urbanization, which accounted for 54% of LCC areas. In contrast, the rest of the LCC areas, mainly located in western China, exhibited cooling due to ecological restoration and cropland expansion.
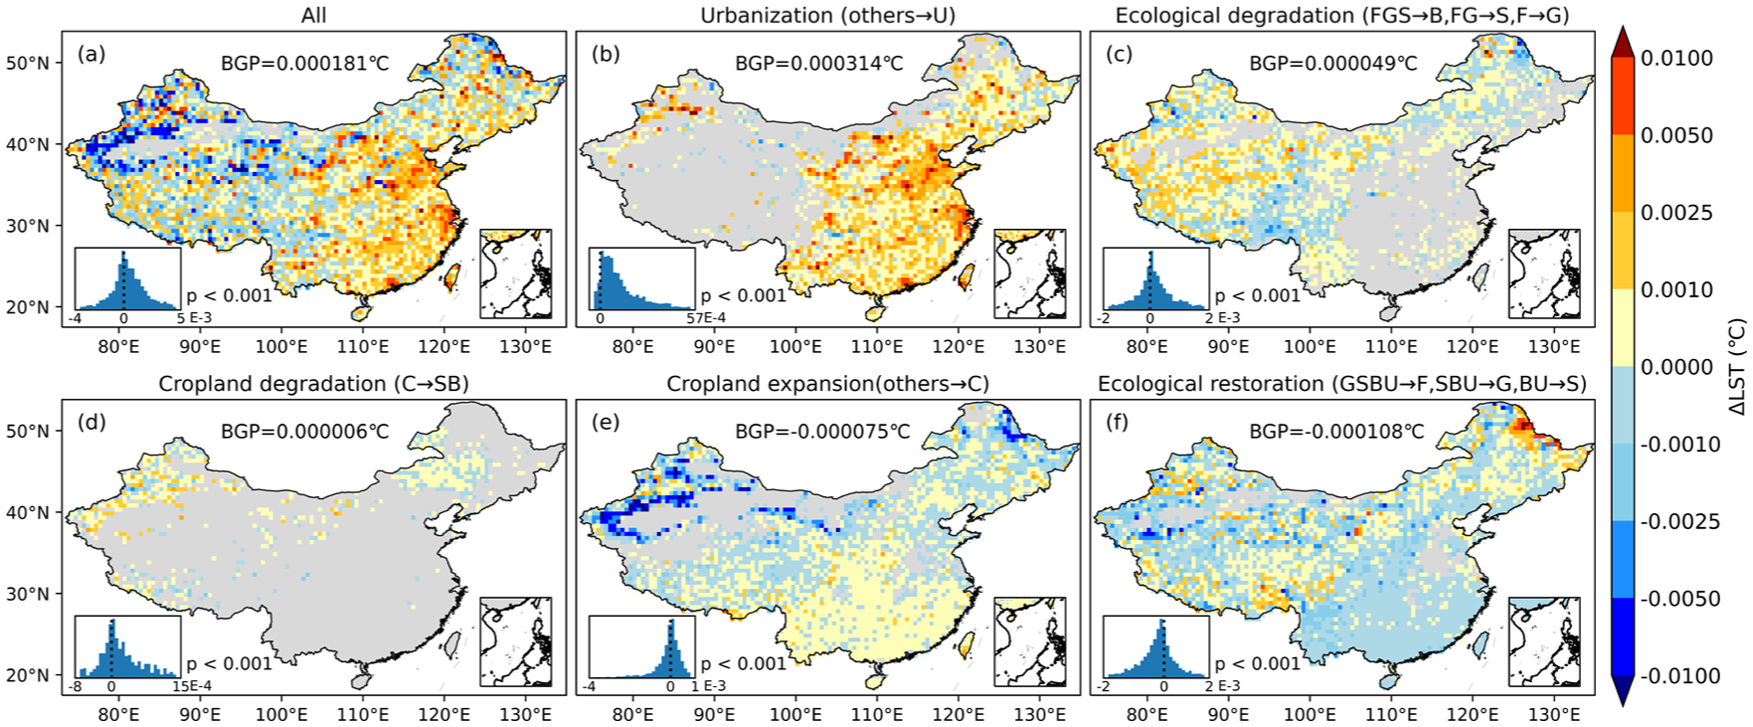
Biogeophysical effects of land cover changes on LST. Spatial pattern of LST changes for all land cover changes (a), urbanization (b), ecological degradation (c), cropland degradation (d), cropland expansion (e), and ecological restoration (f) at 0.5° resolution. Land conversions in each subplot are denoted as cropland (C), forests (F), grassland (G), urban land (U), sparse vegetation (S), and bare land (B). Histograms in the lower-left corner of the subplots show distributions of LST changes for each LCC category, with the statistical significance of the mean value by one-sample t-test annotated next to each histogram.
Among different LCC categories, BGP warming effects were widely observed in urbanization (0.000314°C, Figure 3b), ecological degradation (0.000049°C, Figure 3c), and cropland degradation LCCs (0.000006°C, Figure 3d). Urbanization LCCs led to a widespread increase in LST across 81% of their LCC areas (Figure 3b), known as the urban heat island effect (Manoli et al., 2019). Ecological degradation (Figure 3c) and cropland degradation (Figure 3d) both experienced conversions from higher to lower vegetation coverage, resulting in warming in 56% and 62% of their LCC areas, respectively. Transitions from grasslands to bare land (69.93%) and to sparse vegetation (40.68%) contributed most to the warming of ecological degradation.
BGP cooling effects appeared in cropland expansion (-0.000075°C, Figure 3e) and ecological restoration LCCs (-0.000108°C, Figure 3f). The mild cooling effects of cropland expansion (Figure 3e) come from the strong cooling (-0.001161°C) in northern drylands of China receiving intensive irrigation (Liu et al., 2019a), combined with weak but prevalent warming (0.000570°C) in southern China where forests were converted to croplands. Ecological restoration, which involves converting land from lower to higher vegetation coverage, had an intense cooling effect in most regions (Figure 3f), except in parts of northeastern China and the alpine Qinghai-Tibet Plateau. In southern China, conversions from bare land to grasslands and from croplands to forests led to cooling, while in northern China, conversions from grasslands to forests and from croplands to grasslands led to warming, likely due to the dominance of albedo warming effects over evaporative cooling in dry regions (Li et al., 2016a).
Biogeochemical effects of land cover changes
LCCs induced a net carbon sink at the national level of 1.33 GtCO2 (Online Supplementary Figure S2), which translates to a BGC cooling (-0.000199 °C) (Figure 4a). Regionally, BGC cooling in southwest and northwest China (51.69% of LCC area) was linked to ecological restoration and crop expansion, whereas warming in the southeast and northeast was due to crop expansion and urbanization.
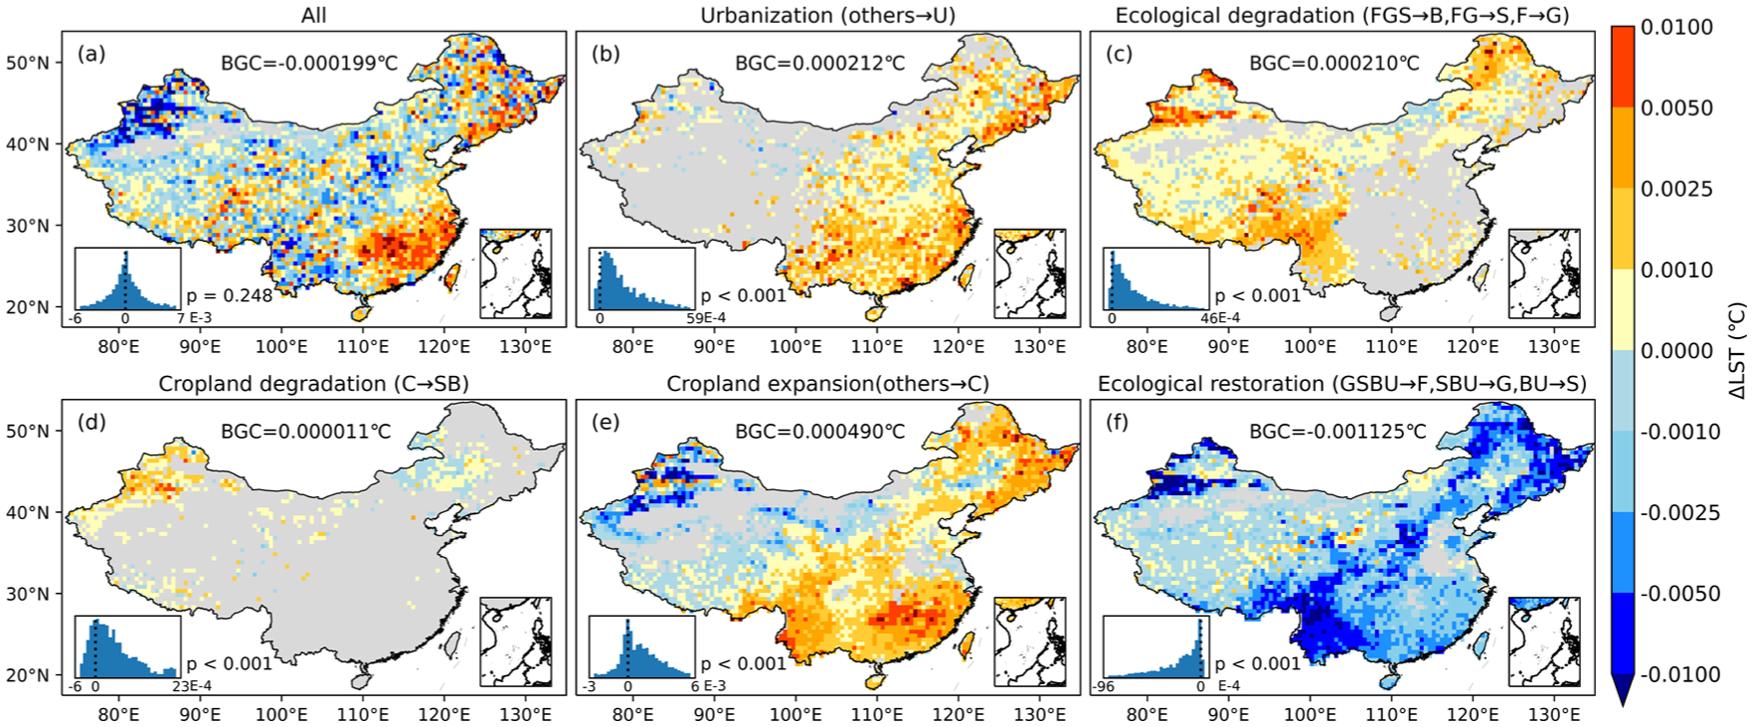
Biogeochemical effects of China’s Land cover changes. Spatial pattern of LST changes for all land cover changes (a), urbanization (b), ecological degradation (c), cropland degradation (d), cropland expansion (e), and ecological restoration (f) at 0.5°. Land conversions in each subplot are denoted as cropland (C), forests (F), grassland (G), urban land (U), sparse vegetation (S), and bare land (B). Histograms in the lower-left corner of the subplots show distributions of LST changes for each LCC category, with the statistical significance of the mean value by one-sample t-test annotated next to each histogram.
Most LCCs caused BGC warming, including urbanization (0.000212°C, Figure 4b), ecological degradation (0.000210°C, Figure 4c), cropland degradation (0.000011°C, Figure 4d), and cropland expansion (0.000490°C, Figure 4e). The greatest warming of urbanization was driven by the considerable carbon losses from soil and biomass when converting croplands, grasslands, and forests to impervious surfaces (Pouyat et al., 2002). Degraded vegetation associated with ecological degradation and cropland degradation caused warming due to a reduction in carbon density (Guo and Gifford, 2002), especially the conversion from forests to grasslands. Cropland expansion had contrasting BGC effects, shifting from a warming in the east to cooling in western China. In the humid eastern regions, cropland expansion emits carbon because the replaced natural vegetation, such as forests, has a higher carbon density than crops (Burke et al., 1989). In contrast, in the dry western regions, croplands receiving irrigation have a higher carbon density than natural grasslands or bare ground, in particular above-ground biomass carbon and soil inorganic carbon (Dun et al., 2021; Zi et al., 2025), leading to increased carbon stock (Emde et al., 2021).
Ecological restoration was the only LCC category that generated the most substantial BGC cooling (Figure 4f), across 83.26% of its LCC area, primarily due to conversions from croplands and grasslands to forests. The greatest cooling was observed during transitions from croplands or grasslands to forests in the southwest Hengduan Mountains, northeast Changbai Mountains, and northeast Greater Khingan Mountains and Tianshan Mountains.
Combined biogeophysical and biogeochemical effects of land cover changes
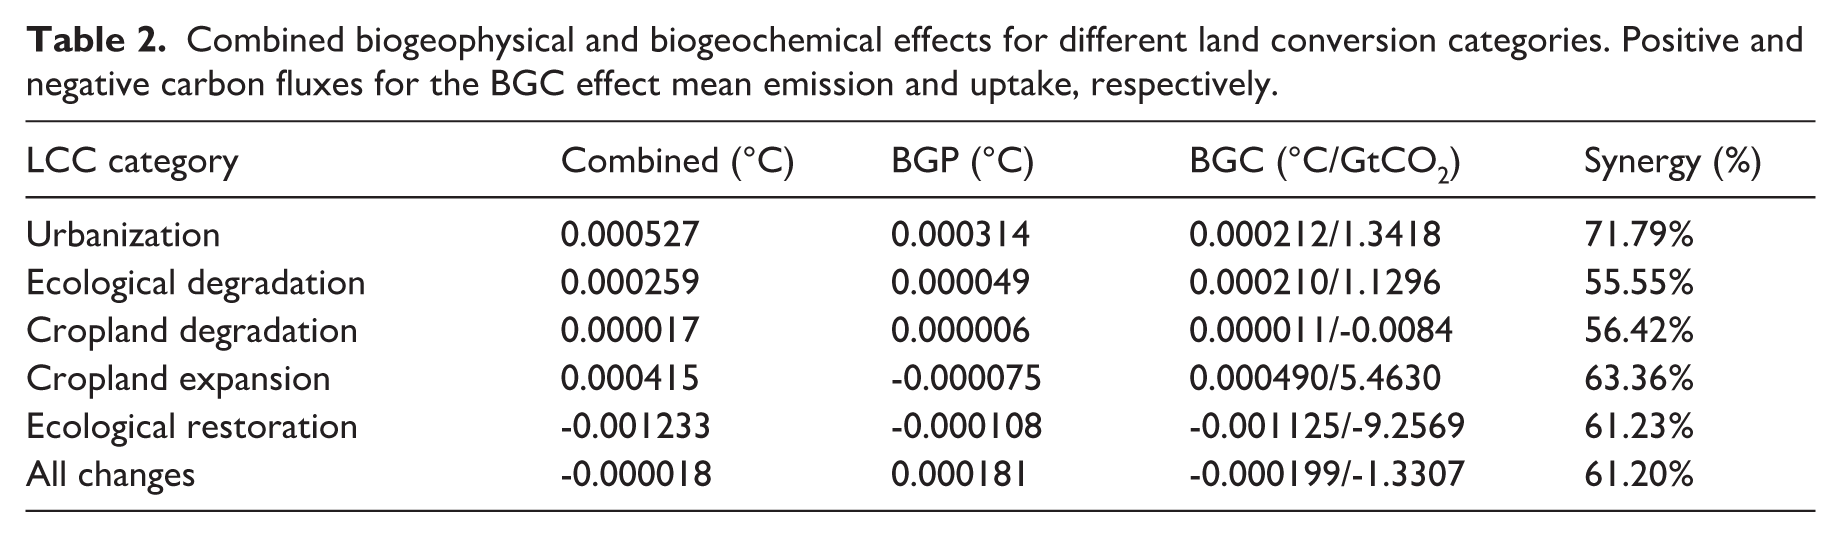
The combined BGC and BGP effects were determined by their synergy (with the same sign) and tradeoff (with the opposite sign), and the one with a greater magnitude determines the sign of the net effects. The BGC and BGP effects produced a net cooling of -0.000018°C (Table 2) at the national level due to their tradeoff, with BGC cooling (-0.000199 °C) partially offset by BGP warming (0.000181°C). The net cooling suggests that LCCs in China still serve as a mitigation against the greenhouse-gas-induced warming (Figure 5a).
Combined biogeophysical and biogeochemical effects for different land conversion categories. Positive and negative carbon fluxes for the BGC effect mean emission and uptake, respectively.
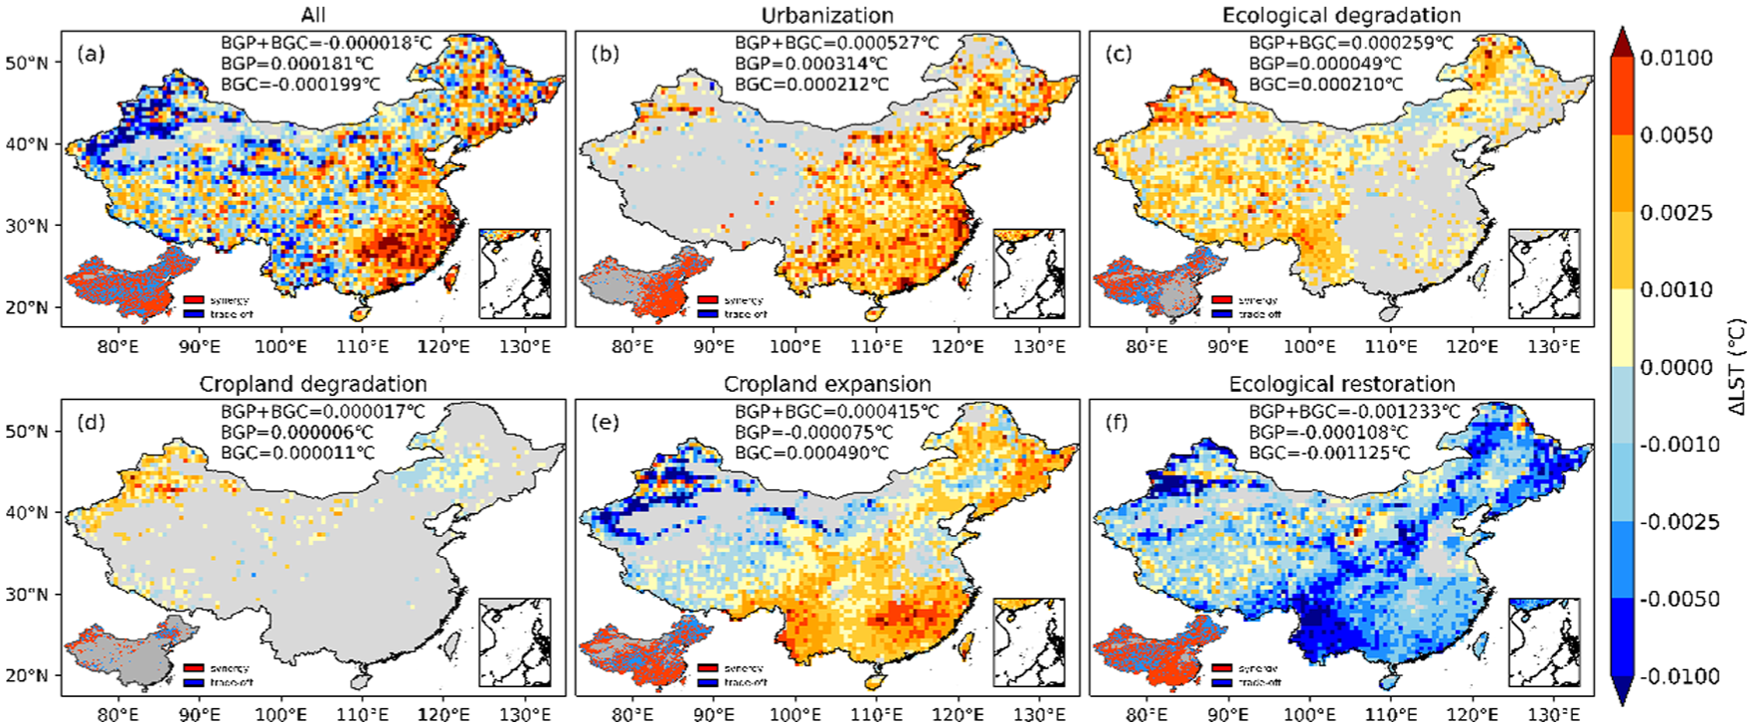
Combined biogeophysical and biogeochemical effects of land cover changes. Spatial pattern of LST changes for all land cover changes (a), urbanization (b), ecological degradation (c), cropland degradation (d), cropland expansion (e), and ecological restoration (f) at 0.5°. Inserted maps in the lower left parts show synergy (red regions) and trade-off (blue regions) of biogeophysical and biogeochemical effects.
Despite a national-level tradeoff, there was substantial heterogeneity in the combined BGC and BGP effects across regions and land conversion categories, characterized by strong warming in the eastern regions and cooling in the western regions. Locally, synergy was observed in 61.20% of LCC areas, indicating that the BGC and BGP effects more often enhance each other and produce stronger local impacts. Owing to a larger magnitude, BGC effects dominated over BGP effects in most LCC areas of China (79.96%, Online Supplementary Figure S3). This dominance also manifested in ecological degradation, cropland degradation, cropland expansion, and ecological restoration, except in the case of urbanization.
The combined net warming effects of ecological degradation (Figure 5c, 0.000259°C) and cropland degradation (Figure 5d, 0.000017°C) resulted from a synergy between BGP and BGC’s warming effects in more than 54% of their LCC areas. Such synergy also produced combined cooling (-0.001233°C) for ecological restoration, with the BGP effect enhancing BGC cooling by 9.6% (Figure 5f, synergy in 61.23% of LCC areas). However, a tradeoff cooling was present in the northeast high-latitude regions, as the ecological restoration-induced BGP warming partially offset the BGC cooling. Similarly, for cropland expansion, a tradeoff warming was found (Figure 5e, 0.000415°C), because BGC warming was mitigated by BGP cooling by 15.3%. Due to heterogeneity, 63.36% of the cropland expansion areas still showed synergy, suggesting that the cooling in the north and the warming in the south would be intensified. Unlike other LCC categories, the BGP effects of urbanization dominated the BGC effects with synergy in 71.79% of LCC areas, resulting in the strongest combined warming (0.000527°C) among all LCC categories (Figure 5b).
Discussion
Mechanisms of biogeophysical and biogeochemical effects
The biogeophysical effects of LCCs assessed in our study stem from the influence of altered biogeophysical properties, such as ET and albedo, and their associated radiative and non-radiative processes (Bright et al., 2017). For conversion between vegetation, since natural vegetation generally has a higher ET (cooling effect) and lower albedo (warming effect), the loss of natural vegetation associated with ecological degradation, cropland degradation, and cropland expansion leads to warming through reduced ET cooling. Conversely, vegetation gain through ecological restoration generates cooling through strengthened ET (Chen et al., 2022; Li et al., 2024a). However, in northeast China at high latitudes, because albedo effects outweigh ET effects under a cold climate (Hasler et al., 2024), vegetation gain and loss result in warming and cooling, respectively, which is consistent with studies for boreal and arid regions (Alkama and Cescatti, 2016; Li et al., 2015; Perugini et al., 2017; Rohatyn et al., 2022). For urbanization, BGP warming effects arise from reduced ET due to vegetation removal, increased impervious surfaces, and anthropogenic heat release (Bo et al., 2018; Manoli et al., 2019; Yang et al., 2019).
LCCs affect the carbon cycle by disturbing biomass and soil carbon storage, and their influence on climate depends on whether carbon is released or absorbed. When LCCs such as vegetation restoration enhance carbon storage, a BGC cooling effect is generated, as observed in most of our study area. In contrast, LCCs with vegetation loss, such as ecological degradation, cropland degradation, and urbanization, show BGC warming. Certain LCCs have opposite BGC effects depending on the location. Cropland expansion in arid areas has a BGC cooling effect, rather than a warming effect, as observed in southern China. This is because human activities, such as irrigation, result in higher biomass and carbon density in croplands of drylands than in natural vegetation (Zi et al., 2025). For urbanization, we considered only LCC-induced carbon density changes in this study, which may underestimate the BGC effects of urbanization, as substantial carbon emissions from fossil fuel combustion occur in urban areas (Huo et al., 2022). If considered, these would significantly increase the BGC effects above current estimates.
Synergy and tradeoff between biogeophysical and biogeochemical effects
Our results indicate a broad synergy between BGP and BGC effects, driven by coordinated changes in carbon and biogeophysical factors across most LCC areas of China. Vegetation gain increases biomass and soil carbon as well as ET, thereby promoting cooling from both BGC and BGP perspectives, whereas vegetation loss yields a synergistic warming. Tradeoffs mainly stem from spatial variations in biogeophysical effects. They are more likely to occur during land cover conversions in arid and snow-covered cold regions, where limited ET and strong albedo effects prevail (Rohatyn et al., 2022) (e.g., the northeast and drylands of China). Under these circumstances, BGP effects can either mitigate the BGC warming or offset the cooling associated with different land conversions. For instance, BGP warming of ecological restoration in high-latitude areas would weaken BGC cooling effects (Kristensen et al., 2024). In contrast, BGP-driven warming of urbanization would intensify BGC warming across most areas.
In terms of magnitude, the BGC effects are greater than the BGP effects and thus dominate local LST change in most of China, consistent with previous studies that employed similar methods (Li et al., 2024b; Windisch et al., 2021). Since locally emitted carbon is well-mixed in the atmosphere, BGC effects on climate are not confined to local LCC areas but are manifested globally. Therefore, the comparison between BGP and BGC effects relies on translating BGC effects from CO2 emissions to LST changes via TCRE and from global to local changes via a scaling factor. The reference global area selected for local scaling (Equation (8)) affects the magnitude of estimated local equivalent LST changes. A smaller reference global area, such as the global land area (Shen et al., 2025; Zhu et al., 2023), leads to a mathematically smaller value than our selection of Earth’s land surface area and affects the regional dominance between BGP and BGC effects (reducing the BGC dominance from 79.76% of LCC area in Online Supplementary Figure S3 to 71%). Compared with other metrics, such as radiative forcing (Betts, 2000; Zhao and Jackson, 2014) and Greenhouse gas values (Anderson-Teixeira et al., 2012), the benefit of TCRE is that it incorporates complex Earth system feedback (e.g., non-radiative and nonlocal processes), serving as a more holistic measure to bridge BGC and BGP processes and representing LCC impacts in more intuitive LST changes than the CO2-equivalent metric (MacDougall and Friedlingstein, 2015).
Although the national-level net cooling of LCCs combining BGP and BGC effects from all land conversions appears small (-0.000018°C) relative to observed temperature changes and variability, the small national signal is expected because it reflects the complex and spatially varying synergistic and tradeoff relationships between BGP and BGC effects that may cancel each other across different land conversion categories (Table 1). On the one hand, the net combined effects are a consequence of overall BGP warming and BGC cooling of similar magnitude, which counteract each other. On the other hand, the spatially heterogeneous warming and cooling associated with each LCC category of either BGP or BGC processes also cancel out each other. Technically, the LCC-induced LST changes, which only occurred in 5.87% of China’s land area and only a fraction of land at each grid, are muted when averaging over the entire national land. Last but not least, we emphasized that LCCs have a greater impact at the local scale than at the regional scale, with ecological and social implications for agriculture, human health, and so on.
Uncertainty and limitation
We employed a space-for-time method to quantify the impact of LCCs on LST using a potential effect based on multi-year average differences in LST between stable land covers (Li et al., 2015), which differs from estimates based on temporal changes in LST from actual land conversion processes (Alkama and Cescatti, 2016; Li et al., 2016b). The real-world LCCs are typically dynamic and occur at a finer scale, often involving land management and degradation processes without a change in land classification (De Hertog et al., 2022). The increasing human management complicates the impacts of LCC (Luyssaert et al., 2014). These more complex land cover and land use change dynamics need further exploration to understand their climate consequences.
For the BGP effects of LCC, we only considered the local effects within LCC areas (Luo et al., 2024). Nonlocal biogeophysical effects may occur in areas without LCCs driven by atmospheric and oceanic feedbacks (Davin and de Noblet-Ducoudré, 2010; Li et al., 2020; Luo et al., 2024). These nonlocal BGP effects, such as those from deforestation, may influence the carbon stock of ecosystems in remote non-LCC areas (Li et al., 2022). However, since the magnitude of nonlocal effects depends on the spatial extent of LCCs (Winckler et al., 2019a), quantifying these effects requires climate model simulations with active land-atmosphere interactions, which cannot be accounted for by the time-for-space approach using observational data. Yet, existing modeling evidence indicated a dominance of nonlocal effects in global deforestation experiments (Winckler et al., 2019a), and stronger local (−1°C) than nonlocal effects (0.1–0.4°C) for afforestation in China (Chen et al., 2022). How nonlocal effects would change the combined effects of LCCs needs further investigation.
To combine BGP and BGC effects, we used TCRE from CMIP5 models. However, TCRE also exhibits spatial variations and model dependency, which affect the quantification of BGC effects. Higher TCRE values correspond to greater LST changes for the same amount of carbon emission, as seen in high-latitude regions (Pithan and Mauritsen, 2014) and models with higher climate sensitivity. CMIP6 Earth system models tend to exhibit slightly higher TCRE values than CMIP5, with an effective TCRE of about 2.1 [1.8–2.6] °C per 1000 PgC, mainly due to changes in effective radiative forcing, physical feedbacks, and ocean heat uptake (Cox et al., 2024; Williams et al., 2020). The estimated effects presented in our study are subject to various methodological (e.g., space-for-time approach, global-to-local scaling) and data uncertainties (e.g., land cover, LST, TCRE, and carbon density) and should be interpreted with caution. For example, uncertainty in land cover data and inconsistent definitions of forests (Li, 2017) lead to an underestimation of the increase in forest area in this study compared to the national forest inventory (The Chinese State Forest Administration, 2019), which affects the estimation of BGC and BGP effects.
Although we focused on the impacts of LCCs on local LST, it is important to note that satellite-derived LST is a distinct temperature metric from the near-surface air temperature used in climate assessment studies (Winckler et al., 2019b). Moreover, how transferable the LST effects are to air temperature remains an ongoing research question (Li et al., 2025).
Conclusions
This study quantified the combined BGP and BGC effects of land cover changes on LST in China over the past 20 years. Our results showed that 5.87% of China’s areas experienced LCCs, driven by land conversions from ecological restoration, cropland expansion, urbanization, ecological degradation, and cropland degradation. These LCCs generated a combined cooling effect (-0.000018°C) at the national level, especially in the western regions, where LCC cooling can partially mitigate the warming caused by fossil fuel emissions. The net cooling is contributed by a BGC cooling (-0.000199°C) offset by a BGP warming (0.000181°C). BGC effects dominated local LST changes, while BGP effects act as a synergy in most LCC areas. The combined effects, their synergy, and trade-offs varied spatially and across land conversion categories, offering an opportunity to maximize the climate benefits of LCC through targeted LCCs in specific areas. Our findings underscore the importance of considering both BGP and BGC effects when assessing the impacts of LCCs, providing valuable insights for land management and natural climate solutions.
Supplemental Material
sj-docx-1-tee-10.1177_2754124X261437704 – Supplemental material for Biogeochemical cooling offsets biogeophysical warming from land cover changes in China from 2000 to 2020
Supplemental material, sj-docx-1-tee-10.1177_2754124X261437704 for Biogeochemical cooling offsets biogeophysical warming from land cover changes in China from 2000 to 2020 by Hangzheng Zhong, Yan Li, Yongzhe Chen, Duqi Liu, Hongwen Chen, Shan Sang, Huiqing Lin and Chengcheng Hou in Transactions in Earth, Environment, and Sustainability
Footnotes
Acknowledgements
Author Contributions
Funding
The authors disclosed receipt of the following financial support for the research, authorship, and/or publication of this article: The study is supported by the National Natural Science Foundation of China (no. 42371102).
Supplemental material
Supplemental material for this article is available online.
Author biographies
References
Supplementary Material
Please find the following supplemental material available below.
For Open Access articles published under a Creative Commons License, all supplemental material carries the same license as the article it is associated with.
For non-Open Access articles published, all supplemental material carries a non-exclusive license, and permission requests for re-use of supplemental material or any part of supplemental material shall be sent directly to the copyright owner as specified in the copyright notice associated with the article.