
Abstract
Ecosystem services (ESs) constitute essential ecological capital that supports human well-being and underpins regional sustainable development at the sub-catchment scale. The provision of these services is influenced by the availability of water resources and shaped by spatiotemporal hydrological variability. In the context of global climate change and intensified urbanization, quantifying the dynamic equilibrium of water-related ESs has become a central challenge in sustainability science. Despite growing interest, substantial knowledge gaps remain regarding the spatiotemporal evolution of water-related ESs and their interactions within network structures. This study focuses on the Dongjiang River Basin, a critical water source for major metropolitan regions including Shenzhen, Hong Kong, and Dongguan, to evaluate the combined impacts of water quantity and quality on ecosystem functioning. Four principal water-related ESs are examined. Employing the InVEST model, along with statistical analyses, we assessed the trade-offs and synergies among these services and constructed an ecological service network at the sub-watershed scale from 2000 to 2020. Results indicate a general decline in water-related ESs, accompanied by pronounced spatial heterogeneity. A total of 218 ES networks were identified across 224 sub-catchments, classified into seven types and 27 subtypes according to service node composition and the presence of dominant nodes. Networks with balanced service node development accounted for 34.8%, while those dominated by one or two key services comprised 65.2%. This suggests that interconnections among ESs are often concentrated within specific sub-watersheds. Water yield frequently exhibited trade-offs with other services, thereby increasing structural complexity within the network. Over time, the region's ecosystem service network has transitioned from diversified functions to a structure primarily driven by soil conservation and water purification. These findings highlight the importance of prioritizing restoration efforts in urbanized sub-catchments, particularly those with critical demand for water purification and soil retention functions.
Keywords
Introduction
China’s ecological civilization strategy depends on the sustained provision of ecosystem services (ESs) to support its objectives of sustainable development and improved human well-being (Costanza et al., 2017; Xie et al., 2015). Among these, water-related ecosystem services serve as foundational components for regional sustainability in densely urbanized regions, where both the quality and quantity of water resources directly affect the capacity to deliver these services (Ouyang et al., 2004). Climate change and urban expansion have introduced increased uncertainty in the supply and delivery of water-related ESs, exacerbating water scarcity and intensifying the tension between hydrological provisioning and urban water demands (Hao and Sun, 2021; Khosravi Mashizi and Sharafatmandrad, 2021; Shi et al., 2020; Xia et al., 2025). Freshwater provisioning plays a key regulatory role in hydrological cycles and water quality, and is widely regarded as an indicator of ecosystem security (Bergsten et al., 2014; Burkhard et al., 2014). Accordingly, understanding the spatial dynamics of water-related ESs—particularly the flow from supply to demand—is critical for assessing their interactions, trade-offs, and synergies in the context of a rapidly changing environment (Boithias et al., 2014; Huang et al., 2022).
River hydrological networks serve as key mediators between social and ecological systems, facilitating functions such as irrigation (Chen and Olden, 2017), freshwater supply (Wang et al., 2020), and hydropower generation (Ziv et al., 2012). These functions exemplify the dynamics of coupled social-ecological systems (Sayles et al., 2019). In recent years, network analysis has emerged as an effective method for quantifying ecosystem service (ES) interconnections at regional scales, contributing to improved resource management strategies and enhancing the resilience of socio-ecological systems through adaptive governance (Felipe-Lucia et al., 2022). Widely adopted in natural resource management, network analysis has proven valuable in addressing cross-scale ES linkages (Bodin, 2017; Zhang et al., 2021). ES network analysis is structured around three fundamental components: nodes, linkages, and the overall network. By integrating these elements, it allows for the multi-scale quantification of interactions within complex socio-ecological systems (Bergsten et al., 2014). These networks model spatial relationships between social and ecological actors, offering insights into ES trade-offs and synergies (Fan et al., 2020). Unlike linear models, watershed-scale river systems exemplify spatially explicit socio-ecological networks, where hydrological connectivity governs interactions between human and water systems (Ma et al., 2020). ES networks conceptualize watersheds as coupled human-water systems, wherein sub-watersheds, cities, and artificial water intake infrastructure interact through exchanges of water quantity and quality (Jiang et al., 2023; Kummu et al., 2016). Recent advancements in graph theory and computational modeling have further enabled the systematic exploration of socio-ecological feedback loops, using topological mapping and functional system analysis to characterize network structures (Bodin et al., 2019; Wang et al., 2022).
Rapid urban expansion has placed significant pressure on water security in the Dongjiang River Basin, pushing it below internationally recognized water stress thresholds (Shen and Liu, 2023). Despite this challenge, the evolving relationship between freshwater supply and demand—and its interaction with water-related ecosystem services (ESs)—remains insufficiently understood. In response, this study selects the Dongjiang River Basin as a representative case for investigating the spatial and temporal dynamics of the social-ecological networks that govern water-related ESs. The specific objectives are threefold: (1) To analyze the spatiotemporal changes and trade-offs or synergies among four key water-related ESs in the Dongjiang River Basin from 2000 to 2020; (2) To quantify the spatial patterns of water-related ecosystem service networks; (3) To examine the co-evolution characteristics of these networks over time.
Materials and methods
Study area
The Dongjiang River (22°38’–25°14’N, 113°52’–115°52’E), located in southern China, forms an important tributary of the Pearl River system (Figure 1). The basin spans approximately 35,340 km² and extends 562 km in length, representing 5.96% of the total Pearl River Basin. The region experiences a subtropical monsoon climate, characterized by distinct wet (April–September) and dry (October–March) seasons. The mean annual temperature ranges from 20°C to 22°C. Precipitation in the basin exhibits notable spatial and temporal variability, with annual rainfall totals ranging from 1500 to 2400 mm. More than 80% of precipitation occurs during the wet season (Jiang et al., 2023). The mean annual runoff coefficient is 0.53, while evapotranspiration averages between 1000 and 1400 mm per year (Lin et al., 2011). Total groundwater resources are estimated at approximately 33 billion m³. Although the region possesses abundant water resources, high external demand from major urban centers such as Guangzhou, Shenzhen, and Hong Kong impose considerable pressure on the basin. Current per capita water availability is approximately 1100 m³/year for a population exceeding 40 million—well below the 2000 m³/year benchmark for moderate water scarcity and approaching levels indicative of severe water stress.
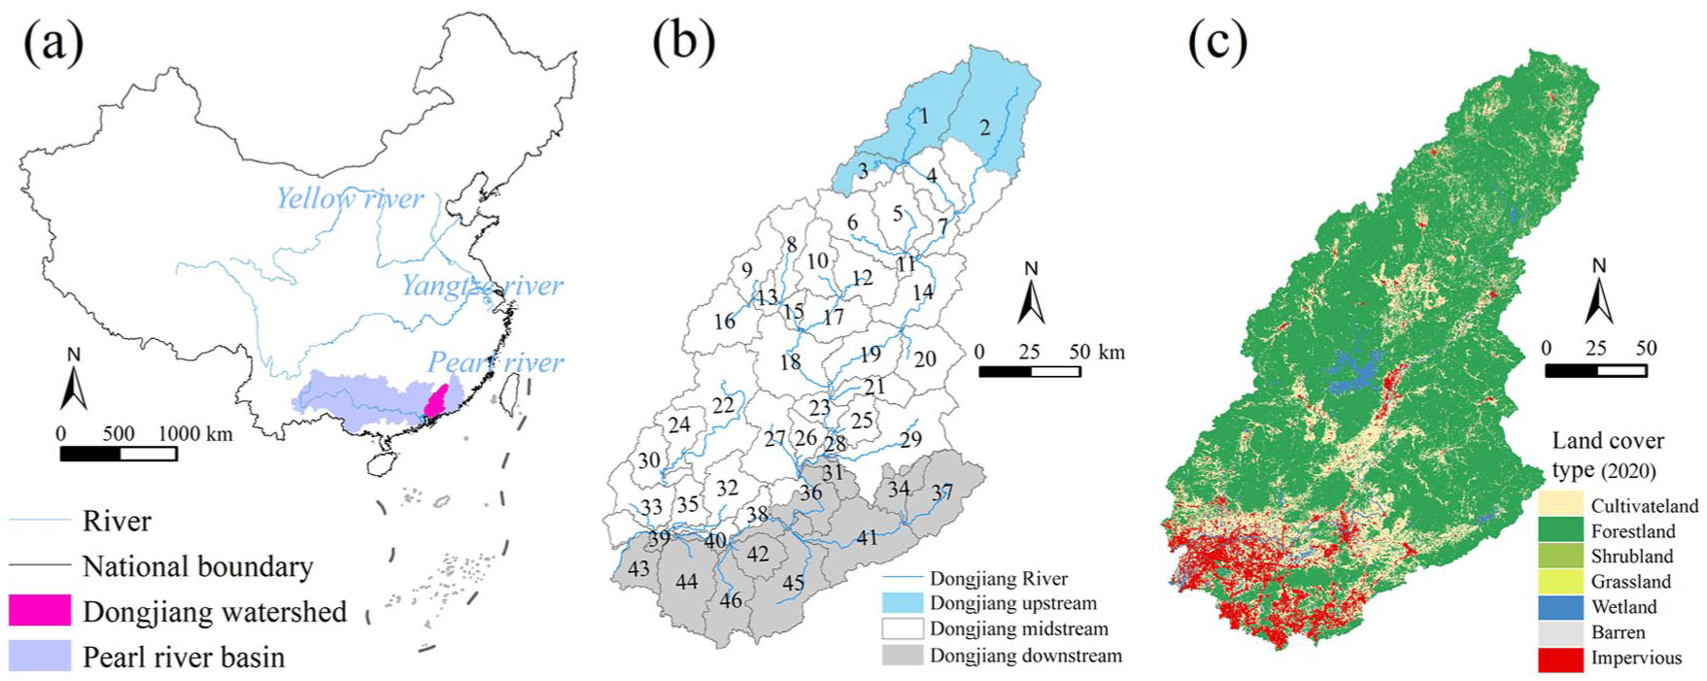
The study area: (a) Location, (b) Sub-watershed network, (c) Land use/land cover types.
Data sources
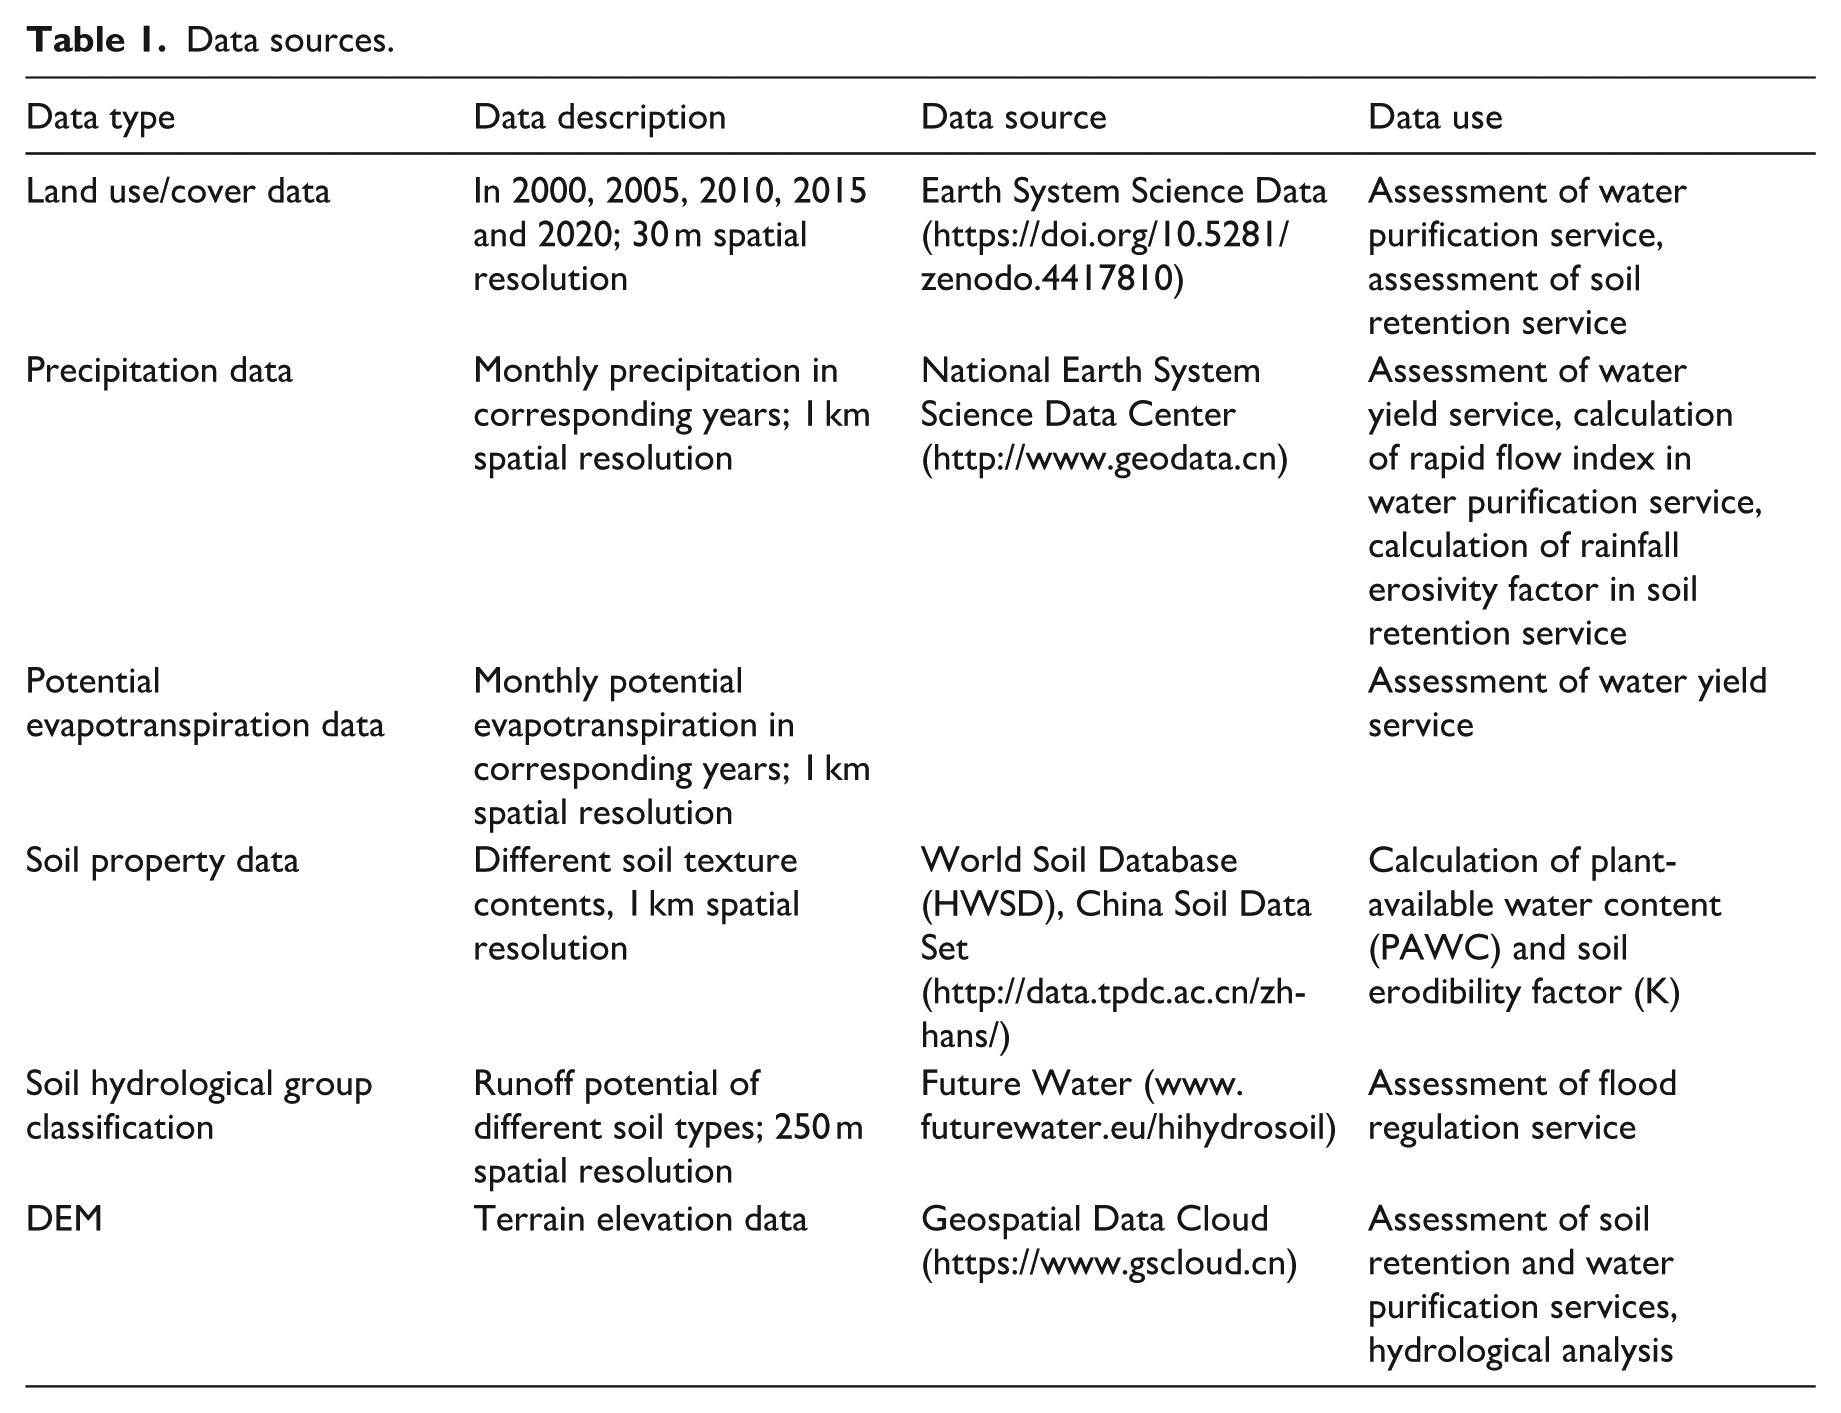
This study utilized five primary data types (Table 1). Land use and land cover information was derived from the China Land Cover Dataset (CLCD), provided by the Earth System Science Data Center (https://loess.geodata.cn/index.html). The dataset offers 30-meter spatial resolution and classifies land into nine categories: cropland, forest, shrubland, grassland, water, snow/ice, bare land, impervious surface, and wetland (Yang and Huang, 2021). Climate data, including monthly precipitation and potential evapotranspiration from 2000 to 2020, were obtained from the National Earth System Science Data Center (www.geodata.cn). Soil characteristics—such as texture (sand/silt/clay proportions), organic carbon content, and bulk density—were sourced from the Harmonized World Soil Database (HWSD), with a spatial resolution of 1 km (http://data.tpdc.ac.cn/zh-hans/). Information on soil hydrological groups was extracted from Future Water’s Global Soil Hydraulic Properties Database, offering a 250-meter resolution (www.futurewater.eu/hihydrosoil) (Zhang et al., 2018). Additionally, digital elevation model (DEM) data with 30-meter resolution were retrieved from the Geospatial Data Cloud (www.gscloud.cn). To ensure consistency, all datasets were resampled to a common spatial resolution of 250 meters and standardized to the same watershed boundary and WGS 84 coordinate projection.
Data sources.
Methods
Research framework
To quantify the relationships among water-related ecosystem services (ESs) and to examine the evolution of social-ecological impacts within their network structures, this study applies a network-based analytical framework informed by several potential network typologies (Yu et al., 2023). The four focal ESs—water yield (WY) for provisioning, nitrogen output ratio (NR) for water purification, soil retention (SR) for conservation, and urban flood regulation (UF) for hazard mitigation—are intrinsically linked through the hydrological cycle of the river basin. Their interdependence underscores the complexity of constructing ecosystem service networks aimed at informing sustainable water resource management.
Terrestrial ecosystems strongly influence these water-related ESs, particularly through land cover change. Within the broader context of coupled social-ecological systems, the interactions among these services can be analyzed using concepts of hydrological connectivity, trade-offs and synergies, and network theory. Hydrological connectivity governs the spatial and functional provision of dynamic ES flows to meet local demands; however, this connectivity is increasingly disrupted by anthropogenic pressures such as land cover transformation, climate change, and urban expansion. Accordingly, this study investigates the interactions among the four ESs described above, as conceptually outlined in Figure 2.
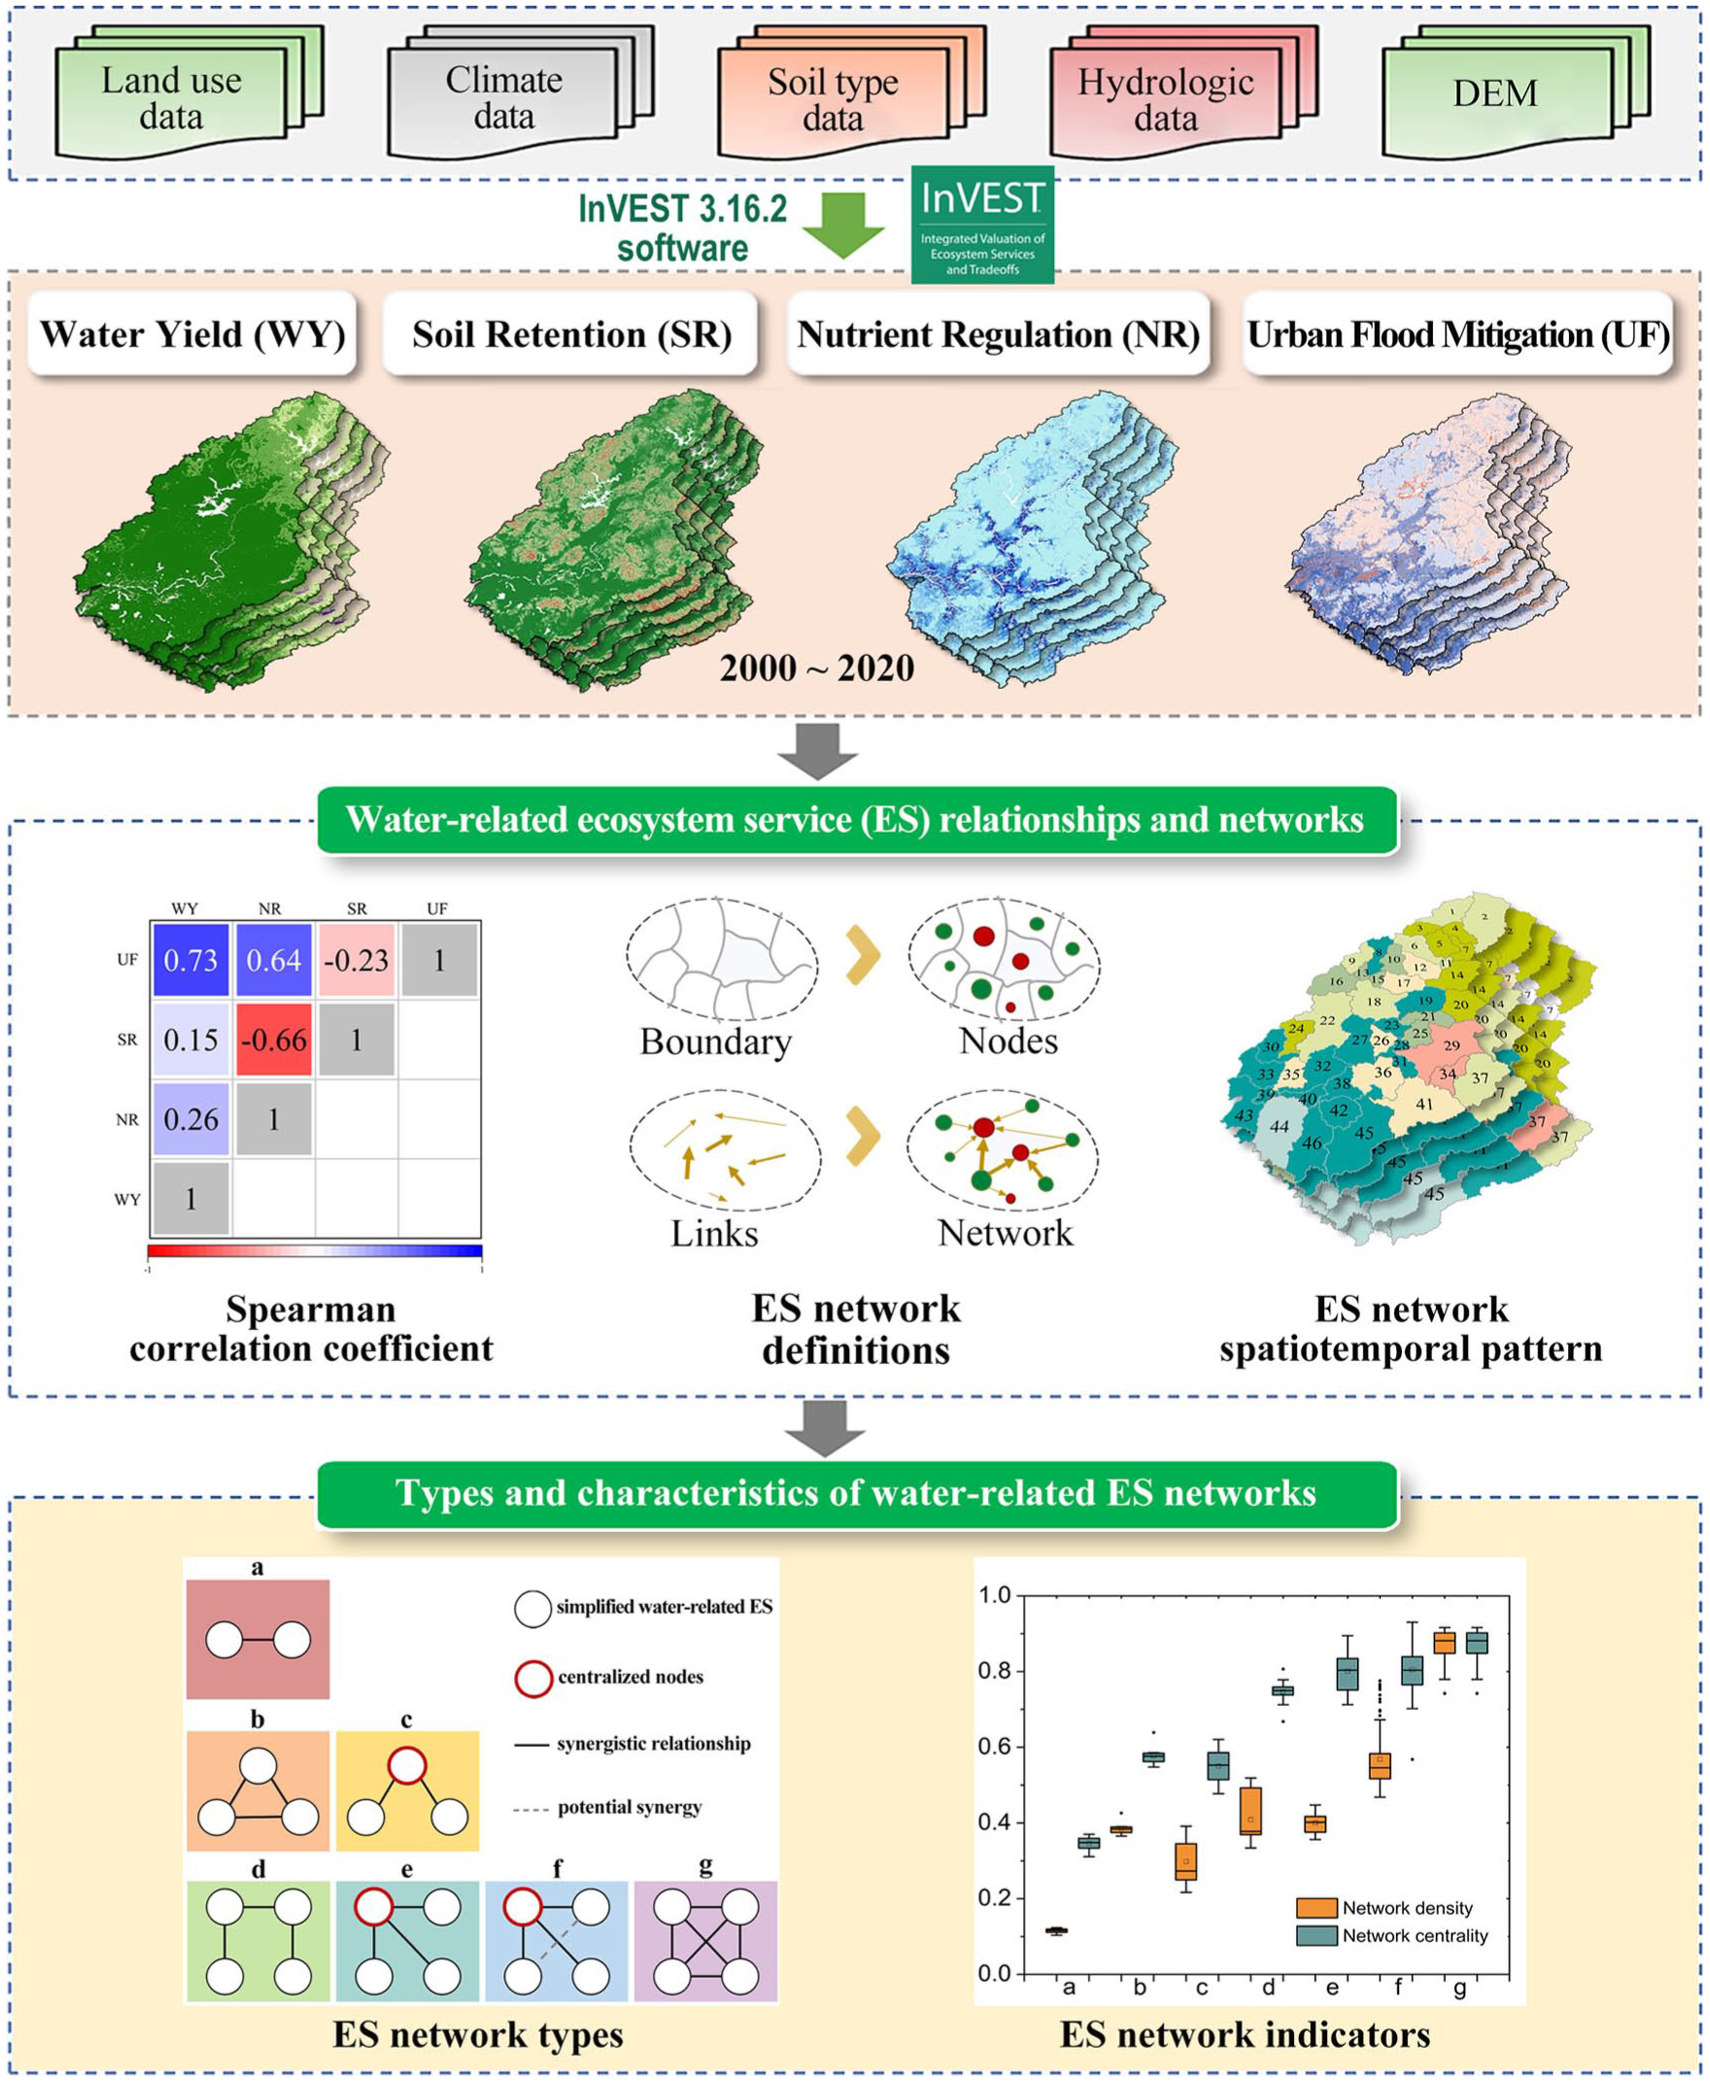
The research framework.
Water-related ESs quantification
The four selected ecosystem services—water yield (WY), soil retention (SR), water purification represented by nitrogen output ratio (NR), and urban flood regulation (UF)—were quantified using the InVEST 3.16.2 model for the period 2000 to 2020, with calculations conducted at five-year intervals (Natural Capital Project, 2025).
Water Yield (WY):
WY was estimated based on water balance principles, where water production is calculated as the difference between annual precipitation and actual evapotranspiration. The model incorporates input variables such as annual precipitation, potential evapotranspiration, plant-available water content, and root zone depth. The calculation follows the formula:

Where S(x) is the annual water yield of grid x; PRE (x) is the annual precipitation of grid x; and AET (x) is the annual actual evapotranspiration of grid x. Among them, AET (x)/PRE (x) is obtained based on the hydrothermal equilibrium assumption formula based on the Budyko curve.
2. Soil Retention (SR):
Soil conservation is a widely accepted indicator for assessing soil retention capacity. In this study, the soil delivery ratio approach—based on the Revised Universal Soil Loss Equation (RUSLE)—was employed. Under this framework, soil retention is defined as the difference between potential and actual soil erosion. The calculation follows the equation:


Where R is rainfall erosivity factor (MJ·mm)/(hm2·ha); K is soil erodibility factor; L is slope length factor; S is slope factor; C is land cover and vegetation management factor; and P the factor of soil and water conservation measures.
3. Water Purification – Nitrogen Output Ratio (NR):
Water purification services were assessed using the nutrient load model embedded in the InVEST platform. This model quantifies the contributions of vegetation cover, soil adsorption, nutrient migration, and biogeochemical transformation processes in reducing nitrogen pollutants in surface runoff. The formulation is given as follows:


Where
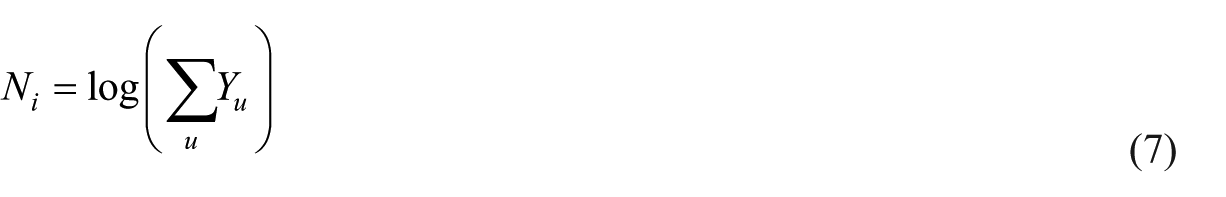
4. Urban Flood Regulation (UF):
Urban flood regulation services were quantified using the runoff retention index, which characterizes the landscape’s capacity—particularly its infrastructure and land cover composition—to mitigate flood risk. The associated calculation is as follows:
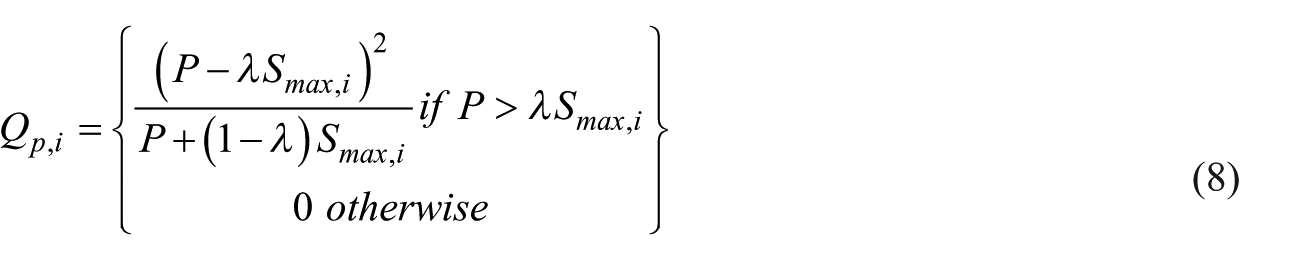
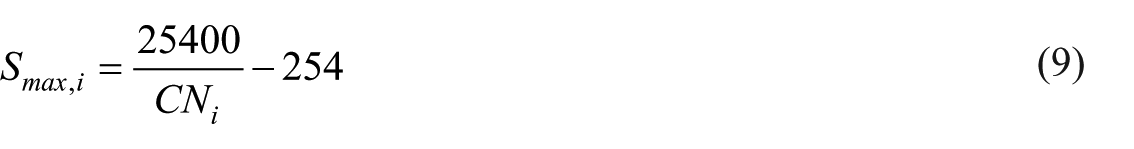
Where
All four ecosystem services were simulated using the InVEST model. To evaluate the reliability of the modeling results, we compared our outputs with those from previous studies conducted in the Pearl River Delta and broader Pearl River Basin. As illustrated in Figure 3, the estimated values for water yield (WY), soil retention (SR), and nitrogen output ratio (NR) in this study were generally higher than those reported in prior literature (Hu et al., 2019; Li et al., 2022, 2023; Liao et al., 2024; Liu et al., 2022a; Zhang et al., 2021).
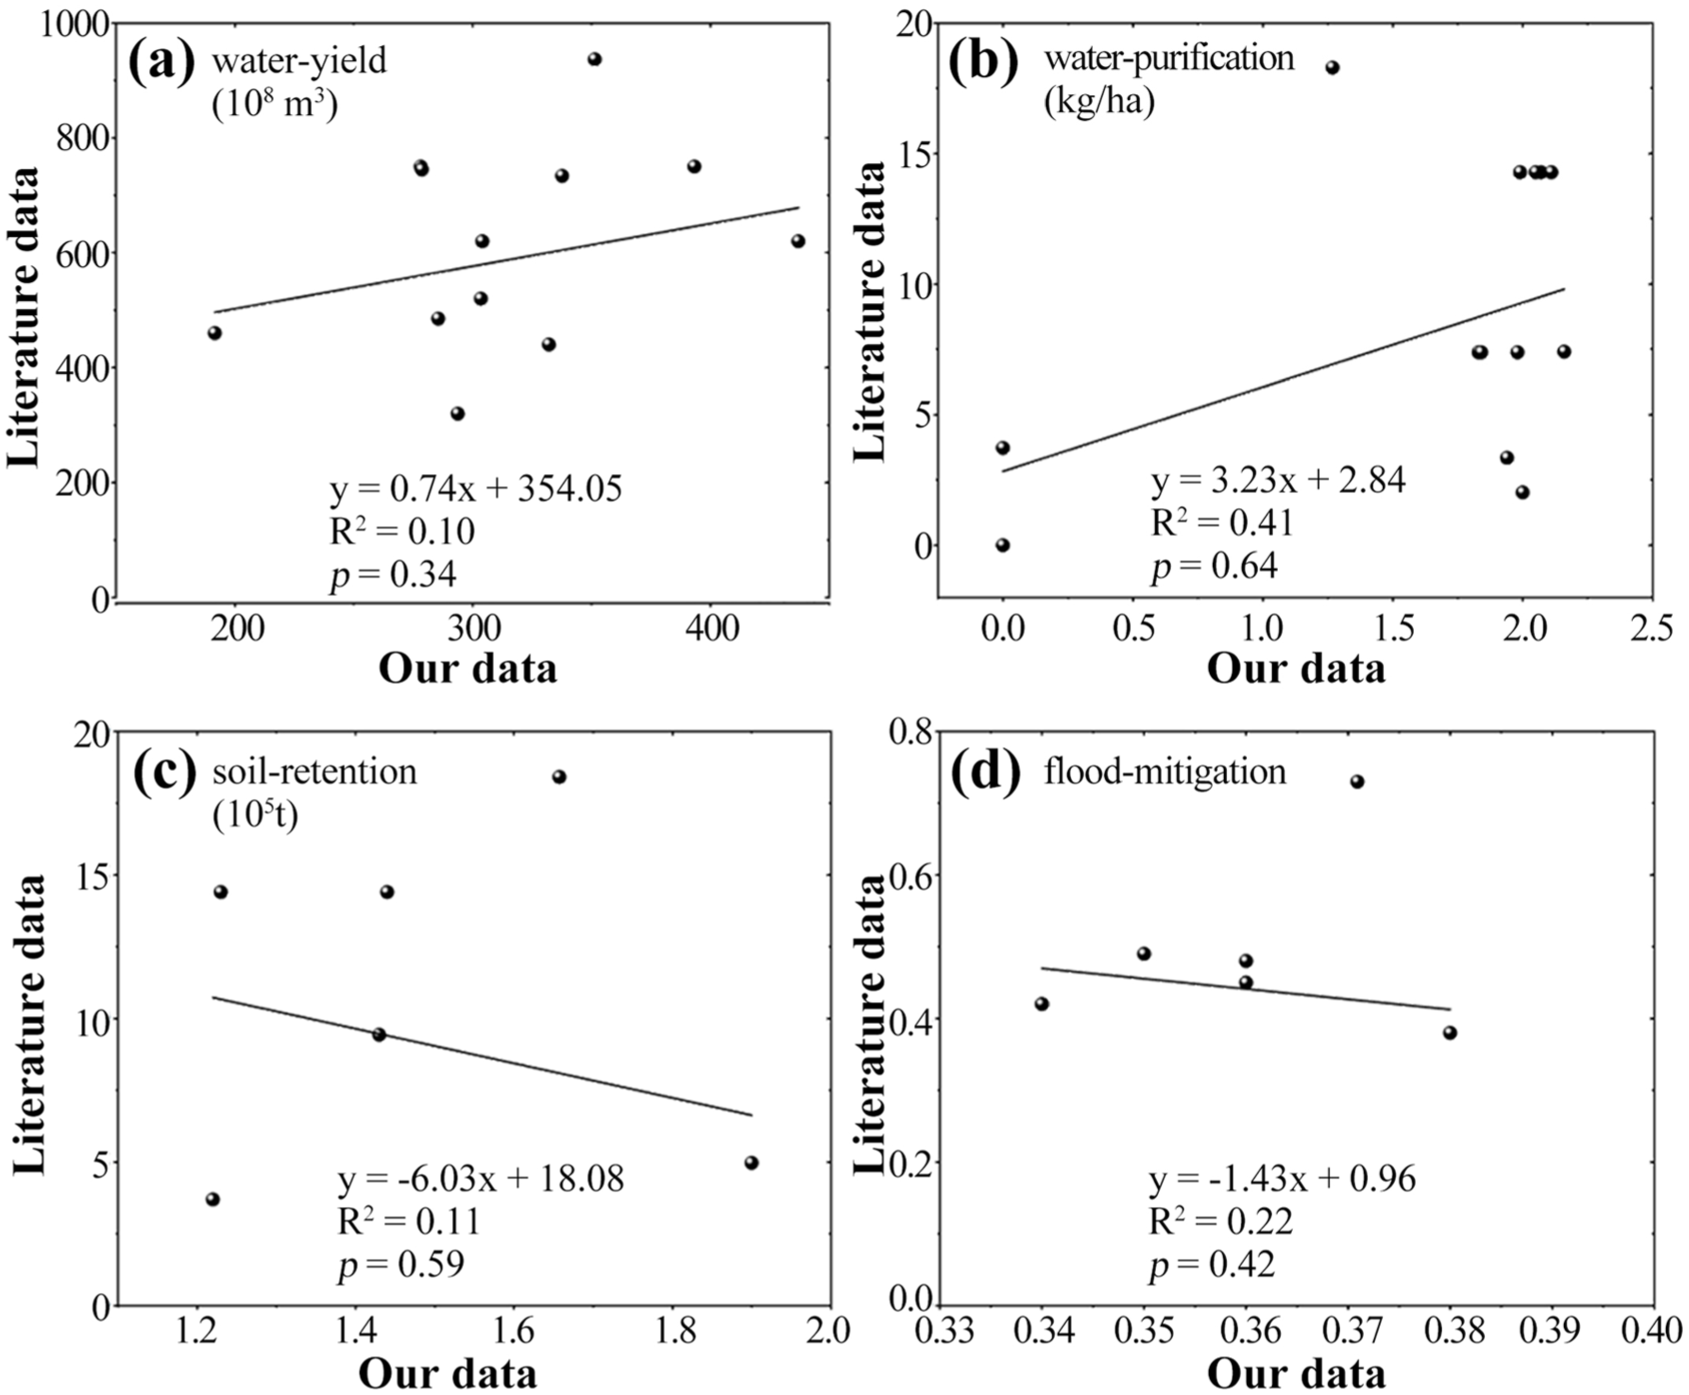
Comparing this study with other similar studies of modelled water-related ESs in this region. (a) Water yield; (b) Water purification; (c) Soil retention; (d) Urban flood mitigation.
Water-related ESs network analysis
To examine the interrelationships among the four water-related ecosystem services over the 2000–2020 period, Spearman correlation coefficients were calculated at the sub-watershed level (Chen et al., 2021; Shi et al., 2023). The correlation formula is expressed as follows:

Where
To enable consistent comparison across different ecosystem services, a Min-Max normalization technique was applied. This method standardizes each service value to a scale ranging from 0 to 1:
Where
To evaluate spatial heterogeneity in trade-off or synergy relationships among ecosystem services, the root mean square error (RMSE) metric was applied, calculated as follows:

Where
In this study, network analysis was conducted based on relative comparisons among ecosystem services, rather than on absolute value changes. Specifically, only those sub-basins where trade-off values exceeded 50% were retained to construct the water-related ecosystem service network. The resulting network was categorized into seven structural types, defined by the interactions among water yield, soil retention, water purification, and urban flood regulation services (Yu et al., 2023). These types—illustrated in Figure 2 —represent distinct configurations of ecosystem service relationships: Type a: Two interacting service nodes; Type b: Three nodes forming a closed loop; Type c: Three links with one dominant (key) service node; Types d, e, f, g: Combinations involving all four ESs, with varying configurations of key node prominence.
To further describe and analyze the structure and evolution of the ecosystem service networks, two key metrics were employed: network density and network centrality (Wang et al., 2020).
Network density (D) quantifies the overall closeness of relationships among different ES nodes within a network. A higher density value indicates stronger interconnections between services. The metric is calculated using the following formula:
Where
Network centrality (Cen) measures the relative importance of each service node within the network. Nodes with higher centrality are more influential, occupying pivotal positions in the system's structure. The corresponding formula is:
Where
Results
Spatiotemporal changes of water-related ESs
The spatial distribution of water-related ecosystem services (ESs) from 2000 to 2020 is illustrated in Figure 4. Overall, water provisioning services declined over the two-decade period, with total water yield decreasing from 33.7 billion m³ to 28.5 billion m³, and per-hectare yield falling from 9974 to 8266 m³/ha. This trend corresponds with variations in annual precipitation. Spatially, downstream areas consistently exhibited higher levels of water provisioning, while the middle and upper reaches experienced greater fluctuations (Figure 4, a–e). Soil conservation services ranged from 1.92×10⁸ to 1.23×10⁸ tons, with an average of 1.44×10⁸ tons. Per-hectare soil retention decreased from 281.27 t/ha to 242.12 t/ha. Spatial distribution patterns show stronger soil retention in the northwest, especially in areas with pronounced topographic relief, and lower values in flat, urbanized downstream regions along the Dongjiang River's main channel (Figure 4, f–j). Water purification services demonstrated an initial increase followed by a decline. Between 2000 and 2020, the average nitrogen output per unit area decreased from 2.16 kg/ha to 1.95 kg/ha, while total nitrogen output declined from 72.16×10⁵ kg to 65.55×10⁵ kg. Forested regions showed high purification capacity, whereas urbanized areas in the middle and lower reaches exhibited notably reduced capacity (Figure 4, k–o). Flood regulation services remained relatively stable from 2000 to 2010, followed by a decline from 2010 to 2020. The runoff retention index across the five observation periods averaged 0.36, 0.34, 0.35, 0.38, and 0.36, respectively. Higher retention values were observed in select upstream areas, while the midstream zone displayed widespread moderate retention. Downstream regions characterized by high urbanization exhibited the lowest retention values (Figure 4, p–t).
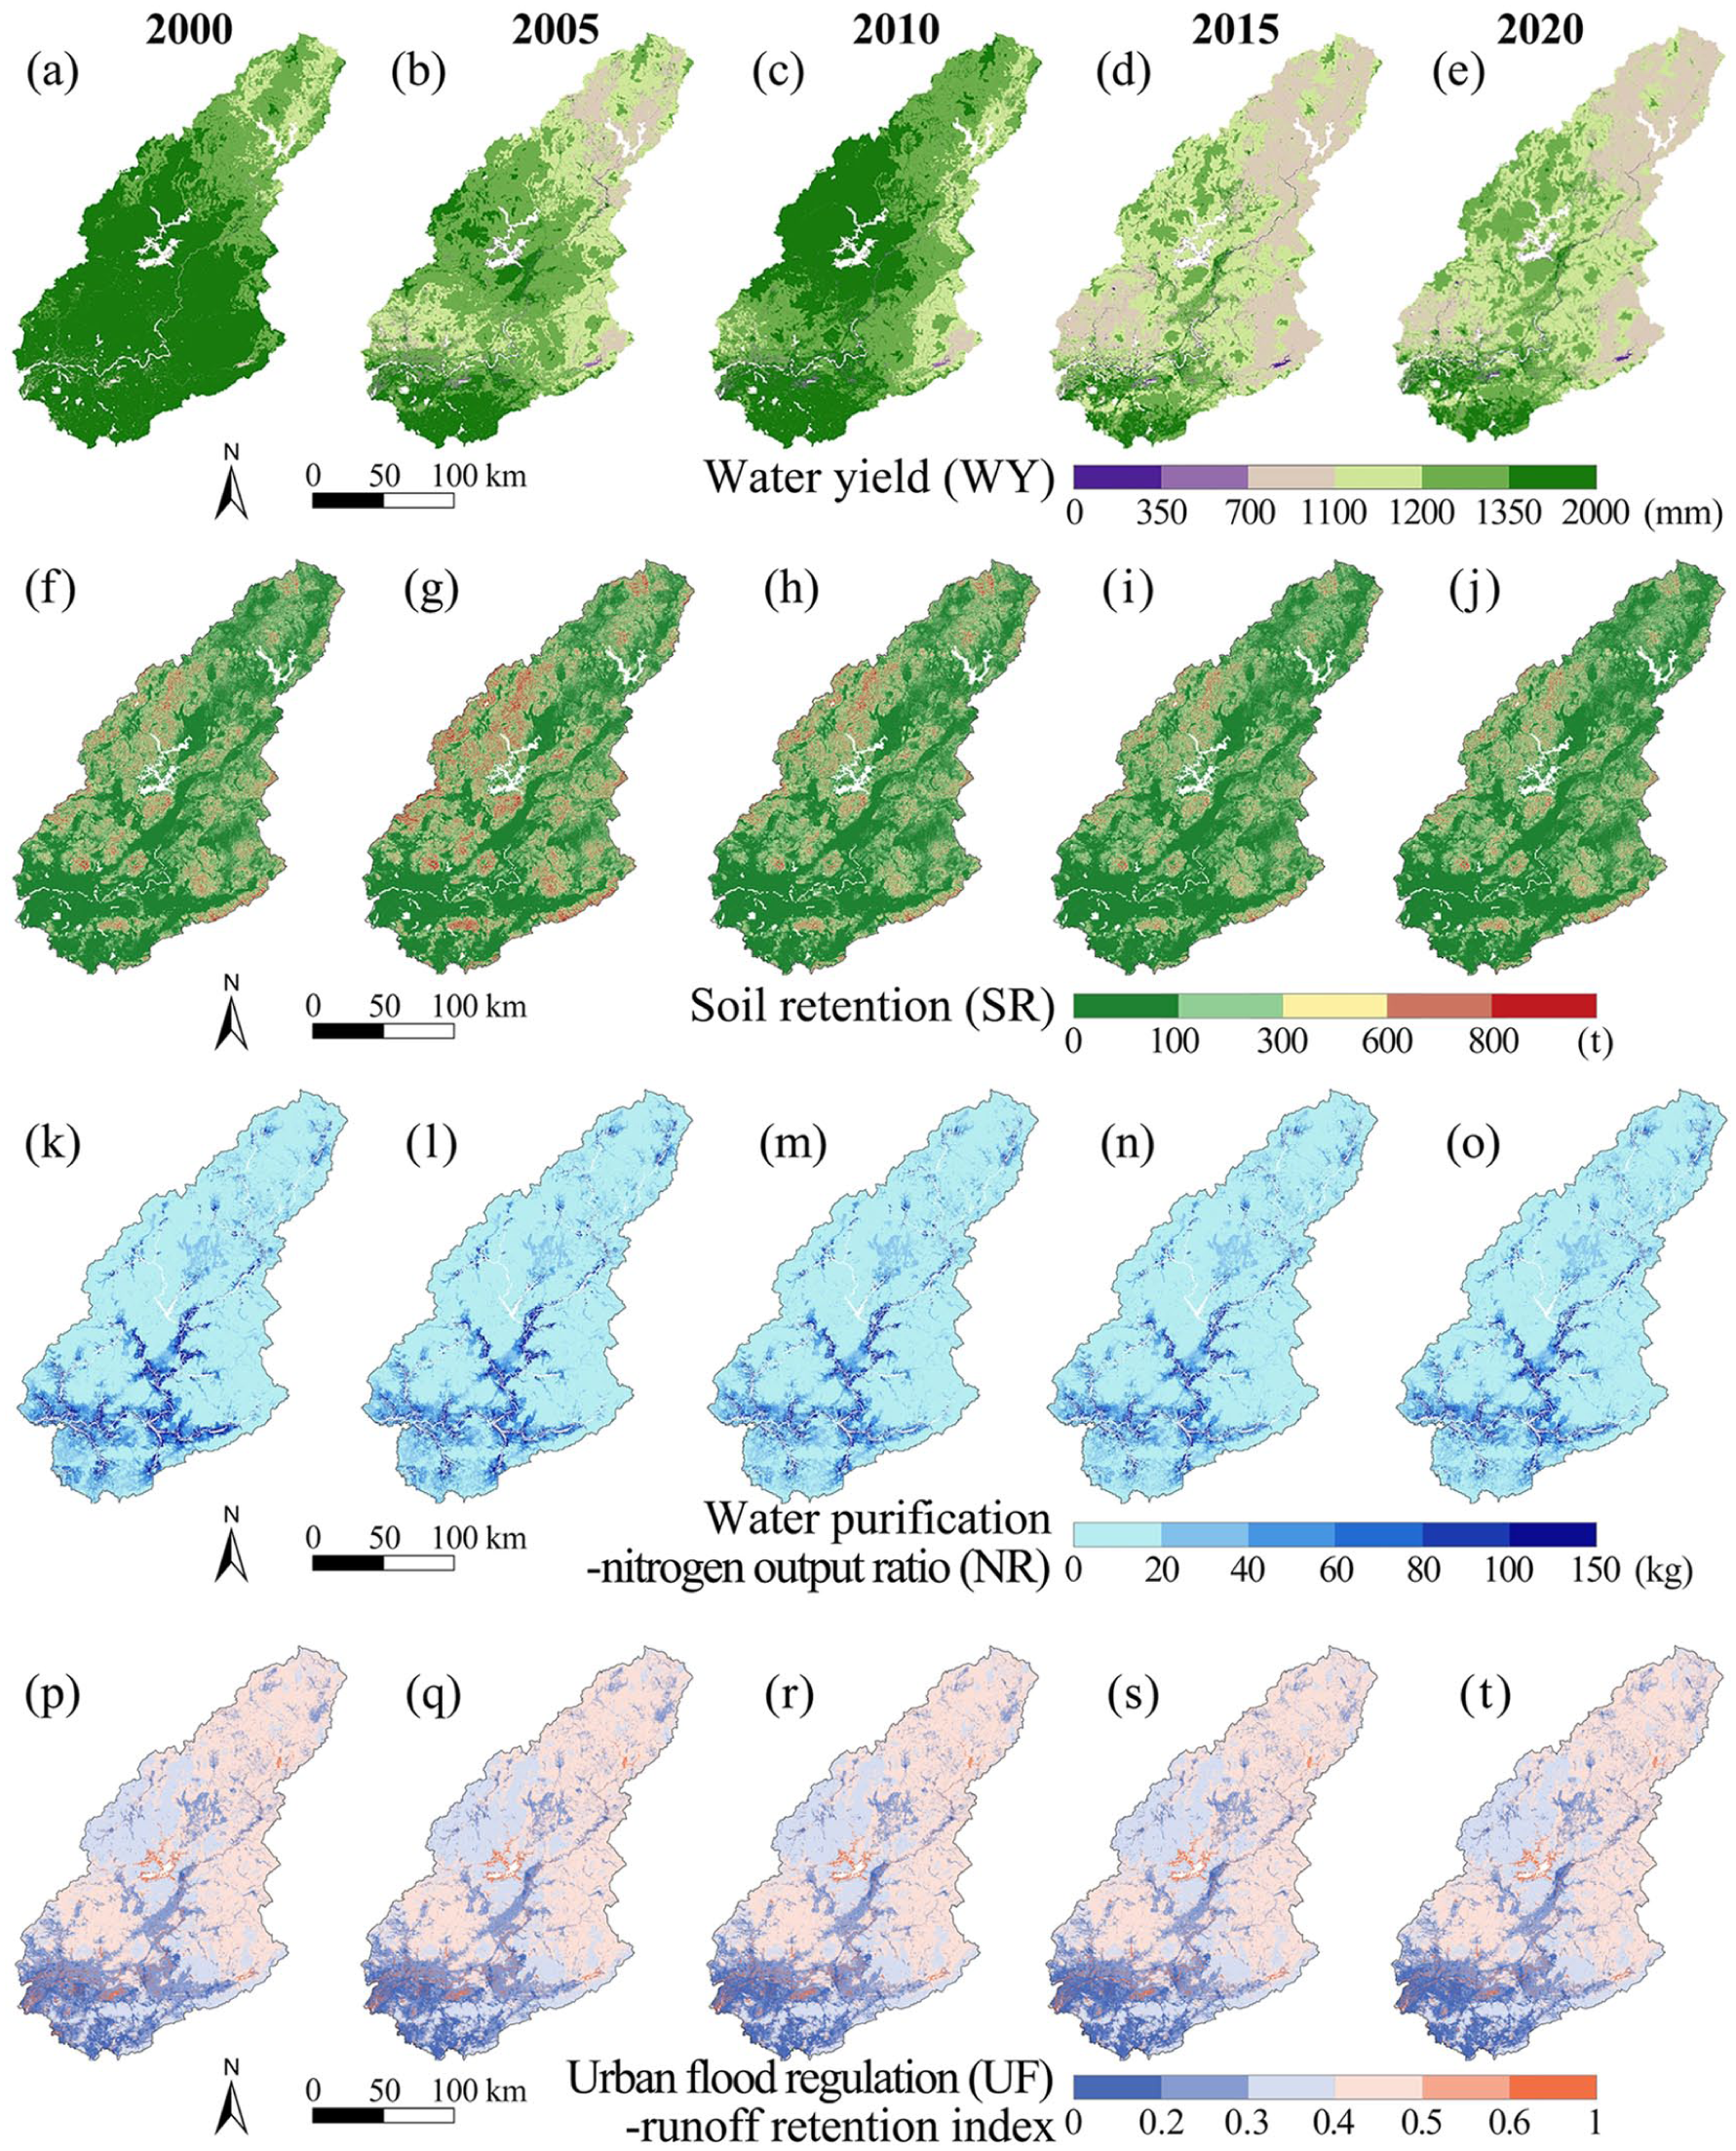
The spatial distribution of water-related ecosystem services during 2000–2020. (a-e) Water yield; (f-j) Soil retention; (k-o) Water purification; (p-t) Urban flood regulation.
Trade-offs and synergies among water-related ESs
Figures 5 and 6 present the Spearman correlation coefficients for the four ecosystem services—water yield (WY), nitrogen retention (NR), soil retention (SR), and urban flood regulation (UF)—over the 2000 to 2020 period. At the pixel scale (Figure 5), six pairwise ES relationships were analyzed. The correlation between WY and UF ranged from –0.67 to –0.78, indicating a strong trade-off. The SR–UF pairing exhibited a moderate trade-off, with coefficients between –0.4 and –0.5. In contrast, the NR–SR correlation remained below 0.2, reflecting a weak trade-off. No significant trade-off or synergy was detected between NR–UF or WY–SR at the pixel level. However, the WY–NR relationship, initially synergistic, declined from 0.35 to 0.2 over time, suggesting a weakening interaction.
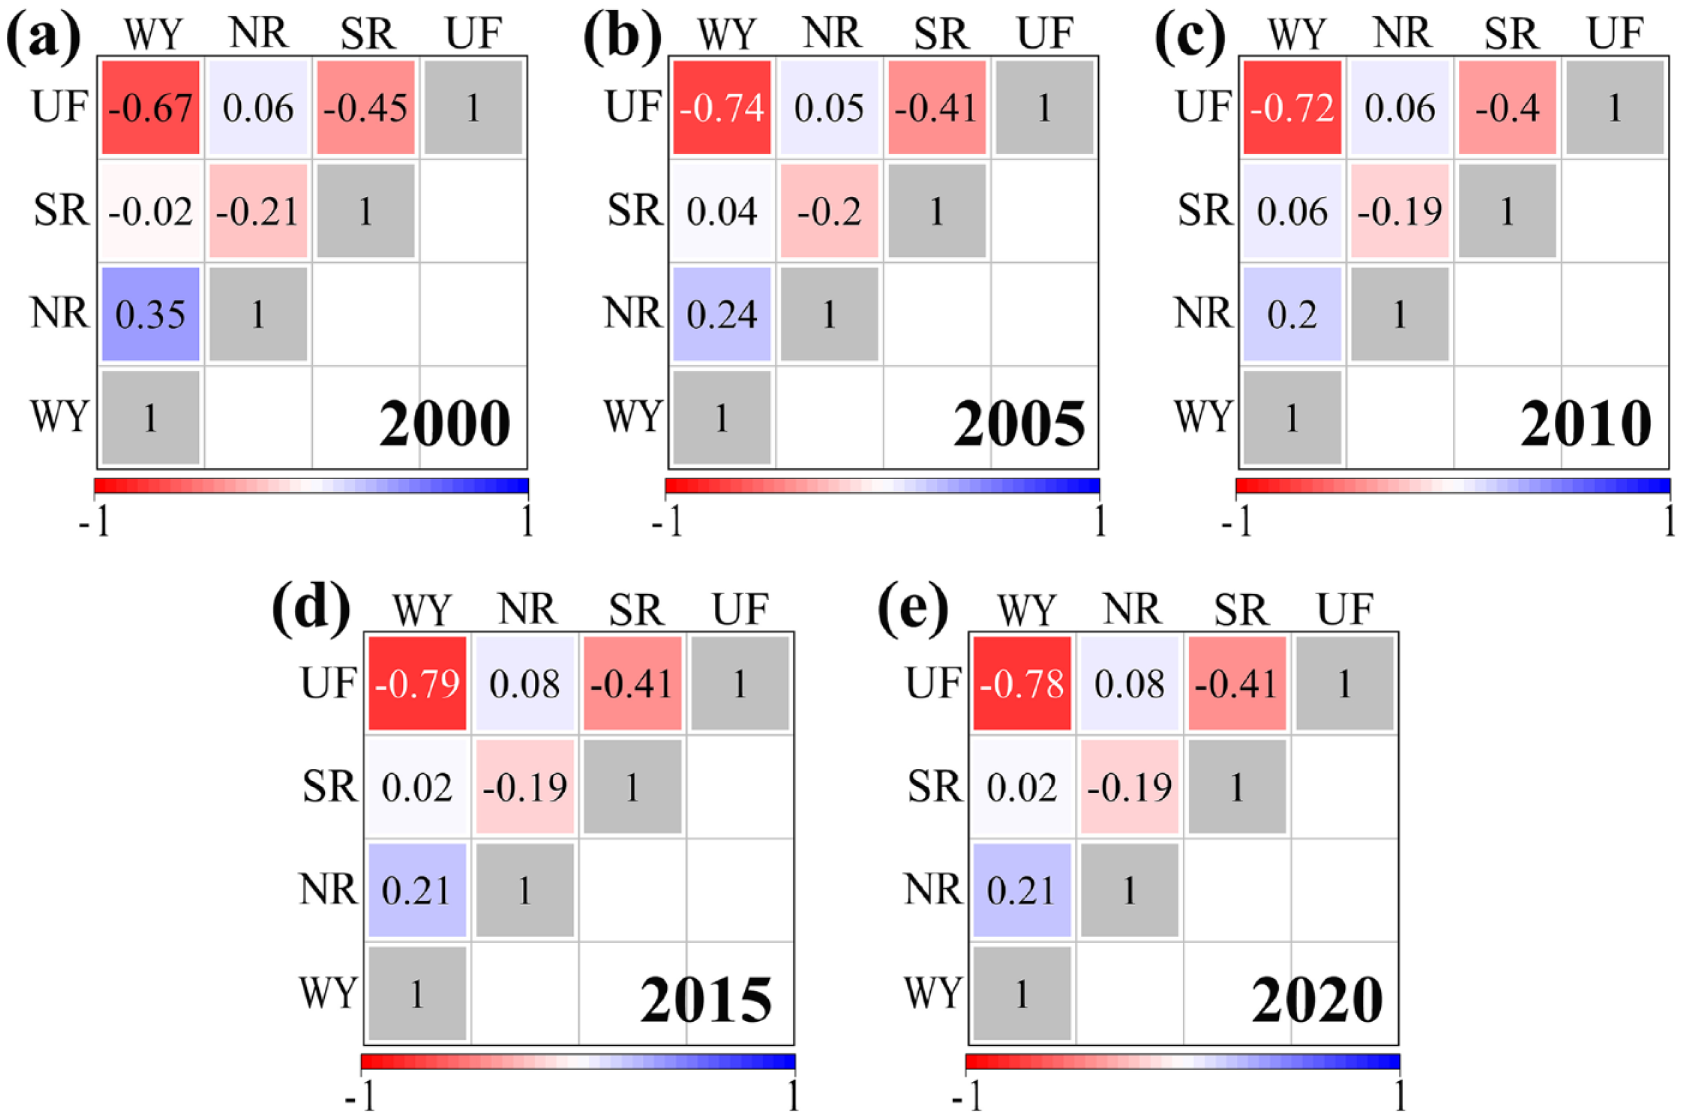
The trade-off/ synergy of water-related ESs from 2000 to 2020 at the pixel scale. (a) 2000; (b) 2005; (c) 2010; (d) 2015; (e) 2020.
At the sub-watershed scale (Figure 6), the relationships among ecosystem services exhibited notable differences compared to the pixel-level results. Synergistic interactions were observed for the WY–UF, NR–UF, and WY–NR pairs, while NR–SR and SR–UF demonstrated trade-off dynamics. Interestingly, the relationship between WY and SR transitioned from a trade-off to a synergy after 2000. Both the WY–UF and NR–UF correlations exceeded 0.5, indicating high-intensity synergies. In contrast, the WY–NR correlation declined markedly over time—from 0.7 in 2000 to 0.2 in 2020—reflecting a substantial weakening of that synergy. The NR–SR correlation consistently remained above 0.5, denoting a strong trade-off, whereas the SR–UF relationship had weaker trade-off values, ranging from 0.16 to 0.3. These findings underscore the importance of spatial scale in interpreting ecosystem service interactions. Discrepancies between pixel-level and sub-watershed results reveal how scale-dependent processes influence the nature and strength of trade-offs and synergies among services.
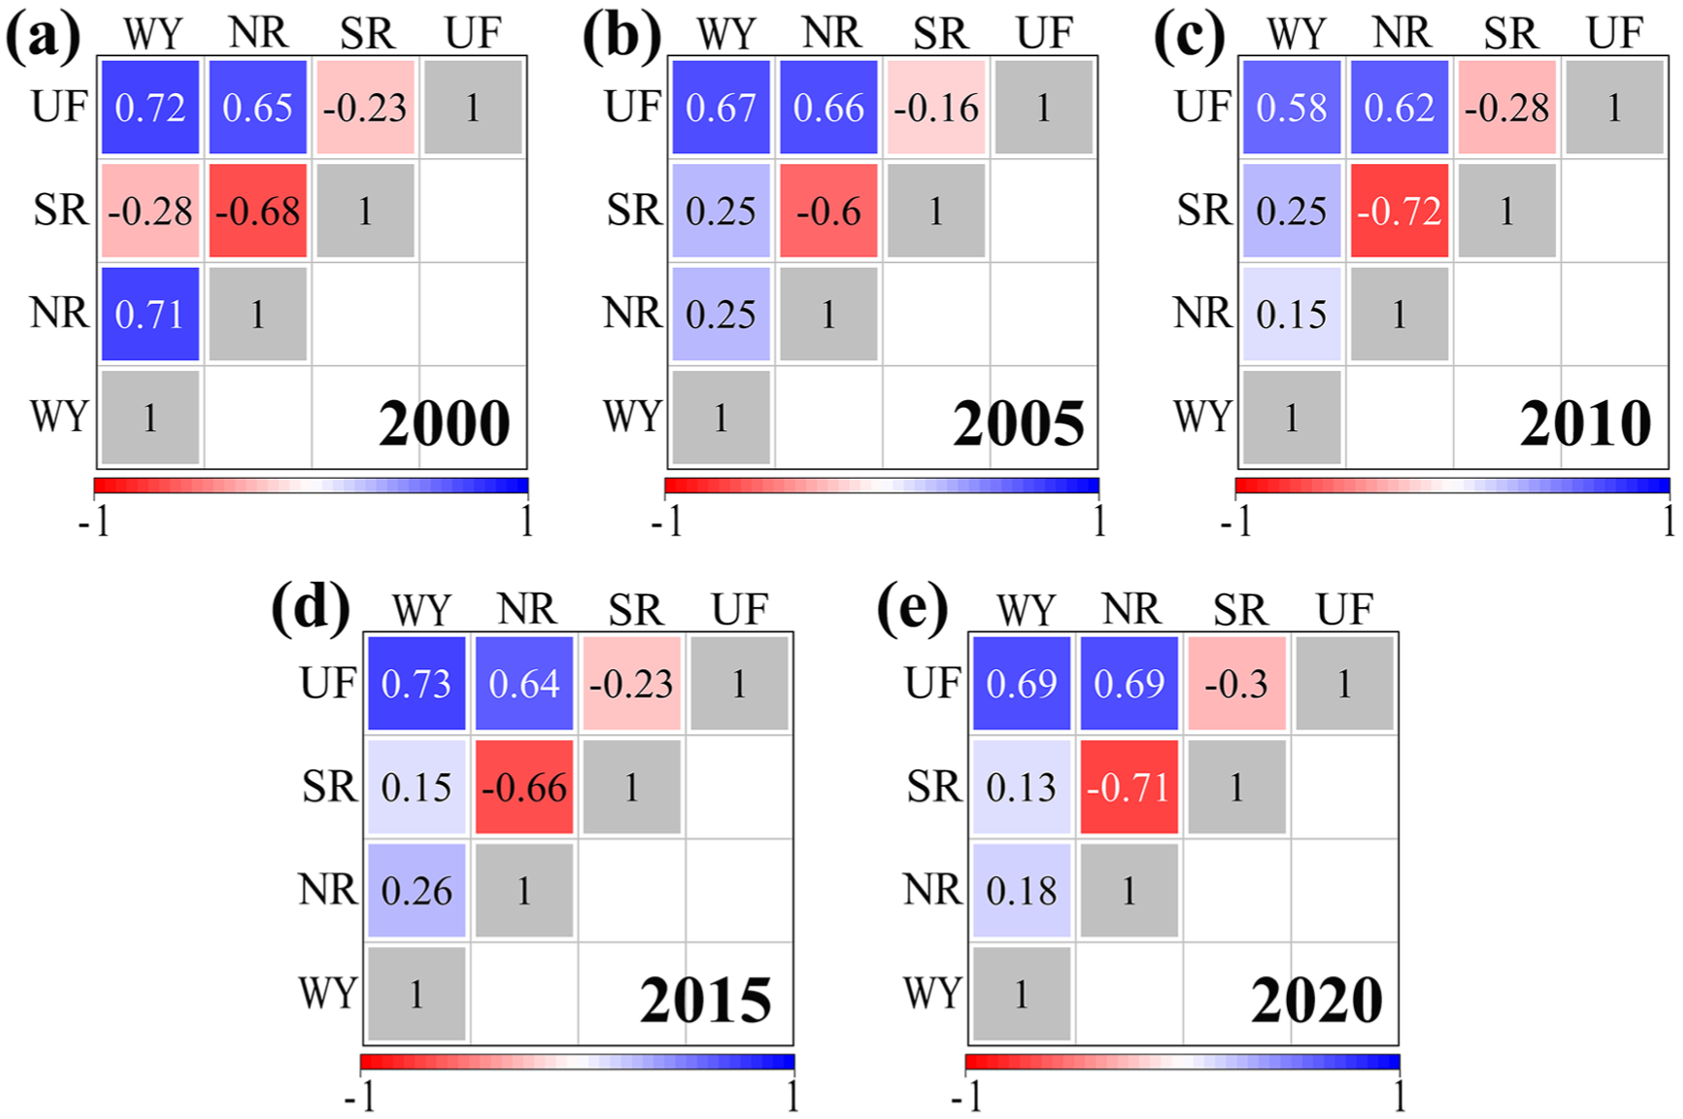
The trade-off/synergy of water-related ESs from 2000 to 2020 at the sub-watershed scale. (a) 2000; (b) 2005; (c) 2010; (d) 2015; (e) 2020.
Spatial patterns of water-related ES networks
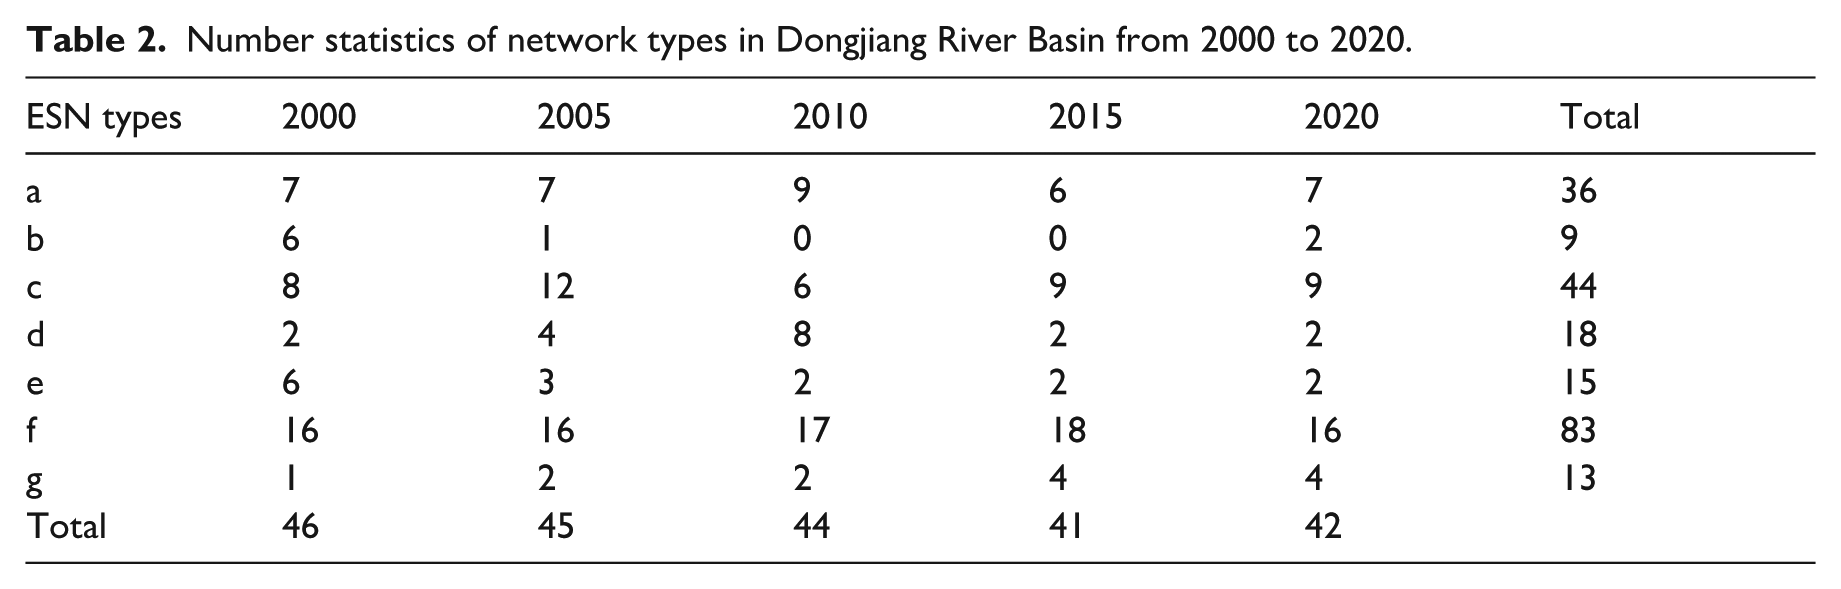
Between 2000 and 2020, a total of 218 water-related ecosystem service (ES) networks were identified across 46 sub-basins within the Dongjiang River Basin. These networks were classified into seven major types and further divided into 27 subtypes, as illustrated in Figure 7. Among the classified types, Type f—characterized by four or five service linkages—was the most prevalent, comprising 38% of all networks. Type c, consisting of two links, was the second most frequent, accounting for 20%, while Type g, which includes six links, represented 6% of the total. Temporal analysis revealed that the number of networks classified as Types a, d, and f initially increased and later declined. In contrast, Type b, which involves three links without any key (dominant) service nodes, showed a consistent downward trend. Notably, Type g experienced a steady increase over the two-decade study period (Table 2).
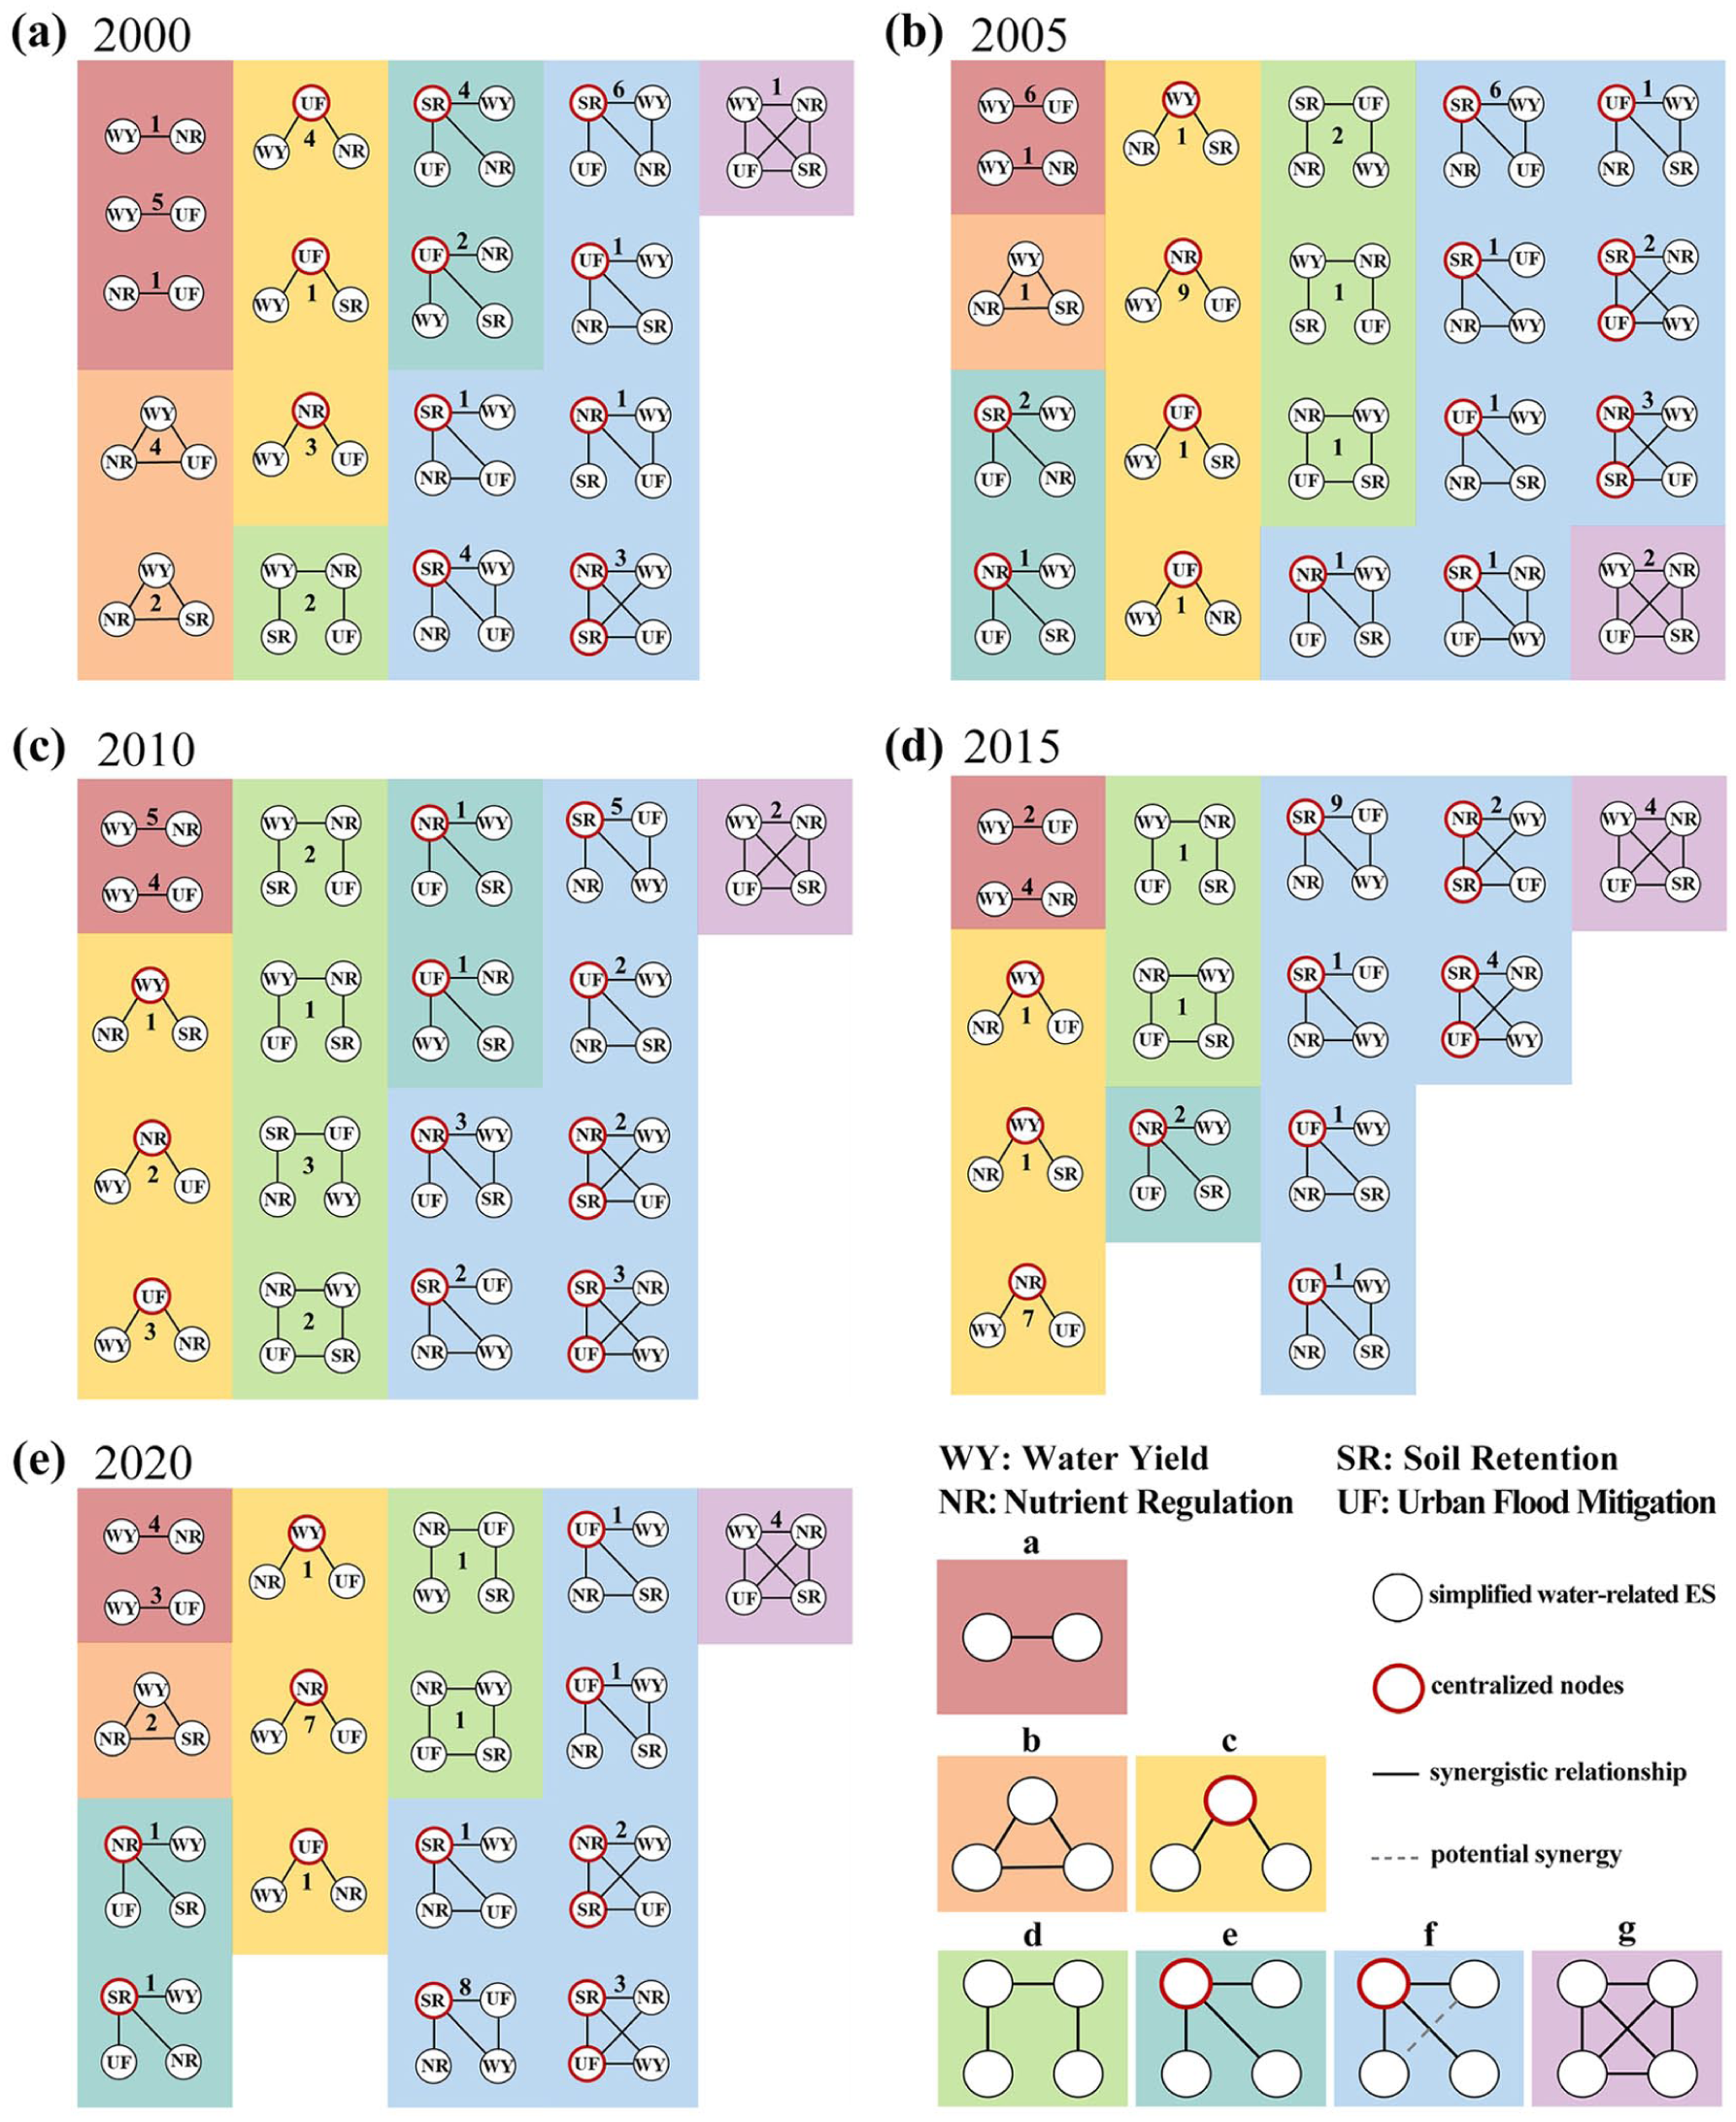
All kinds of water-related ES networks of sub-watershed. The black node represents the ES, and the red nodes are the ES with more links than others, the number of each type of network is next to the sub-figure. (a) 2000; (b) 2005; (c) 2010; (d) 2015; (e) 2020.
Number statistics of network types in Dongjiang River Basin from 2000 to 2020.
The spatial distribution of the seven identified ecosystem service (ES) network types is presented in Figure 8. Type a networks are mainly located in the upper sub-watersheds, typically characterized by high-altitude forested areas and steep terrain. Type b networks appear sporadically in the middle and lower reaches, often in regions with moderate water yield and relatively high soil retention or flood regulation capacities, typically associated with diverse topographic conditions. Type c represents the most dynamic network type, with a concentration in the mid-watershed region. Its spatial footprint expanded notably between 2015 and 2020, reflecting rapid structural shifts in ES interactions. Type d has a more limited distribution and is generally found in flatter terrain where forests and water bodies are dominant land cover types. Type e, which integrates three or more ES categories, shows a dispersed spatial pattern. It was more prominent in the early 2000s but became less frequent by 2020. Type f, the most commonly observed network type, is prevalent across downstream and midstream sub-watersheds. These areas typically experience high demand for flood control, water purification, and soil conservation, which drives the complexity and connectivity of the services. Type g has seen increased representation over time, particularly in sub-basins 31, 44, 45, and 46. These areas are characterized by high levels of urbanization and strong anthropogenic influence on ecosystem service dynamics.
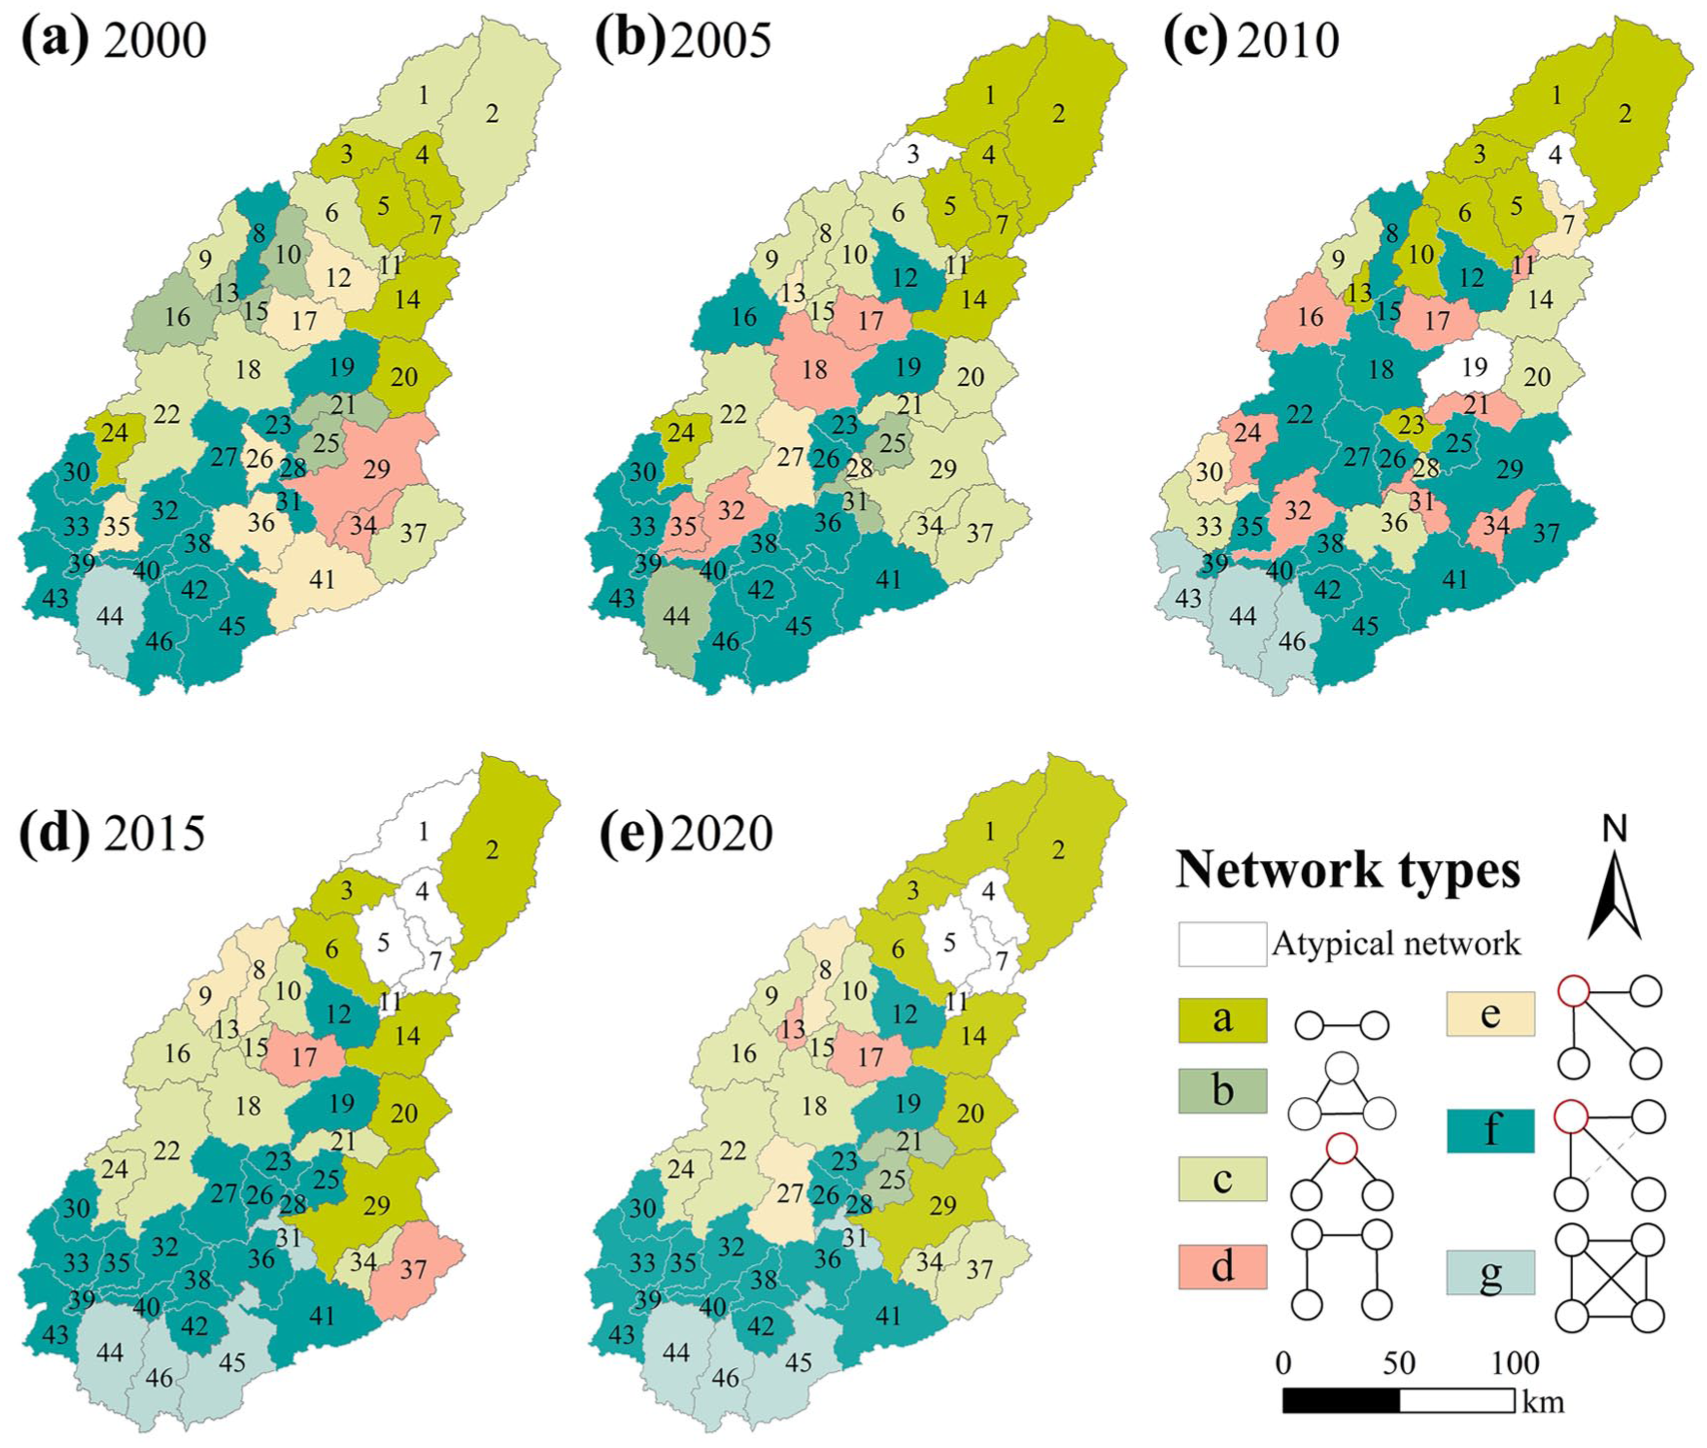
Spatial distribution of ES network types from 2000 to 2020. (a) 2000; (b) 2005; (c) 2010; (d) 2015; (e) 2020.
The co-evolution characteristic of ES networks
Figure 9 presents the spatiotemporal patterns of network density and network centrality for the ecosystem service (ES) networks, along with corresponding boxplots. From 2000 to 2020, network density exhibited a declining trend in the upstream sub-watersheds, while increasing in the middle and downstream areas. The highest-density regions were primarily located in the downstream sections of the Dongjiang River Basin and were closely associated with areas experiencing significant urbanization (Figure 9, a–e). Network centrality, in contrast, showed greater spatial variability. Sub-watersheds displayed distinct differences in centrality values, with some acting as dominant hubs in the network while others remained peripheral (Figure 9, f–j). Over time, the centrality of the ES network increased overall, indicating growing importance and dominance of certain service nodes. High-centrality sub-watersheds were predominantly distributed along the main streams of the Dongjiang River.
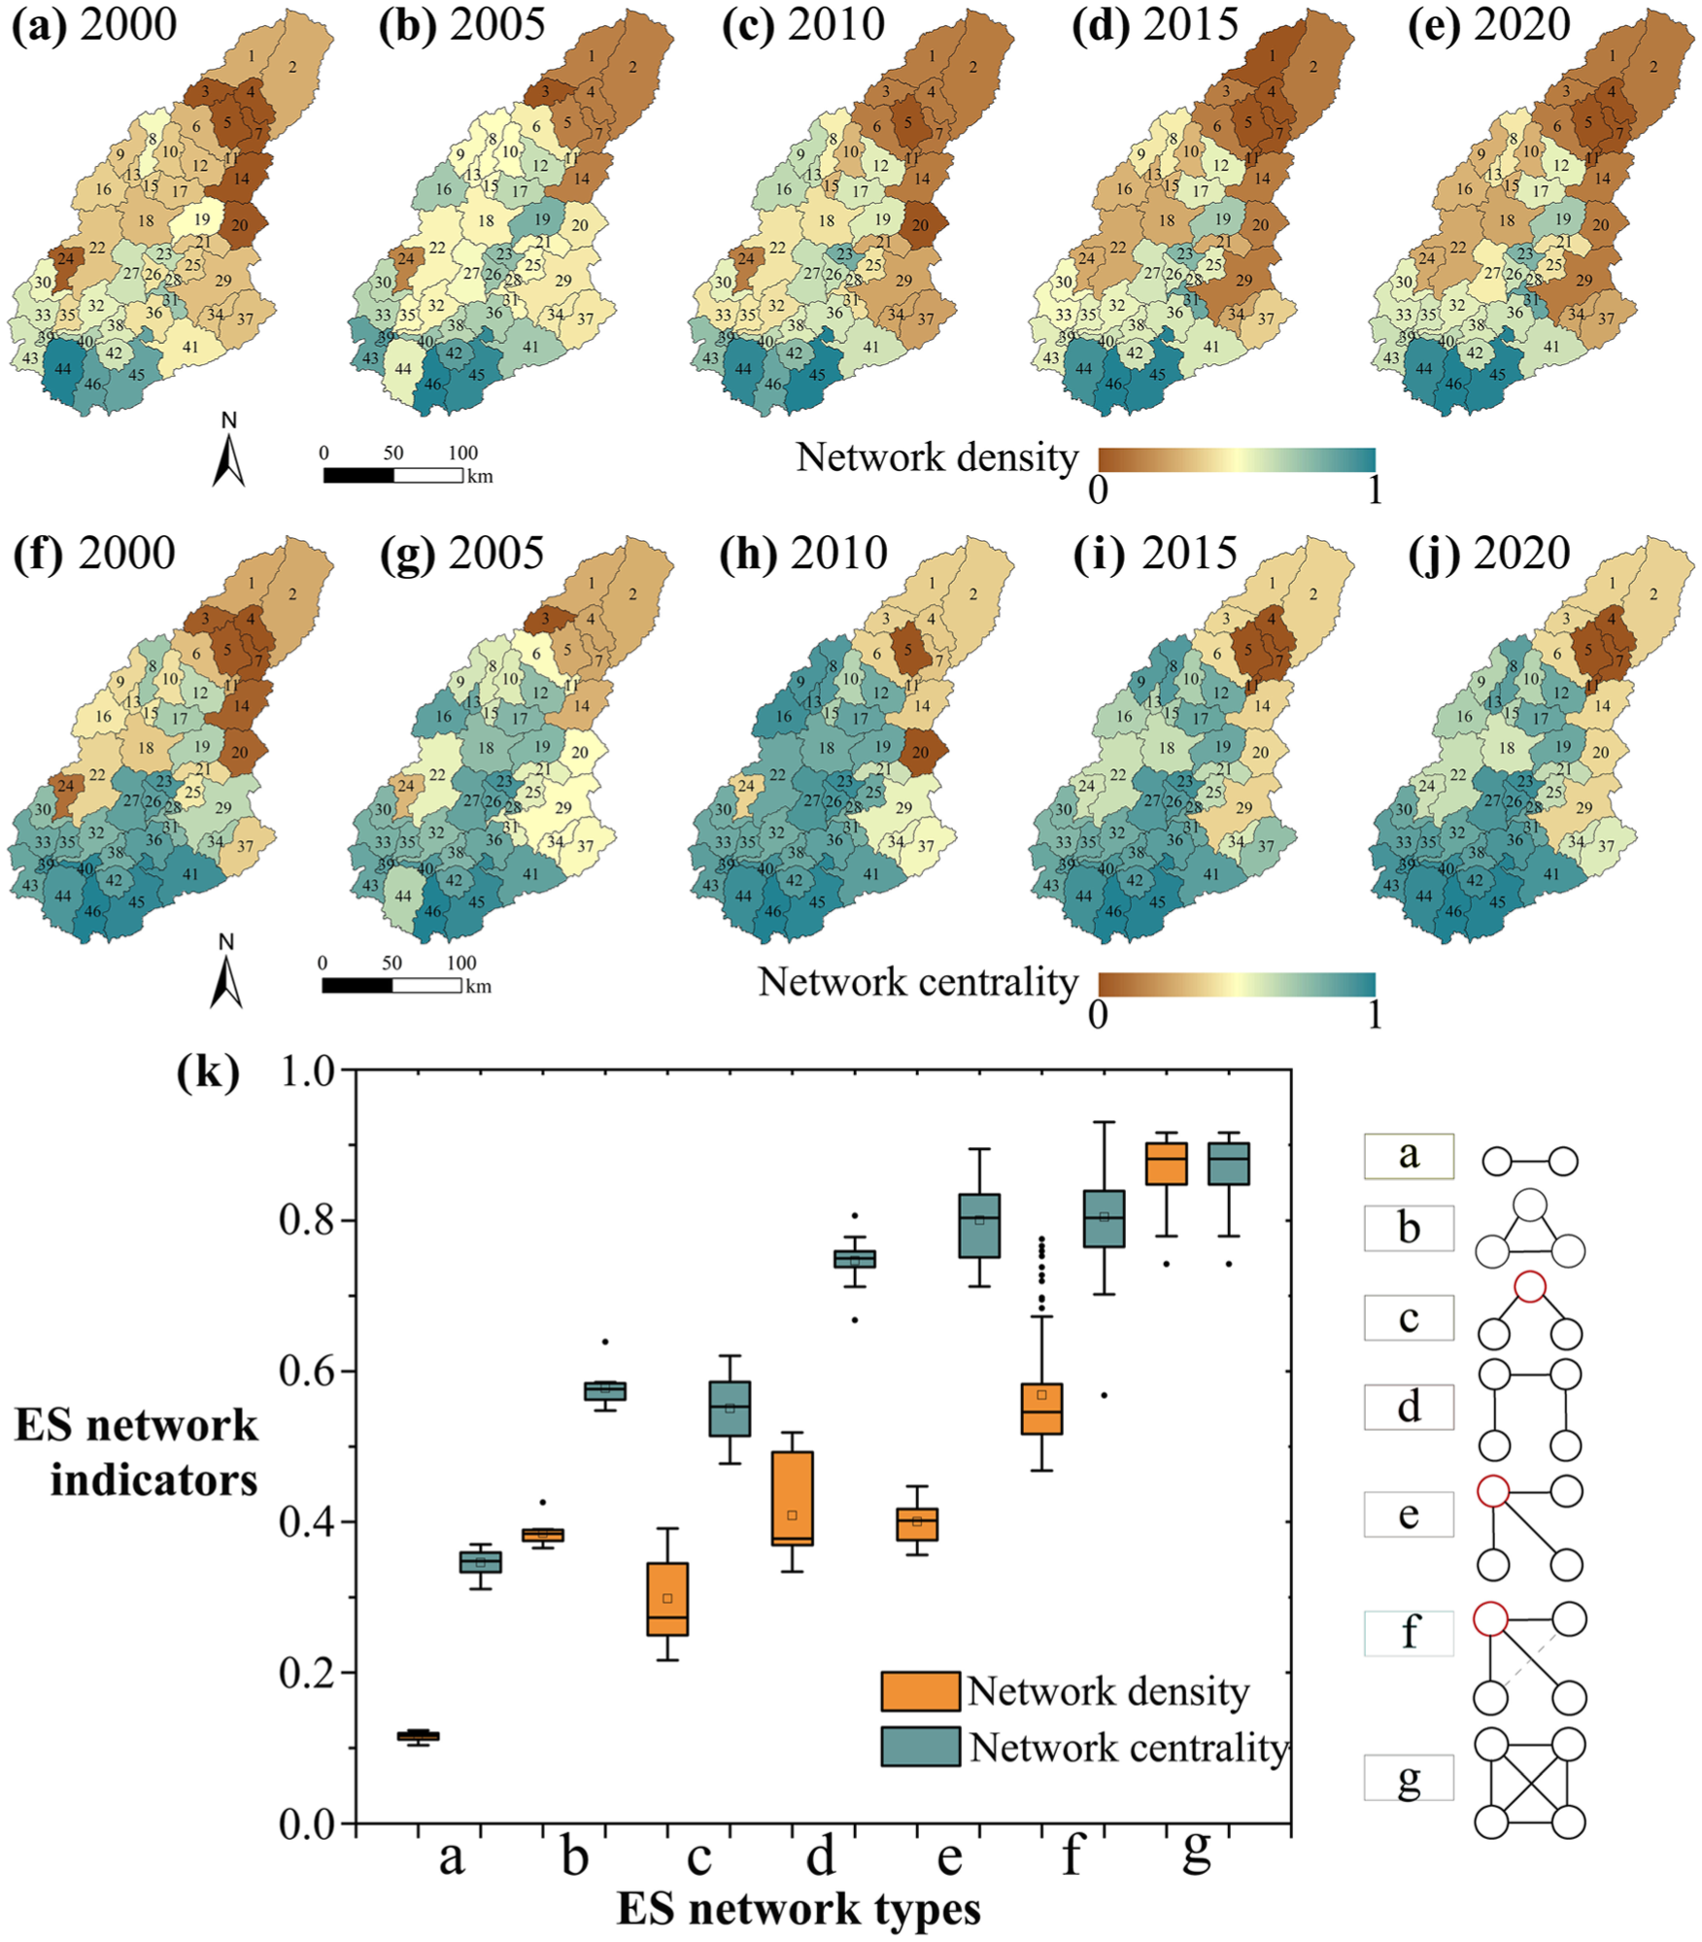
Spatiotemporal pattern of water-related ES network density (a–e) and network centrality (f–j) from 2000 to 2020; (k) Boxplot of network indicators for different water-related ES network types from 2000 to 2020.
A comparison between Figure 9a–e (network density) and Figure 9f–j (network centrality) reveals that the most pronounced spatial differences occurred in the midstream sub-watersheds. In contrast, both upstream and downstream regions—particularly those with higher urbanization—exhibited relatively stable patterns of change throughout the 20-year study period. Across all ES network types, network density values remained consistently lower than centrality values. Most network types displayed increasing trends in both the number of service nodes and the number of linkages, with the exception of Type b, which showed limited structural complexity (Figure 9k). These findings suggest that networks with higher levels of connectivity—characterized by more nodes and interlinkages—are structurally more robust and potentially more resilient to external disturbances.
Discussion
Spatiotemporal changes of water-related ESs network
Previous research has emphasized that the protection of water-related ecosystems and their associated services is critical for ensuring food security and mitigating ecological risks (Chen et al., 2018; Yang et al., 2021). However, limited attention has been given to how urbanization and climate change influence the spatiotemporal dynamics of water-related ecosystem services (Shen and Liu, 2023). Ongoing debate surrounds the identification of drivers responsible for the spatial and temporal variation of these services (Wen and Théau, 2020). In particular, decoupling the trade-offs and synergies among services—and understanding how they evolve within interconnected networks—offers a valuable approach for advancing insights into the structural and functional dynamics of water-related ESs over time (Lü and Lü, 2021).
ESs bundles and ES network analysis represent two primary approaches for exploring relationships among multiple services. However, bundling methods often fail to fully capture the nuanced interactions among individual services, particularly when spatial and functional heterogeneity is high (Shu et al., 2025). In contrast, network analysis enables a more granular understanding of process linkages, making it particularly well-suited for examining complex interactions within watershed ecosystems where ESs vary locally (Bodin et al., 2019).
Social-ecological network analysis has gained prominence for its ability to distinguish between ecological and social nodes, while also mapping the connections within these coupled systems (Felipe-Lucia et al., 2022). For example, Chung et al. (2021) developed an ES network framework that highlighted synergies between engineered water infrastructure and natural hydrological systems in urban basins. Similarly, Keyes et al. (2021) demonstrated how land-use change disrupts biodiversity and ecosystem services, thereby influencing human well-being. In Stockholm, Bergsten et al. (2014) identified gaps between urban land-use practices and wetland connectivity. Zhang et al. (2019) showed that restructuring institutional networks to align with ecosystem boundaries can significantly improve watershed health.
Aligned with these findings, our study demonstrates that interactions among water-related ESs can be effectively quantified at the sub-catchment scale using network analysis. By comparing network indicators, we reveal that the co-evolution of ESs is more intricate than previously recognized, often forming extended service chains such as those observed in Type f and Type g networks.
Water-related ES network for sustainable region watershed management
Effective watershed conservation planning requires a comprehensive understanding of how water-related ESs are provisioned—whether through bundled distributions or interconnected supply chains (Lin et al., 2025; Liu et al., 2022b). Given the observed spatiotemporal variation in both ES supply and urbanization intensity, the findings from this study provide actionable insights into sub-catchment water resource regulation. In particular, optimizing ES networks offers a practical pathway for guiding territorial ecological restoration efforts to improve human well-being and meet growing regional demands (Peng et al., 2025).
This study integrates four core water-related ESs to assess the co-evolution of their network interactions (Yu et al., 2023). A total of seven distinct ES network types were identified across the Dongjiang River Basin, each revealing complex interaction patterns among services. These typologies offer valuable guidance for catchment management, as each network type indicates which ESs should be prioritized for protection or enhancement. The results also suggest that increased land use intensity can, in some cases, lead to more structured or functionally rich ES networks. Notably, Type f and Type g exhibited the highest levels of complexity, implying that targeted water management strategies should be concentrated in these network types. Overall, analyzing network structure allows for a more dynamic understanding of water-related ESs and their evolving relationships at the regional scale.
Limitations and perspective
Several limitations in this study warrant consideration and suggest directions for future research. First, while the four water-related ecosystem services (WY, SR, NR, UF) were quantified using the InVEST model—known for its minimal parameter requirements and operational flexibility (Xu et al., 2024)—the precision of the results is still constrained. The use of high-resolution input data does not necessarily guarantee greater accuracy, and the validation process relied primarily on comparison with existing literature rather than direct field observations. Future studies should incorporate field-based measurements and sampling campaigns to strengthen model validation and enhance reliability.
Second, the analysis was limited to four key services. However, water-related ecosystem functions are more diverse in practice. Incorporating additional services—such as hydropower production, in-stream habitat regulation, or broader water conservation functions—would improve the comprehensiveness of the network. Doing so would likely increase both the structural complexity of the networks and reveal additional network types not captured in the current framework (Wen and Théau, 2020). Moreover, while this study focused on relative ES relationships, it did not quantify the strength of these connections. Future work should assign weighted values to nodes and linkages to represent the intensity of service interactions more explicitly.
Third, the use of five-year time intervals may obscure short-term dynamics, such as extreme weather events or rapid land-use changes. For basins vulnerable to climate variability, future studies should adopt higher-frequency temporal analyses (e.g., annual time steps) to better capture the system's responsiveness and resilience (Zhao et al., 2025; Zhu et al., 2022).
Conclusion
This study conducted a network-based synergistic analysis of water-related ecosystem services at the sub-watershed scale in the Dongjiang River Basin, China, covering the period from 2000 to 2020. Network analysis was employed to assess the strength and structure of interactions among ES nodes within sub-catchments. Results indicate that the provision of water-related ESs has gradually declined over time, exhibiting considerable spatial heterogeneity—largely driven by urbanization and climate change. Through the application of ES network analysis, 218 distinct networks were identified across 224 sub-catchments. These were categorized into seven types and 27 subtypes based on the number and importance of service nodes. Approximately 34.8% of the networks displayed balanced development across service nodes, while 65.2% were dominated by one or two key ESs. Type f emerged as the most prevalent network type, accounting for 38.1% of all networks and 58.5% of those with dominant nodes—highlighting the formation of extended chains among interconnected services. Over the study period, the Dongjiang River Basin has transitioned from diversified ES development to a structure increasingly centered around soil conservation and water purification. Across all network types, density values were consistently lower than centrality values, while both metrics increased with the number of nodes and linkages—suggesting enhanced structural complexity over time. These findings underscore the importance of prioritizing sub-catchments affected by urbanization in future restoration efforts. Special emphasis should be placed on reinforcing soil conservation and water purification services to support sustainable ecosystem functioning and regional water security.
Footnotes
Declaration of conflicting interests
The authors declared no potential conflicts of interest with respect to the research, authorship, and/or publication of this article.
Funding
The authors disclosed receipt of the following financial support for the research, authorship, and/or publication of this article: The author(s) disclosed receipt of the following financial support for the research, authorship, and/or publication of this article: This work was supported by the National Natural Science Foundation of China (No. 42371109).
Data Availability
Data will be made available on request.