
Abstract
Air temperature variability in an urban environment is considered a vital element for understanding urban climate. The advancement in sensor design and data collection methods have made it possible to install and collect cost-effective urban climate data. The user-friendly applicability, sustainability, expandability and acceptance in the scientific community of the All-In-One (AIO) and Low-Cost (LC) sensors have ensured their popularity in an urban environment. The selection of air temperature sensors based on sensor accuracy, cost and various selection methods are being applied in scientific research. In this study we present a comparative assessment of air temperature sensors through a two-stage selection method. First, we selected the sensors (METSENS 600, ClimaVUE50, WXT536 from AIO and nMETOS180, Netatmo, SenseBox Home, iButton, HOBO-U23 from LC sensors) based on commercial availability, cost, accuracy, sensor weight, power supply and consumption, literature review and user-friendly data management system. Second, we tested the sensors applying climate chamber (CC) and in-situ testing. We found that HOBO-U23 had the lowest Mean Absolute Deviation as compared to the reference sensor in the daily cycle test, nMETOS180 in the extreme range test and in stable temperature testing during CC testing. The time series and statistical results for AIO sensors indicated that ClimaVUE50 had the lowest Mean Absolute Deviation (MAD), Root mean square deviation (RMSD), Mean Square Deviation (MSD), and highest coefficient of determination (R2) values among the AIO sensors. Among the LC sensors, nMETOS180 showed lowest MAD, MSD, RMSD and highest R2 values while Netatmo had the highest MAD, MSD, RMSD and lowest R2 values. Deviations were mainly higher during the day and lower during the night due to radiation shield type variabilities. AIO sensors responded more slowly to changing temperatures due to thermal inertia and compactness as compared to most LC sensors. The study highlights clear deviations between AIO and LC sensors. Such deviations between sensors need in-depth investigation when comparing results between different sensors and different urban meteorological networks.
Keywords
Introduction
The increasing trend in urbanization in the last few decades has made urban climate observation important for human safety and climate-resilient city planning (Bai et al., 2024; Ramírez-Moreno et al., 2021; Zhou et al., 2025). Air temperature variability in an urban environment is considered to be a vital element for understanding urban climate (Fenner et al., 2017; Meier et al., 2017). In order to understand the variabilities and changes in urban climatic parameters, it is important to have a well-established network of meteorological observations stations (Chapman et al., 2015; Gubler et al., 2021). Urban meteorological networks (UMNs) can be classified on the defined parameters of urban scale, spatial and temporal resolution, meteorological variables and long term project continuity (Hart and Martinez, 2006; Lelovics et al., 2014; Muller et al., 2013; WMO, 2024). The Birmingham Urban Climate Laboratory operates a network of 25 automatic weather stations and 101 low-cost air temperature sensors distributed on the basis of urban surface types across the city mounted in schools and on street light poles (Chapman et al., 2015). The ‘Monitoring the City’s Climate and Atmosphere’ network consists of six automatic weather stations that are spread across the city of Ghent based on Local Climate Zones (LCZ) distribution design (Caluwaerts et al., 2020). The ‘Urban Climate Bern’ network (Gubler et al., 2021) focuses on microclimate variabilities through an urban observation network of 79 low-cost sensors selected due to their high energy efficiency and large storage capacity and which are distributed based on land specific classification involving LCZ, land cover type and building heights along with three automated weather stations (AWS) as reference stations. HiSAN network (Chen et al., 2019) consists of 100 air temperature and relative humidity sensors located throughout the city of Tainan based on land use and land cover features. The establishment of urban climate observation networks were found to be based on limited number of expensive but highly accurate sensors or large number of low-cost sensors with lower accuracies (Caluwaerts et al., 2020). Low-Cost (LC) sensors have become a notable part of environmental observation networks in the last two decades (Mao et al., 2019). LC sensors are not only lower in cost but are also used for specific measuring parameters with inexpensive production, maintenance and user-friendly operational features as compared to other sensors with similar application functions (Karagulian et al., 2019; Nalakurthi et al., 2024). All-In-One (AIO) compact weather stations are considered to be a single unit compact designed weather station containing multiple sensors along with manufacturer reported sensor specifications and calibration details (Dombrowski et al., 2021; Warne, 2017). The advancement in sensor design and data collection methods have made it possible to install and collect urban climate data (Chan et al., 2021; Ioannou et al., 2021) but AIO sensors need to be cost-effective for their selection in research projects (Chen et al., 2022; Dombrowski et al., 2021). Crowdsourced data, specially Netatmo sensors, have recently been applied in many studies (Büchau, 2018; Chan et al., 2021; Lussana et al., 2023; Meier et al., 2017; Peerlings et al., 2024). The debate in the scientific community over sensor type utility has intensified over the critical aspect of data quality and accuracy reliability (Chapman et al., 2023; Fenner et al., 2021). Criteria such as robustness, compact design, low power consumption, low cost, maintenance, compatibility with loggers, wireless communication (Rashid and Rehmani, 2016), user-friendly applicability, sustainability, expandability and acceptance in the scientific community have given the AIO and LC sensors priority over the traditional meteorological observation instruments in many applied and urban sensing projects (Burt and Podesta, 2020; Chapman et al., 2023; Chodorek et al., 2022; Fenner et al., 2021).
These days various companies such as Campbell Scientific, METER, Kipp and Zonen, YOUNG, LUFT, Vaisala, GILL, Pessl, Netatmo or Onset offer AIO and LC sensors for professional meteorological observations (Apogee Instruments, Inc., 2022; Burt and Podesta, 2020; Campbell Scientific inc., 2022a, 2022c; Chapman et al., 2015; Dombrowski et al., 2021; iButton, 2022; Netatmo, 2022; Onset Computer Corporation, 2022; Pessl Instruments, 2022; senseBox, 2022; Ulpiani et al., 2022; Vaisala, 2022). Very few studies have been published that undertake the comparison of these sensors regarding their usability and accuracy. The response time of air temperature sensor to changing temperature were analyzed by Burt and Podesta (2020) and Chodorek et al. (2022) who explored the impact of ventilation, sensor manufactured design and material variabilities on response times. Some studies concluded that there is development of certain uncertainty levels in the sensors after transportation (Aranda and Merlone, 2024) and long periods of usage (Chan et al., 2021; Chapman et al., 2023). Other studies have identified the specification of sensors like short term observations capacity (Whiteman et al., 2000) and spatial coverage limits like micro climate observations (Vasic et al., 2022). Air temperature sensors are selected on the basis of a single or multiple parameters such as accuracy levels, response time and long term stability (Chapman et al., 2023; Chodorek et al., 2022; Quanz et al., 2018). Finding a suitable sensor has been a matter of individual selection based on the targeted application and manufacturer specifications e.g. on sensor accuracy, usability, dimensions and costs etc. (Dumas et al., 2021). Kowal et al. (2020) applied heat exposure and humidity as environmental conditions on two temperature sensors (HMP 155 and Vaisala’s HMP 45AC) and concluded that time, high humidity, high and low temperatures and rapid temperature changes show increasing deviation on the repeated testing results. The temperature range of -20°C to +40°C has a much larger impact on the uncertainties of conventional sensors such as thermocouples and resistance temperature detectors (RTD) which have limitations in terms of precision and stability as compared to AIO sensors (Oukaira et al., 2024). Chodorek et al. (2022) applied response time criteria in a controlled environmental setup for the selection of LC temperature sensors that would be more applicable in mobile weather stations for urban climate coverage. Dombrowski et al. (2021) compared ATMOS41 AIO compact sensors with Vaisala WXT520 and reference weather station data to identify the uncertainties in air temperature observations during the nighttime and declared that an analysis with mean values sometimes underestimates the importance of lowest temperature observations especially in rainy seasons. Freitag et al. (2016) compared air temperature sensors (MP-101, HygroClip-2 from Rotronic and HMP 155 from Vaisala) mostly used for tropical weather analysis with reference weather station data with observations in the range of 11°C to 35°C in to the test configuration. The authors concluded that air temperature and humidity differences were smaller during the nighttime than daylight observation hours. Only three studies from the literature were identified as having done a comparative analysis of the sensors applied in this study. 1) Chapman et al., (2023): ClimaVUE50 – Netatmo outdoor module, 2) Dombrowski et al., (2021): WXT536 – ATMOS41 (similar to ClimaVUE50) and 3) Young et al., (2014): Thermochron iButton - HOBO-U23. Chapman et al. (2015) identified the high costs of maintaining and running such UMNs even with low-cost sensors. Caluwaerts et al. (2020) highlighted the difficulties of installing some sensors, like anemometers, at the height of 10m as recommended by WMO (2006), instead of placing them at 2m from ground level for practical reasons. Chan et al. (2021) emphasized the testing and calibration of sensors before their applications in the field. Muller et al. (2013) indicated the specific urban scale validation for selection of a number of sensors to be used for a dense network development. Keeping in mind the above-mentioned literature references about air temperature sensors applied for urban climate observations, it is evident that there is a lack of transparent criteria for air temperature sensor selection and for independently conducted sensor comparison as a sound basis for the selection of air temperature sensors for the urban climate. Here, we provide a method that could be applied for the selection of air temperature sensors based on defined criteria. This method will provide a common base for urban climate observation network sensor selection that could be applied across the globe.
To contribute to the understanding of the capabilities and selection of different AIO and LC sensors to be used particularly in the urban context, our research study provides a comparison of selected AIO and LC sensors regarding air temperature. The objectives of the study are to compare AIO and LC sensors for air temperature observations in a controlled environment (climate chamber) and in an open environment (in-situ) in the context of an urban environment. This will help the scientific community save time and resources when selecting air temperature sensors particularly in the urban environment. This will also contribute to clarifying the ambiguity between AIO and LC sensors with regards to accuracy and cost-effectiveness.
Materials and methods
We conducted two main steps to answer the missing sensor testing and selection procedure development. The steps (Figure 1) follow the direction from 1) criteria-based sensor selection to 2) (a) climate chamber and (b) in-situ testing.
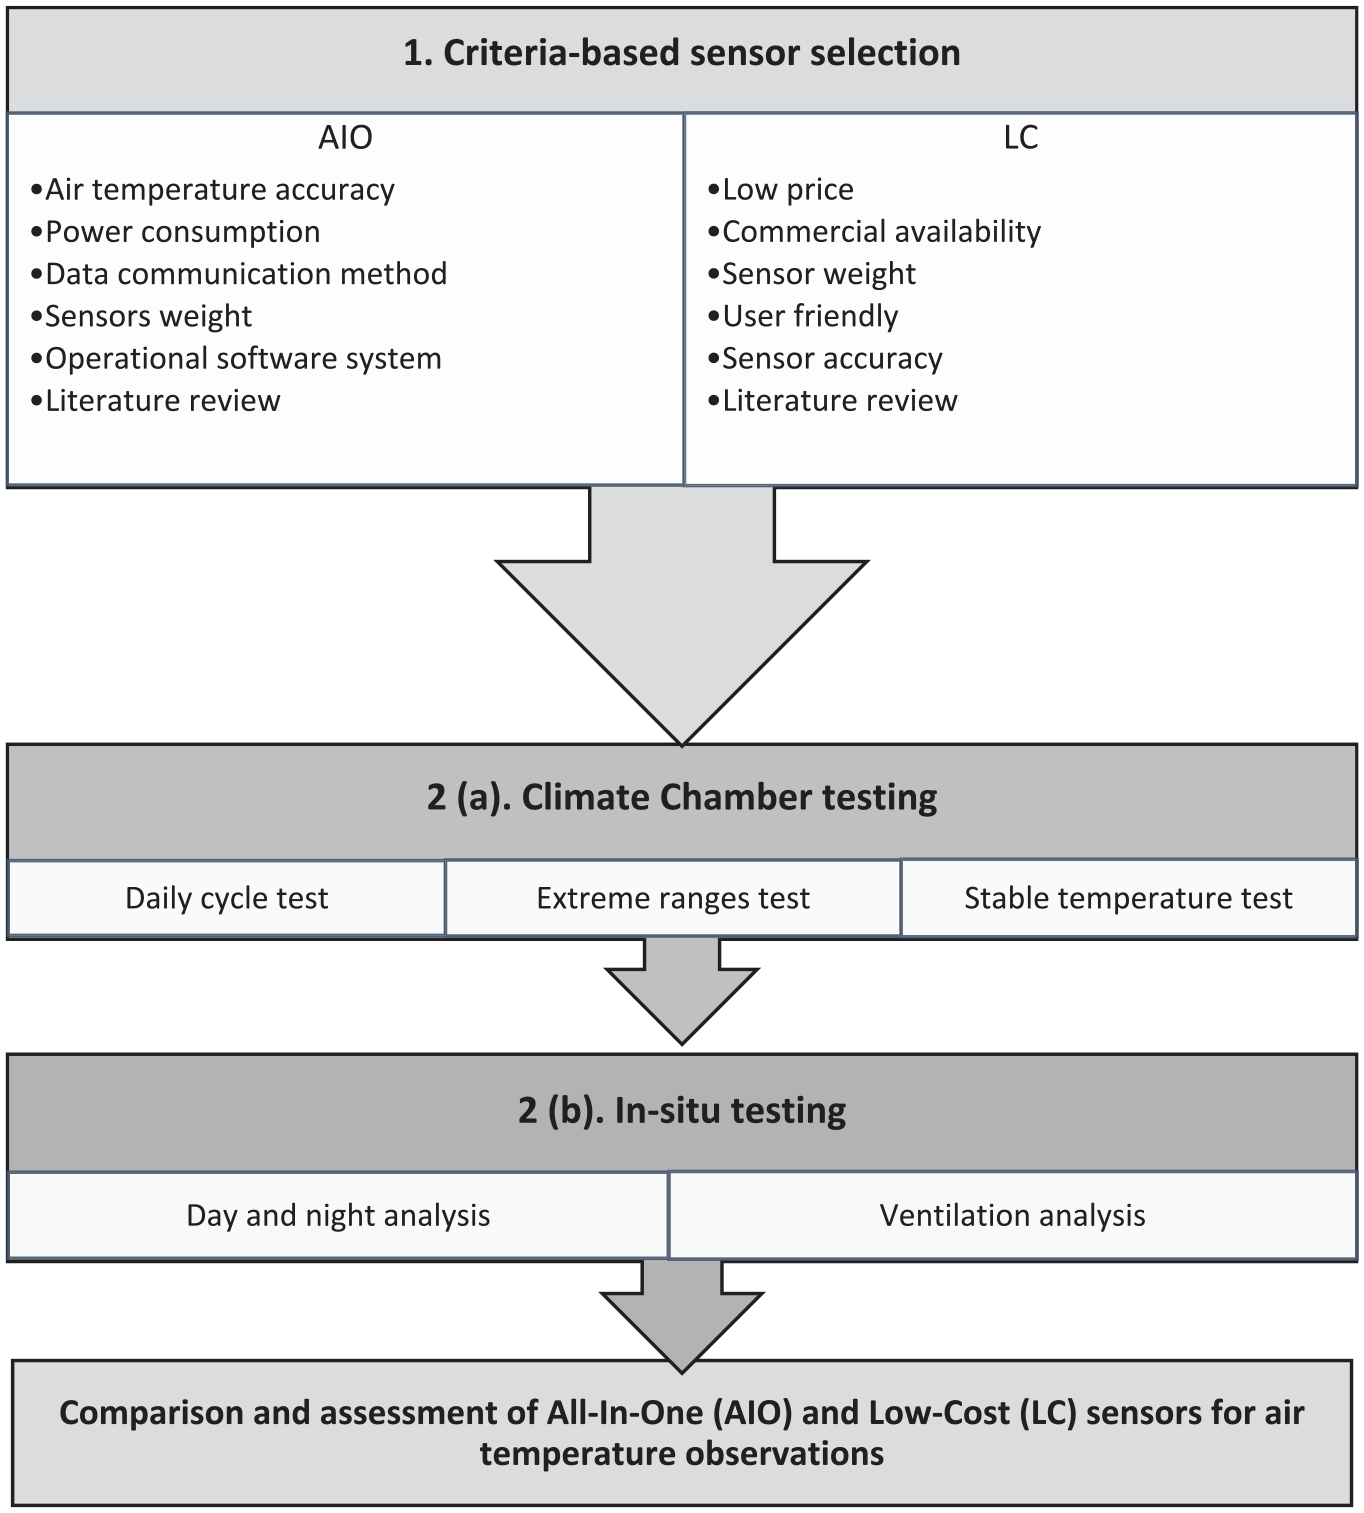
Study design flow chart indicating the two main stages for AIO and LC sensors selection and testing steps.
Sensor selection
Available AIO and LC sensors were identified through scientific literature and manufacturer webpages available since 2022. For AIO, we identified a total of 21 types of sensors that have been reviewed in detail (Figure S1 in the Online Supplementary Data). For the LC sensors, we identified five that meet the defined criteria of sensor accuracy, power independence, commercial availability, and easy installation. We omitted Do-It-Yourself (DIY) sensors from the study for comparison of user-friendly and ready-to-use applications.
The key defined criteria were: 1) high accuracy of air temperature sensor (±1°C); 2) compactness in design; 3) low weight (max. 2 kg) for stable mounting on street light poles, low price range (for AIO max. 3000 Euros and for LC sensors max. 600 Euros); 4) lower energy consumption; and 5) reliable solar panels for power independence and remote data accessibility (via cellular and cloud data). We selected these criteria based on existing literature and our own study approach that focused on user friendly installation in the field. The main arguments were based on accuracy of air temperature sensors for qualitative observations, low weight for stability on street light poles, flexible mounting set up for quick fixing and replacement, ease of transportation in bulk and requiring less people in field for installation. Low power consumption is important for sensors to be independent of a direct power supply. Small built-in solar panels provide flexibility in installation-location selection and for long-term data collection with no need for battery replacements.
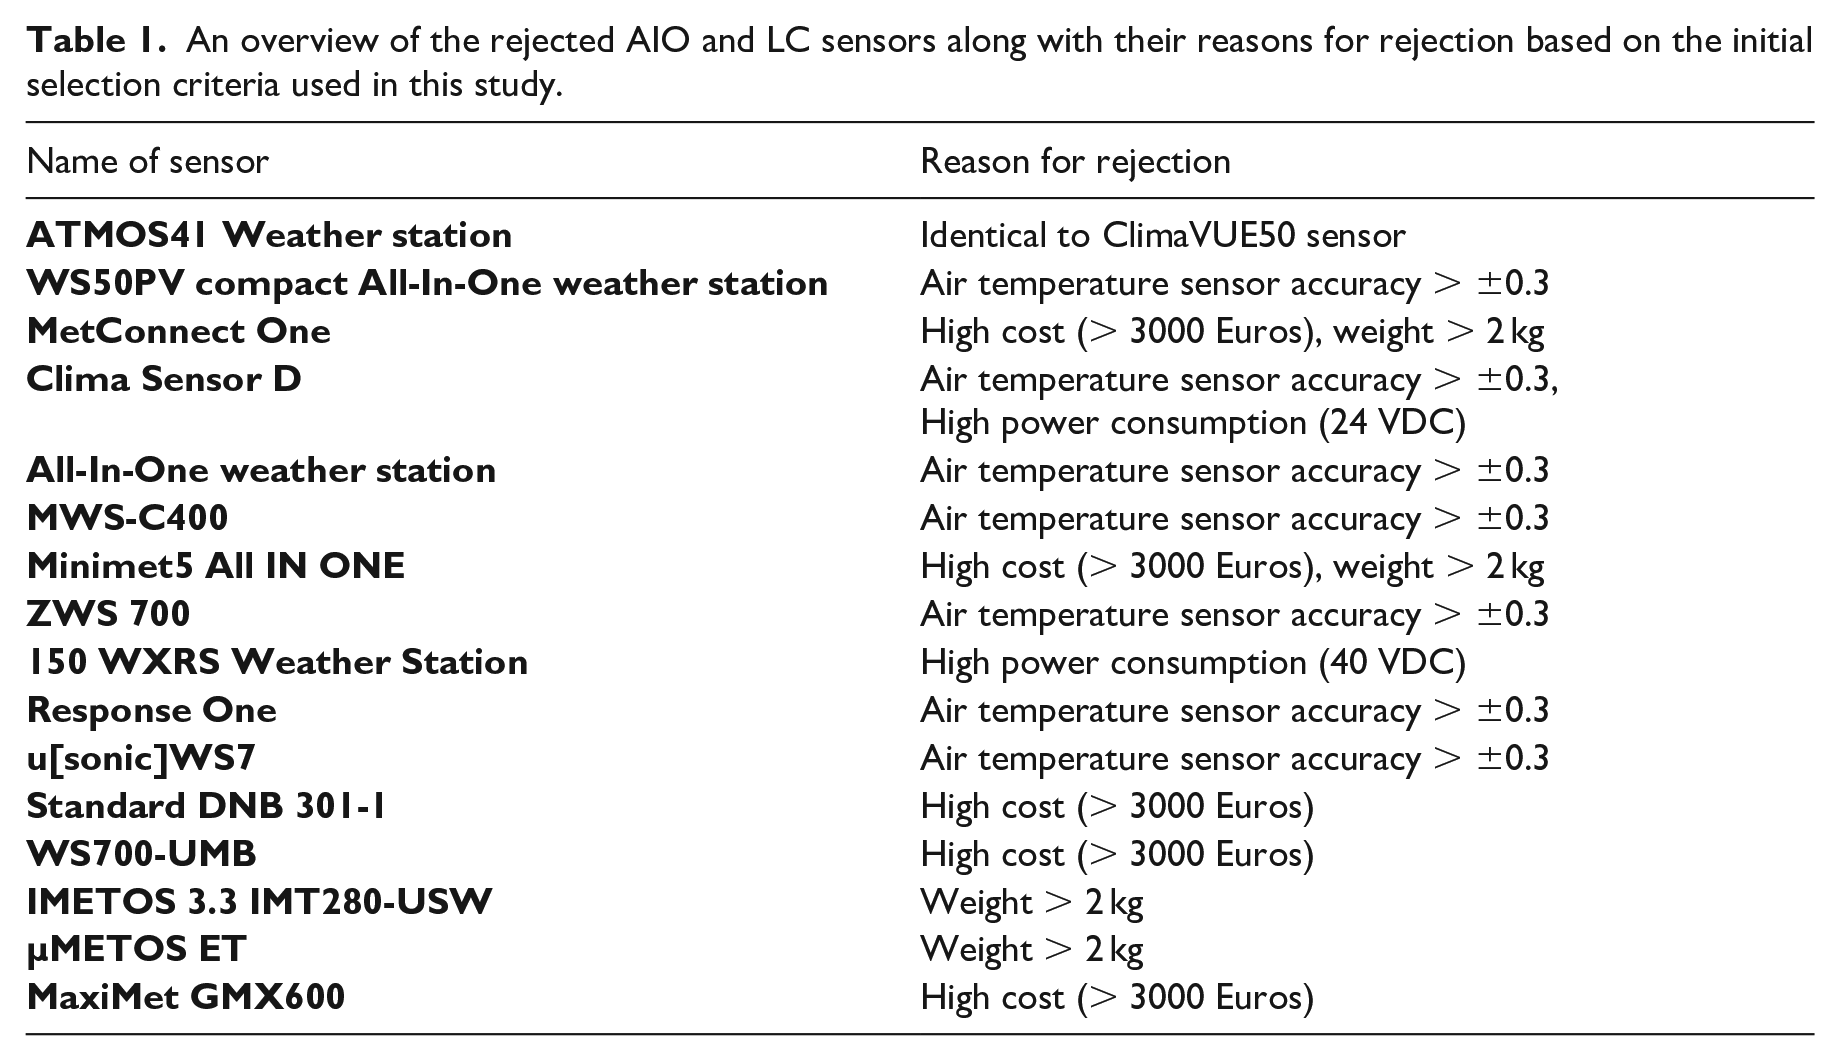
As a result, we included three AIO (METSENS 600 (Campbell Scientific inc., 2022c), ClimaVUE50 (Campbell Scientific inc., 2022a), WXT536 (Vaisala, 2022)) and five LC sensors (Netatmo (Netatmo, 2022), SenseBox Home (SenseBox, 2022), Thermochron iButton (i-Button, 2022), HOBO-U23 (Onset Computer Corporation, 2022), nMETOS180 (Pessl Instruments, 2022)) in this study for analysis (see Table 1 for the sensors that were not selected, and the reasons for rejection).
An overview of the rejected AIO and LC sensors along with their reasons for rejection based on the initial selection criteria used in this study.
All air temperature sensors need radiation shields to minimize the impact of direct radiation that could lead to a temperature difference of up to 4°C between shielded and unshielded sensors (Pohorsky et al., 2024). AIO sensors (METSENS 600, WXT536) had air temperature sensors installed inside the compact body except for ClimaVUE50 which uses default calibration for its correct readings (Campbell Scientific inc., 2022a). LC sensors (HOBO-U23, SenseBox HOME and i-Button) were provided with LC radiation shields, while nMETOS180 (Pessl Instruments, 2022) and Netatmo (outdoor module) (Netatmo, 2022) have inbuilt radiation shields from their respective manufacturers.
Testing phase
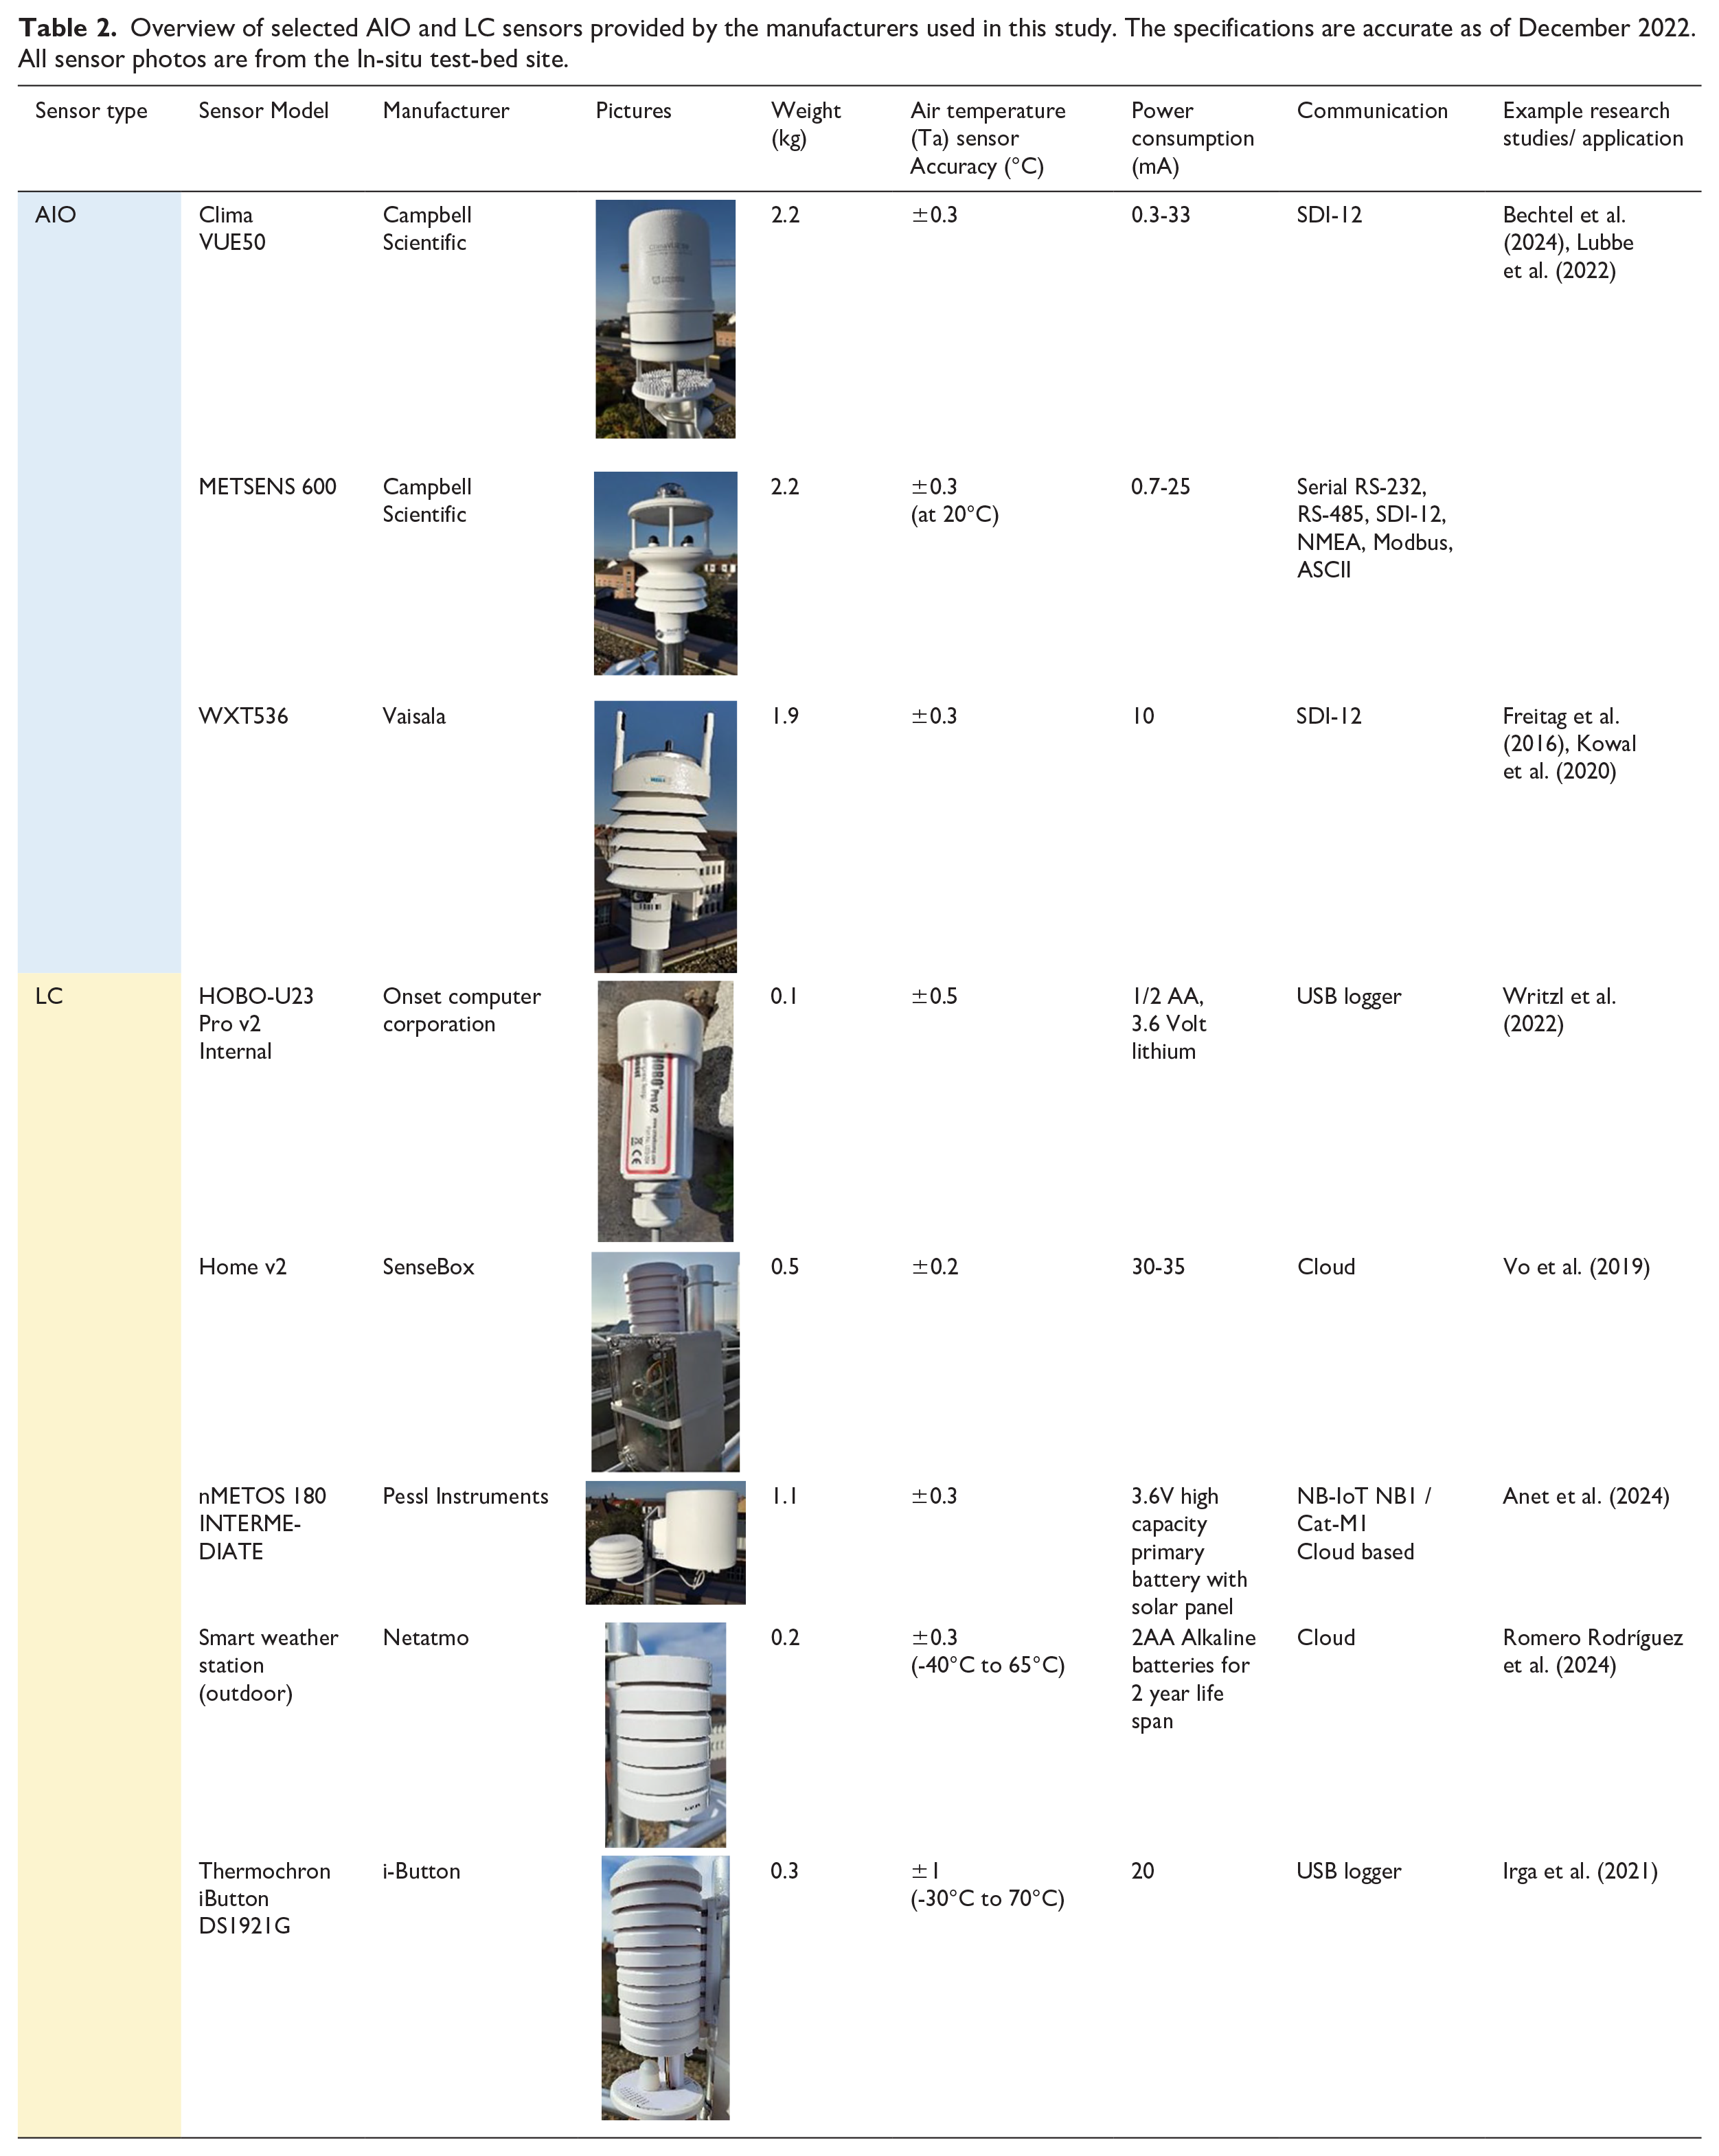
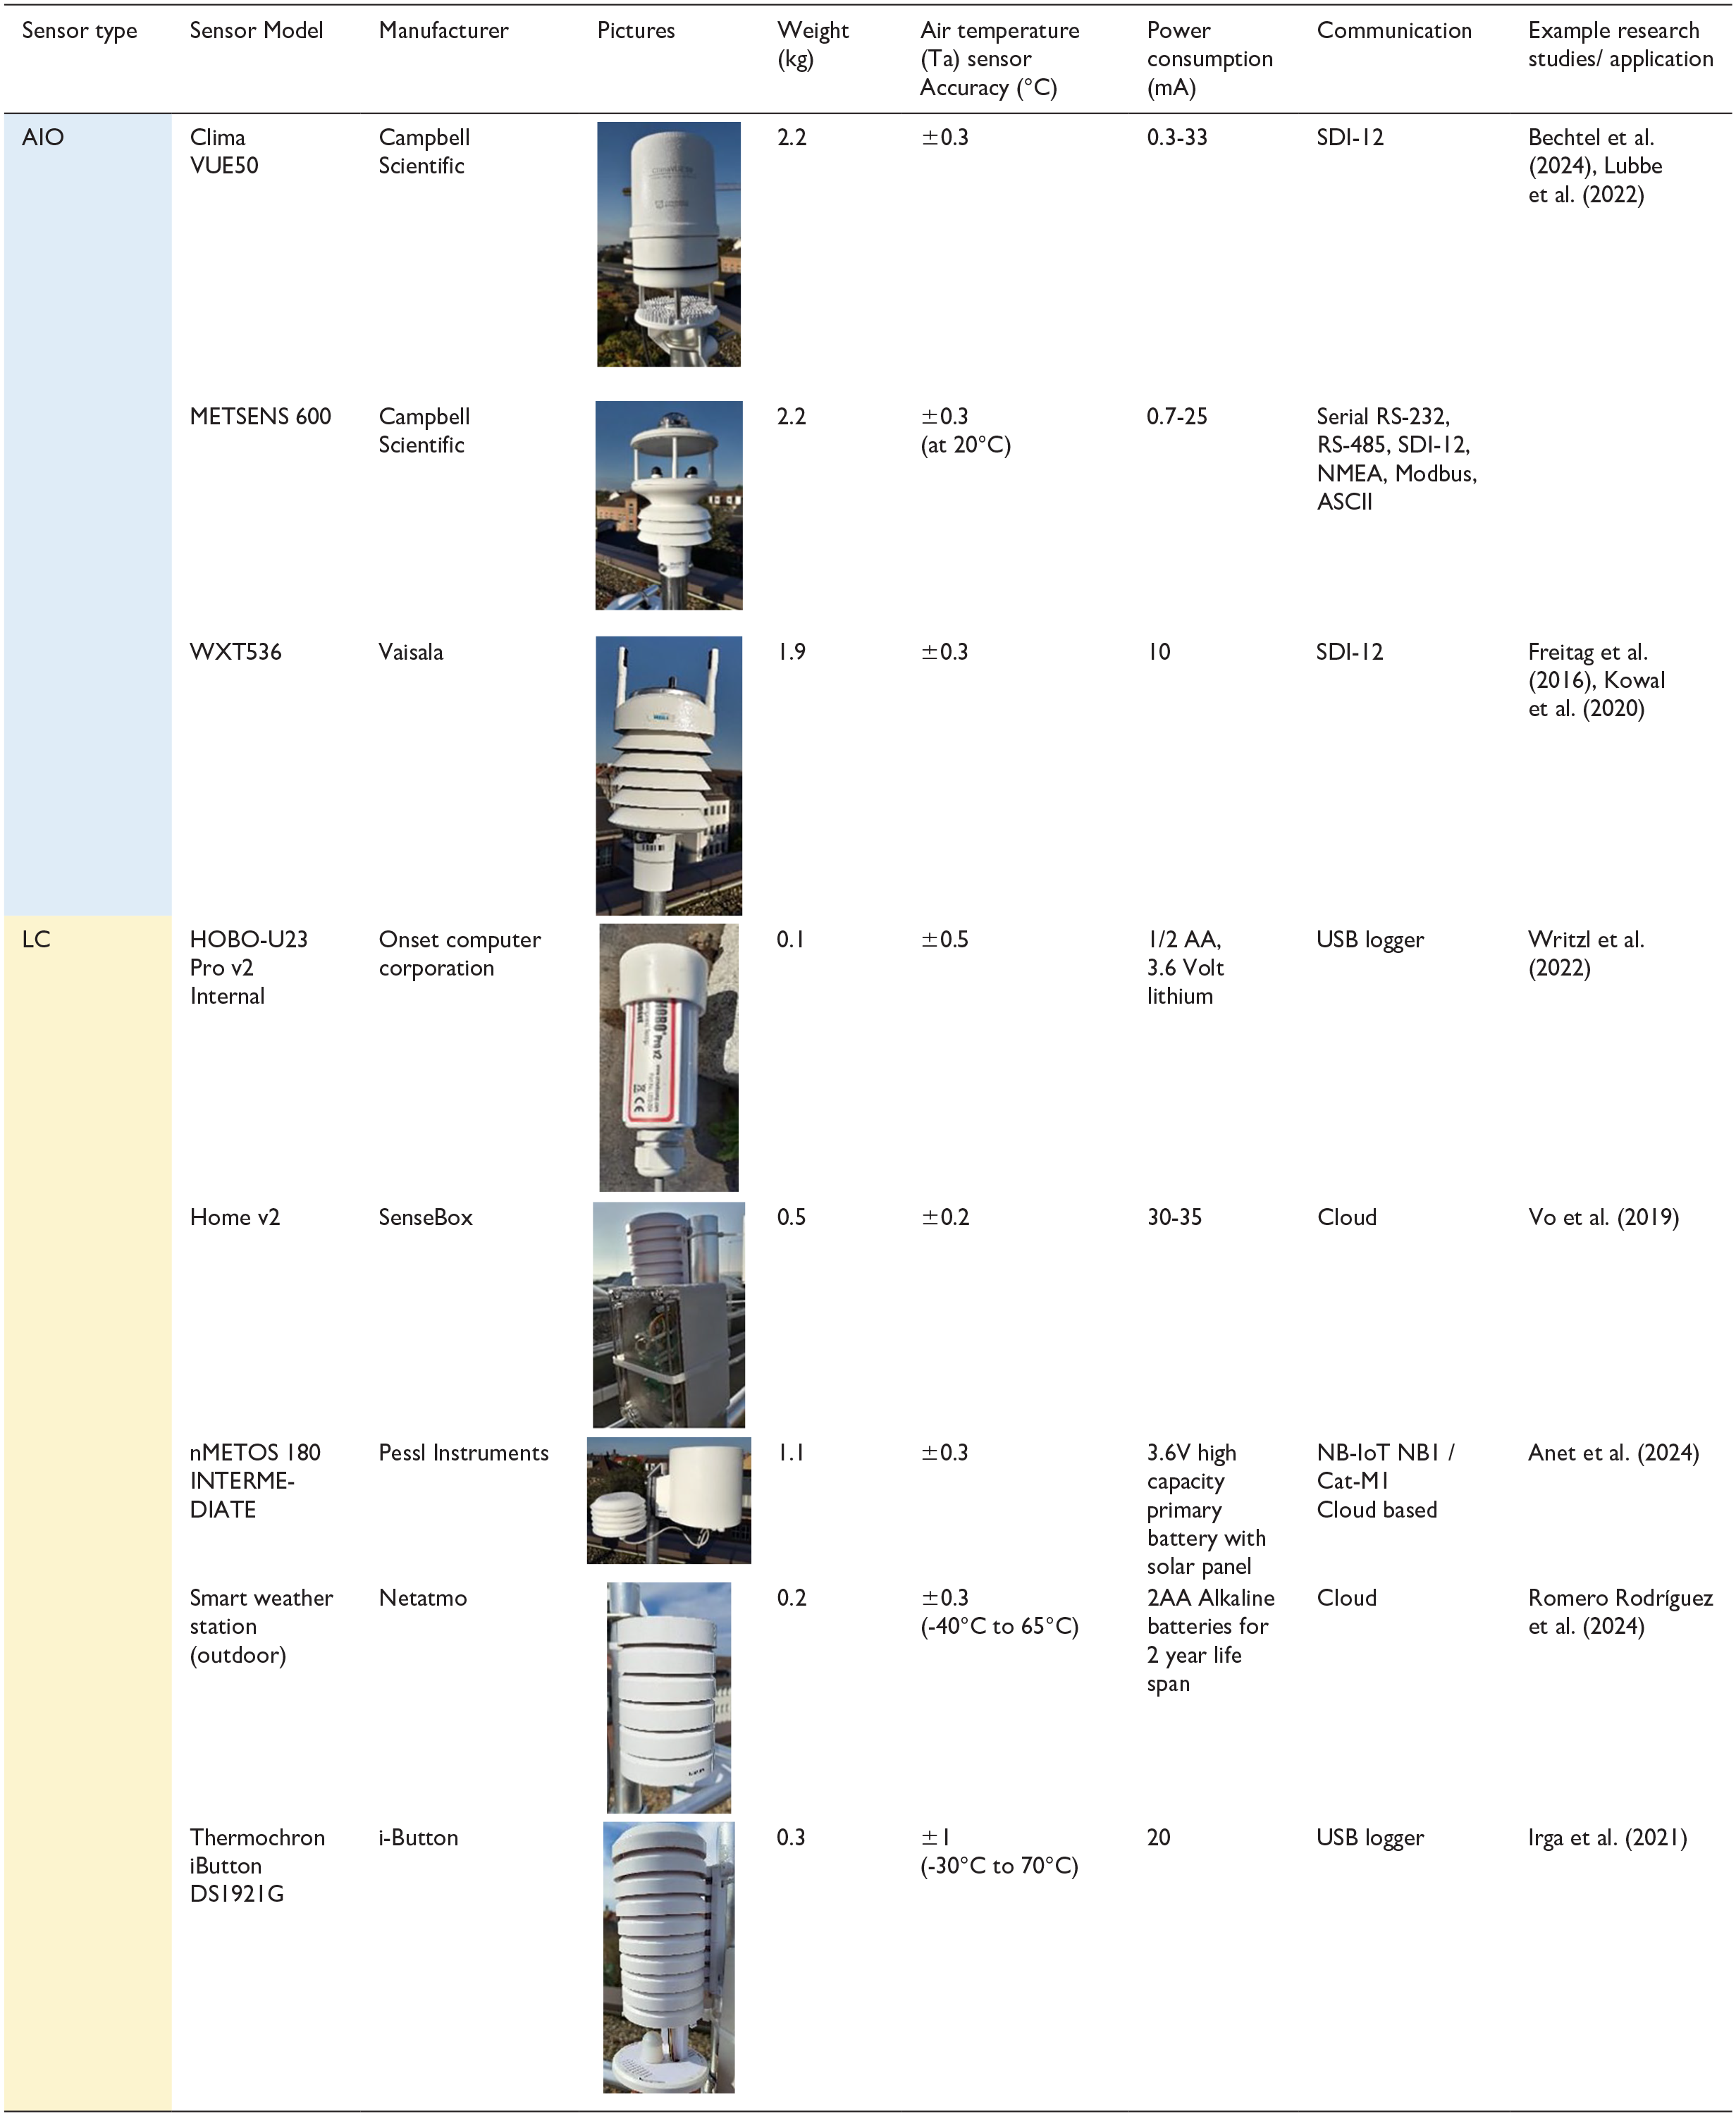
In total eight (three AIO and five LC) sensors were selected (Table 2) for the testing phase with the inclusion of HygroVUE10 sensor for reference with passive and active ventilation during in-situ testing. In CC testing, CC air temperature (±0.1 K to ±0.5 K) were taken as the reference value. SenseBox could not be operated due to technical failure in power supply, data observation and communication errors resulting in exclusion from the testing.
Overview of selected AIO and LC sensors provided by the manufacturers used in this study. The specifications are accurate as of December 2022. All sensor photos are from the In-situ test-bed site.
Climate chamber testing
A climate chamber (CC) also known as an environment chamber is a designed platform for simulation and testing with controlled environmental parameters ranging from small single sensor size to a walk-in size chamber (Dong et al., 2018; García-Contreras et al., 2018; Haka, 2020). In this study, the climate chamber WK3 Klima3000 (WEISS Technik North America Inc., 2022), having a temperature accuracy (±0.1 K to ±0.5 K), temperature range (-45°C to +180°C), change rate of 4K/min for heating and 3K/min for cooling, was used for sensor testing. The CC testing was held from 4 November 2024 to 8 November 2024. The sensors were not calibrated independently before the testing and sensor calibration report from manufactures were used in this study.
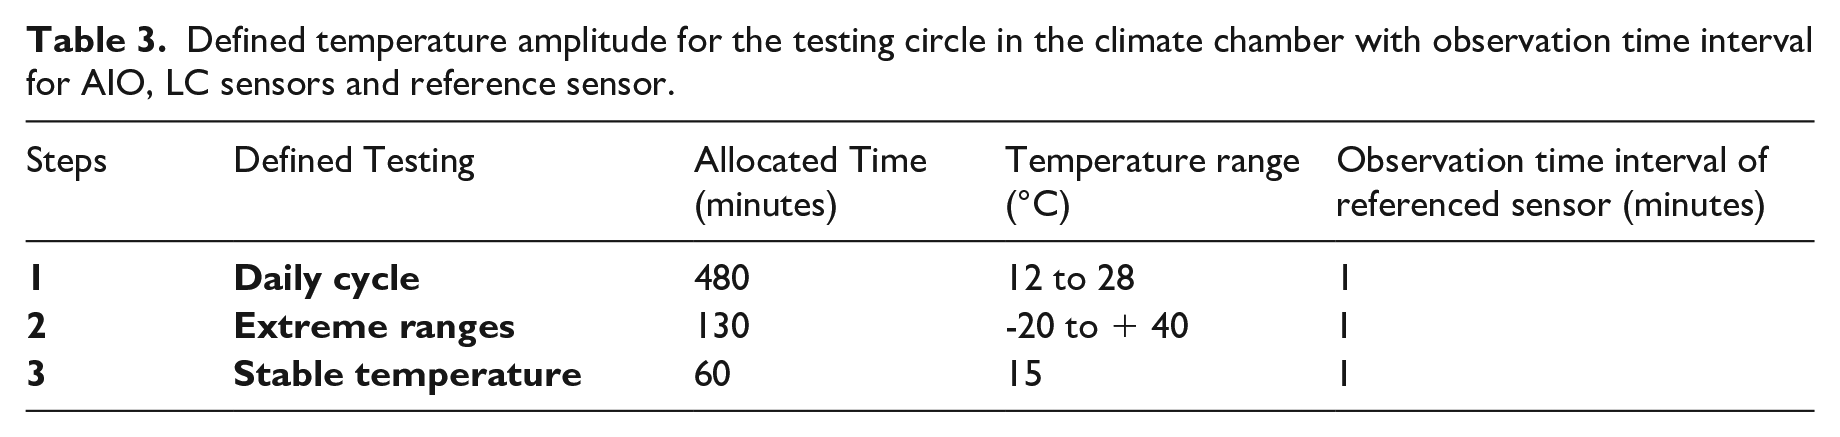
The sensors were all placed together on one tray (Figure 2) having an area of 9000 cm2 (0.9m2) in the CC to check the response of sensors with three temperature amplitudes (Table 3). The air temperature sensors could not be removed from the radiation shields particularly for the AIO sensors. For this reason, we decided to keep the radiation shields for all sensors, even though the air exchange is strongly reduced in the CC setting.
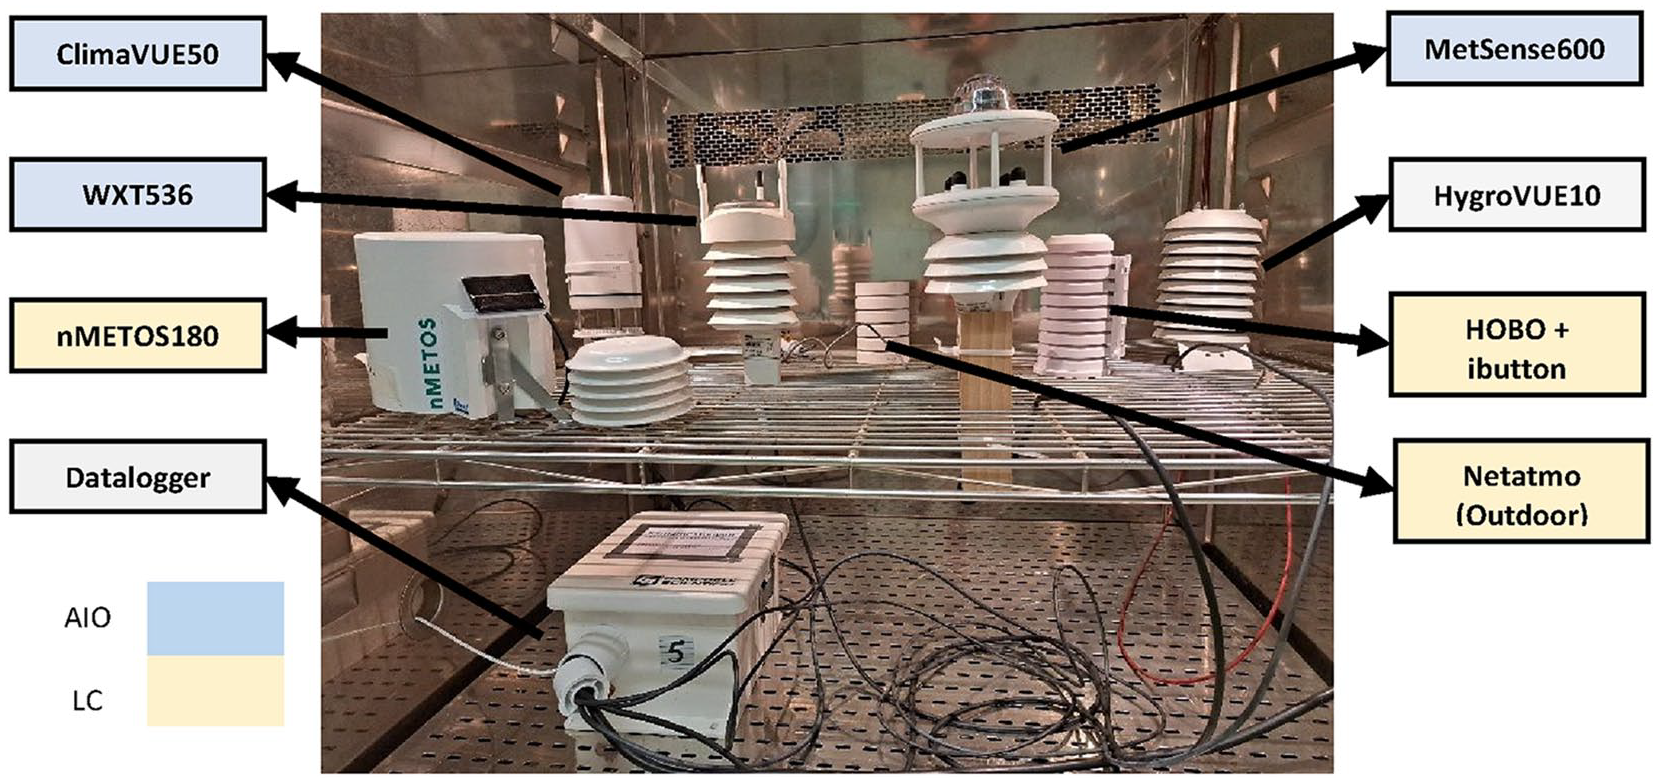
Climate chamber testing set-up of sensors. The observations were collected through a CR350 data logger provided with direct electric power cable (black) on the right bottom and communication USB cable (white) using sealed pathways on the left bottom of the climate chamber respectively. LC sensors are labelled in yellow and AIO in blue.
Defined temperature amplitude for the testing circle in the climate chamber with observation time interval for AIO, LC sensors and reference sensor.
In-situ testing
In the in-situ testing process, the sensors (METSENS 600, ClimaVUE50, WXT536, nMETOS180, HOBO-U23, Netatmo, SenseBox HOME and i-Button) were installed on a test bed (Figure 3) designed for an easy and portable setting up for open environment observations as recommended by Chapman et al. (2015). The test period was held from 17 April 2024 to 17 May 2024. The test bed was installed on a roof top of a building at Holländischer Platz campus of Kassel University, coordinate location: 51.325372°N and 9.504536°E. It had a dimension of 3m in length and 1.3m in height. The sensors were installed on the test bed at a height of approximately 2m from the surface of the rooftop which itself was 15m above ground level. The AIO sensors were aligned to the North with the help of a magnetic compass. All the sensors were positioned in a way that they had similar height position from the ground (WMO, 2014) and were covered with radiation shields for reducing the direct impact of solar radiation (Burt and Podesta, 2020; Huwald et al., 2009). The METSENS 600, ClimaVUE50, WXT536 and nMETOS180 sensors’ power supply came from solar panels with back up batteries. HOBO-U23, Netatmo (outdoor module), SenseBox and i-Button had their own internal batteries for energy supply except for Netatmo (indoor module) that required a constant direct power supply. The air temperature variable was taken from HygroVUE10 sensor while wind speed data was taken from MetSense600 for analysis. For in-situ testing, we selected HygroVUE10 (SHT35 air temperature and humidity sensor) with a manufactured defined accuracy (±0.2°C) (Campbell Scientific inc., 2022b; Fugazza et al., 2023; Heiser et al., 2024) reference sensor. The reference sensor was first used with active ventilation through a TS-200 Apogee’s 24volt fan-aspirated radiation shield (Apogee Instruments, Inc., 2022) and then with a natural ventilated radiation shield for the comparison.
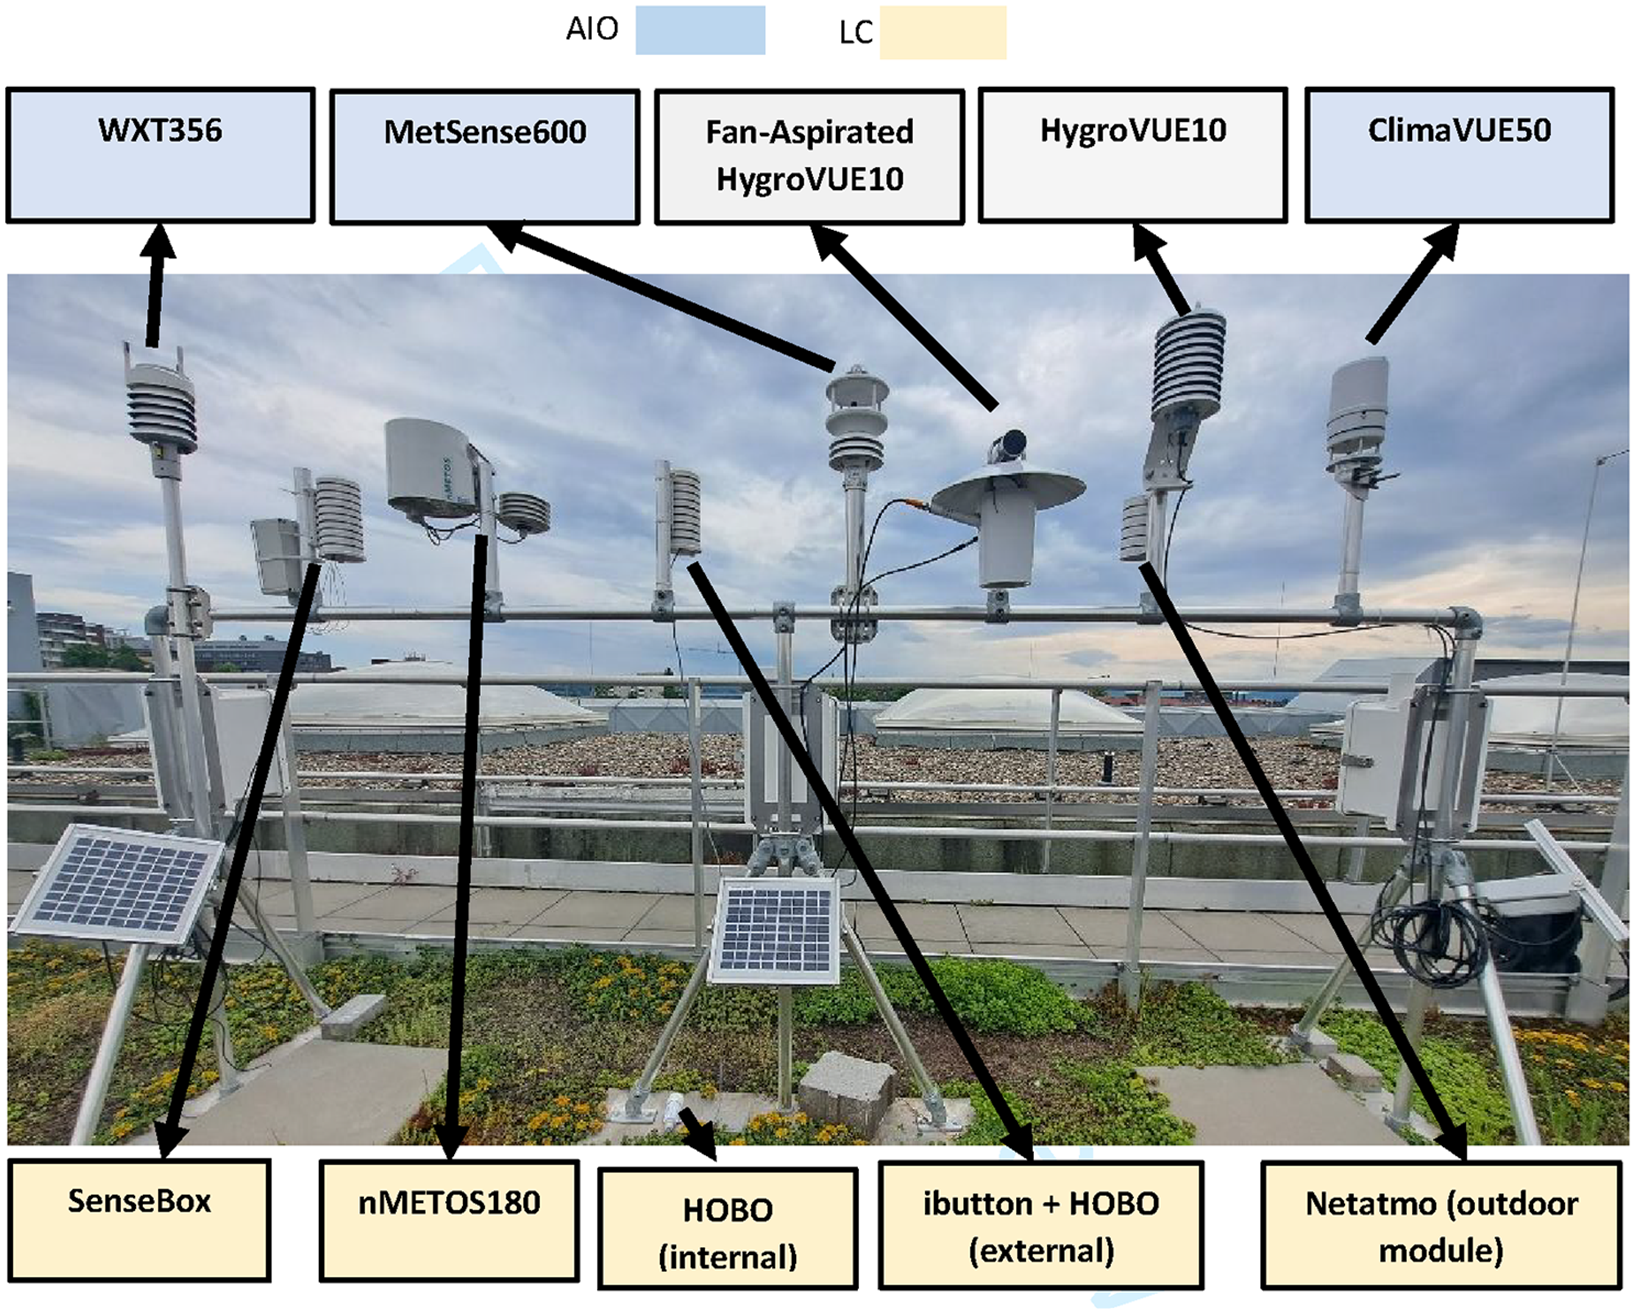
In-situ set up for the outdoor testing with AIO (blue) and LC (yellow) sensors, mounted on a testing bed with data logger boxes supported by solar panels for power supply except for fan-aspirated radiation shield that was given direct power supply.
Data analysis
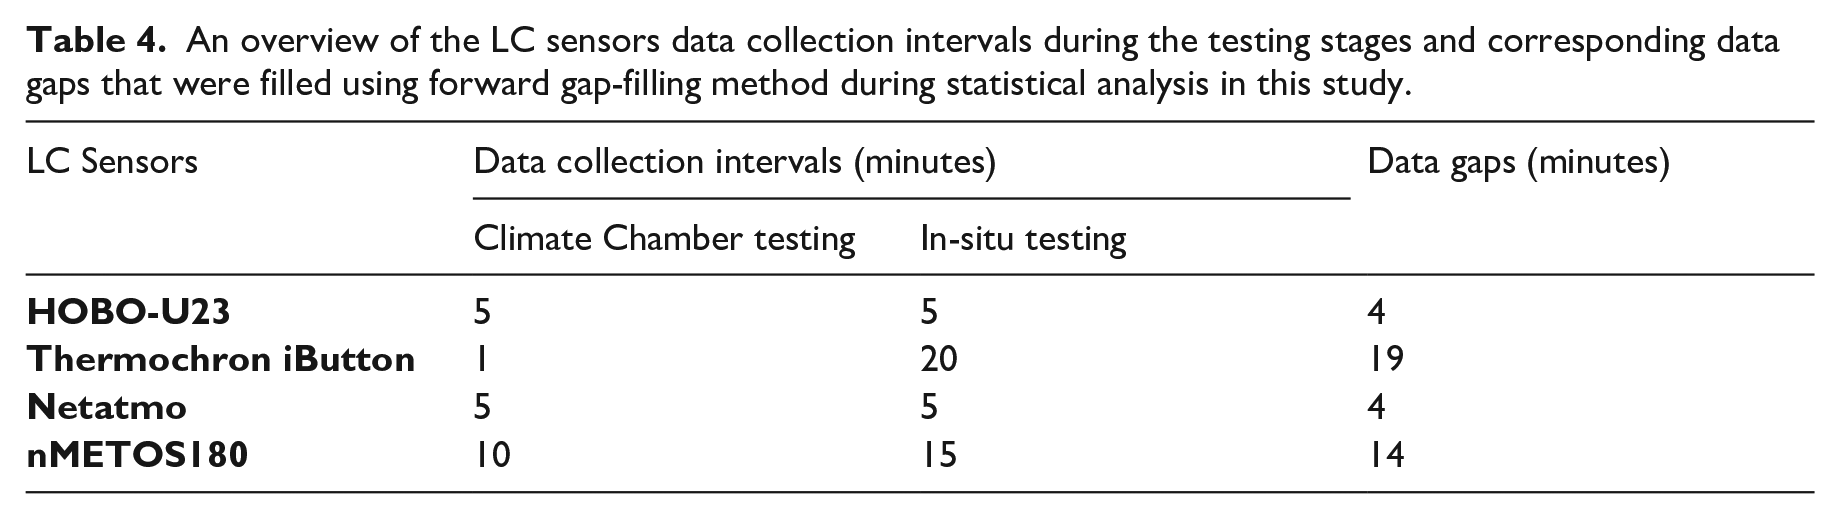
The sensors were compared for their outputs for air temperature observations in both the CC and in-situ testing scenarios. The data collection was programmed for each sensor’s highest available temporal resolution. Data was collected in 1-minute to 15-minute intervals to represent the sensor response to fluctuating temperature change in the surrounding environment (Burt and Podesta, 2020; Chan et al., 2021; WMO, 2014). AIO sensors were programmed with 1-minute intervals. The LC sensors (Netatmo and HOBO-U23) were programmed with 5-minute intervals while nMETOS180 was 15 minutes. i-Button was programmed with 1-minute intervals for CC testing. Due to minimum memory storage capacity (512 bytes) and only 2048 readings with 1-minute intervals (i-Button, 2022), it was designed with 20-minute intervals with data collection after every 34 hours to cover the daily changes during in-situ testing data collection period.
As LC sensors had different temporal resolution and the observation data were found to have data gaps ranging from 4 to 19 minutes throughout the testing stages (Table 4). These data gaps were then filled with python program function (fill.na()) (Puertas, 2024) where the forward filling method was used that takes the last value in the data series and fills it in the forward gaps till the next available value. This could create some biases for data sets but it did not affect the temporal intervals (10 minutes in CC testing and hourly data in-situ testing) in this study. But such datasets need to be investigated in future research works if handling this method with big data gaps and short temporal intervals. The resulting datasets for each sensor were then statistically compared with the reference sensor based on Absolute Mean Deviation (MAD), Root mean square deviation (RMSD), regression analysis and coefficient of determination (R2) following other studies (DelSole, 2022; Mudelsee, 2019).
An overview of the LC sensors data collection intervals during the testing stages and corresponding data gaps that were filled using forward gap-filling method during statistical analysis in this study.
Results and discussion
Climate chamber testing
Daily cycle test
The daily cycle testing (Figure 4a) analyzed with hourly air temperature values indicated that sensors followed the daily temperature fluctuation resembling a normal summer day with variability based on their accuracy, response time and insulation effects. The increasing temperature change from 12°C was observed by sensors in similar pattern except for i-Button and Netatmo, which showed a deviation of 4 K and 5 K respectively. Netatmo showed the maximum deviation of 3-4 K during both the decreasing and increasing temperature values than the rest of the sensors (Figure 4b), which is related to the slow thermal response of the Netatmo sensor and effect of radiation shield (Harrison, 2010; Meier et al., 2017).
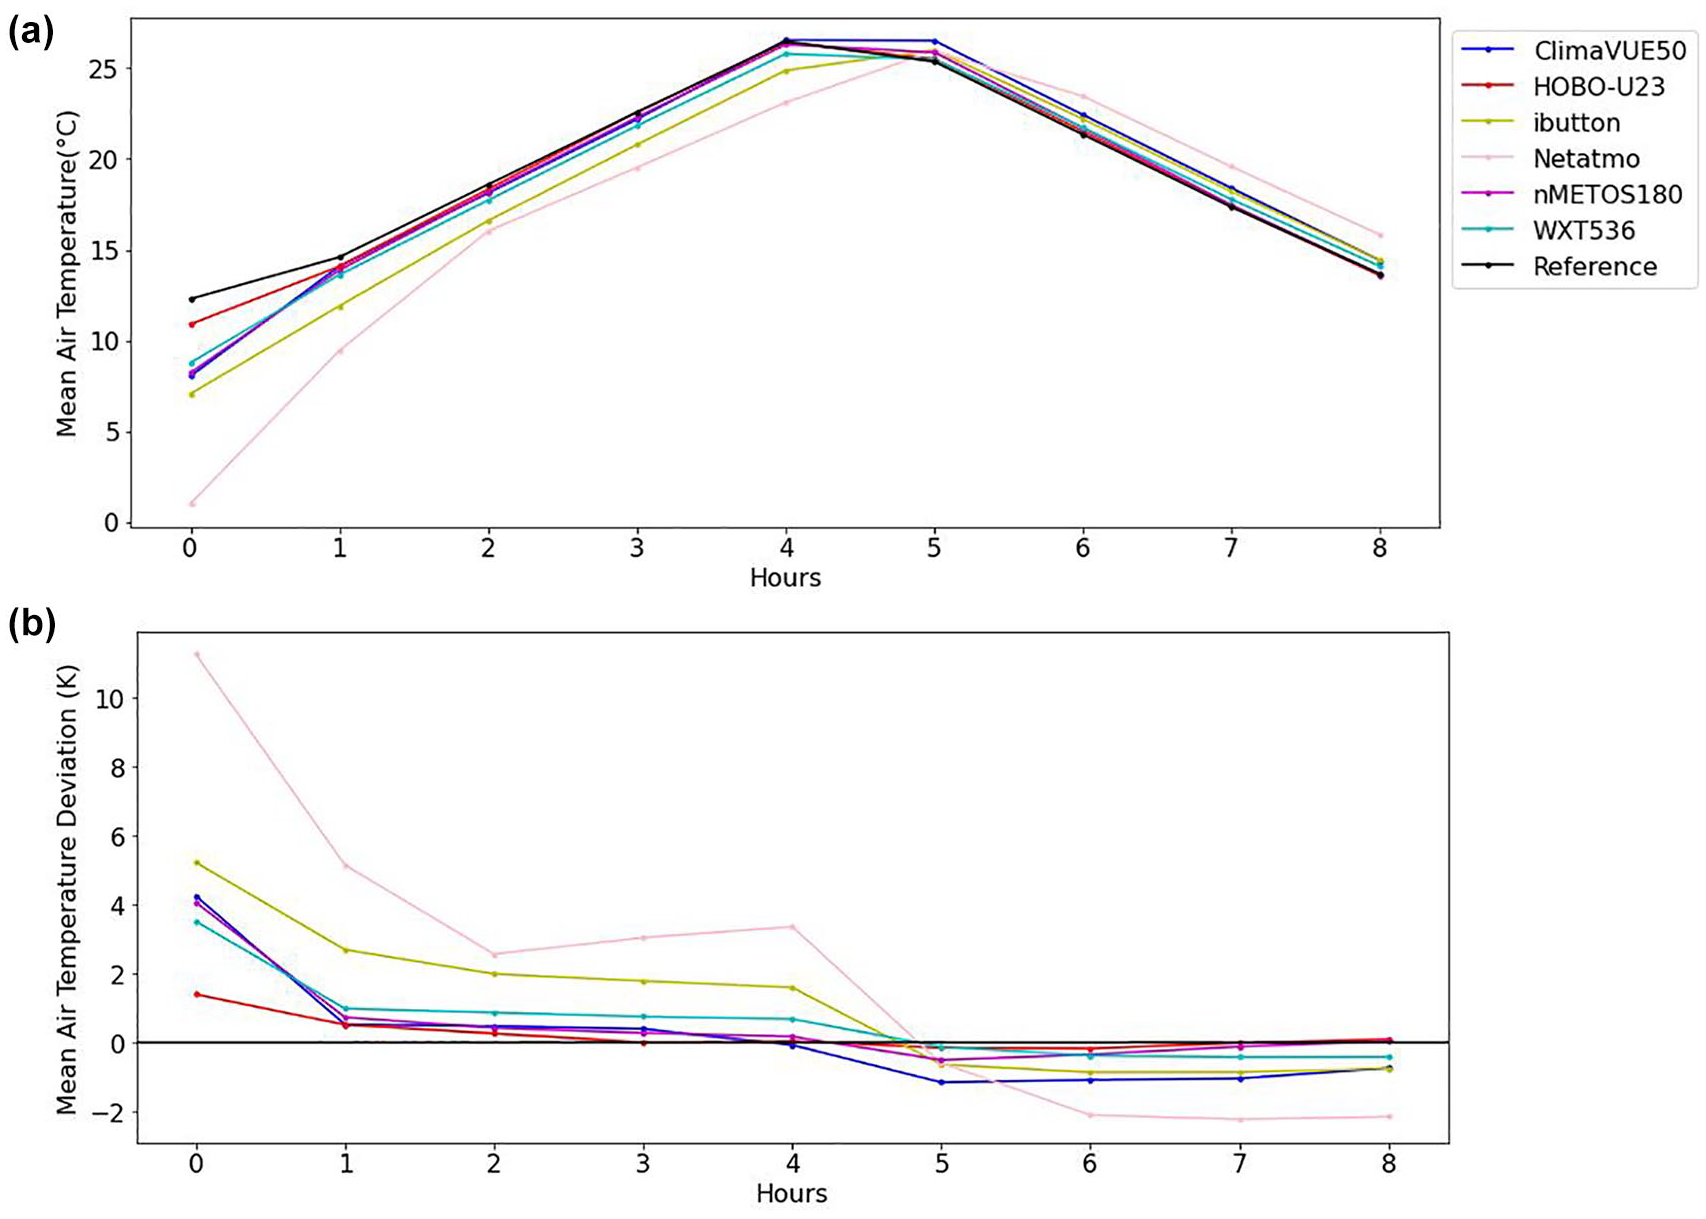
Hourly air temperature observations during daily cycle (12°C to 28°C) testing in the climate chamber (a) and mean air temperature deviations of sensors from reference sensor (b), observed during the 8-hour time period.
Extreme range test
During the extreme range testing with 10-minute air temperature observations (Figure 5), it was observed that all the sensors were responding with 5 to 15 K deviation from the referenced CC values. The sensors (iButton and Netatmo) showed higher deviation from the reference sensors while nMETOS180 showed a minimal deviation from the referenced values. AIO sensors (ClimaVUE50 and WXT536) had a consistency in their observations indicating their slow response to sudden temperature changes. Similar results were found by Dombrowski et al. (2021) indicating that AIO sensors’ response to extreme temperature fluctuations during the nighttime is lower compared to the reference weather station. Chodorek et al. (2022) identified that LC sensors tend to respond quickly to sudden temperature changes due to their response time characteristics based on manufactures’ accuracy and material quality. Our results also indicated that sensors tend to respond quickly to decreasing temperature due to internal condensation as identified by Aranda and Merlone (2024) during their on-site calibration of air temperature sensors. Increasing temperature is observed slowly because of slow thermal response of sensor materials which was concluded by Aranda and Merlone (2024) as well. The temperature range of -20°C to +40°C has larger impact on the uncertainties of conventional sensors such as thermocouples due to increased sensitivity levels with extreme temperature ranges (Foken, 2021; Oukaira et al., 2024). Wang et al. (2010) related the temperature variability observed differently by each sensor as due to the thermal inertia property of its components and defined thermal inertia as the observed delay in a body’s temperature response during heat transfers caused by factors like thermal conductivity, density and specific heat of the material body. Verbeke and Audenaert (2018) applied the principle of thermal inertia on buildings and its process of heat exchange relative to its environment.
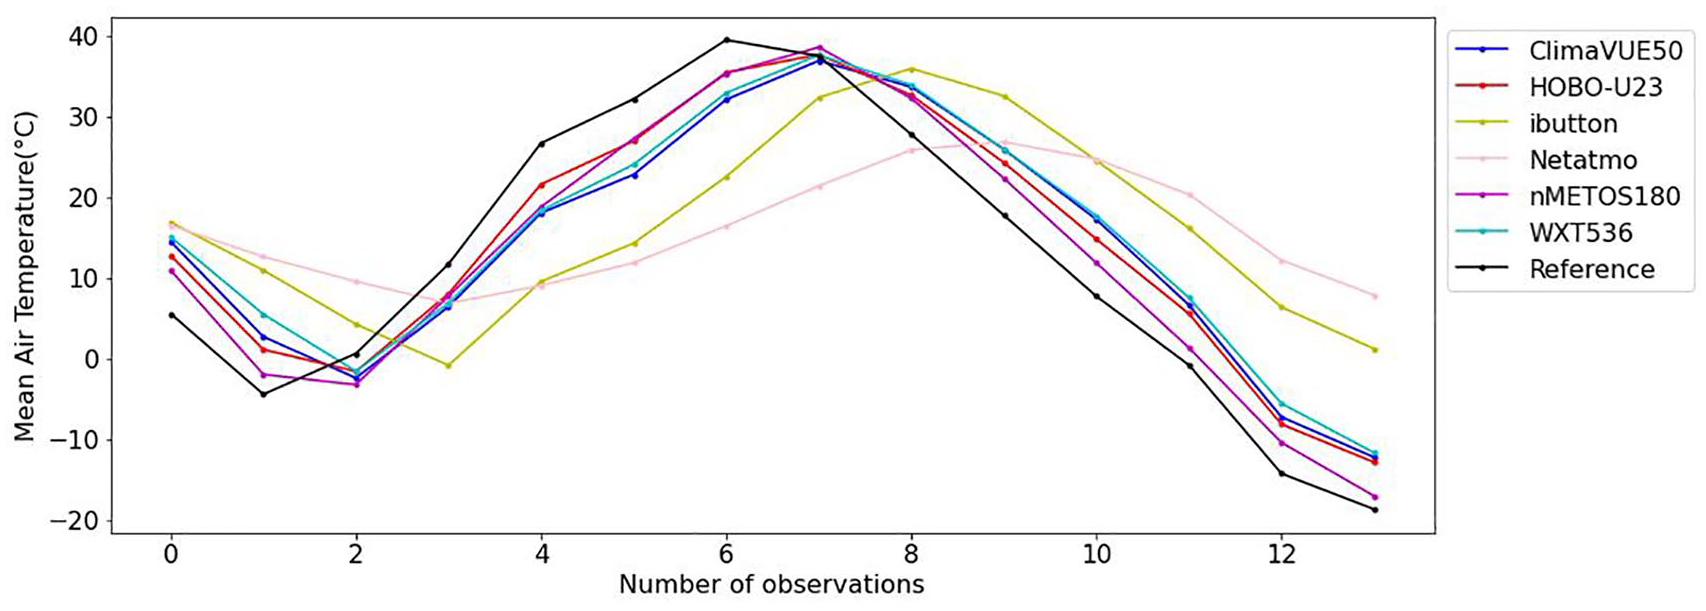
Extreme range test in climate chamber using 10-minute mean air temperature (−20°C to +40°C) testing results for all sensors including the reference climate chamber observed during the 130-minute time period.
Stable temperature test
The 15°C stable testing with 10-minute mean air temperature observation data (Figure 6) indicated that all sensors except for Netatmo took approximately 15-20 minutes to reach the referenced temperature value (15°C) of the CC. Chodorek et al. (2022) showed that each sensor tended to take a particular time to reach to specific level of temperature based on their sensor thermal response and accuracy scales.
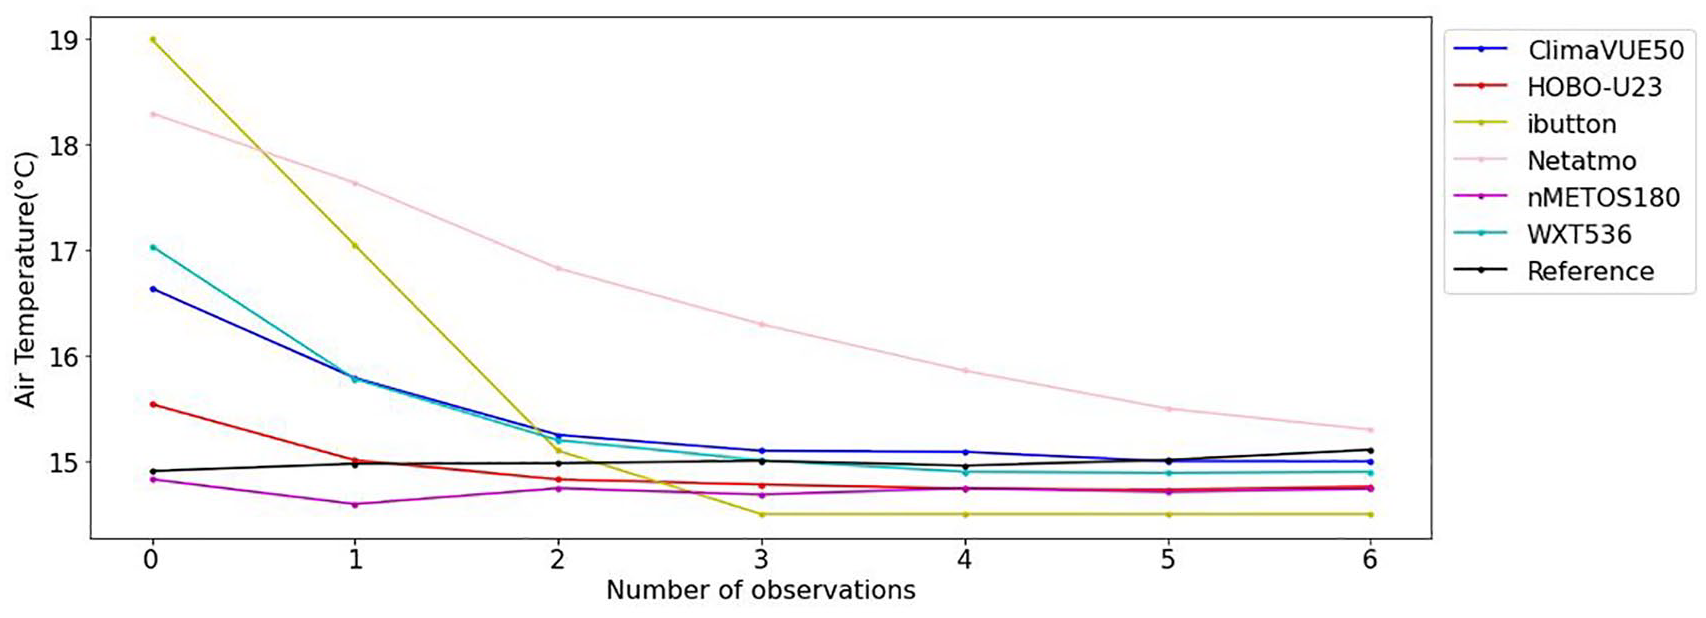
Stable temperature testing in climate chamber using 10-minute mean air temperature for all sensors including the reference climate chamber values observed during the 60-minute time period. It also demonstrates the response time of sensors to reach a defined temperature value from starting point.
Netatmo showed the longest duration before reaching the 15°C stable level with more than 50 minutes during the 60 minutes testing time period. This deviation is related to the compact design of Netatmo sensor cases without any ventilation and insulation to the surrounding environment. Meier et al. (2017) also found that the manufactured design of Netatmo sensor causes error in the air temperature observations for outdoor modules that are exposed to direct radiation, which needs to be corrected through quality control (QC) methods. He suggested that two hours are required for the sensor to reach a constant level. Büchau (2018) tested the outdoor module of Netatmo air temperature sensor (SHT20) with and without the cylindrical aluminum shell and found that the time constant for Netatmo sensor increase by 5 minutes when observed with the cylindrical aluminum shell. He suggested a 1-hour time period to reach a constant level for Netatmo sensors. We have included the effect of radiation shields on the observation values in this study.
Summary of the CC test
Comparing the results from statistical analysis (Table 5) for all the datasets with 10-minute mean air temperature values, HOBO-U23 had the lowest MAD in daily cycle test and nMETOS180 in extreme range test and in stable temperature test among the group of sensors respectively. The extreme range test results indicated that Netatmo had the highest MAD, MSD and RMSD and lowest coefficient of determination (R2) values among the group. On the other hand, nMETOS180 had the lowest MAD, RMSD, MSD and higher R2 for air temperature observations. Even though it is evident that HOBO-U23 had the lowest MAD, MSD and RMSD in daily cycle testing, and second lowest MAD, MSD and RMSD during extreme range and stable temperature testing, it could not be considered for longer time period of air temperature observations collections due to manual data collection method (Onset Computer Corporation, 2022).
An overview of 10-minute mean air temperature observations comparative analysis for climate chamber testing indicating the statistical values of mean absolute deviation (MAD), mean square deviation (MSD), root mean square deviation (RMSD) and coefficient of determination (R2) for daily cycle, extreme range and stable testing periods for the sensors. All the sensors were analyzed with CC temperature values as reference. The highest values (dark blue) and lowest values (light blue) are indicated with R2 values above 0.5 (green).
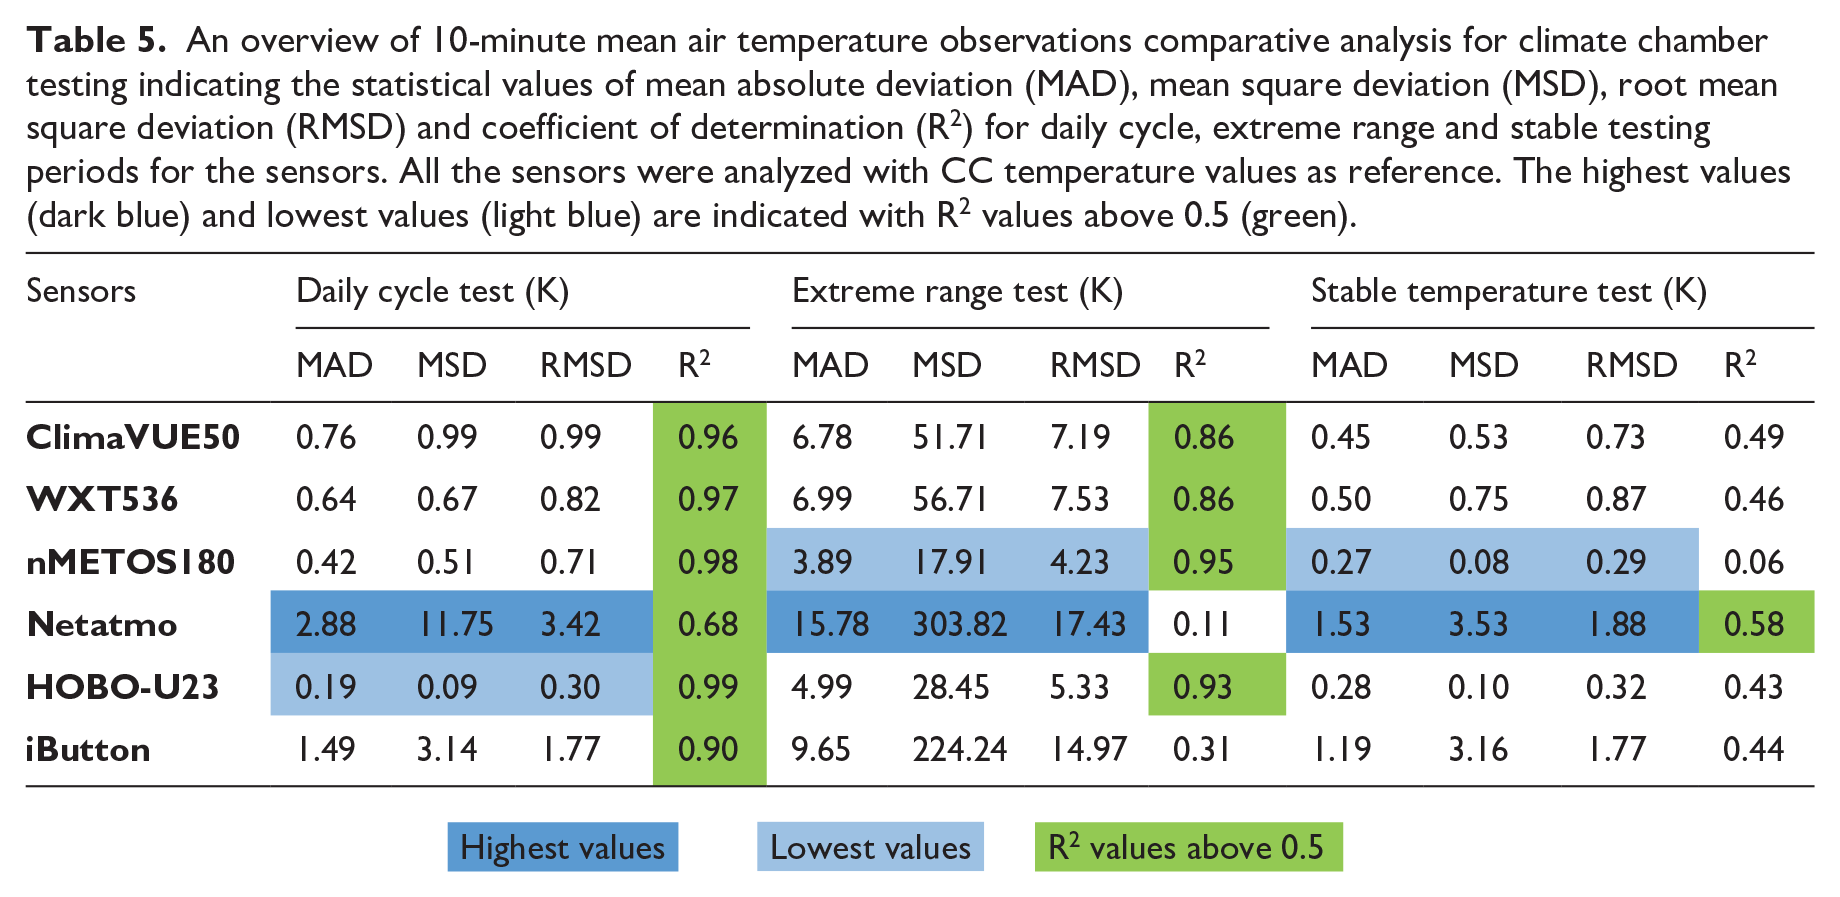
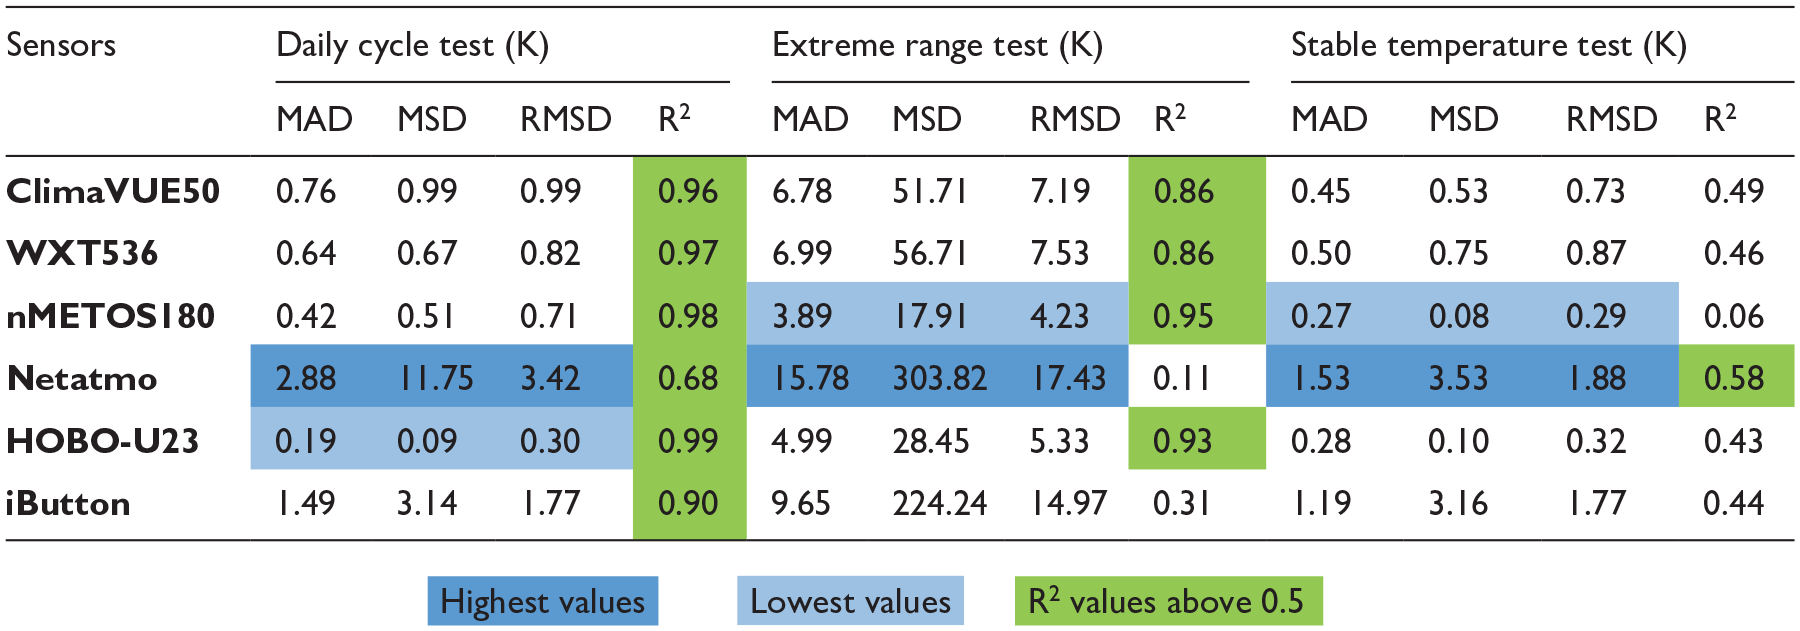
From the results of the extreme range test, it is recommended that nMETOS180 sensor could be applied for air temperature observations in extreme environments. The stable temperature test showed that AIO sensors (ClimaVUE50 and WXT536) with high R2 values, tend to have low MSD values while LC sensors (nMETOS180, HOBO-U23 and iButton) have low MSD and low R2 values indicating their quick response to the air temperature fluctuations in short periods of observations. During the daily cycle testing, HOBO-U23 and WXT536 sensors showed lowest MAD, MSD, RMSD and highest R2 values among the LC and AIO sensors respectively. Kowal et al. (2020) applied different environmental conditions on two LC temperature sensors (HMP 155 and Vaisala’s HMP 45AC) and concluded that time, high humidity, high and low temperatures and rapid temperature changes have negative effect on the repeated testing results. Dombrowski et al. (2021) compared to AIO compact sensors ATMOS41 (similar to ClimaVUE50) and Vaisala WXT520 with reference weather station data. The authors identified that during nighttime and rainfall, the ATMOS41 showed lower daily maximum values due to its exposed air temperature sensor being affected by cooling as compared to shielded air temperature sensors. During the stable temperature testing, nMETOS180 had the lowest MAD (0.27) while Netatmo had the highest MAD (1.53) indicating the contrasting performance of LC sensors in the given experimental settings without ventilation to reach the stable temperature range. Burt and Podesta (2020) found through their sensor selection method that the response time of LC sensors should be critically observed along with differential experiment from a referenced weather station. Chan et al. (2021) concluded that cost effective LC electronic sensors, such as Arduino sensors and Internet-Of-Things (IoT), with mean bias errors below 20% could be used for environmental research instead of research grade sensors.
One important aspect for the CC observation analysis is that there was no ventilation provided to the sensors in CC testing and the sensor response variabilities were based on thermal insulation properties of each sensor based on type of radiation shield used as identified by Huwald et al. (2009) as well. Yang et al. (2021) concluded through the radiative error experiment that radiation shields heat up by direct or indirect radiation on the external surface. Nakamura and Mahrt (2005) identified air temperature measurement errors to be caused by insufficient wind flow through the sensors and internal radiative heat. This supports our argument that CC testing air temperature results cannot be directly compared to outdoor air temperature observations and need to go through detailed quality control parameters as recommended by Fenner et al. (2021).
In-situ testing
During the in-situ testing in an open environment, the sensors were exposed to ventilation and solar radiation as compared to the controlled CC testing. The time series representation of air temperature observations (Figure 7) of all sensors during the experimental time period showed daily fluctuations and deviations to the reference sensor values. We observed that LC sensors (HOBO-U23 and iButton) had extreme deviations during day and night air temperature observations compared to the other sensors.
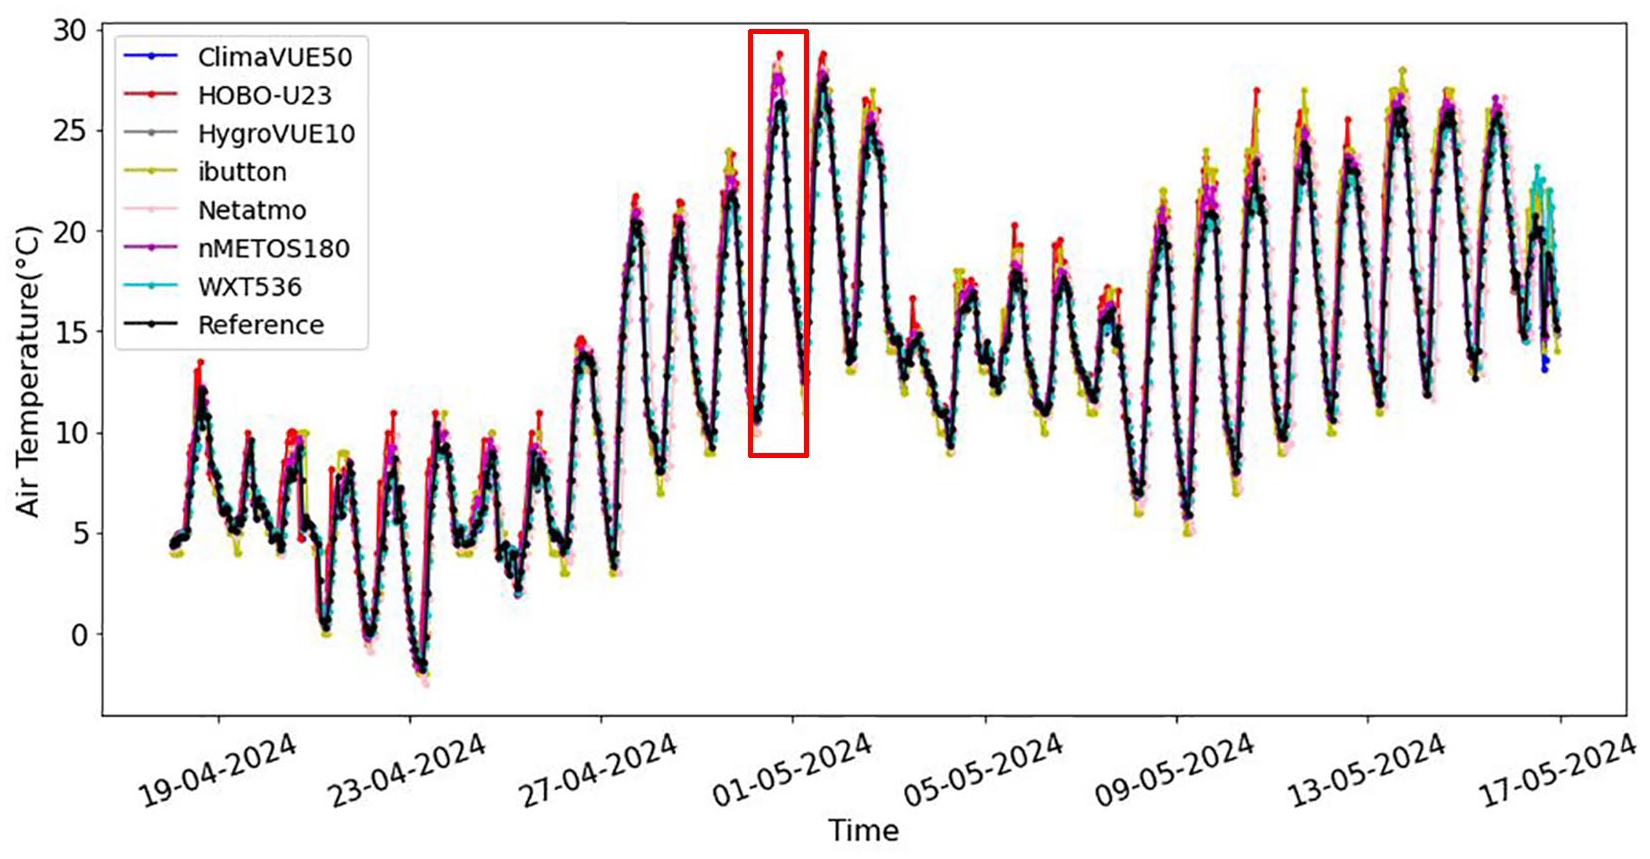
In-situ testing using hourly air temperature observation time series representation of all sensors’ analysis with the reference sensor (Fan aspirated HygroVUE10) during the 30-day time period. The highlighted red box represents the hottest day (1 May 2024) selected for day and night deviation analysis.
Day and night analysis
In order to understand the variabilities in air temperature deviations of sensors, we focused on the deviations occurring during day and nighttime observations. We classified the observed hourly data into day and night on the basis of observation time with data observed during 6:00 to 18:00 as daytime and from 19:00 to 5:00 as nighttime data, respectively. Based on this differentiation between day and nighttime data sets, we performed air temperature deviation analysis of all the sensors with respect to the referenced sensor. The air temperature deviation results for the hottest day (1 May 2024) during the 30-day time period was selected for day and nighttime deviation analysis. The results (Figure 8) showed that LC sensors (iButton and HOBO-U23) had the highest deviations from the reference sensor during daytime. One of the causes is that both the sensors (iButton and HOBO-U23) were inside a single radiation shield (Figure 3) that was exposed to solar radiation that could have an effect of the internal heating of the sensors but as indicated previously, we did not investigate the types of radiation shields and their qualities in our study.
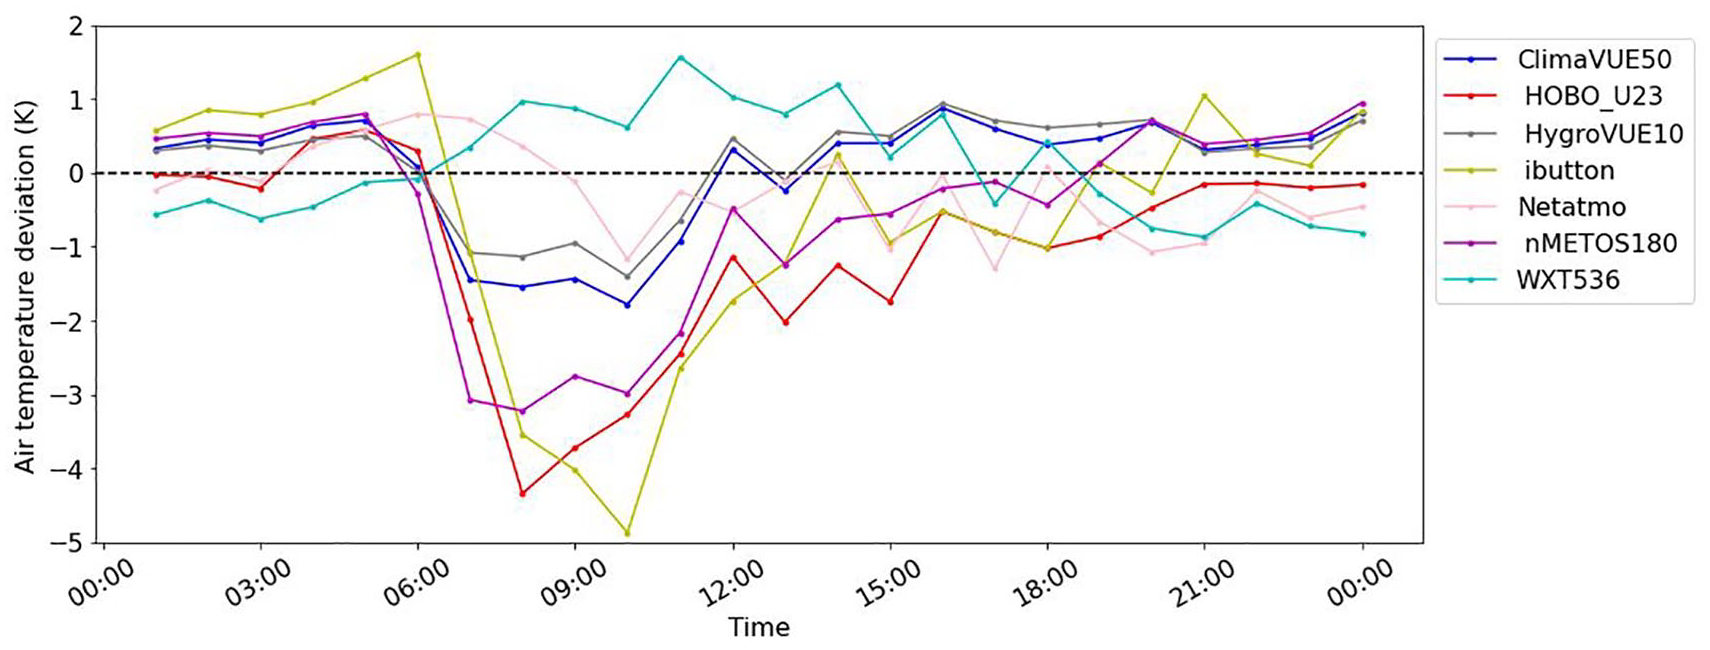
One day hourly air temperature deviations time series of sensors (shown with different colors) from the reference sensor (Fan-aspirated HygroVUE10) indicated as a black dotted line, observed during the selected hottest day (1 May 2024) in the in-situ testing. The daytime was classified as 06:00-18:00 and nighttime as 19:00-05:00 respectively.
During the nighttime observations, AIO sensor (WXT536) showed high deviation at the start of the night but LC sensor (iButton) showed highest deviations from the reference sensor during the later hours of nighttime observations. The AIO sensors (ClimaVUE50 and WXT536) indicated lower deviations from the reference sensor but their high cost and data management system makes them difficult to select for dense observation network projects, as identified by Chapman et al. (2023) and Ramírez-Moreno et al. (2021).
Dombrowski et al. (2021) observed that the exposed air temperature sensors of AIO compact sensors (such as ATMOS41) are affected by cooling during night and rainy wet days as compared to the radiation shielded reference station. All the sensors with different types of radiation shield observed the radiation and ventilation effect differently depending on the quality and type of radiation shield used. We have not analyzed the quality and material assessment of radiation shields for sensors in this study and these should be considered for comparative analysis in future. Huwald et al. (2009) identified that surface-reflected shortwave radiation (albedo effect) is a principal source of error in sensors even in the presence of ventilation and radiation shields. Harrison (2010) argued that ventilation errors at night with low wind speeds are often ignored for daily minimum temperature calibrations and affect the daily average air temperature results.
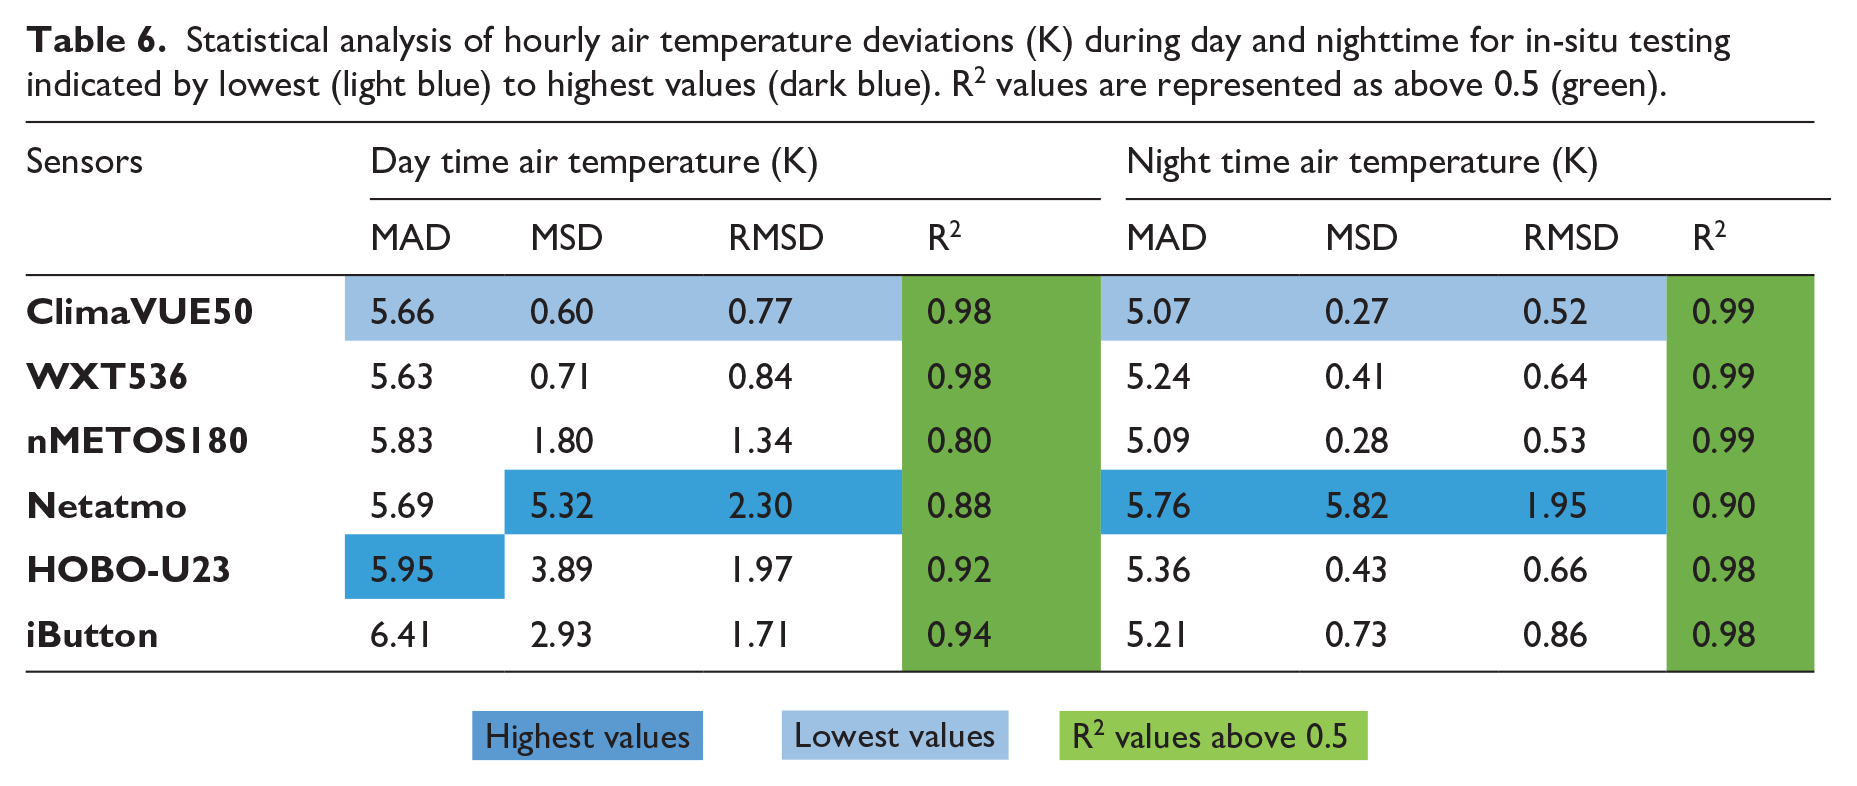
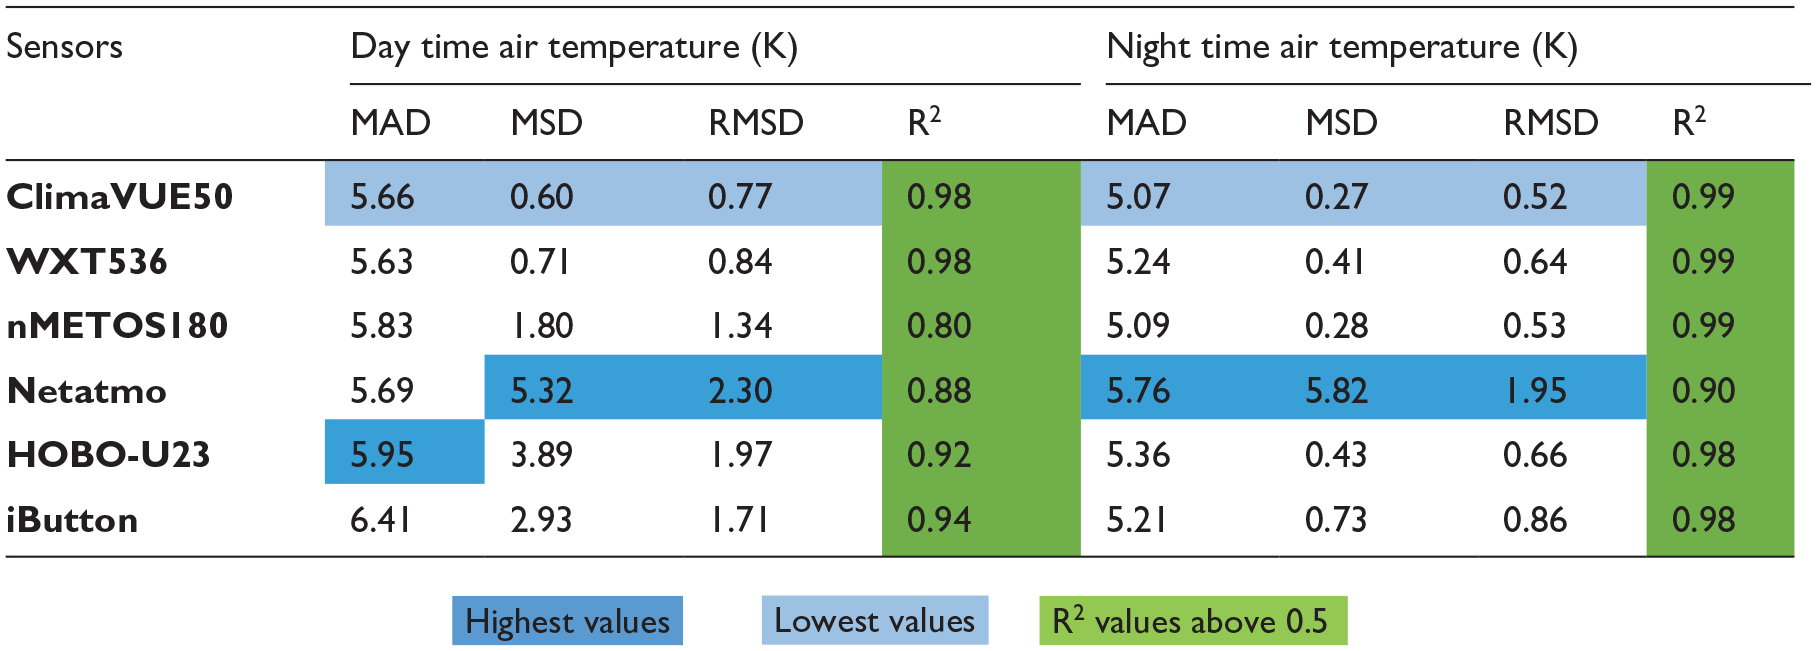
The statistical results of day and night air temperature observation analysis (Table 6) showed that AIO sensors have low MAD, MSD and RMSD values during daytime while LC sensors have high MAD, MSD and RMSD values. During nighttime observation, all sensors had low MAD, MSD, RMSD and high R2 except for Netatmo which showed high MAD (5.76 K) and low R2 (0.90). We related this exceptional behavior of Netatmo sensor to the slow thermal response of its outdoor module especially during nighttime observation. The variabilities in air temperature deviations, especially during daytime observations, were also related to the type of radiation shield used by that particular sensor but no further analysis was conducted on this aspect in this study. Netatmo performance in the in-situ testing made it a lower accuracy sensor for temperature observations but it has been used in many citizen science research studies because of its cost effectiveness, cloud based database and user-friendly interface (Brousse et al., 2022; Fenner et al., 2017, 2021; Meier et al., 2017; Ramírez-Moreno et al., 2021). The data from such networks requires quality control before applying for analysis as recommended by Fenner et al. (2021) and Ioannou et al. (2021). Büchau (2018) investigated the air temperature radiation deviations in Netatmo outdoor modules observed in different environmental conditions and concluded that air temperature deviations were caused by a combined effect of sensor outer casing (aluminum shell including the plastic inlet) response time and radiation observations from the surrounding environment. They suggested including the radiation effect of surrounding buildings as well for air temperature observations. nMETOS180 being from the LC sensor group performed close to the AIO sensors values during day and nighttime observations.
Statistical analysis of hourly air temperature deviations (K) during day and nighttime for in-situ testing indicated by lowest (light blue) to highest values (dark blue). R2 values are represented as above 0.5 (green).
Ventilation analysis
In order to understand the impact of passive and active ventilation on the air temperature observations, we tested all sensors with HygroVUE10 as a reference sensor, first with natural ventilated radiation shield and later with fan-aspirated ventilation shield.
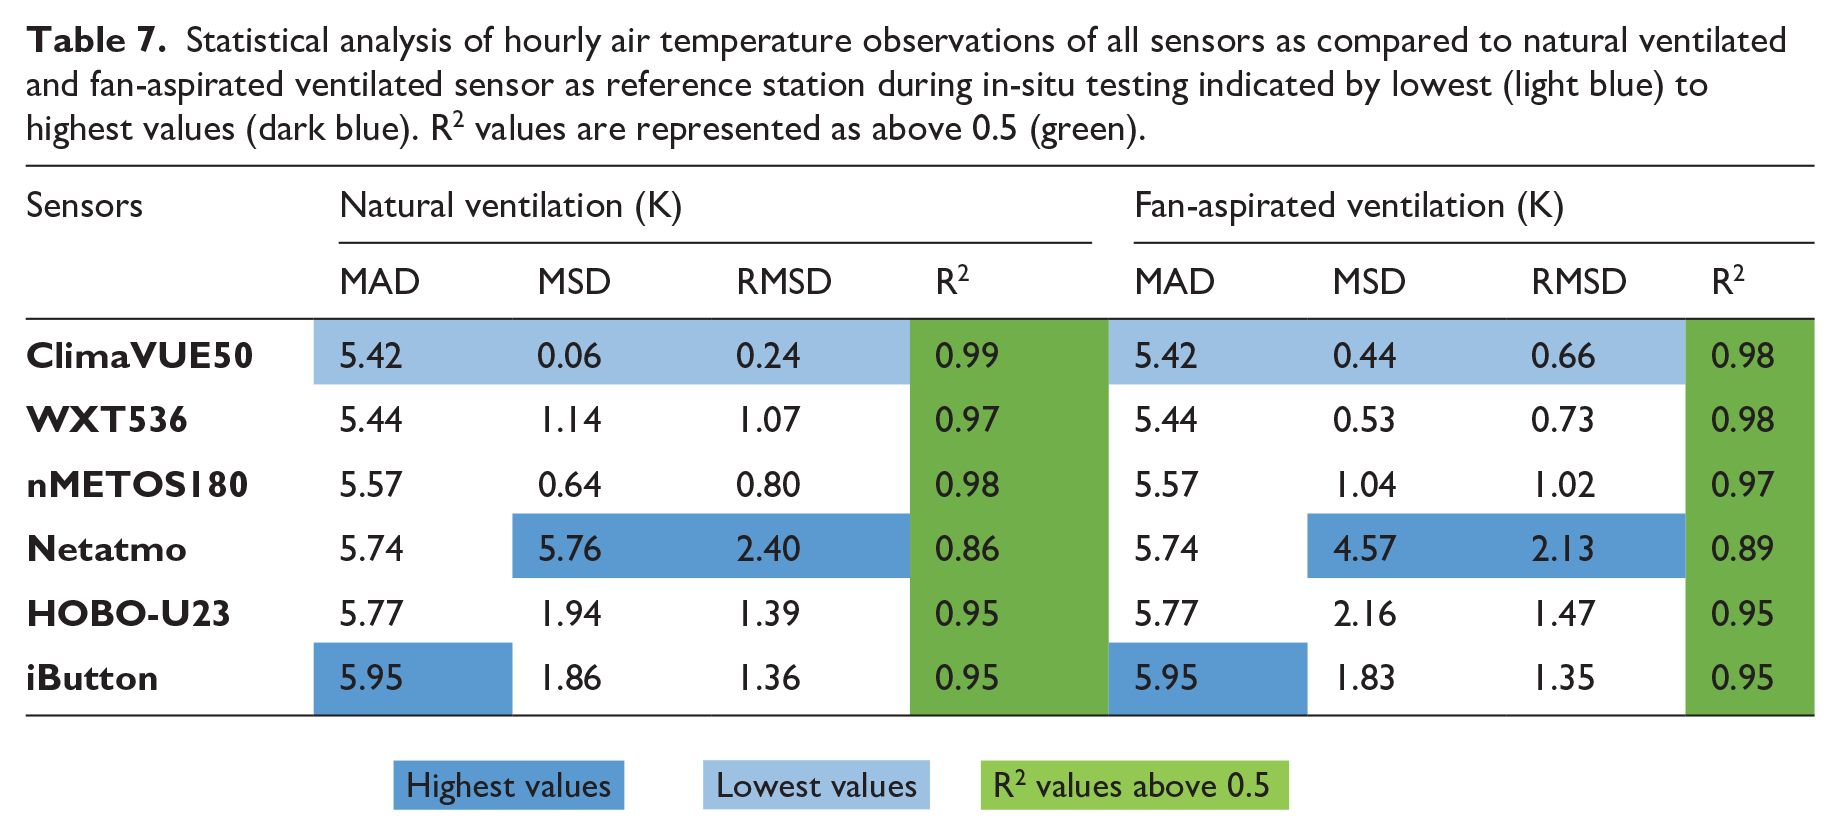
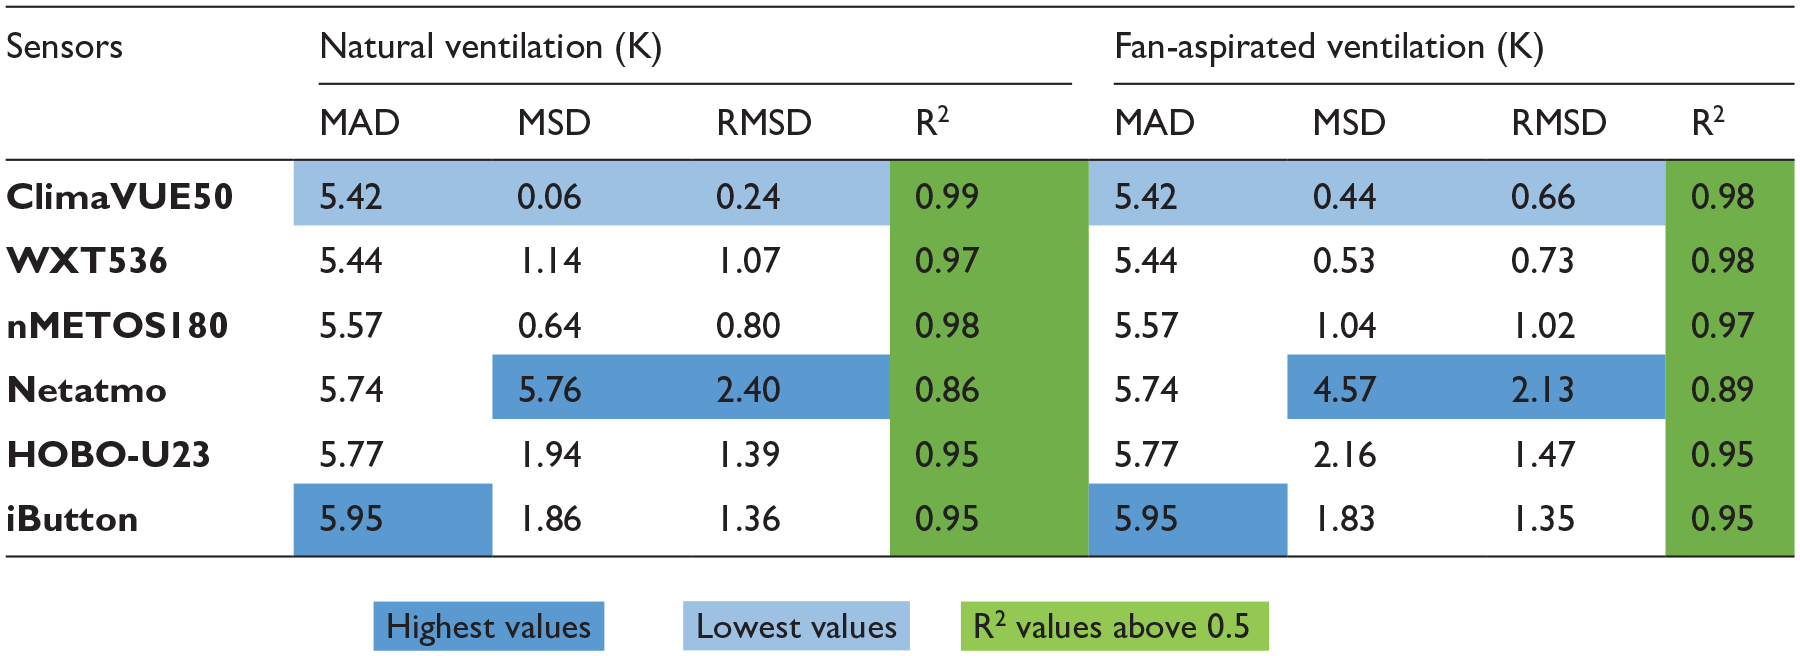
The statistical analysis (Table 7) values showed that AIO and LC sensors have low MAD, MSE, RMSD and high R2, except for Netamo which showed high MAD and R2 during natural and fan-aspirated ventilation observation. Among the AIO sensors, ClimaVUE50 showed the lowest MAD, MSD, RMSD and highest R2 values indicating its high air temperature sensor accuracy (Table 2) performance in both the ventilation environments. That is why, it is applied in projects like TAHMO (Trans-African-Hydro-Meteorological-Observatory) (van de Giesen et al., 2014). Among the LC sensors, nMETOS180 performed with lowest MAD, MSD, RMSD and highest R2 values in both ventilation scenarios. It was observed that during warm days there were high deviations by LC sensors as compared to low temperature days. It showed that AIO sensor tend to deviate less while LC sensors are influnced by the air temperature fluctuations due to their low accuracy.
Statistical analysis of hourly air temperature observations of all sensors as compared to natural ventilated and fan-aspirated ventilated sensor as reference station during in-situ testing indicated by lowest (light blue) to highest values (dark blue). R2 values are represented as above 0.5 (green).
Correlation analysis
We examined the influence of wind speed and humidity on air temperature deviations observations by creating correlations between air temperature deviations, wind speed and humidity variables observed in the 30-day time period data. The correlation coefficient (r) between wind speed and natural ventilated HygroVUE10 sensor air temperature data showed a correlation (r=0.69) and with fan-aspirated ventilated HygroVUE10 air temperature values showed a correlation (r=0.70) value. This strong positive correlation indicated that the increase in wind speed had a similar impact on natural and fan-aspirated ventilation air temperature observations for the observed time period in this study.
The correlation between wind speed and relative humidity during day (r= - 0.01) with significance (p=0.58) and nighttime (r= - 0.02) with significance (p=0.66) respectively indicated their weak correlation relationship. LC sensors’ air temperature deviations have positive correlation values with relative humidity and wind speed during day and night except for Netatmo which shows negative correlation during daytime while AIO sensors have high negative correlations during daytime and low negative correlations during nighttime observations (Figure 9).
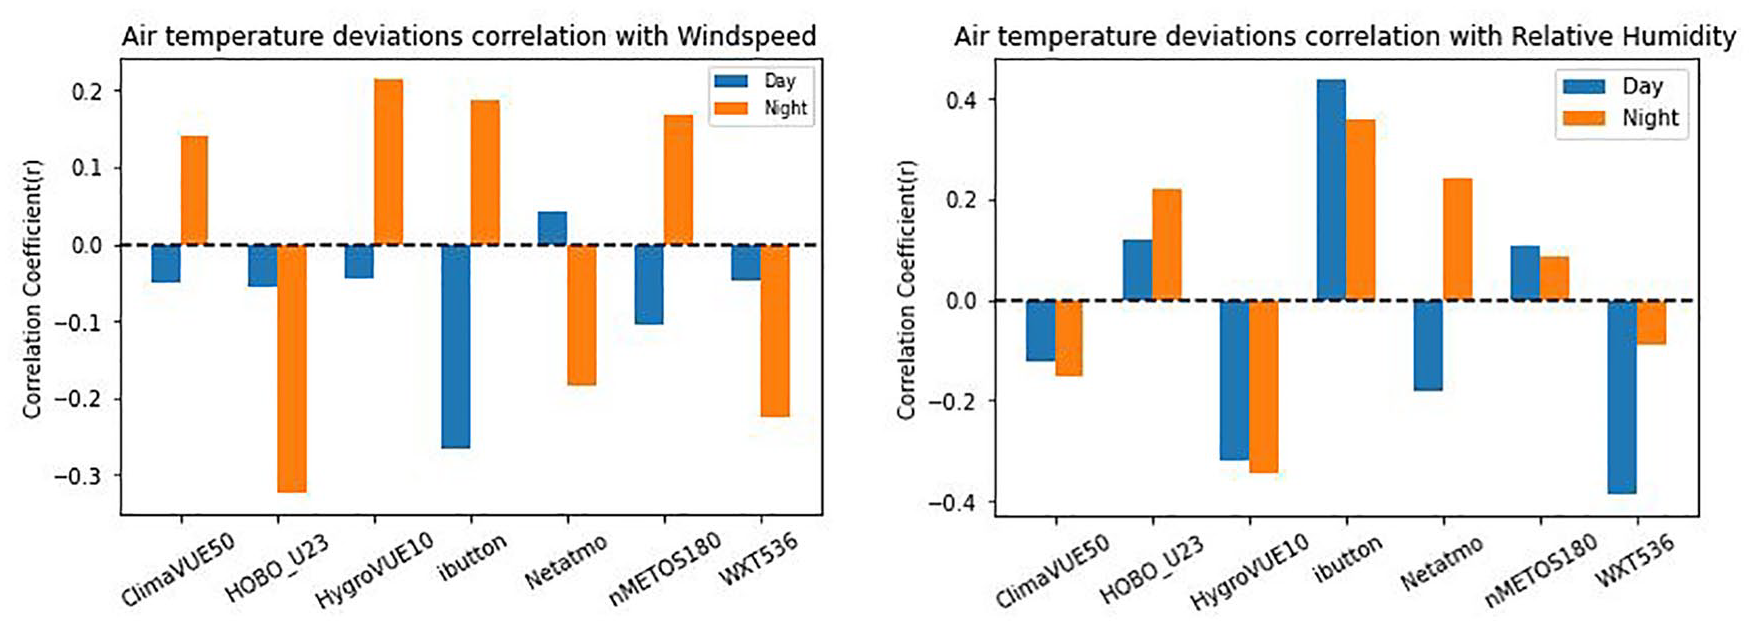
Correlation coefficient (r) values for sensors’ air temperature deviations with relative humidity and wind speed indicated by day (blue) and night (orange).
Summary of in-situ testing
The in-situ testing showed that AIO and LC sensors are influenced by surrounding environment factors such as solar radiation, albedo effect and ventilation in particular. The influence of day and nighttime observation variabilities are related to sensor accuracy and ventilation effect especially for low temperature observation. The time series and statistical results for AIO sensors indicated that during day and nighttime analysis and ventilation testing, ClimaVUE50 had the lowest MAD, MSD, RMSD and highest R2 values. Among the LC sensors, nMETOS180 showed lowest MAD, MSD, RMSD and highest R2 values while Netatmo had the highest MAD, MSD, RMSD and lowest R2 values during natural and fan-aspiration ventilation analysis. The correlation analysis indicated that wind and relative humidity have positive correlation for LC sensors while they have negative correlation for AIO sensors. We observed the impact of direct solar and internal radiation of sensors on the air temperature observations but these were not investigated in this study.
Limitations and way forward
The climate chamber testing observations excluded other environmental factors like humidity, ventilation, winds, shadow effect etc. Urban specific factors like air pollution, building typology, albedo effect from urban surfaces and anthropogenic heat should be investigated in detail for a better comparative analysis. These factors need to be investigated in future studies assessing sensor selection process based on multiple meteorological variables applied in climate chamber testing. Environmental factors affecting thermal analysis needs to be defined during a climate chamber experiments (Dong et al., 2018). The selection based on one variable (e.g. air temperature sensor) results could lead to misinformation of that observation station, especially in AIO compact sensors as suggested by Dombrowski et al. (2021) and van de Giesen et al. (2014). Chodorek et al. (2022) focused on LC sensors equipped with more than one sensor (e.g. humidity, radiation, precipitation, winds speed and directions etc.) to conclude that each sensor parameter must be defined for the project’s goals. The application of ventilation type for radiation shields should be observed with caution and the influence of surrounding environment must be taken into consideration during observation data analysis.
Our study design could be applied in other regions of the world for urban climate studies. The key environmental variables like wind speed, relative humidity and ventilation type correlation analysis indicated that variability in these variables have very low impact on the overall sensor analysis results. Other factors like solar radiation, type of radiation shields and its materials need to be considered while applying the sensor selection process. Urban factors should be investigated based on the scope and scale of the urban climate observation design.
Conclusion
Air temperature sensor selection was processed through two stages: firstly, criteria based selection from existing literature and commercial availability and secondly, through testing methods including climate chamber and in-situ testing. From the first selection method, we identified 11 AIO sensors based on the criteria for assessing if sensors are suitable for urban observation networks at city lights and other available installation mediums independent of external power supply. The key defined criteria were: high accuracy of air temperature sensor (±1°C), compactness in design, low weight, lower energy consumption, reliable solar panels for power independence and remote data accessibility (via cellular and cloud data). For the LC sensors, we considered five sensors that meet the defined criteria of sensor accuracy, power independence, commercial availability, and easy installation. In the second stage, all the sensors were tested in climate chamber with defined methods for daily cycle, extreme range and stable temperature testing. During in-situ testing, all sensors were tested in an open environment analyzing the performances by classifying them in day and nighttime observations and with the application of natural and fan-aspirated ventilation for radiation shields. The air temperature observations were analyzed through statistical methods like statistical analysis using mean absolute deviation (MAD), root mean square deviation (RMSD) and coefficient of determination (R2) performed on the observations. The overall analysis of AIO compact sensors (ClimaVUE50 and WXT536) highlighted their consistent performance with air temperature sensor high accuracy during long period of air temperature observations but also showed their lack of quick response to sudden change in temperature fluctuations. AIO sensors have the drawback of compactness in their design with less ventilation and they adapt slowly to the temperature changes due to thermal inertia. LC sensor (nMETOS180, iButton, Netatmo and HOBO-U23) testing performances showed variability in their results in this study. Netatmo had the highest deviations during CC testing and performed with highest MAD, MSD, RMSD and lowest R2 values during natural and fan-aspiration ventilation analysis during in-situ testing. All sensors showed high deviations during daytime and lower during nighttime due to radiation errors with various types of radiation shields. LC sensors have in general higher deviations than AIO sensors but some LC sensors in this study showed promising results. For example, HOBO-U23 and nMETOS180 performance during CC testing (daily cycle test, extreme range test and stable temperature test) and in-situ testing (day and night analysis, ventilation and correlation analysis) showed their good performances and they could be reliable LC sensors for urban air temperature observations but they have their limitations as well. Our study analysis showed that LC sensor HOBO-U23 performed well but, due to its short memory feature, it would only be suitable for short-term observation campaigns but not for long term data collection. We have suggested nMETOS180 based on its features like cloud-based data management system, low weight, easy installation process, continuous solar based power supply and additional meteorological variables (relative humidity and precipitation) as compared to HOBO-U23 sensor. Based on these grounds, we suggested nMETOS180 to be a potential sensor for urban climate observation network.
With the advancements and innovations in technology, more and more cities will be installing such sensors, and more non-professionals will be interacting with such projects. New and advanced sensor types, data loggers and data management systems will be developing with time and could be applicable for more sophisticated urban climate observation data collection and analysis. It is important to focus on the development of more comparative studies for low-cost meteorological weather stations so that reliable conclusions are drawn for sensor selection and applications. Overall, our study provides an approach for air temperature sensor selection method using controlled and open environment testing methods that could be applied in other regions of the world. The testing parameters and variables could be changed according to the geographical region, meteorological conditions and project objectives.
Supplemental Material
sj-docx-1-tee-10.1177_2754124X251363130 – Supplemental material for Comparison and assessment of air temperature observations using All-In-One and Low-Cost sensors in an urban environment
Supplemental material, sj-docx-1-tee-10.1177_2754124X251363130 for Comparison and assessment of air temperature observations using All-In-One and Low-Cost sensors in an urban environment by Shakir Ahmed and Britta Jänicke in Transactions in Earth, Environment, and Sustainability
Footnotes
Acknowledgements
We acknowledge the contribution of student assistants Till Wiesehoff, Cornelius Hottenrott and Annika Schönewald for their support in field and installation during the testing stages. We thank Rolf Gross and our colleagues from the Chair of Building Physics, University of Kassel for providing the climate chamber and helping during its testing process. Moreover, we thank Nisha Patel and Dr. Stenka Vulova for proofreading and providing valuable suggestions throughout the research work.
Declaration of conflicting interests
The author(s) declared no potential conflicts of interest with respect to the research, authorship, and/or publication of this article.
Funding
The author(s) received no financial support for the research, authorship, and/or publication of this article.
Data availability
The meteorological data used in this study containing sensor observations will be available upon request from the corresponding author.
Supplemental material
Supplemental material for this article is available online.
Author biography
References
Supplementary Material
Please find the following supplemental material available below.
For Open Access articles published under a Creative Commons License, all supplemental material carries the same license as the article it is associated with.
For non-Open Access articles published, all supplemental material carries a non-exclusive license, and permission requests for re-use of supplemental material or any part of supplemental material shall be sent directly to the copyright owner as specified in the copyright notice associated with the article.