
Abstract
With the scientific introduction of the concepts of adaptation, vulnerability and resilience, studying the parallel concepts of risk assessment and resilience monitoring is of great relevance to policy making. The key to ensuring the success of resilience building lies in accurately grasping the spatial temporal pattern and evolution of resilience, deeply understanding the social-ecological factors that promote resilience, and acutely analyzing the linkage mechanisms and feedback processes within the social-ecological system (SES). However, little is known about the progress and differences in resilience building in karst regions, and important questions regarding the relationship and interaction between Social resilience (SR) and Ecological resilience (ER) remain unexplored. To bridge this critical gap, this study evaluated ER from the perspective of ecosystem services and ecological threshold balance, evaluated SR based on the resilience criteria developed by Food and Agriculture Organization (FAO), and constructed a social-ecological resilience coupling framework. Taking typical karst mountainous areas as research cases, 88 counties in Guizhou Province were selected for resilience assessment and coupling analysis through coupling coordination models, geographic detectors, and geographic weighted regression models. This provides insights into the nonlinear relationship between SR and ER and the dynamic evolution and influencing mechanisms of coupling coordination degree of social resilience and ecological resilience (CCD SER ). There were significant differences in the relationship between SR and ER, showing nonlinear characteristics of change. The key driving factors and spatial driving effects affecting CCD SER were identified, and resilience strategies suitable for a win-win situation between karst ecological restoration and economic development were proposed, which will help SES develop in a more sustainable direction.
Introduction
Global and regional shifts in ecological patterns and functions in the context of global change make it challenging for human settlements to cope with the dual impacts of external pressures and internal social demands (United Nations General Assembly, 2015; Wang et al., 2023). It needs to be emphasized that economic development and environmental protection are equally important and both are key to ensuring sustainable development (Guerry et al., 2015). However, economic growth is often accompanied by environmental degradation, while protecting the environment comes with economic costs (Gonzalez-Garcia et al., 2020). How to coordinate the development trade-offs between the two in order to promote the realization of sustainable goals could be called the core challenge facing mankind in the 21st century (Chaigneau et al., 2022). As a complex system, the social-ecological system (SES) consists of human systems and natural systems, connecting social and ecological subsystems through coupling interactions, including interactions between subsystem factors (Liu et al., 2007). The SES theory believes that the interaction between social systems and the earth's environmental system is bidirectional and they jointly determine the dynamic changes of the entire system (Wellmann et al., 2023). This theory regards the dynamic process of human utilization of specific natural resources as an integrated system. It has important theoretical applications and development potential and deepens the academic community's understanding of SES theory (Ostrom, 2009). In view of this, innovative coupling of social system and ecological system theories to resolve the complexity and changes of SES has become a focus and frontier that has attracted widespread attention from the government and academia.
Resilience is the capability to recover and adapt faster after adversity, stress or trauma. In recent years, it has become a research hot spot in many disciplines such as psychology, sociology, biology, and geography (Hosseini et al., 2016). IPCC (2021) defined resilience in the Sixth Assessment Report as “the ability to maintain basic functions, oneself and structures, and to support transformation” (IPCC, 2021, p. 478). The concept of resilience has evolved significantly since it was first proposed. Initially, Holling applied resilience to ecosystem research and defined it as the ability of the system to maintain its original function despite being disturbed by itself or the outside world (Holling, 1973). This definition underpins the concept of ecological equilibrium, the principle that ecosystem dynamics are governed by forces driving toward a stable equilibrium. In the context where this school of thought dominates, ecosystems are thought to respond to disturbances primarily through negative feedback systems, whereby if a change occurs, the ecosystem will take action to mitigate the change as much as possible and attempt to return to its original state (Carpenter et al., 2001; Walker et al., 2004). This understanding of resilience is newly informed in environmental and social-economic systems. Some research considers resilience an important dimension for development in an uncertain environment full of turbulence and shocks, and it has gained prominence in development policy and practical applications (Chaigneau et al., 2022). Subsequently, the Resilience Alliance innovative proposed that resilience is the ability of a system to recover from threshold states (Resilience Alliance, 2010). As the concept of human well-being becomes more popular, resilience has become associated with well-being. Oxfam defines resilience as the ability of people to realize their rights and well-being in the face of environmental and social shocks, stresses and uncertainty (Jeans et al., 2016).
As research deepens, academia has gradually come to realize that ecological environment and social factors are the basis of long-term sustainability, and sound governance practices are the key guarantee for achieving sustainable development (Sharifi, 2023). Maes et al. (2024) proposed that concepts from complex systems science, particularly those involving non-linearity—such as policy impacts, Ecological resilience (ER), and ecological feedback mechanisms—should be integrated to better understand shifts in restoration outcomes from a SES perspective. For example, the population growth drives urban expansion and the encroachment of construction land on ecological land, resulting in more investment in environmental governance, thereby reducing investment in social development (Lafortezza and Sanesi, 2019). In contrast, taking into account adverse environmental impacts and the adaptive ability of households to address shocks helps to improve human well-being (Benessaiah and Chan, 2023). However, although the SES concept has shown positive impacts in solving complex social and environmental problems, many previous studies have mostly focused on single-dimensional resilience assessment (Zhang et al., 2025), especially lacking systematic consideration of the interrelationships and coupled interactions between Social resilience (SR) and ER in karst areas.
Furthermore, although the United Nations Sustainable Development Goals (SDGs) are global, the resilience building and resilience research towards their goal (making human settlements that are inclusive, safe, resilient, and sustainable) are not regionally equitable (United Nations General Assembly, 2015). This is because most of the current research on the concept of SES is mainly used at the urban and community scales, and resilience building in developing countries is still at a relatively early stage (Wubneh, 2021). For example, Calliari et al. (2022) investigated how nature-based solutions and ecosystem-based adaptation strategies can boost resilience by integrating natural elements into urban planning and design. Sharifi (2023) revealed the evolutionary characteristics of urban SES, emphasizing the interaction between human activity and environment in the natural environment. Heinzlef et al. (2020) conducted a holistic analysis of urban systems and implemented urban resilience strategies to mitigate the impacts of climate change. However, few of these studies address social-ecological resilience (SER) in county areas, where human society interacts particularly strongly with ecosystems. Therefore, there is still a research gap in how to give full play to the connecting role of resilience in the county SES framework and build a comprehensive resilience indicator system that includes Ecosystem Services (ESs) and social economy. In addition, the relationship between SR and ER may show a nonlinear relationship. However, none of the current studies have addressed this issue.
Overall, to bridge these gaps. This study focused on 88 counties in Guizhou Province, located in the karst region of southwest China, as a case study. It constructed a SES coupling framework, using resilience as the central connecting point, to analyze the nonlinear relationship, dynamic characteristics, coupling interactions, and their influencing factors at the county scale. This paper aims to establish a more comprehensive and general solution framework for the issues involved and attempts to address the following questions: (1) What kind of nonlinear relationship does SR and ER exhibit? (2) How does this nonlinear coupling relationship change? (3) What potential factors affect this nonlinear coupling relationship? We focus on three core research questions that aim to provide important theoretical perspectives for the innovative integration of SES, and to propose practical strategies suitable for the sustainable development of ecological protection and economic construction in karst mountain counties. Our research framework can be widely applied to county resilience assessment and analysis in other developing countries.
Materials and methods
Study area
The karst area in southwestern China is the largest area in the world with concentrated and continuous exposed karst carbonate rock (Ford and Williams, 2013) (Figure 1). For a long time, due to the combined effects of fragile ecological environment and unreasonable human activities, its ecological restoration and economic development have faced major challenges. Although with the implementation of the “Western Development Strategy” and “Rocky Desertification Control” measures, the region’s social and economic benefits have been significantly improved, and the overall trend of ecological restoration is positive. However, due to the strong constraints of geological conditions and water and soil resources, its ecologically fragile nature remains difficult to change (Yan et al., 2014). In addition, internal and external impacts from unreasonable human activities such as urbanization and industrialization have seriously affected the various functions of natural ecosystem, posing severe challenges to the sustainable of the region's SES.
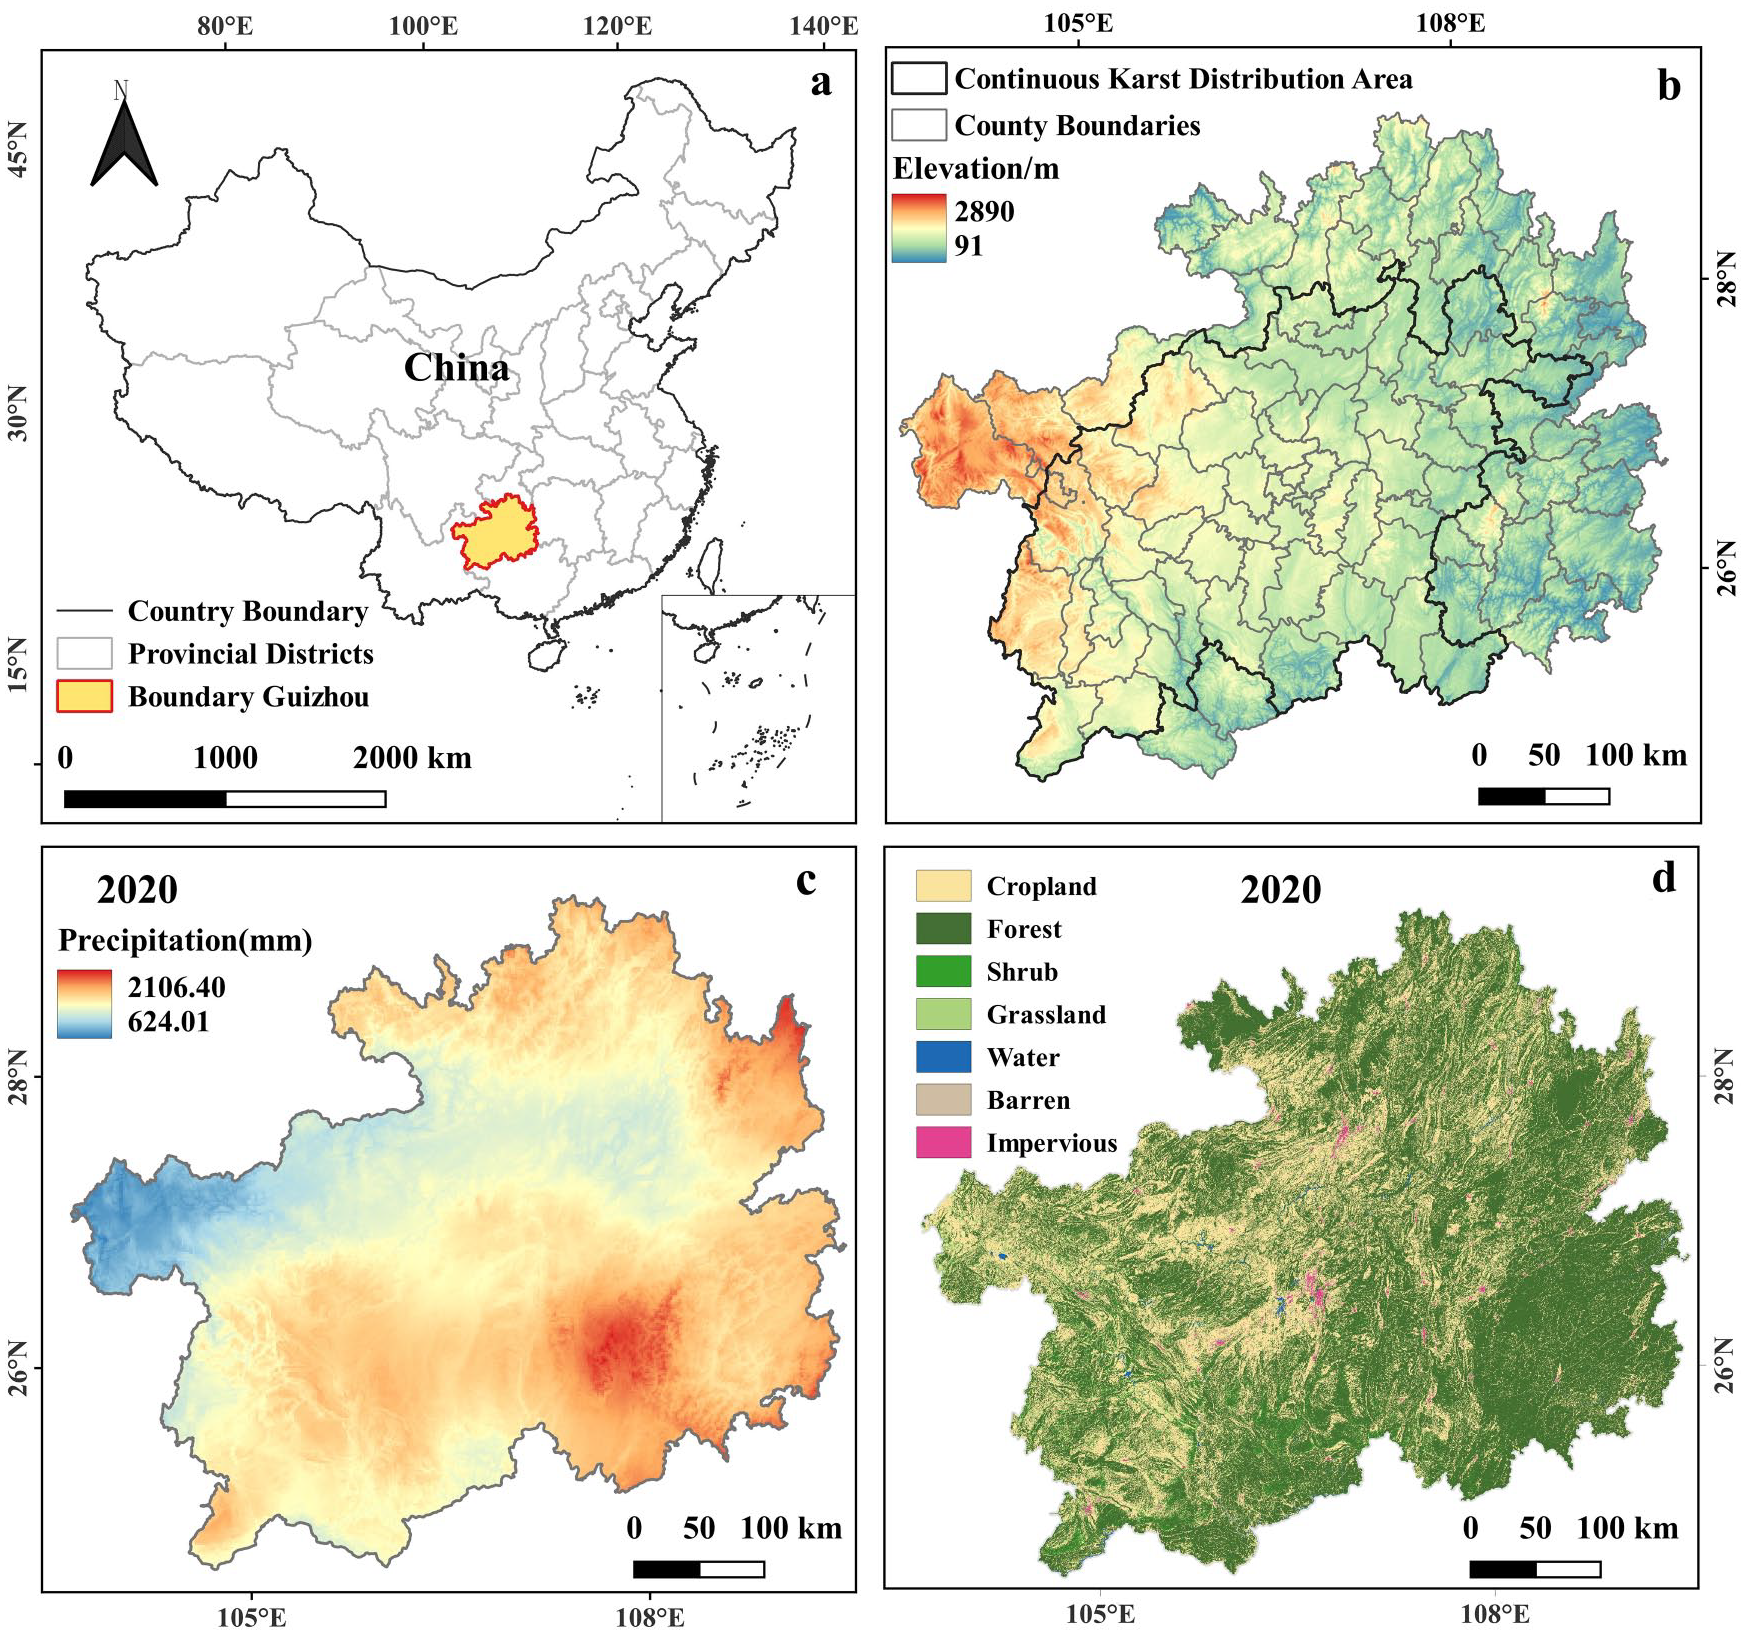
The location and natural characteristics of the study area. (a) Location of Guizhou Province. (b) Altitude distribution. (c) Annual rainfall. (d) Land use type.
Research framework
There are dynamic and complex coupling interactions between social system and the ecosystem (Binder et al., 2013). On the one hand, a healthy ecosystem is the basis for human survival and the guarantee of SDGs. On the other hand, the positive measures taken by human activities provide guarantees for the protection of the ESs (Reyers et al., 2018). However, the fierce conflict between human preferences and the ecological environment, the increasingly serious land degradation and environmental pollution have had a negative impact on the ESs (Tsahor et al., 2023).
In this case, this study used the coupling coordination degree model to integrate SES, explicitly considering the interaction and feedback process between SR and ER within this framework (Figure 2a). For ER, the yellow area represents human living space (safe); the green area represents ecological safety space (increased risk); and the red area represents unknown areas beyond the safety zone (high risk) (Figure 2b). The intersection of yellow and green reflects the interaction of SES (Qu et al., 2025). The SR is measured by four pillars of resilience consisting of multiple indicators. The four pillars of resilience were defined by the Food and Agriculture Organization (FAO) of the UN (FAO, 2016). Derived from the FAO definition of social resilience, its four resilience subsystems can be explained as follows: Access to basic services (ABS) refers to the positive impact of access to quality services such as adequate health care, housing and sanitation on county resilience. Assets (AST) represents stable income and savings to recover quickly from shocks. Adaptive capacity (AC) plays a key role in addressing various factors at different levels to improve one’s own environmental conditions in the special economic context. Social security system net (SSN) means that the government responds to the current adverse situation by providing resources to vulnerable groups (Figure 2c).
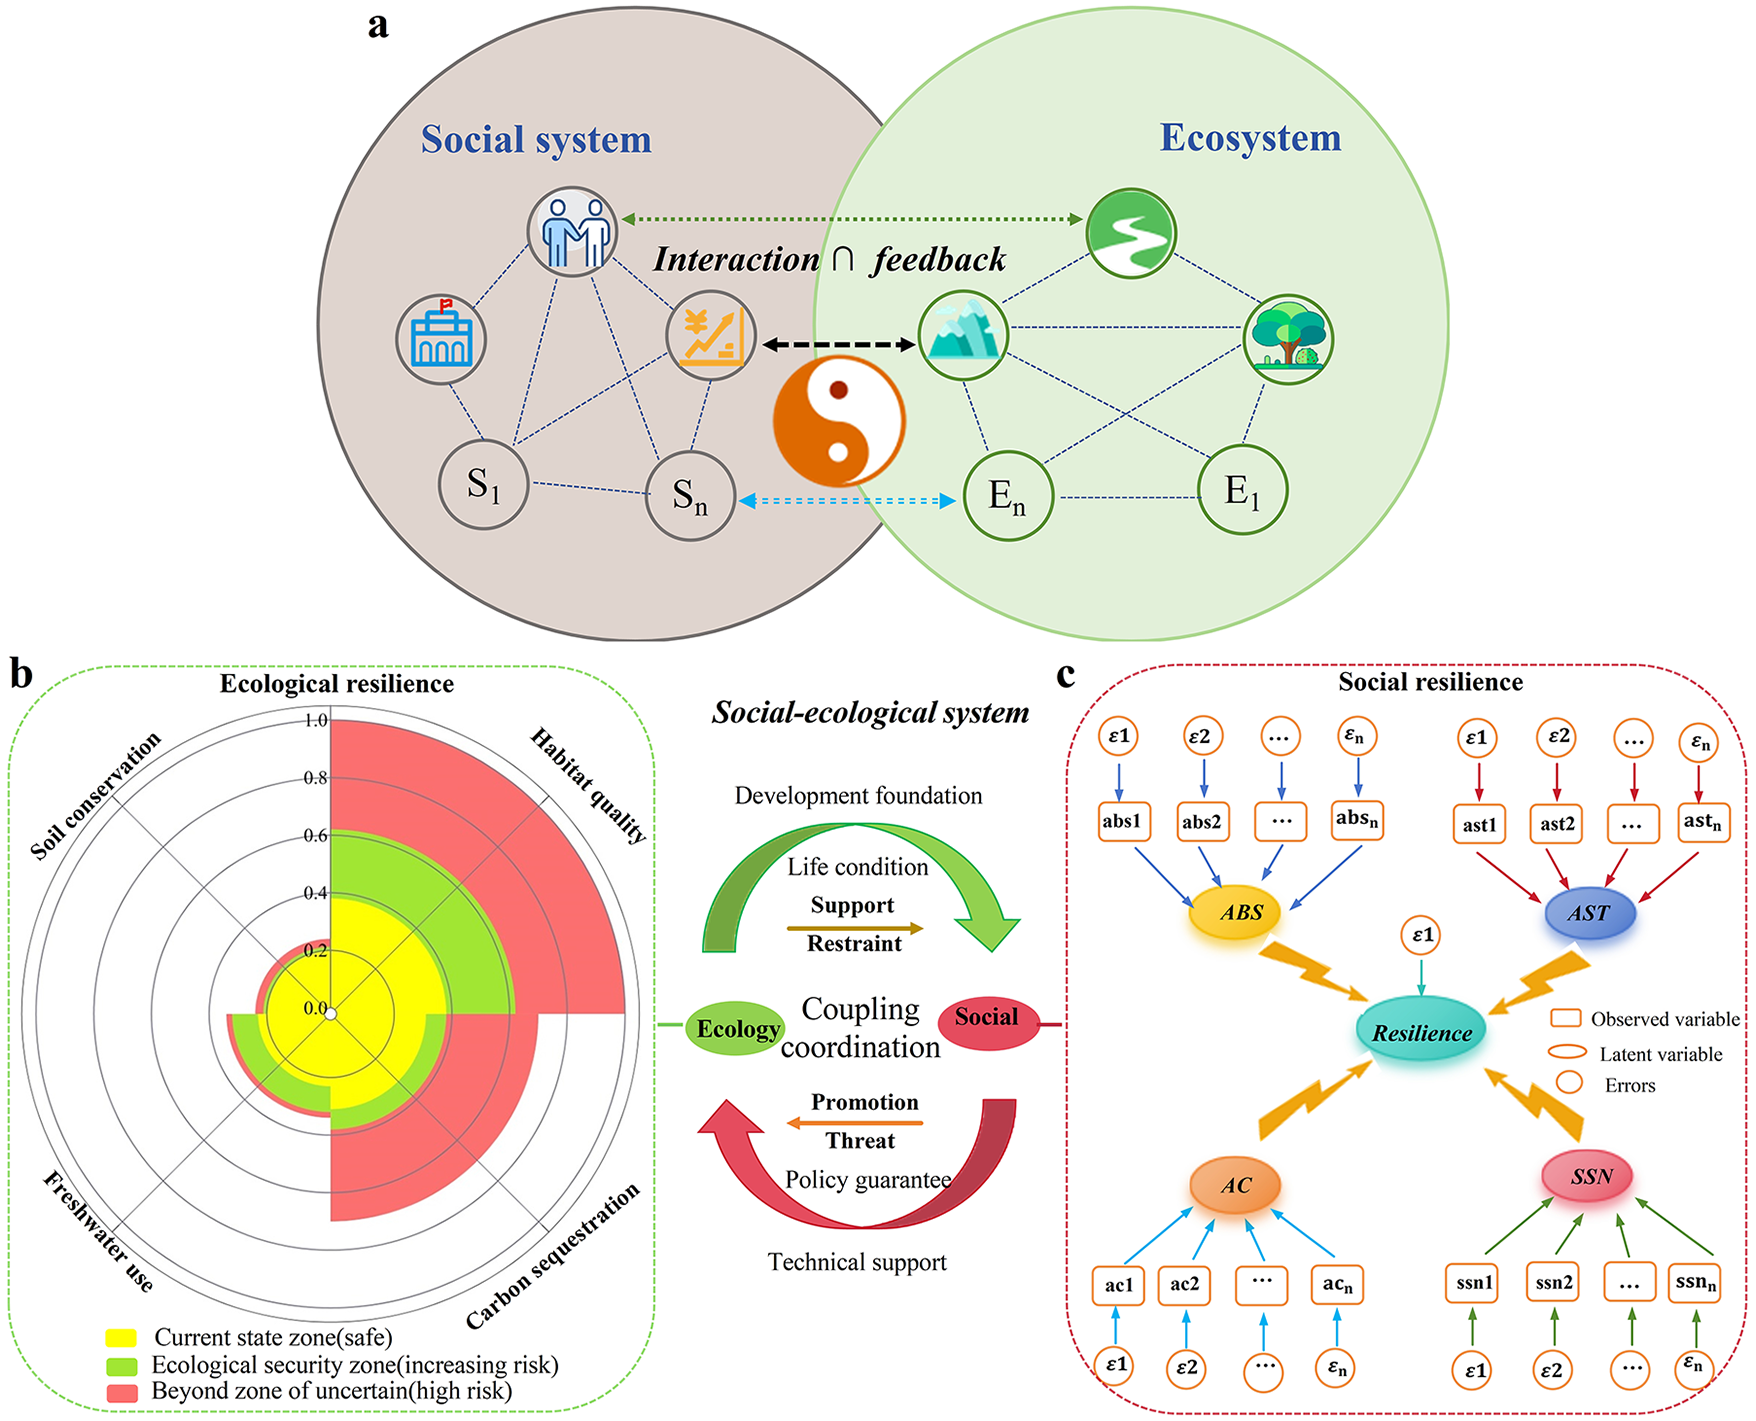
The social-ecological systems and resilience assessment framework. (a) The concept of coupling interaction between social and ecological systems. (b) Ecological resilience assessment framework. (c) Social resilience assessment framework.
Data source and introduction
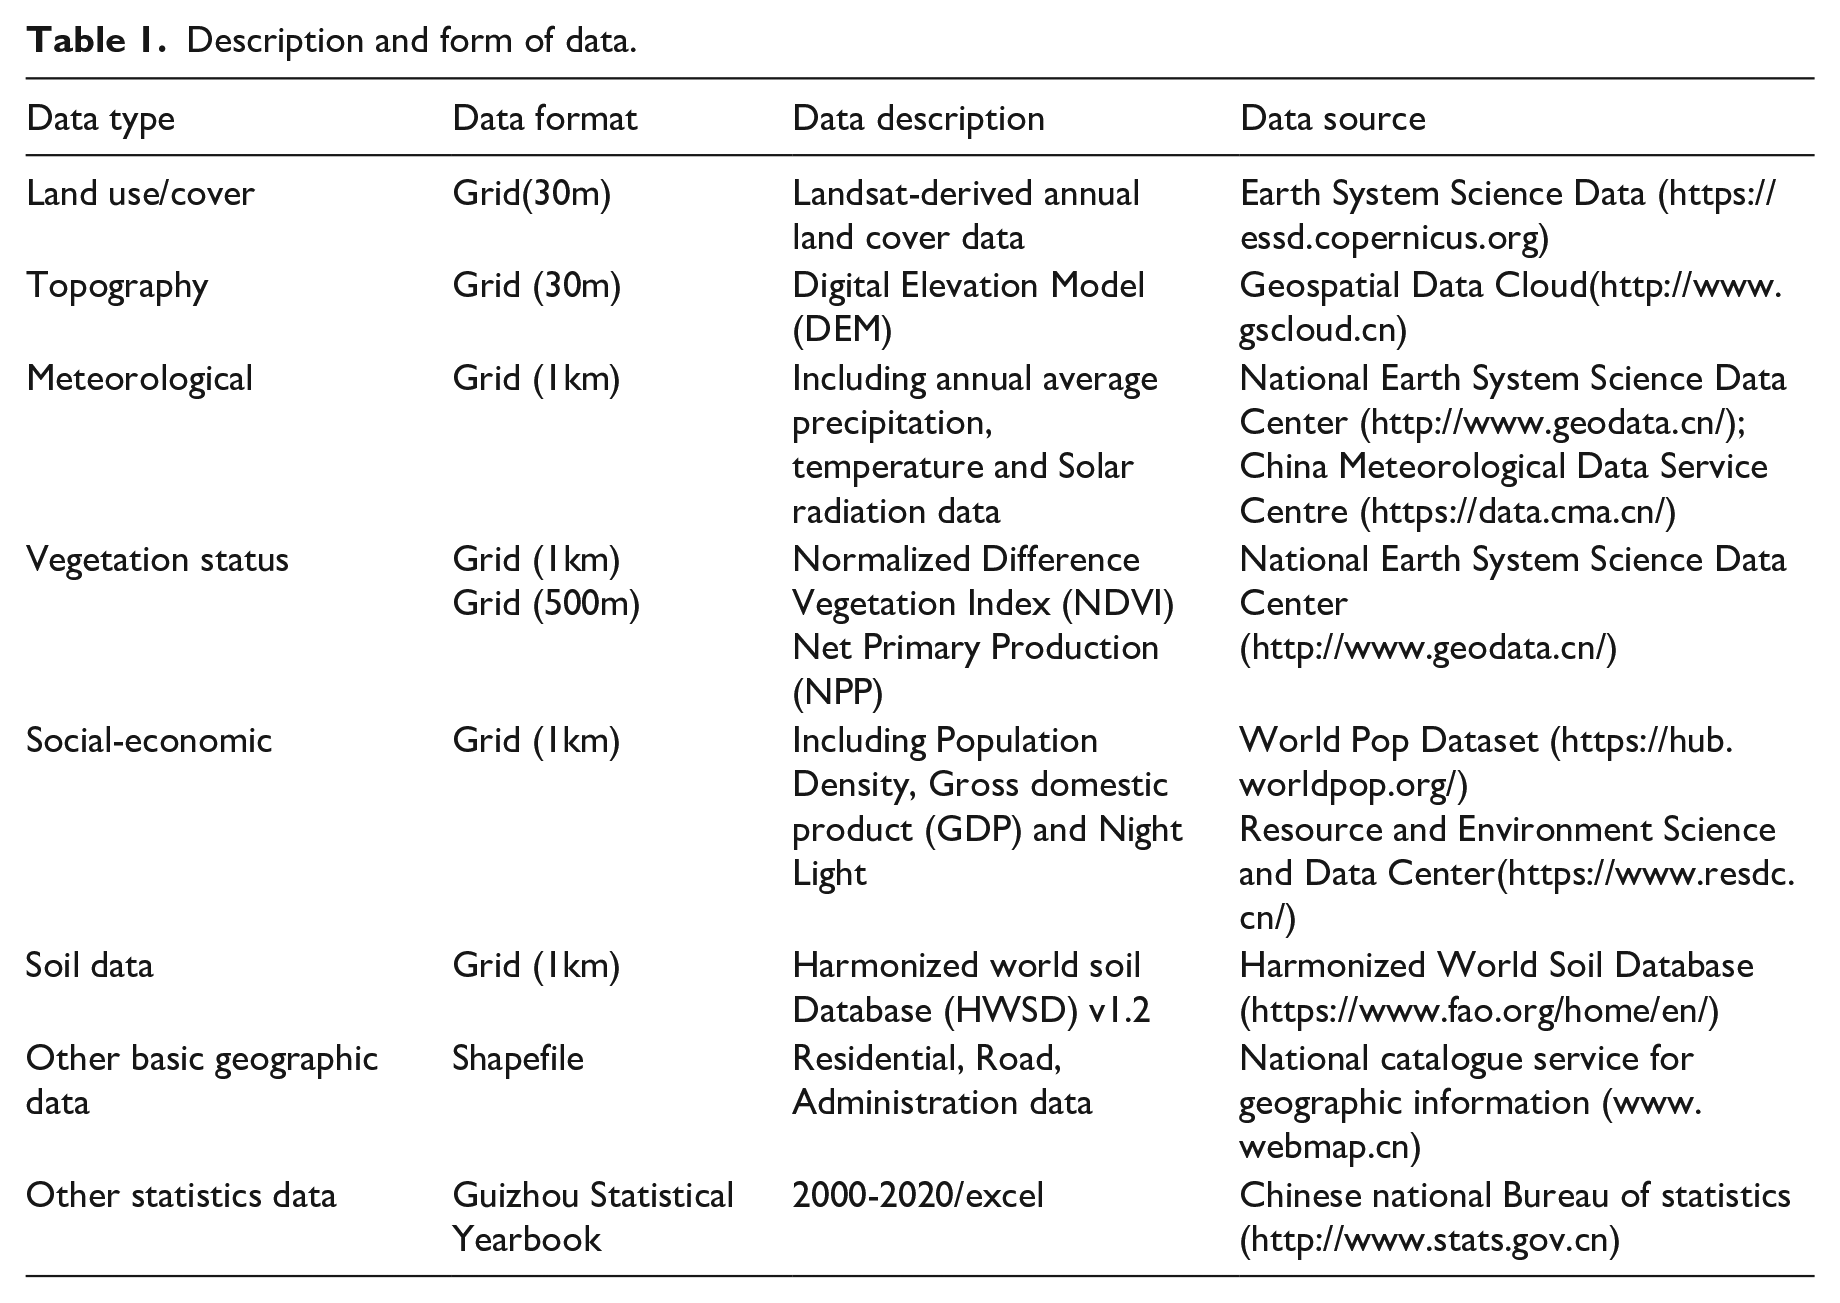
This article uses various types of annual data from 2000 to 2020 in Guizhou Province, including land use/cover, climate, geography, vegetation, soil, etc. (Table 1). We used R language and ArcGIS10.6 to process the data by annual data synthesis, mask extraction, pixel statistics, etc. Employing the nearest neighbor method, the raster data were resampled at a 1 km resolution. This method is mainly used for discrete data and does not change the pixel value.
Description and form of data.
Research methods
The connotation and calculation of ER
The ESs reflect nature's capacity to supply (Costanza et al., 1997). Thresholds are inherent to the social-ecology system and are typically determined by various key elements located at a safe distance from the planetary boundary (Rockstroem et al., 2023). Moreover, the resilience of ecosystems might and has been compromised (Reyers et al., 2018). Given the passive effects of these changes on SES and human well-being, exploring ER governance and adaptive management research can no longer be ignored. In this study, we attempt to characterize the stability of ecosystem functioning through the interplay of ESs and ecological thresholds (Moore and Schindler, 2022). In other words, when this state is at, or converging towards, equilibrium, it indicates that the system is more resilient and stable than when it is out of equilibrium, and we describe this pattern in terms of resilience. The definitions and assessment methods of ecosystem services and ecological thresholds in this paper are shown in the Online Supplementary Information.
Specifically, we used the ratio of ESs to ecological thresholds to quantify ER to better promote and maintain ecosystem stability and sustainability. Among them, four categories of typical ESs in karst, habitat quality, water yield, soil conservation and carbon sequestration services, were considered in this paper (Chen et al., 2024). The ER is measured as follows:
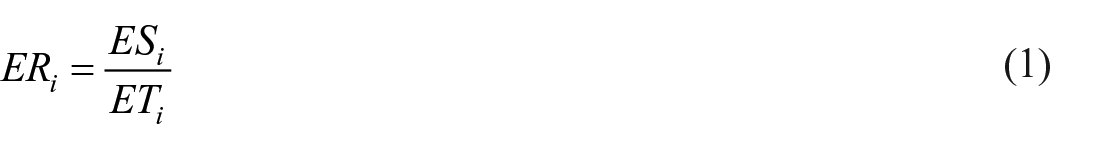

where
Measure of SR based on the entropy weight TOPSIS model
Establishing an indicator system is the process of concretizing theory and an important way to provide support for regional spatial planning and management. Based on the definition of SR by the FAO of the UN (FAO, 2016) and existing references and data availability, this paper selected 16 indicators to represent the four pillars of county SR: access to basic services (ABS), assets (AST), adaptive capacity (AC) and social security system net (SSN). The indicators of county resilience in Guizhou Province are shown in Table 2.
The meaning and weight of county SR indicators.
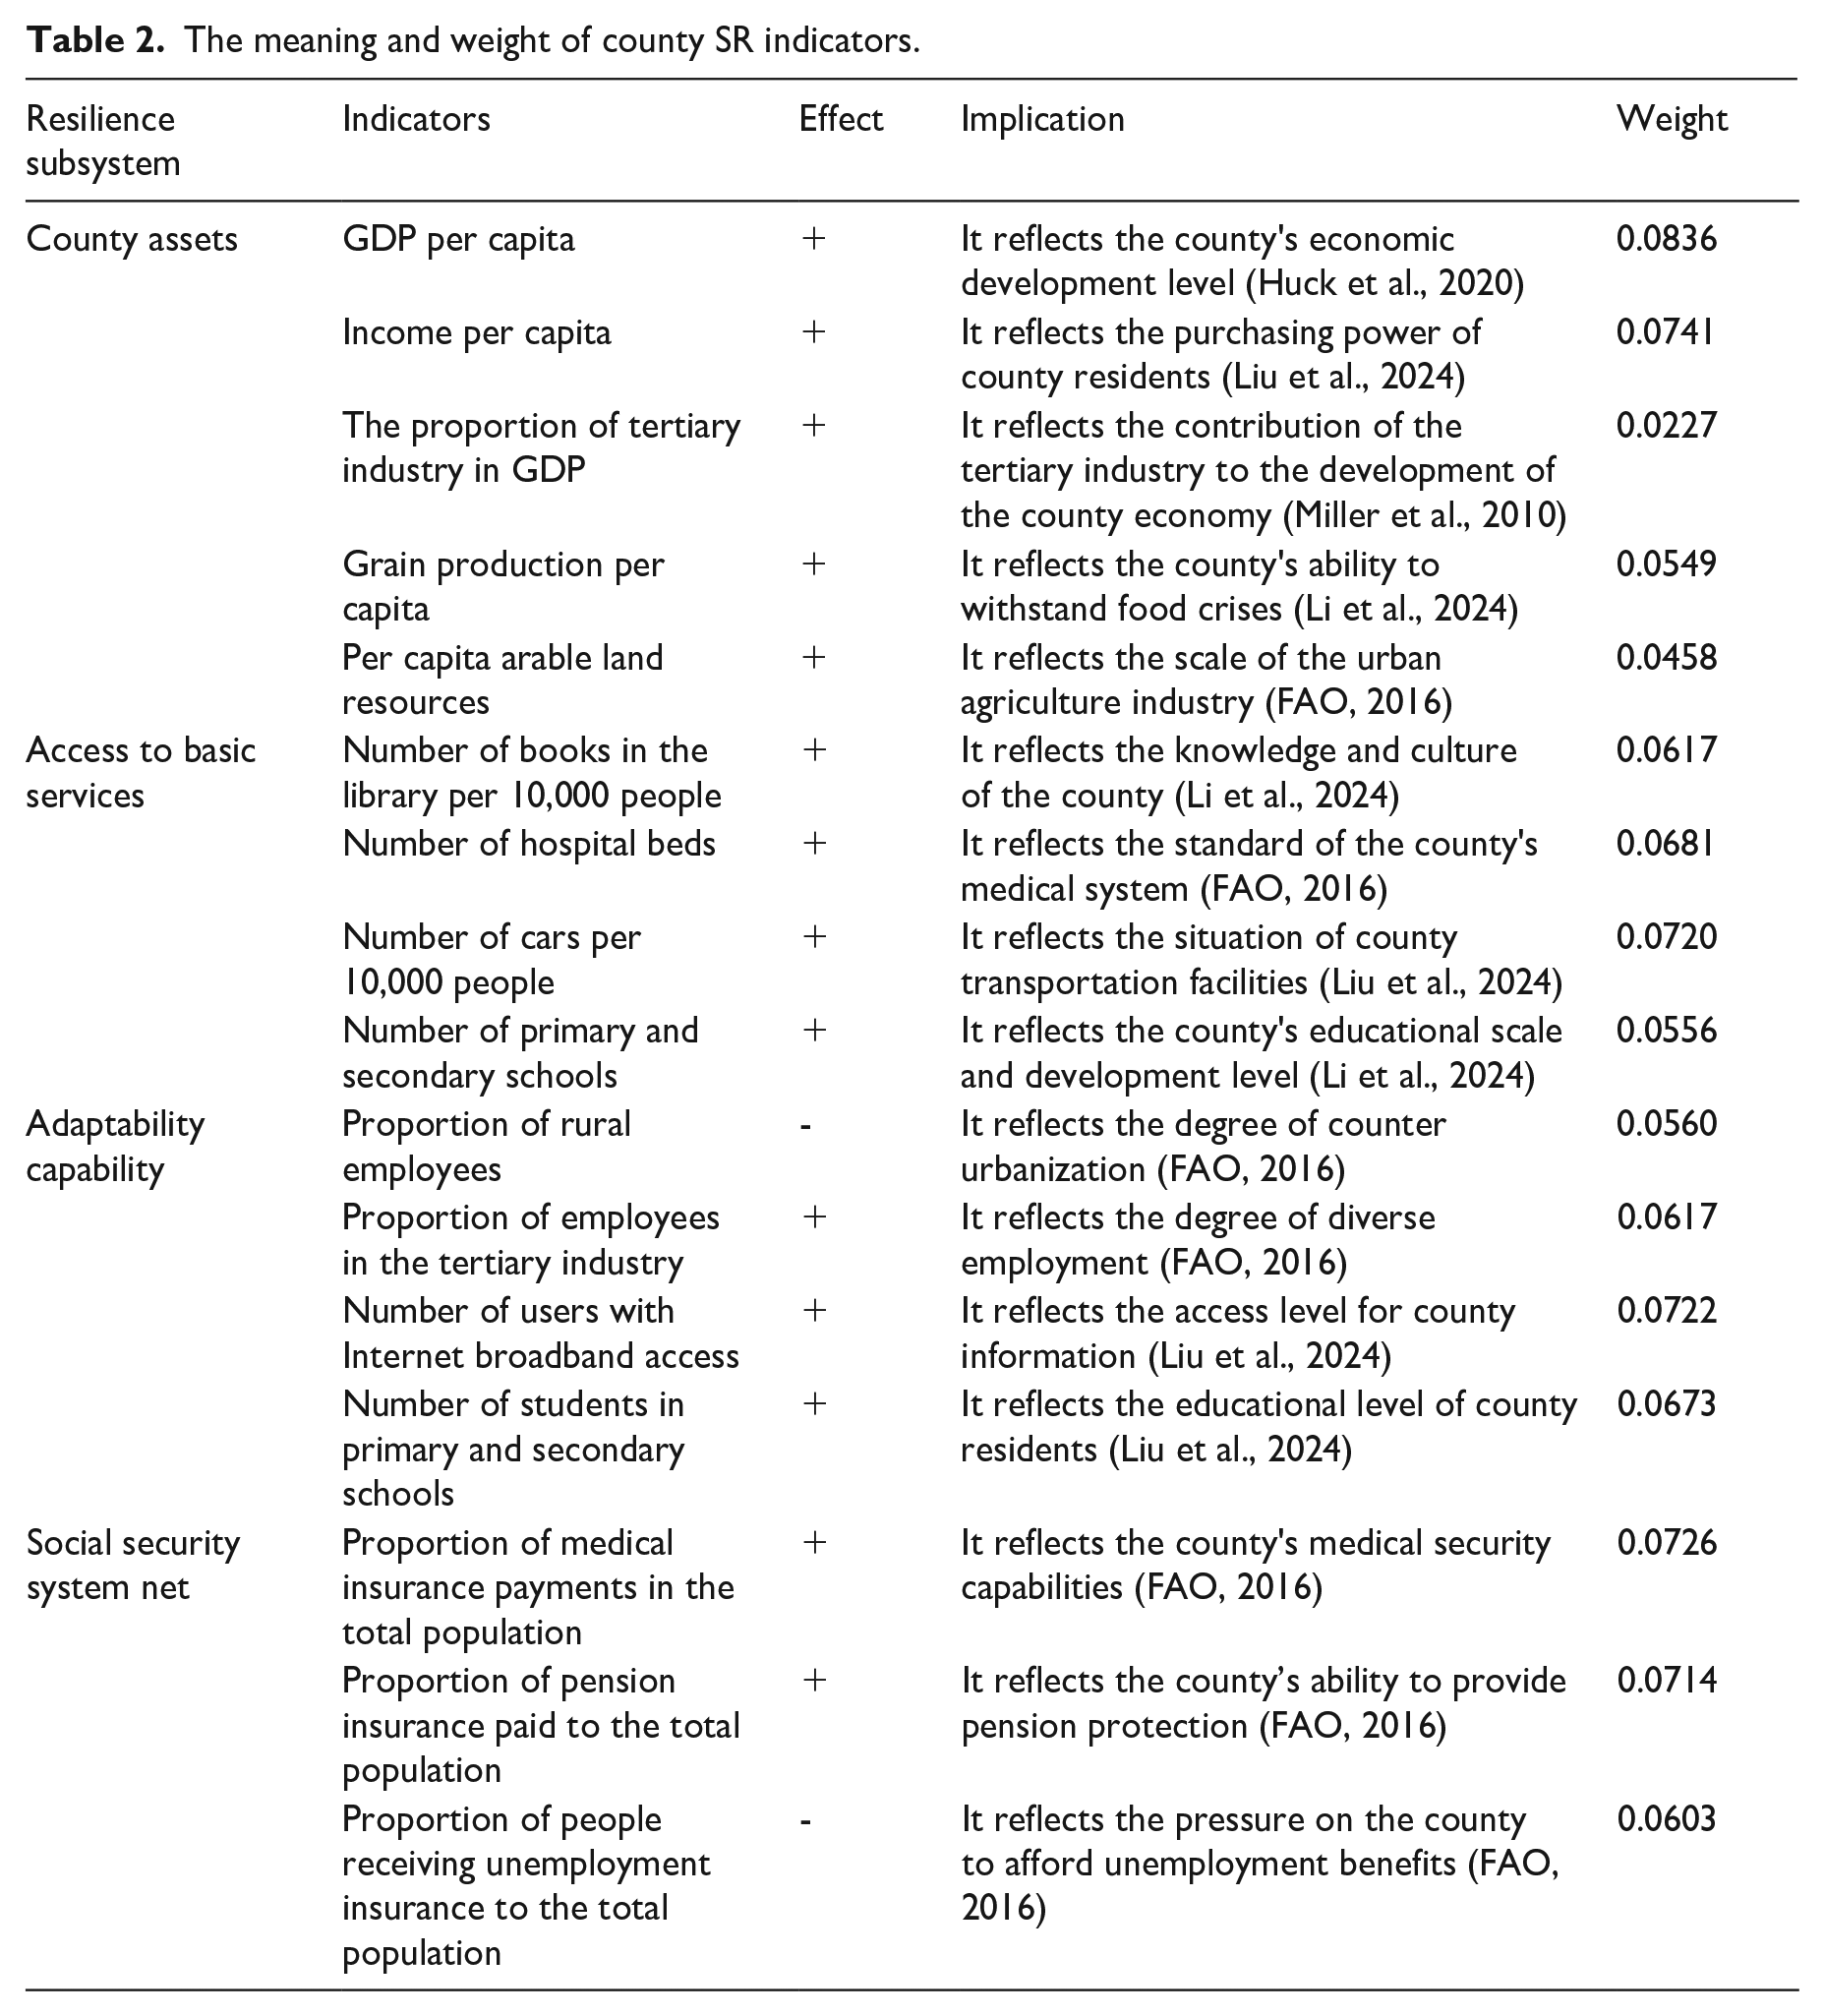
When calculating the relative weighting of different indicators, this research employed the entropy-weighted TOPSIS method to assess the objective weights of the indicators, which ensures the objectivity and scientific validity of the evaluation results (Xia and Zhai, 2022). By calculating the proportion of indicator values in each year to the sum of 88 counties through the entropy weighting method, the information entropy and redundancy of the indicators are obtained, and calculate the weight each indicator. Further, the indicator weight matrix and Euclidean distance analysis were constructed by the TOPSIS method to finally calculate the SR score. The detailed calculation process is provided in the Online Supplementary Material. To eliminate the magnitude of different indicators that constitute SR, this study further normalized the data using a max-min normalized model. These can be expressed using the formulas:


In the formula,
Identifying the nonlinear relationship between SR and ER
In order to more effectively reveal the impact of human activities on ecosystems, based on existing research, this article hypothesizes that there is a nonlinear correlation between SR and ER (Mdingi and Ho, 2021). We try to use simple linear analysis methods and binomial nonlinear fitting to compare and deeply explore the rules hidden behind the data.
Defining the degree of SER coupling
Ecosystems and societies are complex and dynamic systems whose interrelated processes interact at different scales (Moore and Schindler, 2022). In order to ensure that SES support the coordinated enhancement of human well-being, this article adopts the coupled coordination degree method to calculate the interactions between SER. The following are the calculating formulas (Yang et al., 2020):
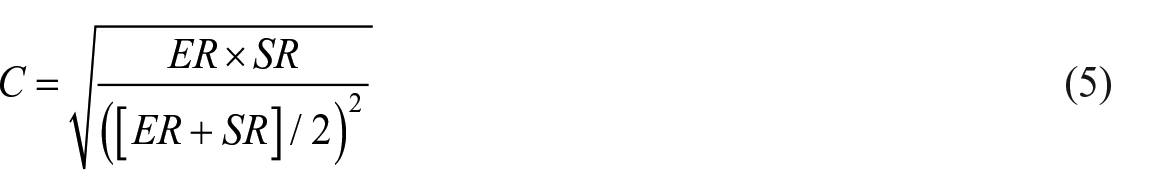


where
Mapping spatial-temporal pattern of SR, ER and CCD SER
This study applied the Theil-Sen method to calculate long term change trends in SR, ER, and CCD SER . And we used Mann-Kendall (MK) to test the trend significance of long time series data. Theil-Sen slope method is a robust non-parametric statistical technique for change trend detection with high computational efficiency (Sikakwe et al., 2020). The MK test for change trend detection is a rank-based non-parametric model used to assess the existence of a monotonically continuous trend in serially independent data (Kendall, 1990). Both methods are robust to potential observed outliers and are suitable for analyzing trends in long-term series data. More detailed calculation process can be found in the Online Supplementary Information.
Spatial representation of resilience based on local spatial auto-correlation
The local spatial auto-correlation analysis is usually used to calculate the degree of spatial agglomeration of geographical elements in a local area, with the aim of reflecting and identifying the spatial distribution characteristics of the geographical elements (Guo et al., 2024). This paper used GeoDa software to measure the spatial relationship between county-level SR, ER, and CCD SER . The expression is as follows:

where
Identifying potential factors that affect the CCD SER
This study used geographic detectors to identify potential drivers that influence CCD SER . This method not only effectively identifies the effect mode of each driving factor on coupled SER but can also reveal the dominant influence of the combined effects among various influencing factors (Xue et al., 2023). These can be expressed using the formulas:
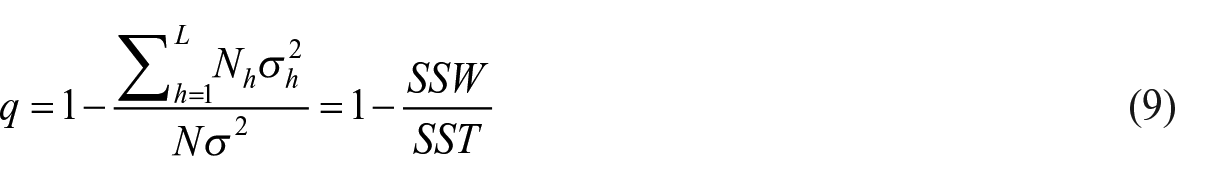

among them, q (0 < q < 1) represents the explanatory power of the independent variable on the dependent variable. The larger the q value, the stronger the explanatory power; h = 1, 2, . . .; L is the number of categories in the independent variable; the SSW and SST are the sum of the variance of the selected object and the total variance of the population, respectively. Online Supplementary Table S6 provides the references for dividing the interactive relationships between the two factors.
Spatial characterization based on MGWR model
The geographic detector effectively quantified the influencing factors of CCD SER , but failed to provide more detailed spatial information. This study introduced a Multi-scale Geographically Weighted Regression Model (MGWR) to try to reveal the spatial manifestations and driving mechanisms that affect CCD SER . The MGWR can be expressed as follows (Fotheringham et al., 2017):
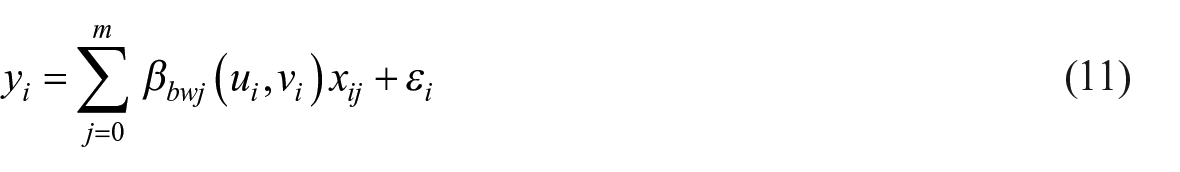
where
Result
Analysis of spatial temporal characteristics of resilience subsystems
As shown in Figure 3, the ER of counties across the province presents a distribution pattern of high around and low in the middle. From 2000 to 2020, the mean resilience of habitat quality was 0.639 (Figure 3a), carbon sequestration resilience was 0.513 (Figure 3b), the mean resilience of water conservation was 0.429 (Figure 3c), and the mean resilience of soil conservation was 0.844 (Figure 3d). Among them, the high-value areas of habitat quality resilience are mainly distributed in the eastern part of the study area, gradually increasing from west to east. The areas with high carbon sequestration resilience are mainly concentrated in the southern part of the study area. From the perspective of temporal and spatial change distribution, the increasing trend is most significant in some counties in the southwest, southeast and north of the study area.
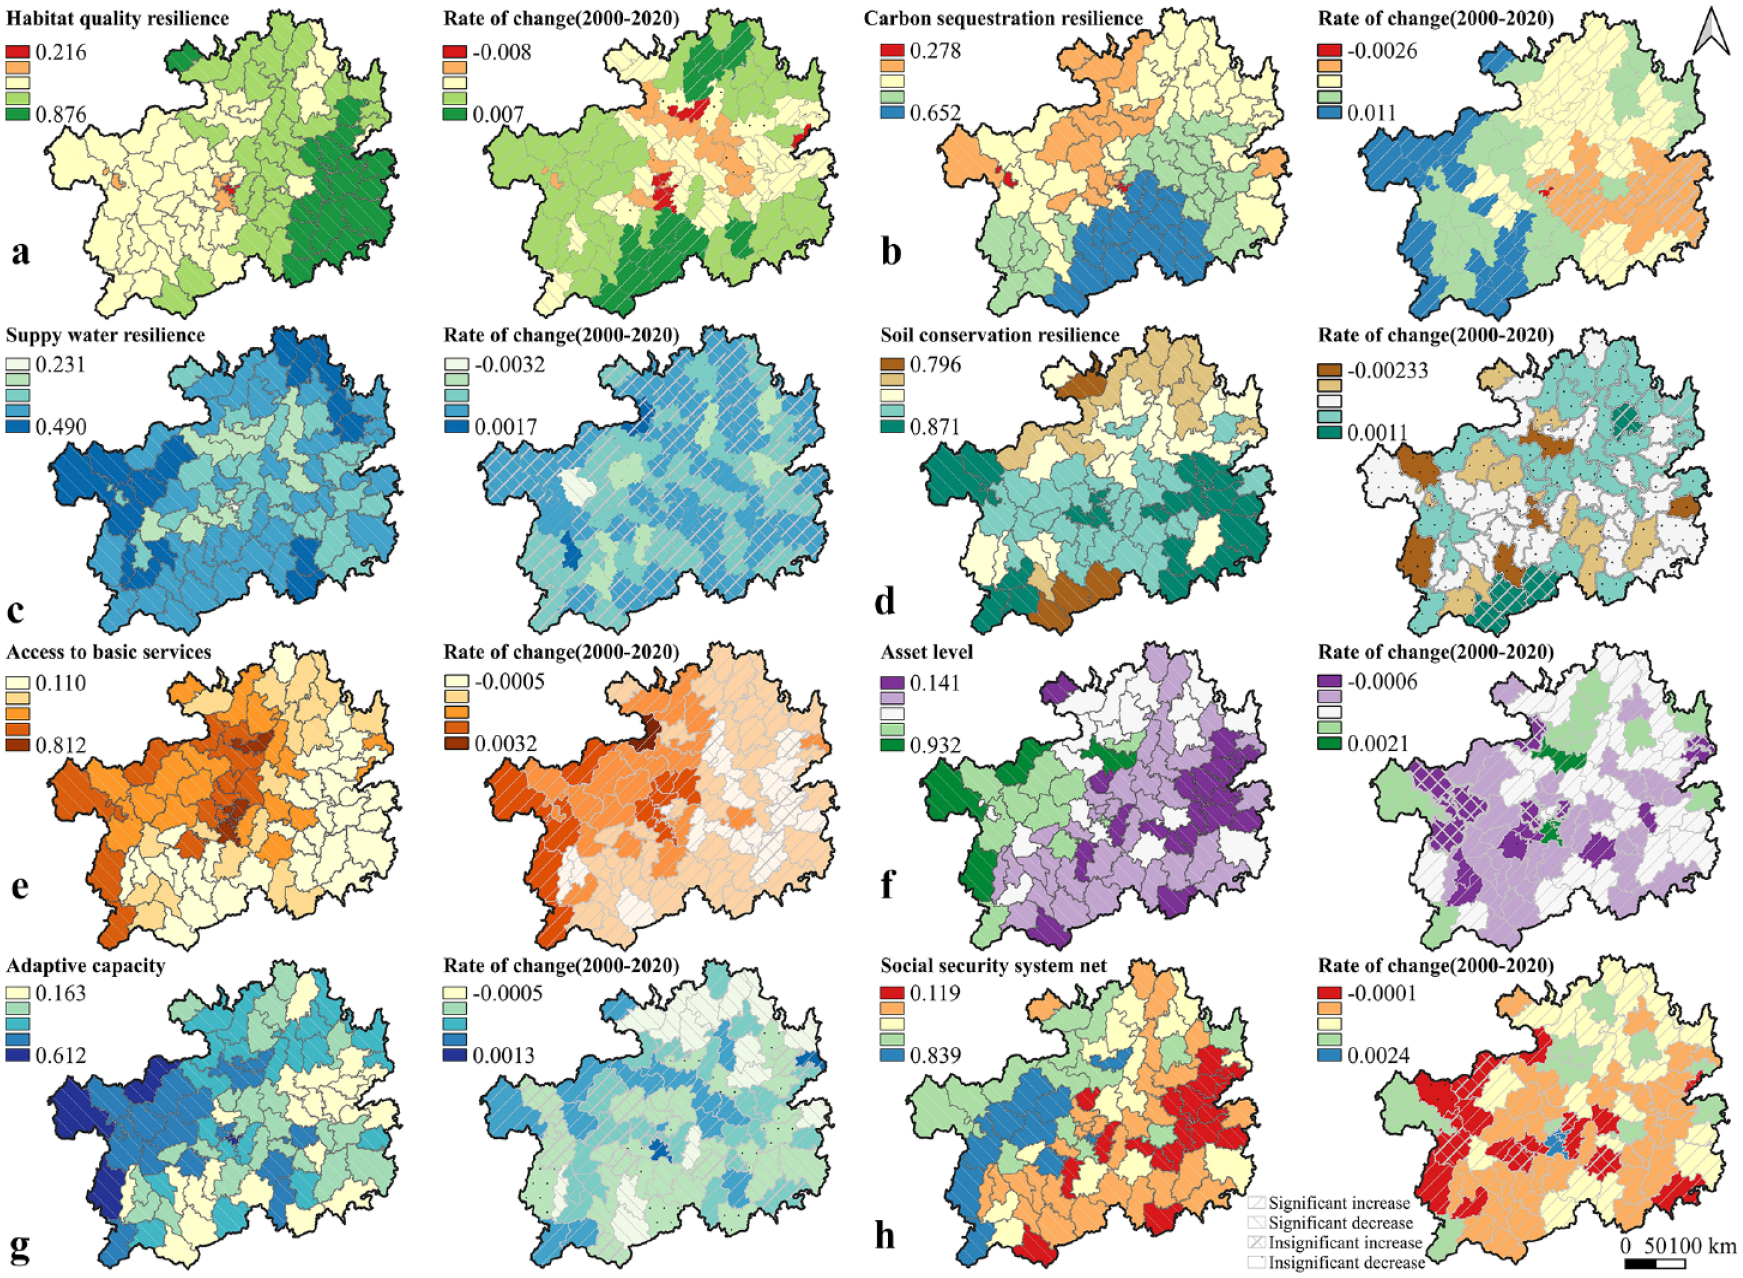
The spatial and temporal features and changing trend of resilience subsystem. (a-d) Spatial temporal distribution of the ecological resilience subsystem. (e-h) Spatial temporal distribution of the social resilience subsystem.
Unlike ER, areas with high SR are mainly concentrated in the central part of the study area and the counties under the jurisdiction of various prefecture-level cities, while areas with low SR are mostly located in the south and southeast where economic development is relatively low (Figure 3e–h). Specifically, in terms of access to basic services, the assessment score is 0.110-0.815, with the lowest levels in counties in the southern and southeastern parts of the province; the asset level assessment score is 0.141-0.932. In addition, the study showed that the SR subsystem in the study area showed a relatively obvious increasing trend as a whole, among which the increasing trends in asset level and access to basic services were the most significant.
The study found that from 2000 to 2020, ER subsystems in the study area showed: a significant improvement in habitat quality resilience, a substantial increase in carbon sequestration resilience, a gradual increase in water conservation resilience, and a fluctuation in soil conservation resilience (Figure 4a–d). Among them, the fluctuations in water conservation resilience (0.366–0.488) and soil conservation resilience (0.595–0.769) were the strongest. As can be seen from Figure 4, the changes in the SR subsystem show an increasing trend. From the perspective of the changing trend, the maximum score of the asset subsystem is 0.356, which peaked in 2018 and immediately rose again after a decline in 2019 (Figure 4e). This may be related to the fact that the per capita grain output in Guizhou Province in 2019 decreased by 1.39% year-on-year compared with 2018. The access to basic services reached its maximum value in 2014 (0.333).
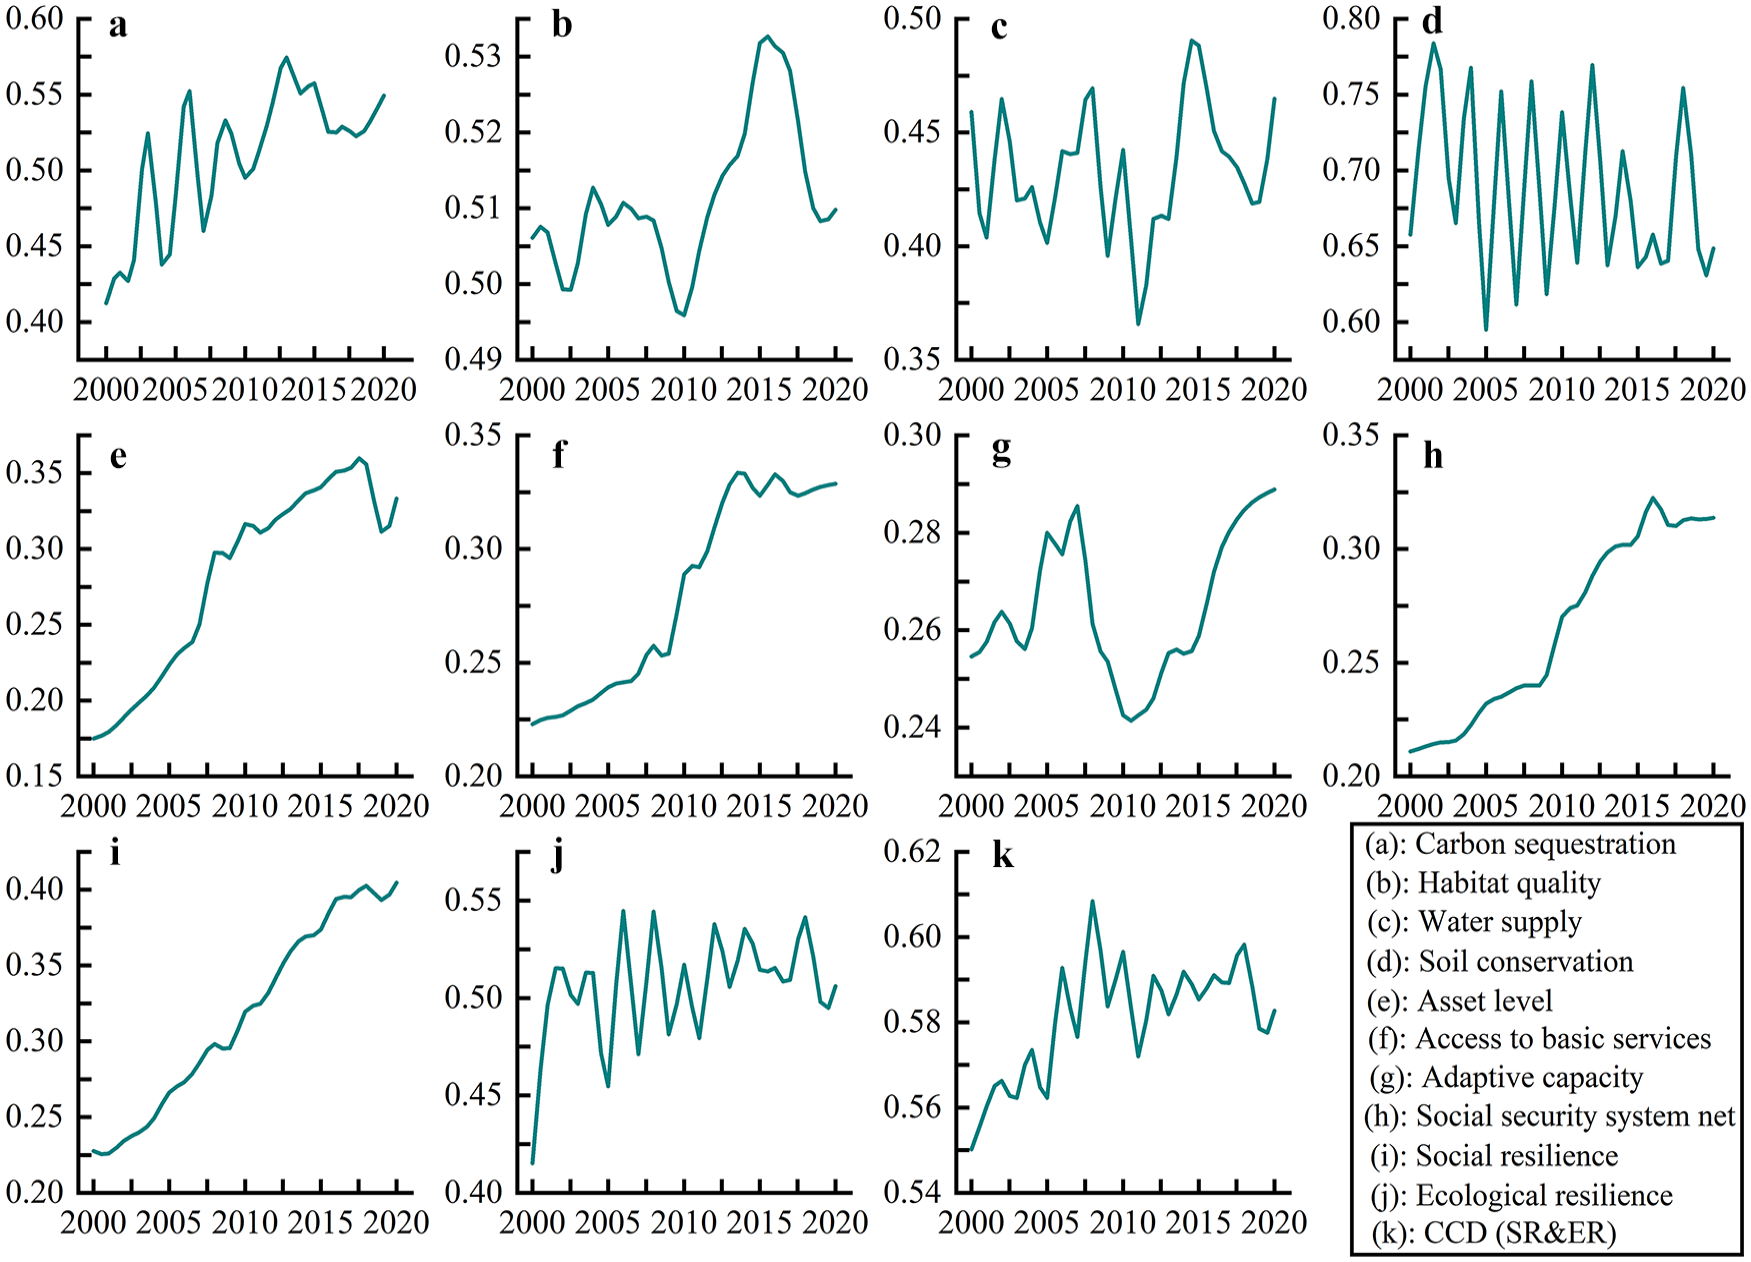
Change trend of resilience subsystem (2000–2020). (a-d) Change trends of ecological resilience subsystem. (e-h) Change trends of social resilience subsystem. (i-k) Change trends of social-ecological and coupling resilience.
Spatial analysis of SR, ER and their coupling coordination
The research results show that the average SR in the study area over the years is 0.318, the average ER is 0.535, and the average CCD SER is 0.581. Among them, the spatial distribution of ER is high in the east and low in the west. During this period, ER gradually increased, with an obviously increasing trend in the northern, southern, and western counties, with a fluctuation trend between -0.0036 and 0.0045 (Figure 5d–f). In comparison, the high-value area of SR is located in the central part of the study area, while the low-value area is located in the southeast (Figure 5a–c). The CCD SER shows a decreasing trend from west to east, with a slope ranging from -0.049 to 0.075 (Figure 5g–i).
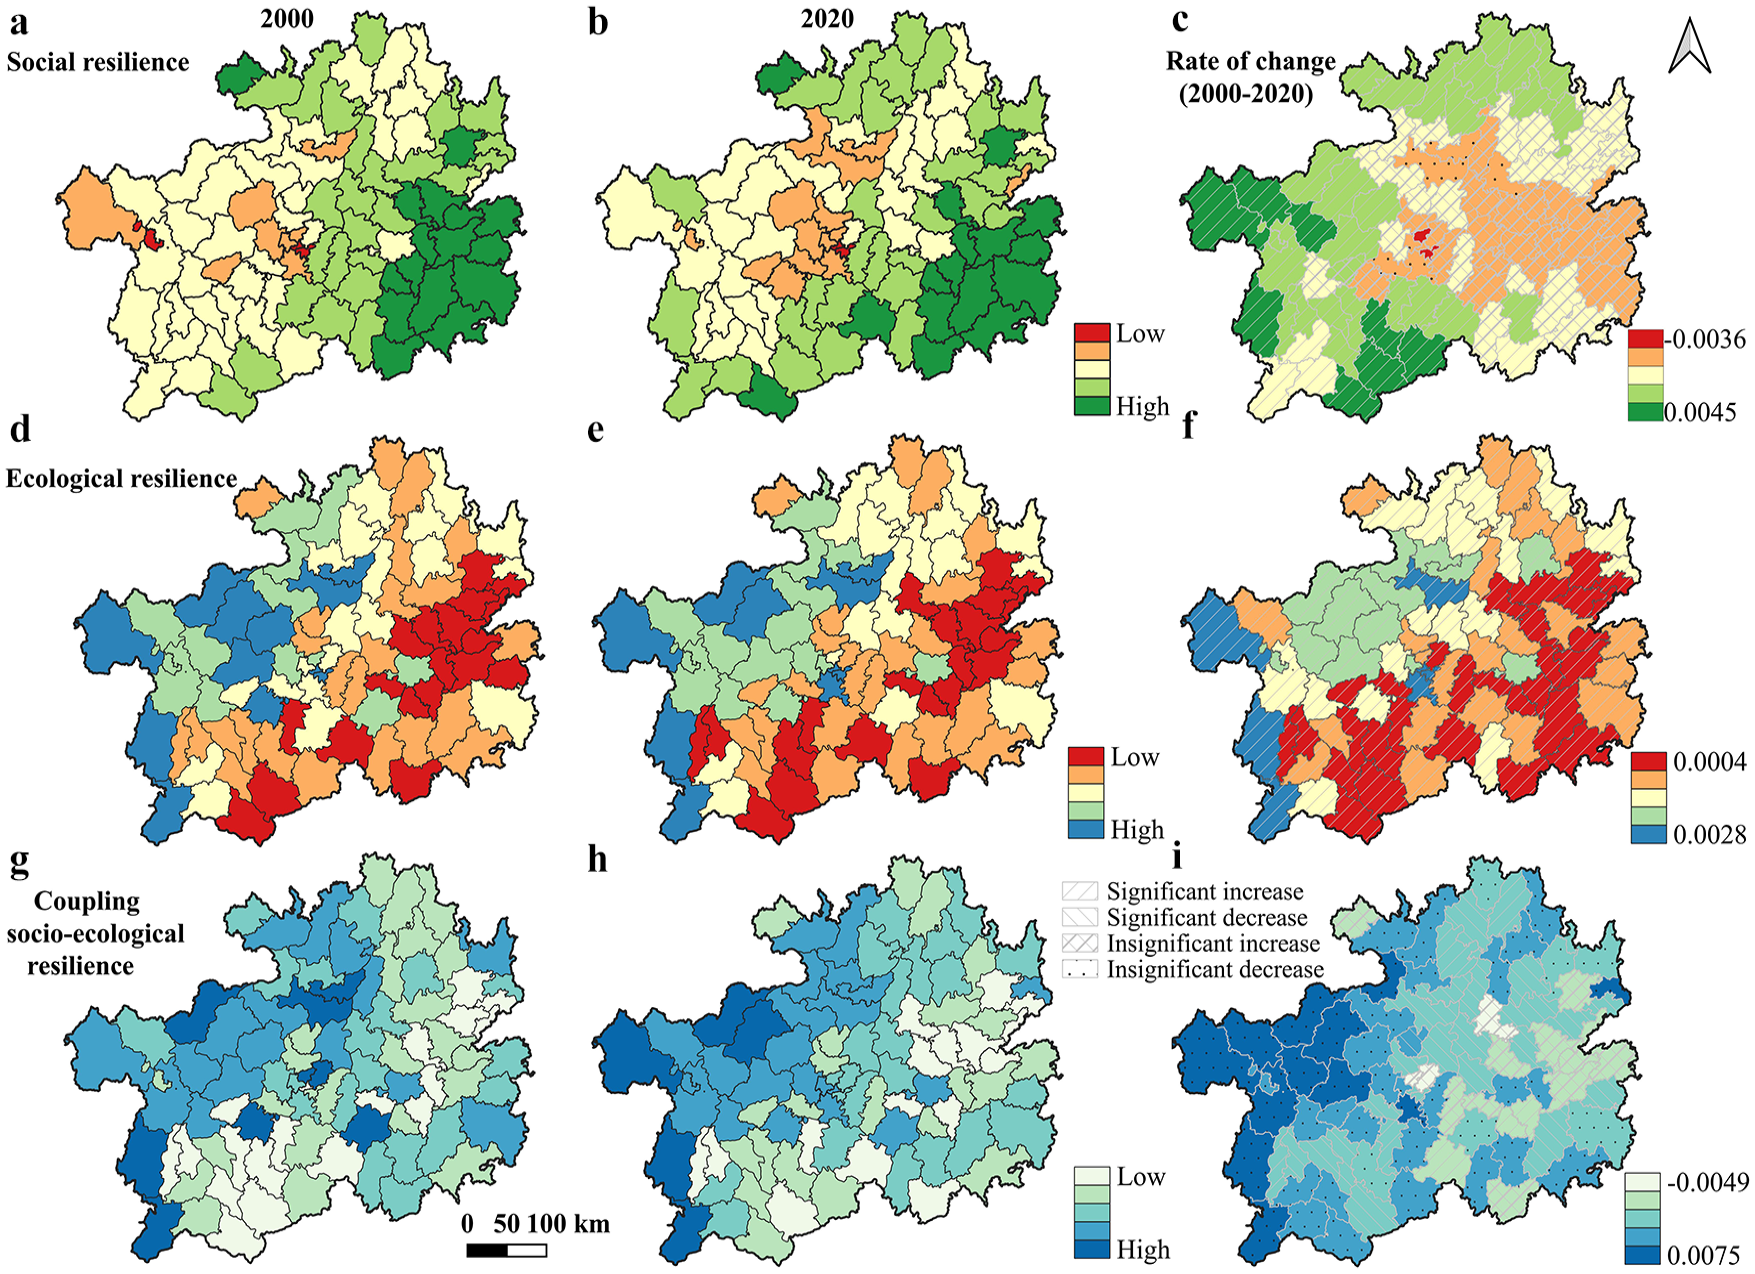
Spatial temporal distribution diagram of SR, ER and their coupling coordination. (a-c) Spatial temporal changes in social resilience. (d-f) Spatial temporal changes in ecological resilience. (g-i) Spatial temporal changes in coupled resilience.
Local spatial auto-correlation analysis shows that SR, ER and CCD SER all exhibit significant auto-correlation, with significant spatial agglomeration characteristics and dynamic changes over time (Figure 6). Online Supplementary Table S7 provides the Z values and P values for the Moran's index test. Among them, the overall trend of ER first increased and then decreased, with the largest spatial aggregation in 2010 (0.656); the spatial auto-correlation of SR first increased and then decreased, with the most obvious spatial aggregation in 2010 (0.494). The Moran index of CCD SER increased by 0.170 from 2000-2020. From the spatial distribution features, in general, the spatial clustering of ER in most counties in the southeastern of the study area shows high-high distribution characteristics, while the spatial agglomeration of some counties in the central and western areas shows low-low distribution characteristics and low-high distribution characteristics. The spatial agglomeration of SR shows the opposite distribution characteristics to the distribution of ER, that is, the southeast has low-low distribution characteristics, and the west has high-high distribution characteristics. The spatial feature of the clustering characteristics of CCD SER is roughly similar to that of the agglomeration characteristics of SR.
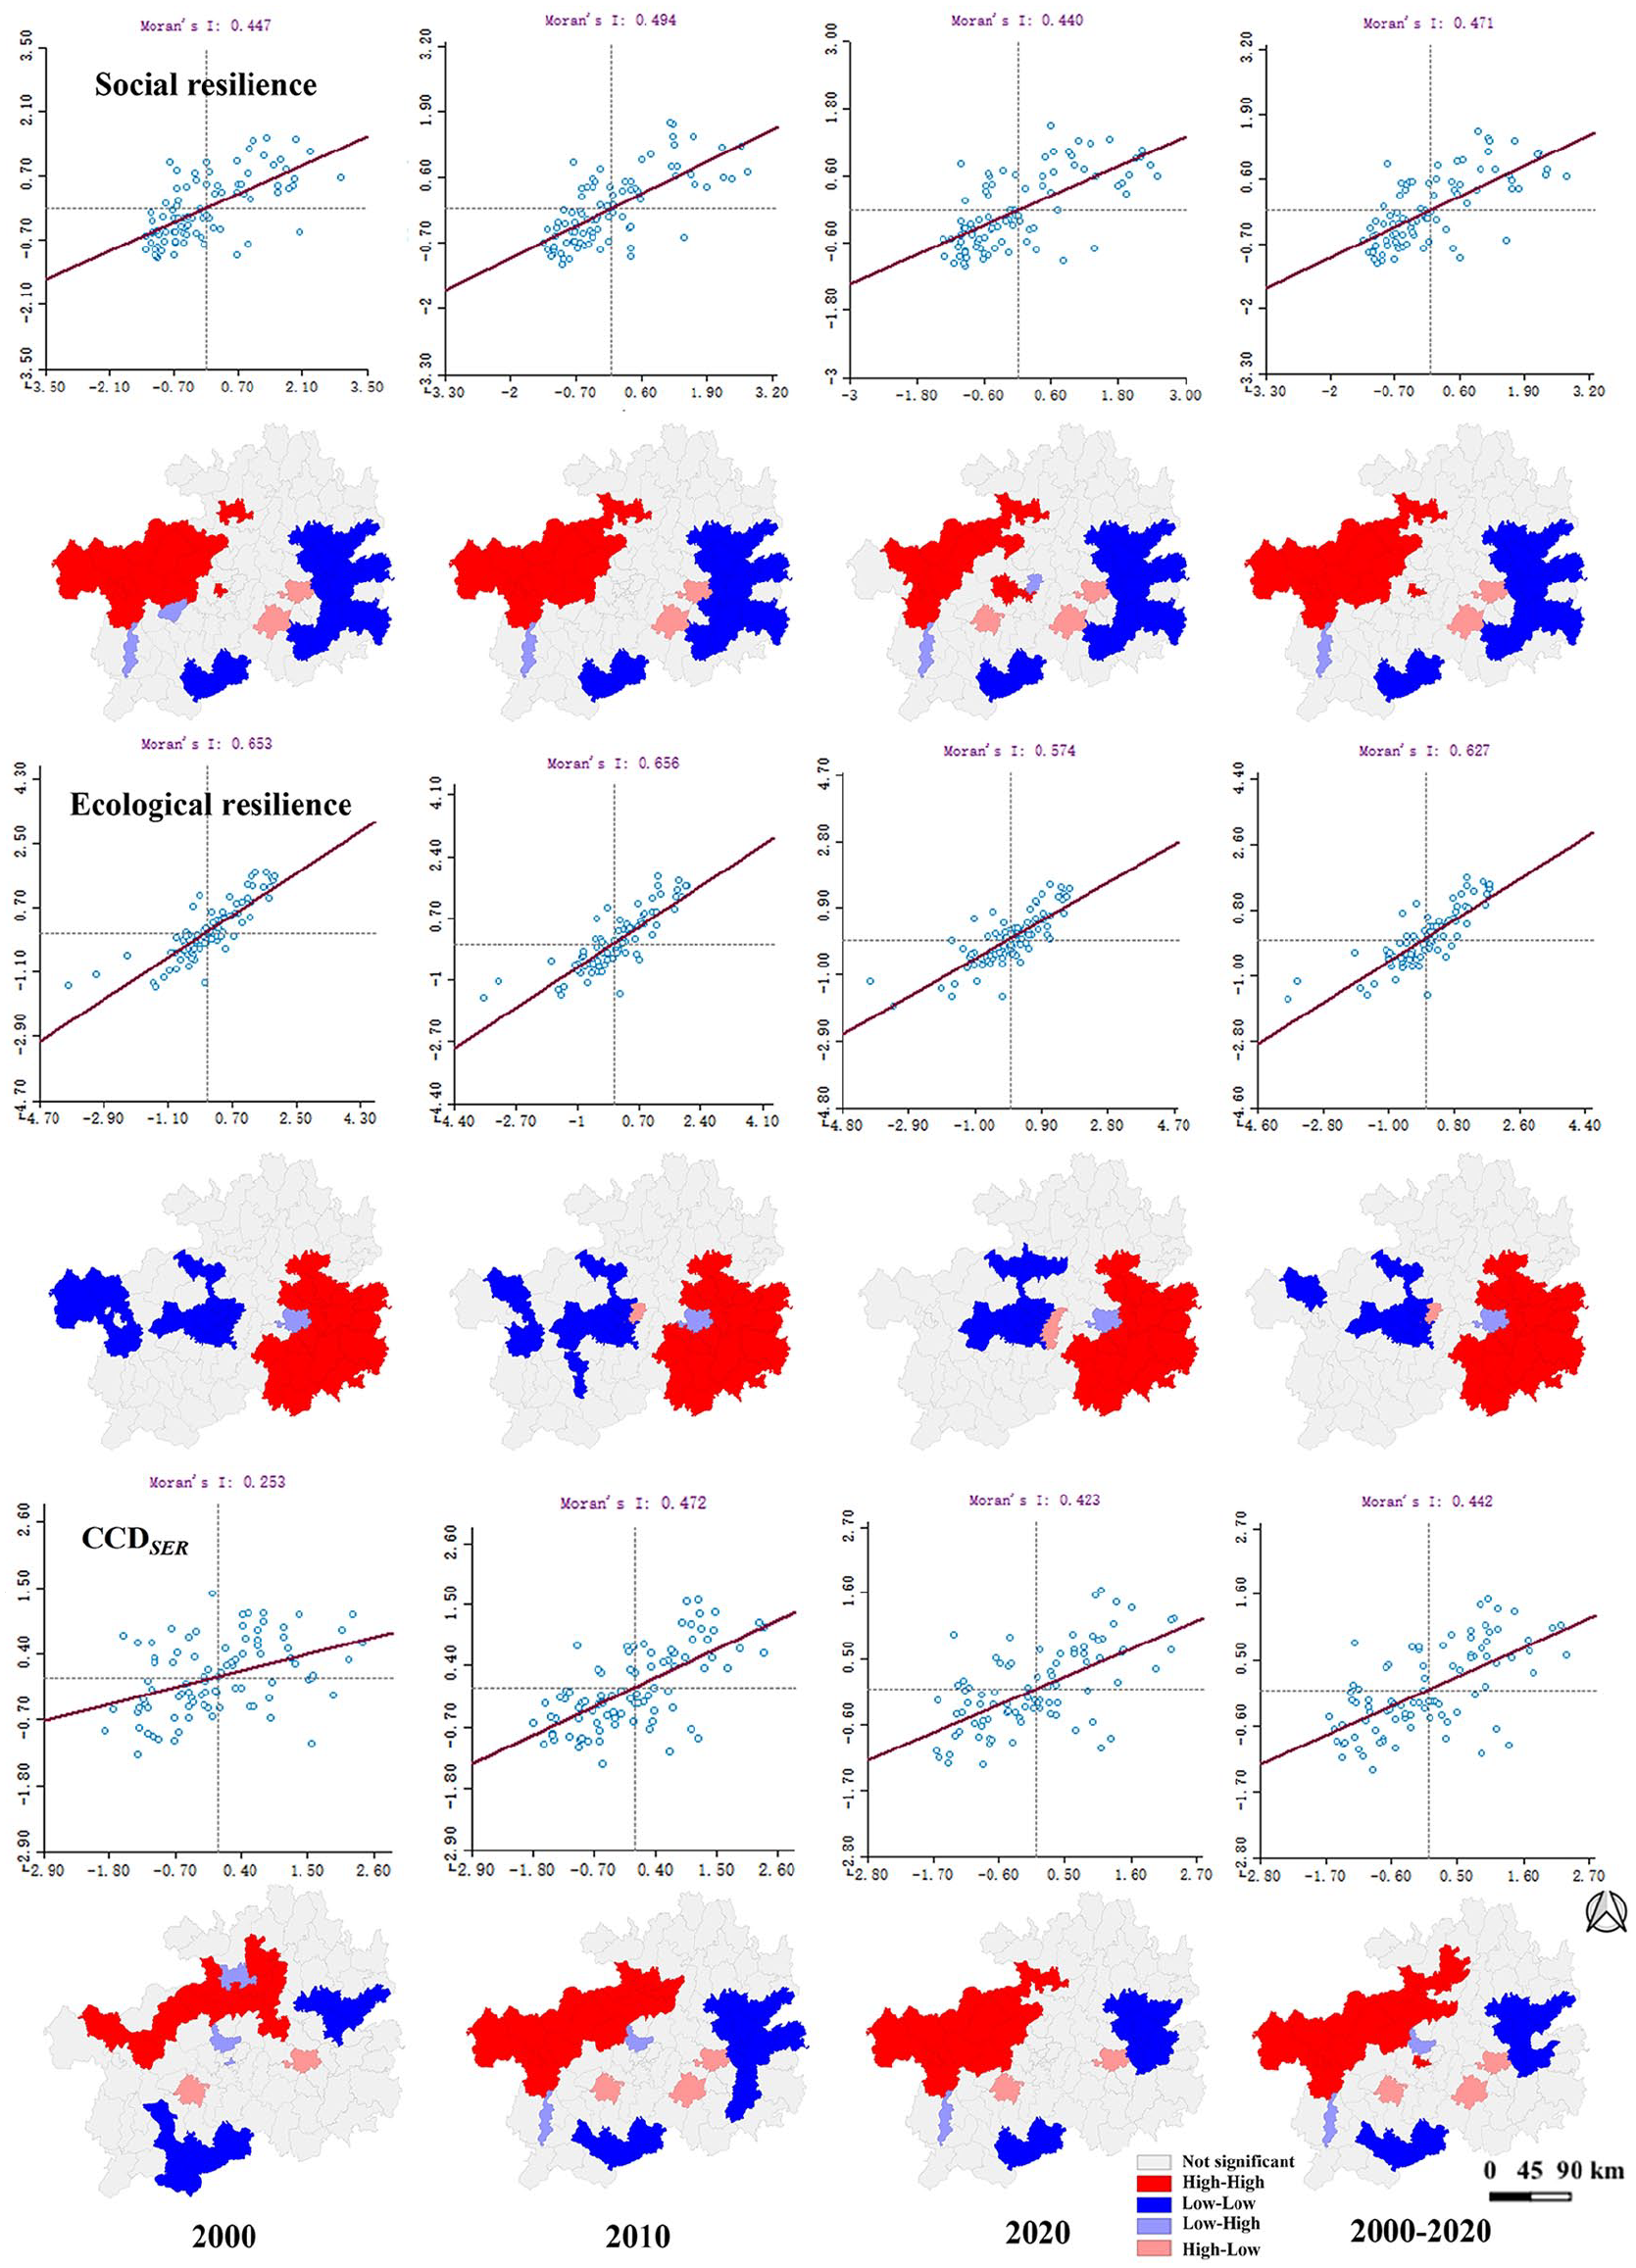
Spatial temporal variation diagram of the local Moran index of SR, ER, and CCD SER.
The study on the evolutionary mechanism of CCD SER
In order to further reveal the evolutionary mechanism of CCD SER , this paper, based on existing research and the geological background of karst counties, selected 14 indicators as potential variables from the socio-economic and natural environment dimensions to explore the influencing mechanism of this complex process (Table 3).
The influencing factors and single factor results of geographic detectors.
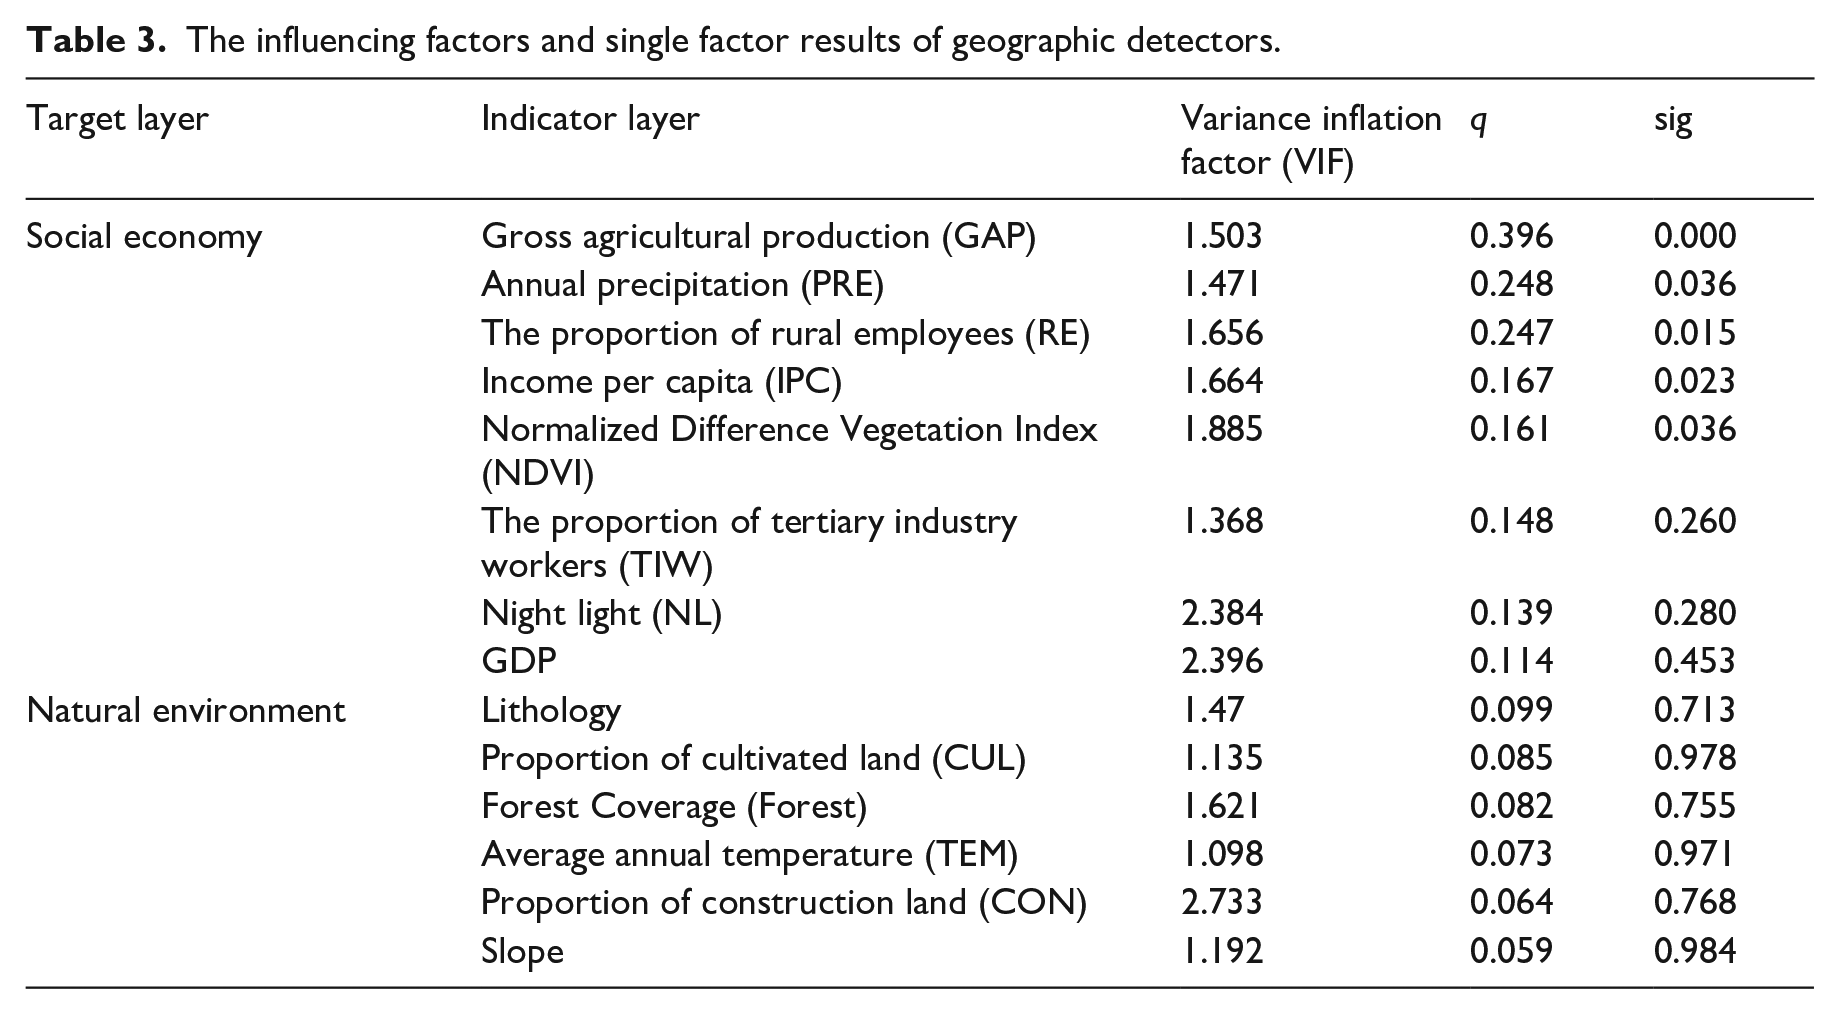
Before conducting an influence mechanism analysis, conducting a linearity test on the selected factors is a necessary step to make sure the reliability of the analysis results. The test results show that the VIF values of various indicators are less than 5, which meets the analysis requirements. The results of the geographical detector show that at the 0.05 level of significance, the three variables of gross agricultural production, annual precipitation and rural employees have the most significant impact on CCD SER , with explanatory powers of 0.396, 0.248 and 0.247 respectively. Next are income per capita and NDVI, which can explain 16.7% and 16.1% of the spatial variation of CCD SER , respectively. Of course, other factors also play a role in coupling coordination, such as the proportion of employees in the tertiary industry (0.148), the night light (0.139) and GDP (0.114).
In addition, studies have found that CCD SER is often affected by a combination of factors. As can be seen from Figure 7, compared with the influence of a single factor, the interactive influence contributes to it more. For example, the impact of forest coverage rate and gross agricultural production on CCD SER reached 0.758, and the impact of income per capita and the proportion of employees in the tertiary industry on coupled coordination reached 0.662.
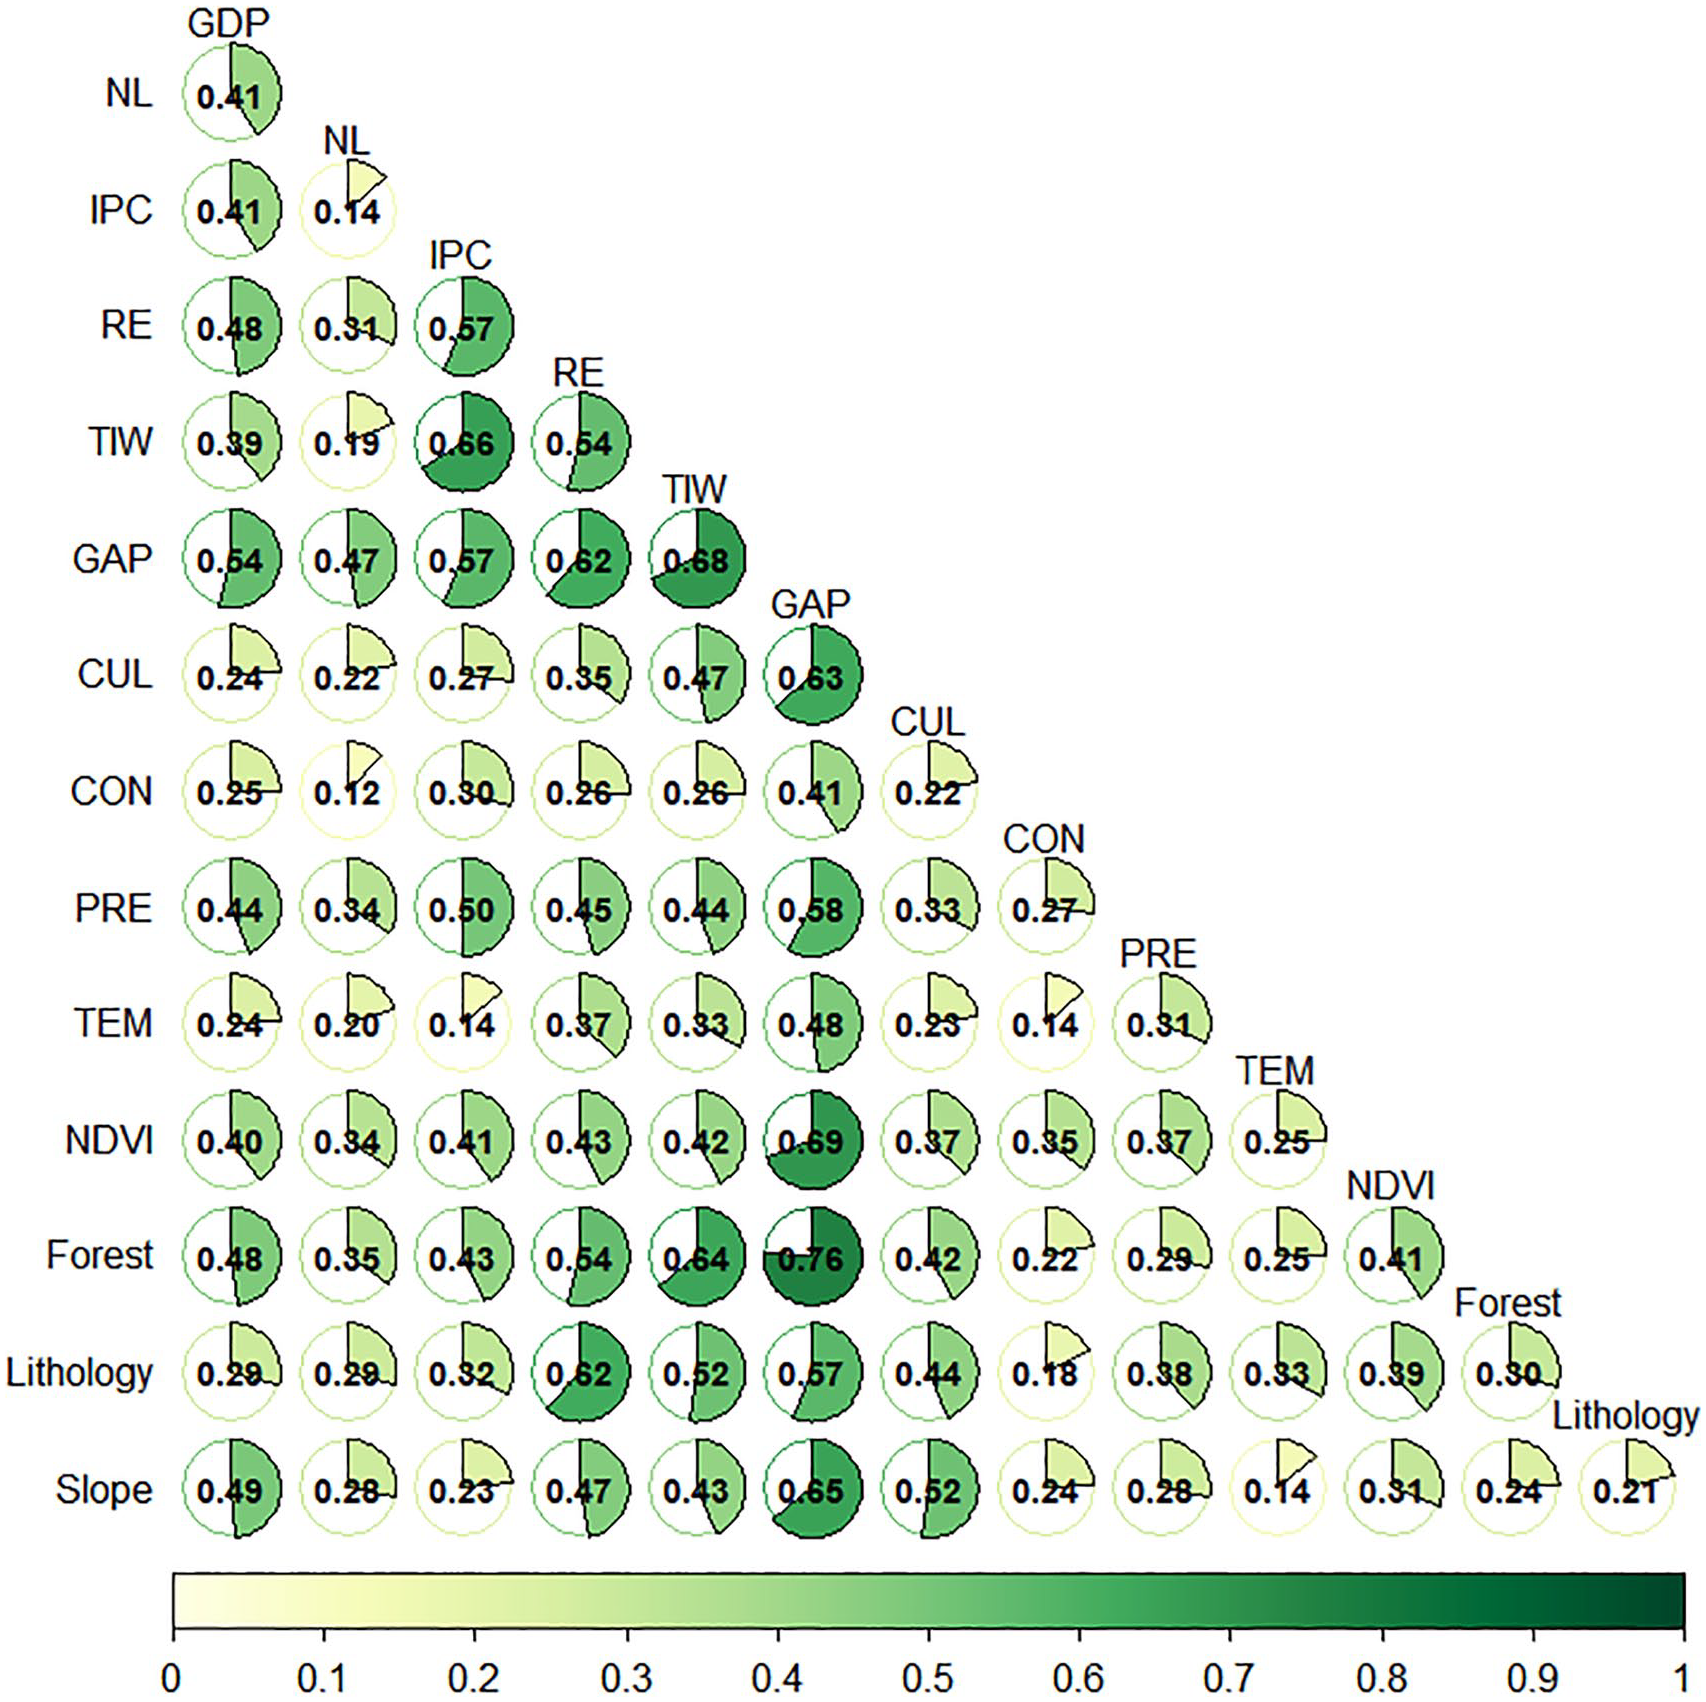
Effect of single factor on CCD SER.
The geographic detector analysis effectively identified the factors that most significantly influence CCD SER , but it neglected to consider the spatial scale. Based on the geographic detector, we selected the gross agricultural production, annual precipitation, the proportion of rural employees, the income per capita, NDVI, the proportion of employees in the tertiary industry, night light index and GDP as driving factors for MGWR analysis. The MGWR model test analysis in this paper has an AIcc of 241.978, an Adj. R2 of 0.464, and a residual sum of squares of 40.329. The model fitting shows that the experimental results are reliable. However, since the annual precipitation and income per capita did not pass the significance test at all, they were not shown in the results.
From the analysis of Figure 8, it can be seen that the impact of various driving factors on CCD SER has significant spatial heterogeneity, distributed in the form of strips, and all show a positive promoting effect. Specifically, the MGWR coefficient of gross agricultural production ranges from 0.223 to 0.686, and the positive impact from west to east increases first and then decreases (Figure 8a); while the coefficient of the proportion of rural employees (0.333-0.336) increases gradually from southwest to east (Figure 8b); the MGWR coefficients of NDVI (0.165-0.169) and the proportion of tertiary industry workers (0.033-0.035) have similar characteristics in space, gradually increasing from west to east (Figure 8c and d); The high-value areas of the MGWR impact coefficient of night lights are distributed in the southeast (Figure 8e); the MGWR coefficient of GDP ranges from 0.178 to 2.511 (Figure 8f). Of course, areas that fail the test do not mean that they are not affected by driving factors, it is just a methodological shortcoming.
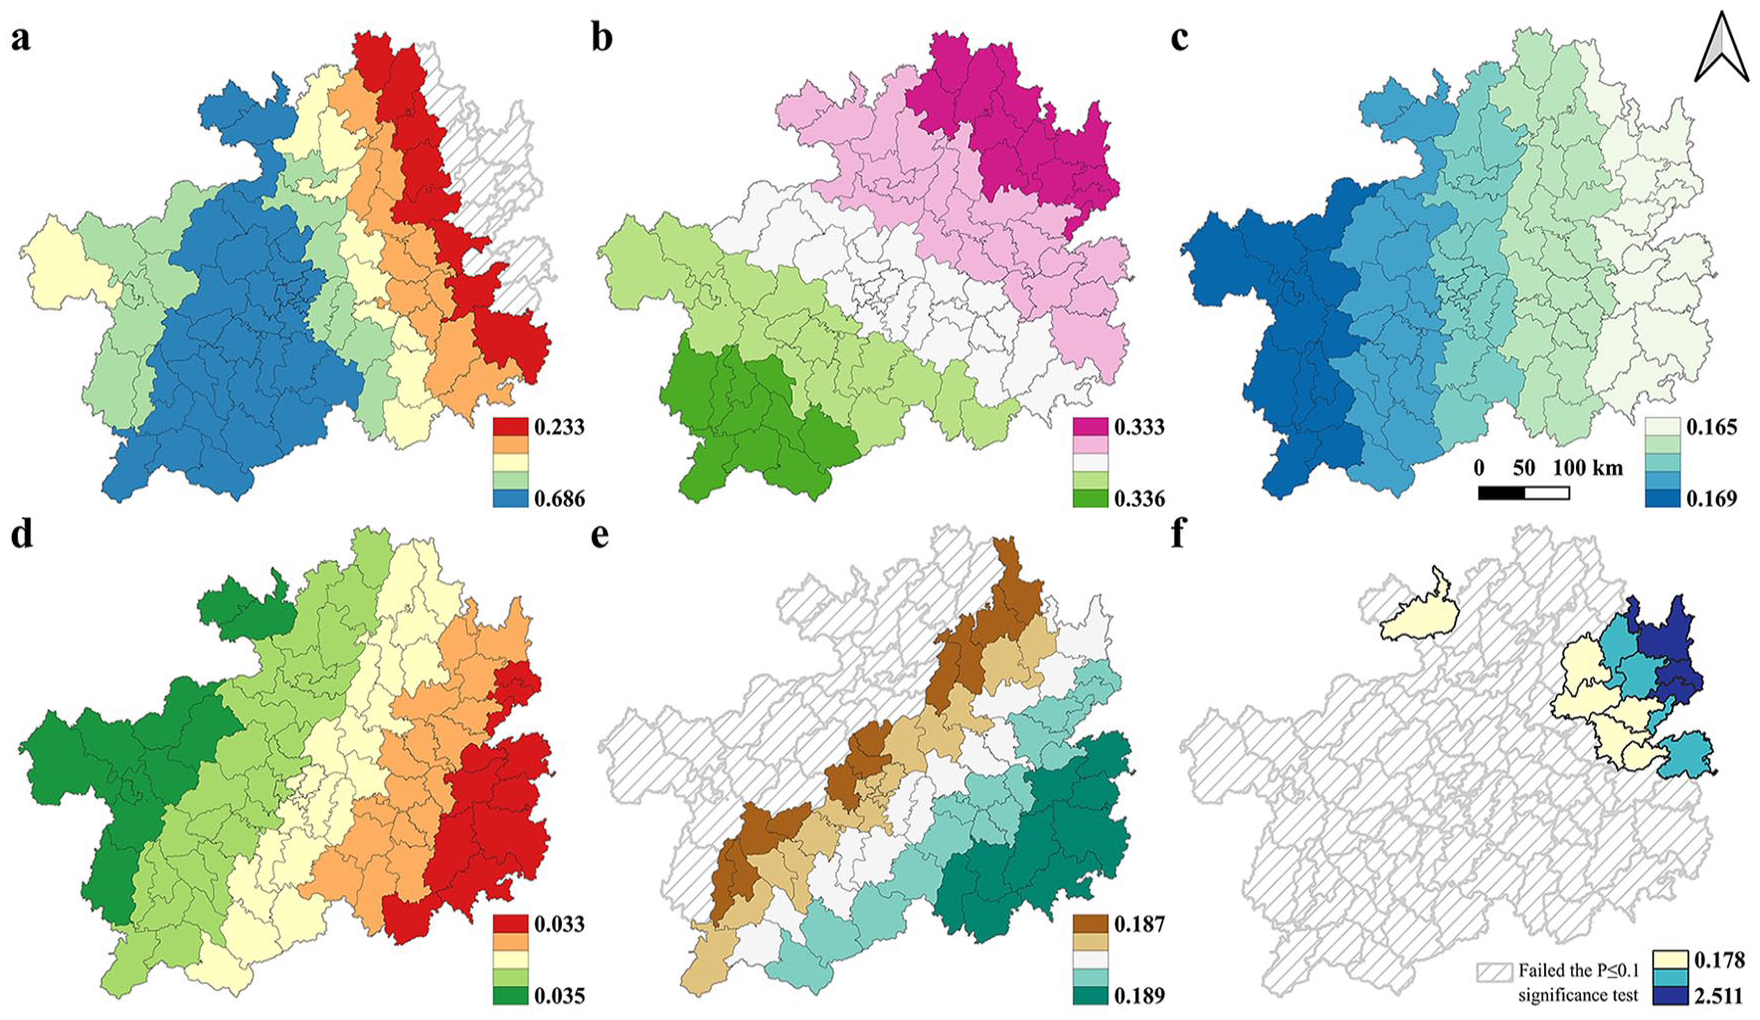
MGWR influence coefficient. (a) Gross agricultural production. (b) The proportion of rural employees. (c) NDVI. (d) The proportion of tertiary industry workers. (e) Night light. (f) GDP.
The response of ER to SR
The study found that the curve fitting of linear analysis is difficult to fully reveal the intrinsic relationship between the two. Compared with linear fitting, binomial nonlinear fitting shows significant advantages in key indicators such as Adj.R² (Online Supplementary Table S8 and Table S9). The various fitting parameters of the model also strongly confirm that binomial nonlinear fitting has better robustness and can more accurately depict the complex relationship between SR and ER. The Online Supplementary Material provides information on the validation parameters of the model.
Figure 9 illustrates the differences in the nonlinear relationship between SR and ER in different years. The results show that SR and ER are significantly negatively correlated. According to the differences in the development of social economy and ecological construction in the study area, the nonlinear characteristics between SR and ER are prominent. The ER is lower in the high value area of SR. That is, the nonlinear relationship derived in this paper is empirically supported.
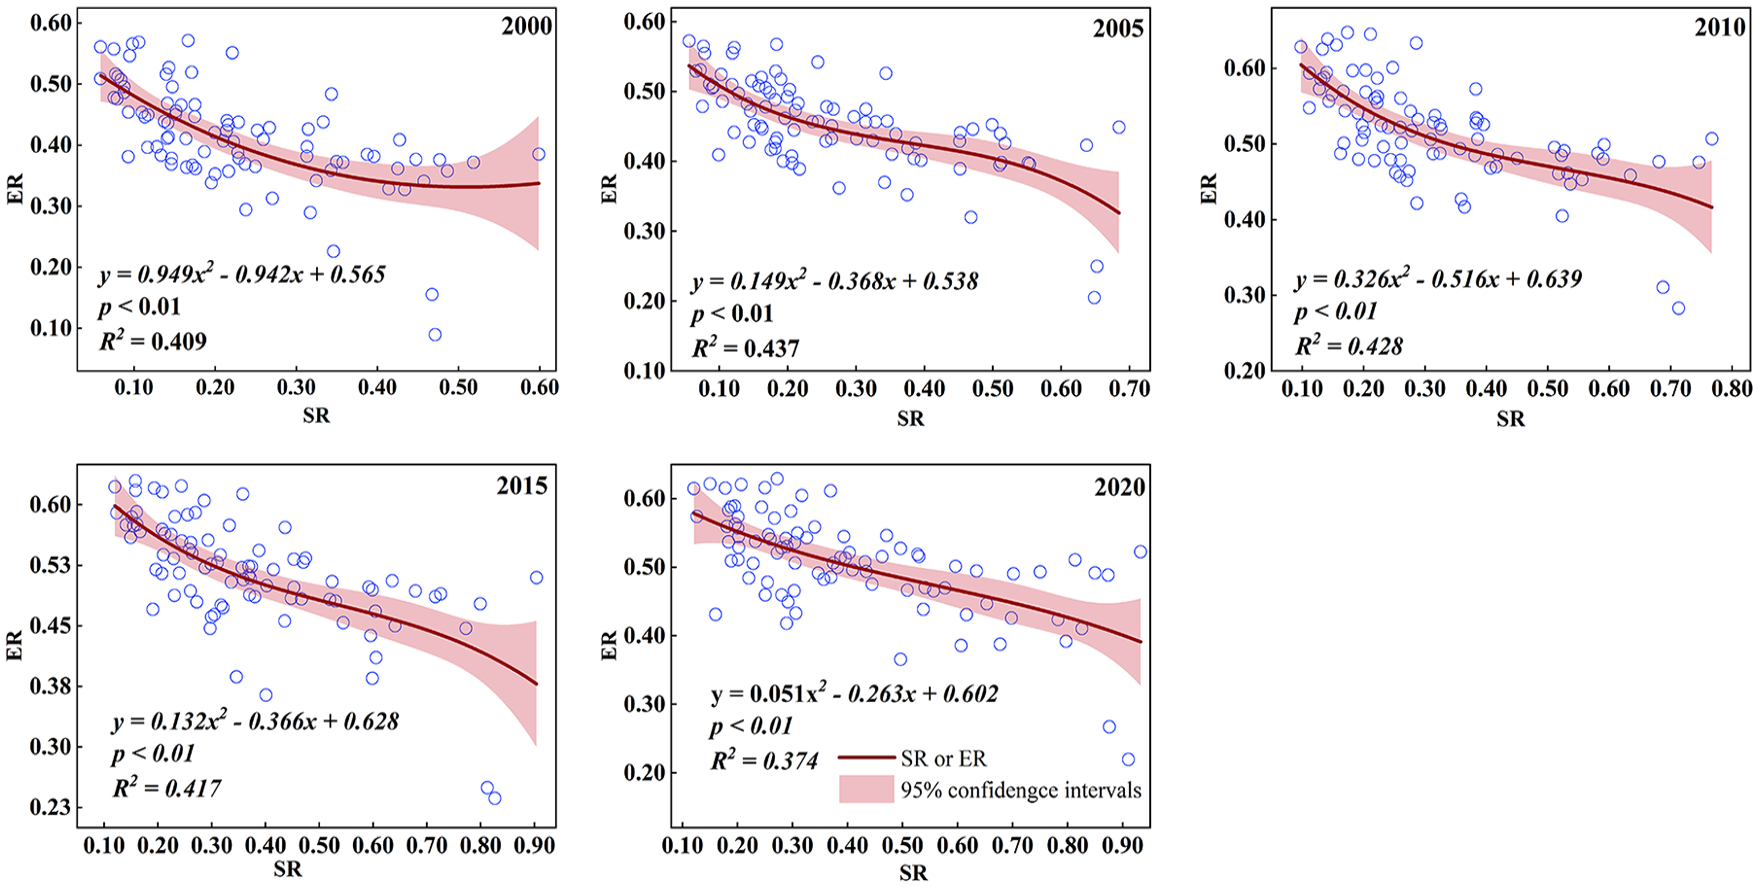
Quadratic fitting curve between SR and ER.
Discussion
The construction of the CCD SER framework and the revelation of the relationship between SR and ER
Global sustainability challenges, as articulated in the United Nations 2030 Agenda for Sustainable Development, are intricate and interrelated (Oldekop et al., 2016). For instance, the SDGs aim to eradicate global poverty within the next 15 years while ensuring the integrity of the SES essential for sustained human prosperity (IPCC, 2023). However, the conceptual frameworks and measurement methods remain ill-equipped to handle this interrelated complexity. To this end, this paper constructs a coupled SES framework with resilience as the connecting point to assess the complex interactions between SER at the county scale in a typical karst region. This framework markedly contrasts with most existing frameworks, which primarily emphasize understanding and illustrate social systems and ecosystems from a single perspective (Armitage et al., 2012). A major advantage of the CCD SER framework constructed in this study is that it integrates SES to reveal how social drivers affect ESs, and how changes in ecological feedback affect human well-being. This paper identified a nonlinear relationship between SR and ER, which showed a significant negative correlation. This supports the hypothesis of a nonlinear association between SR and ER. It lays the foundation for a deeper understanding of the coupling interaction between SR and ER.
The above progress will promote integrated modeling to create more social-ecological relevance and provide the key information needed to move towards a more prosperous, equal and sustainable future. However, to maximize the value of this information, it is necessary to bridge the gap between scientific planning and action. For example, many findings have shown that the positive benefits of taking climate action to reduce carbon emissions far outweigh the costs of pollution control (Tanner et al., 2015). Meanwhile, carbon emissions and biodiversity loss continue every year. In such a scenario, coordinating policy measures with environmental governance can play a key role in promoting in SER, thereby simultaneously enhancing environmental benefits and human well-being. Additionally, scholars worldwide have emphasized that in Africa and Latin America, the decoupling between ER and SR can have a number of negative impacts on the region's sustainable development (Ansah et al., 2023). The resilience indicator system and coupling framework constructed in this article take into account the stability and sustainability of the ecosystem on the one hand, and combine the local economic structure and policy measures on the other, to reveal the interaction between SR and ER at the county scale from the perspective of SES. Considering this, future global empirical studies using our proposed coupled assessment model to measure the coordination of social resilience and ecological resilience for sustainable development in mountainous counties of similar countries hold great promise.
Challenges remain despite the success of the region development strategy
In order to ensure the stability, balance and sustainability of the operation of the SES, Guizhou Province adopted a number of policy measures to improve and enhance SER during this period. The results show that the construction of resilience in Guizhou's counties has achieved remarkable results, with ER increasing from 0.415 to 0.545 and SR increasing from 0.228 to 0.405. The region's good ecological background, poverty and lack of development have created this unbalanced growth pattern. In addition, this growth trend is also due to the vigorous implementation of ecological protection and sustainable development policies by Guizhou Province since 2000, ecological projects such as returning farmland to forests, desertification control, and biodiversity protection, as well as economic development policies such as education, medical care, elderly care, and infrastructure. (Figure 10). These measures have promoted the balanced development of SR and ER to a certain extent. In particular, the local government hopes to focus its efforts on developing the provincial capital center, and then transfer the development experience, funds and talents from other counties to central counties. This is consistent with the development strategy of eastern and western China, namely to achieve the basic national strategic goal of "Rich First, Rich Later, and Prosperous All Together" (Du and Gottschang, 1995).
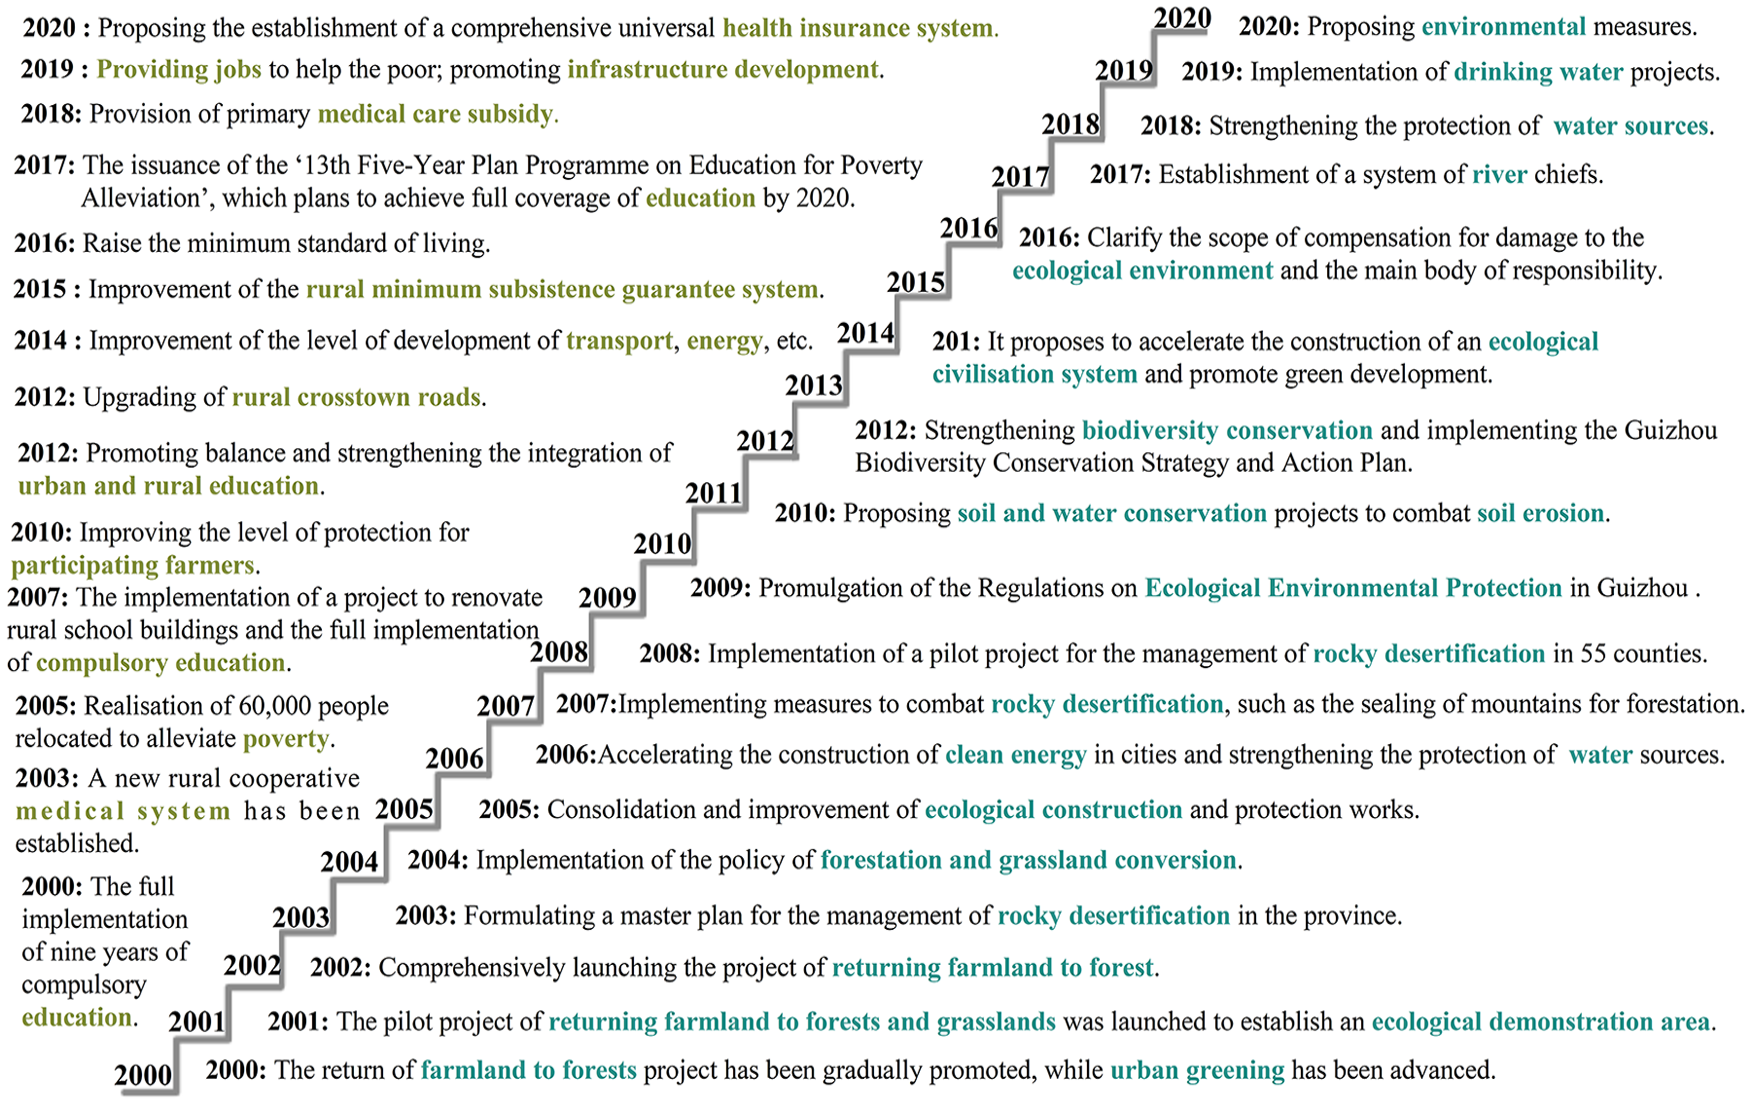
Timeline of Guizhou’s policy packages. Milestones of major development policy events in key areas of Guizhou (the total green and blue markers near the timeline).
Although this region has made remarkable achievements in building resilience, there are also some challenges. The study found that there is still a problem of decoupling between SR and ER in central and southeast counties, which means that as population and GDP grow, SR and ER do not increase simultaneously. Furthermore, while there is widespread acknowledgement of the complexity of future social-environmental challenges, there is little consensus on drivers and solutions (O’Sullivan, 2020). On the one hand, the primary drivers of phenomena such as increased resource demand, natural resource depletion, and harmful emissions are population growth and urbanization; an effective solution lies in appropriately managing population growth and urban expansion (Wise et al., 2014). On the other hand, as environmental pressures escalate due to economic growth, a critical approach involves reducing land and water usage (Sandifer et al., 2015). Consequently, striking a resilience synergistic enhancing balance point between societal resource demands and environmental limitations is crucial for achieving a path to transformation towards sustainable development in the karst region of southwest China.
The strategy to promote regional sustainable development
In general, there are obviously regional differences in the development of social economy and ecological construction in this study area, which leads to an imbalance in the improvement of SER. Based on the development level of CCD SER , this paper divides the 88 counties in the study area into five types: uncoordinated, slightly uncoordinated, primary coupling coordination, intermediate coupling coordination, and good coupling coordination (Figure 11). Then, scientific countermeasures for improving resilience were proposed in a targeted manner:
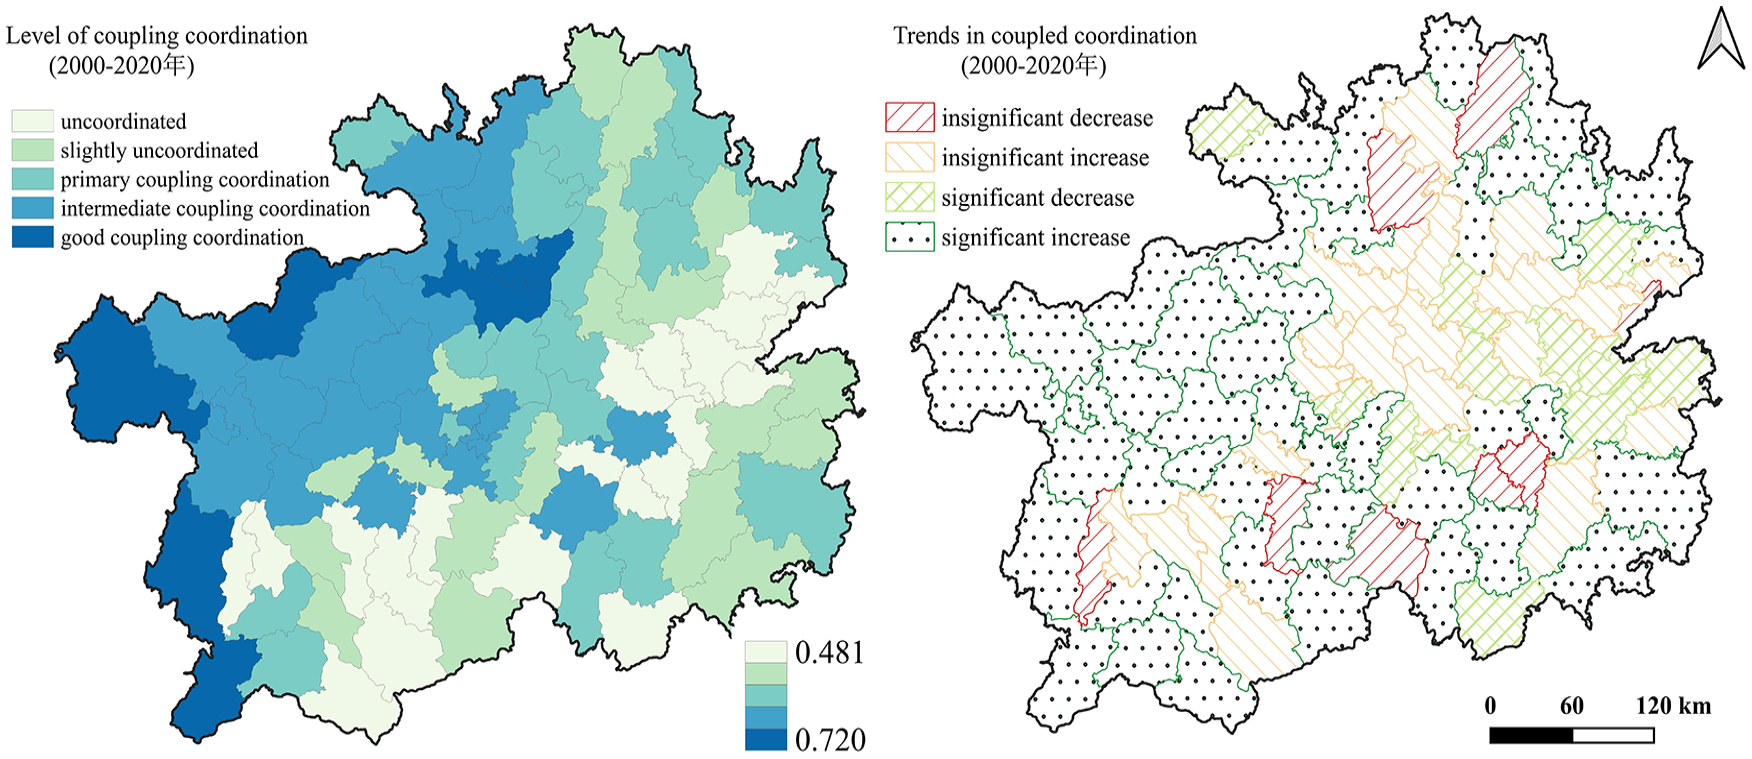
The spatial characteristics and divisions of CCD SER.
Research features, deficiencies and prospects
The unique feature of this study is that it introduces resilience into the SES at the county scale, constructs a multi-indicator and multi-factor SER coupling assessment system, and establishes a quantitative connection between the ER and SR within the same framework. Meanwhile, through case analysis, the paper analyzed the nonlinear relationship, coupling interaction, dynamic evolution, and influencing factors between SR and ER in the karst region of southwest China.
Admittedly, the resilience coupling framework constructed in this paper is not perfect in deepening the understanding of complex SES, but it does provide some new insights and examples that can be used to explore potential complex feedback and develop more sustainable development strategies. However, the selection of multiple variables and factors in this study is still imperfect. For example, the assessment based on ER only focuses on a subset of four ecological indicators (water conservation, soil conservation, habitat quality, and carbon sequestration). However, other ESs (such as food supply and air purification) are also crucial to the sustainable development of the region. Meanwhile, the assessment of SR only takes quantitative indicators into consideration, lacking qualitative factors such as residents' attitudes, perceptions and policy effects. These indicators that have not yet been considered will be the target of further research in the future. In addition, the threshold setting of ER may remain uncertain due to planetary boundaries, shared principles and sustainability perspectives, which are mainly methodological issues but provide reference avenues for future research. Lastly, we are well aware that the number of samples will have a certain impact on the model fit. Since this paper only uses 88 counties as samples, the Adj.R² of the model fit does not exceed 0.6. However, the core focus of this study is to explain the relationship between social resilience and ecological resilience, rather than simply pursuing the ultimate model fit. In the future, we will expand the scope of research and use more precise research methods to explore their relationship.
Conclusion
The SES plays a positive role in solving complex social and environmental problems by coupling and connecting social and ecological subsystems. This paper explores the spatial-temporal dynamics of SR and ER at county scale, focusing on the nonlinear relationship and coupled interaction between SR and ER, as well, their dynamic changes and influencing factors are revealed. On the one hand, it enriches the scope of resilience applications and expands the theoretical research on SES; on the other hand, it constructs a coupling framework suitable for exploring the interaction between economy and ecology in karst mountainous areas. Research shows the SR, ER and CCD SER in the study area showed a fluctuating upward trend, and the spatial distribution characteristics among different counties were significantly heterogeneous from 2000 to 2020. Regional planners should pay more attention to the southeastern and western parts of the province. The resilience development in these regions is unbalanced and decoupled, but this situation is gradually improving. In addition, we observed a nonlinear negative relationship between county-level SR and ER that gradually became linear and predictable over time. It is worth noting that variables such as total agricultural output value, annual precipitation and rural labor force ratio have a strong impact on CCD SER , and the spatial heterogeneity is significant. In view of this, this paper analyzes the county problems of different coupling types and proposes scientific countermeasures to enhance SER and promote sustainable development. This study fills the gap in local SER research strategies, and the constructed framework helps to understand resilience research from the perspective of SES theory.
Supplemental Material
sj-docx-1-tee-10.1177_2754124X251349303 – Supplemental material for Understanding resilience from the perspective of social-ecological system coupling: Dynamic evolution, nonlinear changes and influencing factors
Supplemental material, sj-docx-1-tee-10.1177_2754124X251349303 for Understanding resilience from the perspective of social-ecological system coupling: Dynamic evolution, nonlinear changes and influencing factors by Shaodong Qu, Jiangbo Gao, Lunche Wang, Yibo Zhang and Fengxian Huang in Transactions in Earth, Environment, and Sustainability
Footnotes
Acknowledgements
The authors appreciate the constructive suggestions provided by the anonymous reviewers and editors, which have significantly improved the quality of this paper.
Contribution list
Declaration of conflicting interests
The author(s) declared no potential conflicts of interest with respect to the research, authorship, and/or publication of this article.
Funding
The author(s) disclosed receipt of the following financial support for the research, authorship, and/or publication of this article: This work was supported by the National Natural Science Foundation of China (Grant No.42371117, 42071288).
Data availability
The datasets generated or analyzed during this study are available from the corresponding author on reasonable request.
Supplemental material
Supplemental material for this article is available online.
Author biographies
References
Supplementary Material
Please find the following supplemental material available below.
For Open Access articles published under a Creative Commons License, all supplemental material carries the same license as the article it is associated with.
For non-Open Access articles published, all supplemental material carries a non-exclusive license, and permission requests for re-use of supplemental material or any part of supplemental material shall be sent directly to the copyright owner as specified in the copyright notice associated with the article.