
Abstract
In the context of global climate change and intensifying human activities, effective management of urban ecosystem services (ESs) is crucial for achieving sustainable development goals. Urbanization-induced land use change and climate change are two primary drivers altering UESs. However, previous studies have predominantly focused on historical urban expansion and climate change effects on UESs, leaving future evolution scenarios and their relative impacts underexplored. This study investigates the Pearl River Delta urban agglomeration as a case study area, examining the relative impacts of land use and climate change on five UESs: water yield (WY), soil conservation (SC), water purification (WP), urban flood risk mitigation (FM), and urban cooling (UC). The results revealed that all five ecosystem services exhibited high values in the peri-urban areas and low values in the urban core of the Pearl River Delta. WY, FM, and UC showed an overall increasing trend, while SC and WP exhibited fluctuating trends from 1990 to 2050. Changes in SC were predominantly influenced by climate change, accounting for 76.24% of the total area, whereas WY, WP, FM, and UC services were primarily affected by land use change, accounting for over 67.16% of the area. In the future scenarios of 2035 and 2050, the impact of climate change on soil conservation varied the most across different Shared Socio-economic Pathway (SSP) scenarios. The impact of land use change on WY, WP, FM, and UC exhibited the most significant differences across urban areas, indicating a high sensitivity of urbanization-induced ecosystem services to human disturbances.
Keywords
Introduction
Ecosystem services (ESs) provide a valuable framework for connecting human well-being with ecosystems in the study of social-ecological evolution (Fu et al., 2013). ESs are generated by ecosystem structures and processes (Daily, 1997) and encompass the natural conditions and resources essential for human survival (Heal, 2000). However, escalating demand for ESs and environmental changes are diminishing the capacity of ecosystems to supply these services. The Millennium Ecosystem Assessment (MEA, 2005) reported that 60% of ESs are significantly degraded globally, with projections indicating further severe deterioration by 2050. Therefore, it is imperative to monitor, forecast, and assess the spatiotemporal dynamics of ESs and to identify dominant factors to enhance ESs supply through effective ecosystem management. In large-scale urban agglomerations, ESs are provided by natural or semi-natural spaces within urban areas. Urbanization significantly alters the patterns and processes of ecosystems (Liu et al., 2022). Understanding the spatiotemporal characteristics of urban ESs is fundamental for managing the complexity and spatial heterogeneity of ESs to maintain residents’ well-being (Xu et al., 2023).
ESs are influenced by a combination of natural environmental factors, human activities, and socio-economic drivers (Luo et al., 2020; Ma et al., 2022). Current research identifies land use and climate change as primary drivers of changes in ESs (Bai et al., 2019; Gao et al., 2019). Land use change directly modifies the biophysical properties of land surfaces, impacting the capacity of ecosystems to provide services. Land use dynamics can affect the resilience of various ESs (Foley et al., 2005) and alter the supply of ESs based on spatial patterns, types, and intensities of land use (Peng et al., 2020). For instance, land use patterns can influence nutrient cycling, raw material provisioning, and soil erosion (Lei et al., 2021; Tolessa et al., 2017). Farmland and urban expansion have been linked to biodiversity loss and declines in multiple ESs (Hanacek and Rodriguez-Labajos, 2018), while reforestation and grassland restoration can enhance overall ESs (Peng et al., 2024; Song et al., 2014; Yang et al., 2018). Wetland loss can disrupt hydrological regulation, compromising ecosystem resilience against extreme rainfall and increasing flood risks (Li et al., 2018; Rebelo et al., 2015). A global spatiotemporal assessment of changes in multiple ecosystem services under four IPCC SRES land-use scenarios found that converting forest, grassland, cropland, and urban areas to barren land can increase the provision of multiple ESs, highlighting the potential benefits of utilizing barren land (Sun and Shi, 2020).
Climate change is another major factor affecting ESs, marked by significant long-term fluctuations that often result in predominantly negative consequences (Fu et al., 2017; Runting et al., 2017). Climate conditions influence ecosystem functions such as vegetation photosynthesis, physiological processes, and soil formation, thereby shaping the structure and distribution of ecosystems (Qiu et al., 2021). Future climates are projected to enhance certain ecosystem services while degrading others relative to their historic supply, with direct implications for human well-being (Scholes, 2016). Several studies indicate that the magnitudes and rates of climate change will lead to losses exceeding gains across a wide range of ecosystem services under different climate scenarios (Straffelini et al., 2024; Weiskopf et al., 2020). Therefore, it is crucial to spatially disentangle the effects of climatological and non-climatological drivers on the supply and trends of ecosystem services (Braun et al., 2019).
Additionally, the spatial differentiation of ESs serves as a crucial foundation for ecosystem management. Variations in natural contexts and socio-economic development levels can result in differing impacts of land use and climate change on ESs (Peng et al., 2020). Numerous studies have examined the effects of climate and land-use change on ESs (Paudyal et al., 2019; Pham et al., 2019). The interaction between land-use change and climate change is complex (Ouyang et al., 2021), and studies often explore the driving forces behind the spatial variation of ESs using spatial analysis or regression analysis (Oo et al., 2020; Xin et al., 2011). However, while most existing studies investigate the combined effects of land use and climate change on ESs, few have distinguished their independent impacts at regional scales through scenario analyses (Mendoza-Ponce et al., 2018). Moreover, despite research into their respective impacts on ESs, developing effective ecosystem management mechanisms to adapt to these rapid changes remains a significant challenge.
Urban agglomerations, as mature spatial forms, are complex regional ecosystems resulting from the integration of natural, social, and economic flows between cities (Chen and Chi, 2022; Shao et al., 2022). The ESs of these agglomerations often transcend administrative boundaries, necessitating a holistic approach that considers the coupling of ecosystem services both within and outside cities and across administrative regions (Li et al., 2022; Shao et al., 2022). In these regions, identified ecological securities and restored ecosystem services serve as critical strategies for restoration and management. The Pearl River Delta urban agglomeration area experiences high-intensity anthropogenic activities, and both climate and land use are expected to undergo significant changes, historically and in the future, according to scenario analyses. Therefore, it is essential to understand the driving mechanisms behind changes in ESs in this region. The research objectives were to explore the impacts of land use and climate changes on ESs from 1990 to 2035 and 2050 under RCPs-SSPs scenarios. The scenarios were designed to distinguish the relative contributions of land use and climate change on five typical urban ecosystem services: water yield (WY), soil conservation (SC), water purification (WP), urban flood risk mitigation (FM), and urban cooling (UC). We effectively separated the individual impacts of climate and land use through three contrast experiments: climate change only (CC), land-use change only (LUC), and both climate and land-use change (CC&LUC). Using scenario setting and contribution analysis methods, we assessed the relative impacts of land use and climate change on ecosystems from a geospatial perspective.
Materials and methods
Study area
The Pearl River Delta urban agglomeration (PRD) is located in the south-central part of Guangdong Province, covering an area of approximately 42,000 km² and encompassing nine cities: Guangzhou, Shenzhen, Dongguan, Foshan, Zhongshan, Huizhou, Zhuhai, Jiangmen, and Zhaoqing (Figure 1) . From 1988 to 2010, the average annual growth rate of built-up land in the PRD reached 7.57%. Presently, the PRD continues to experience high-intensity expansion and development, making it a region marked by substantial interactions between human activities and the natural environment.
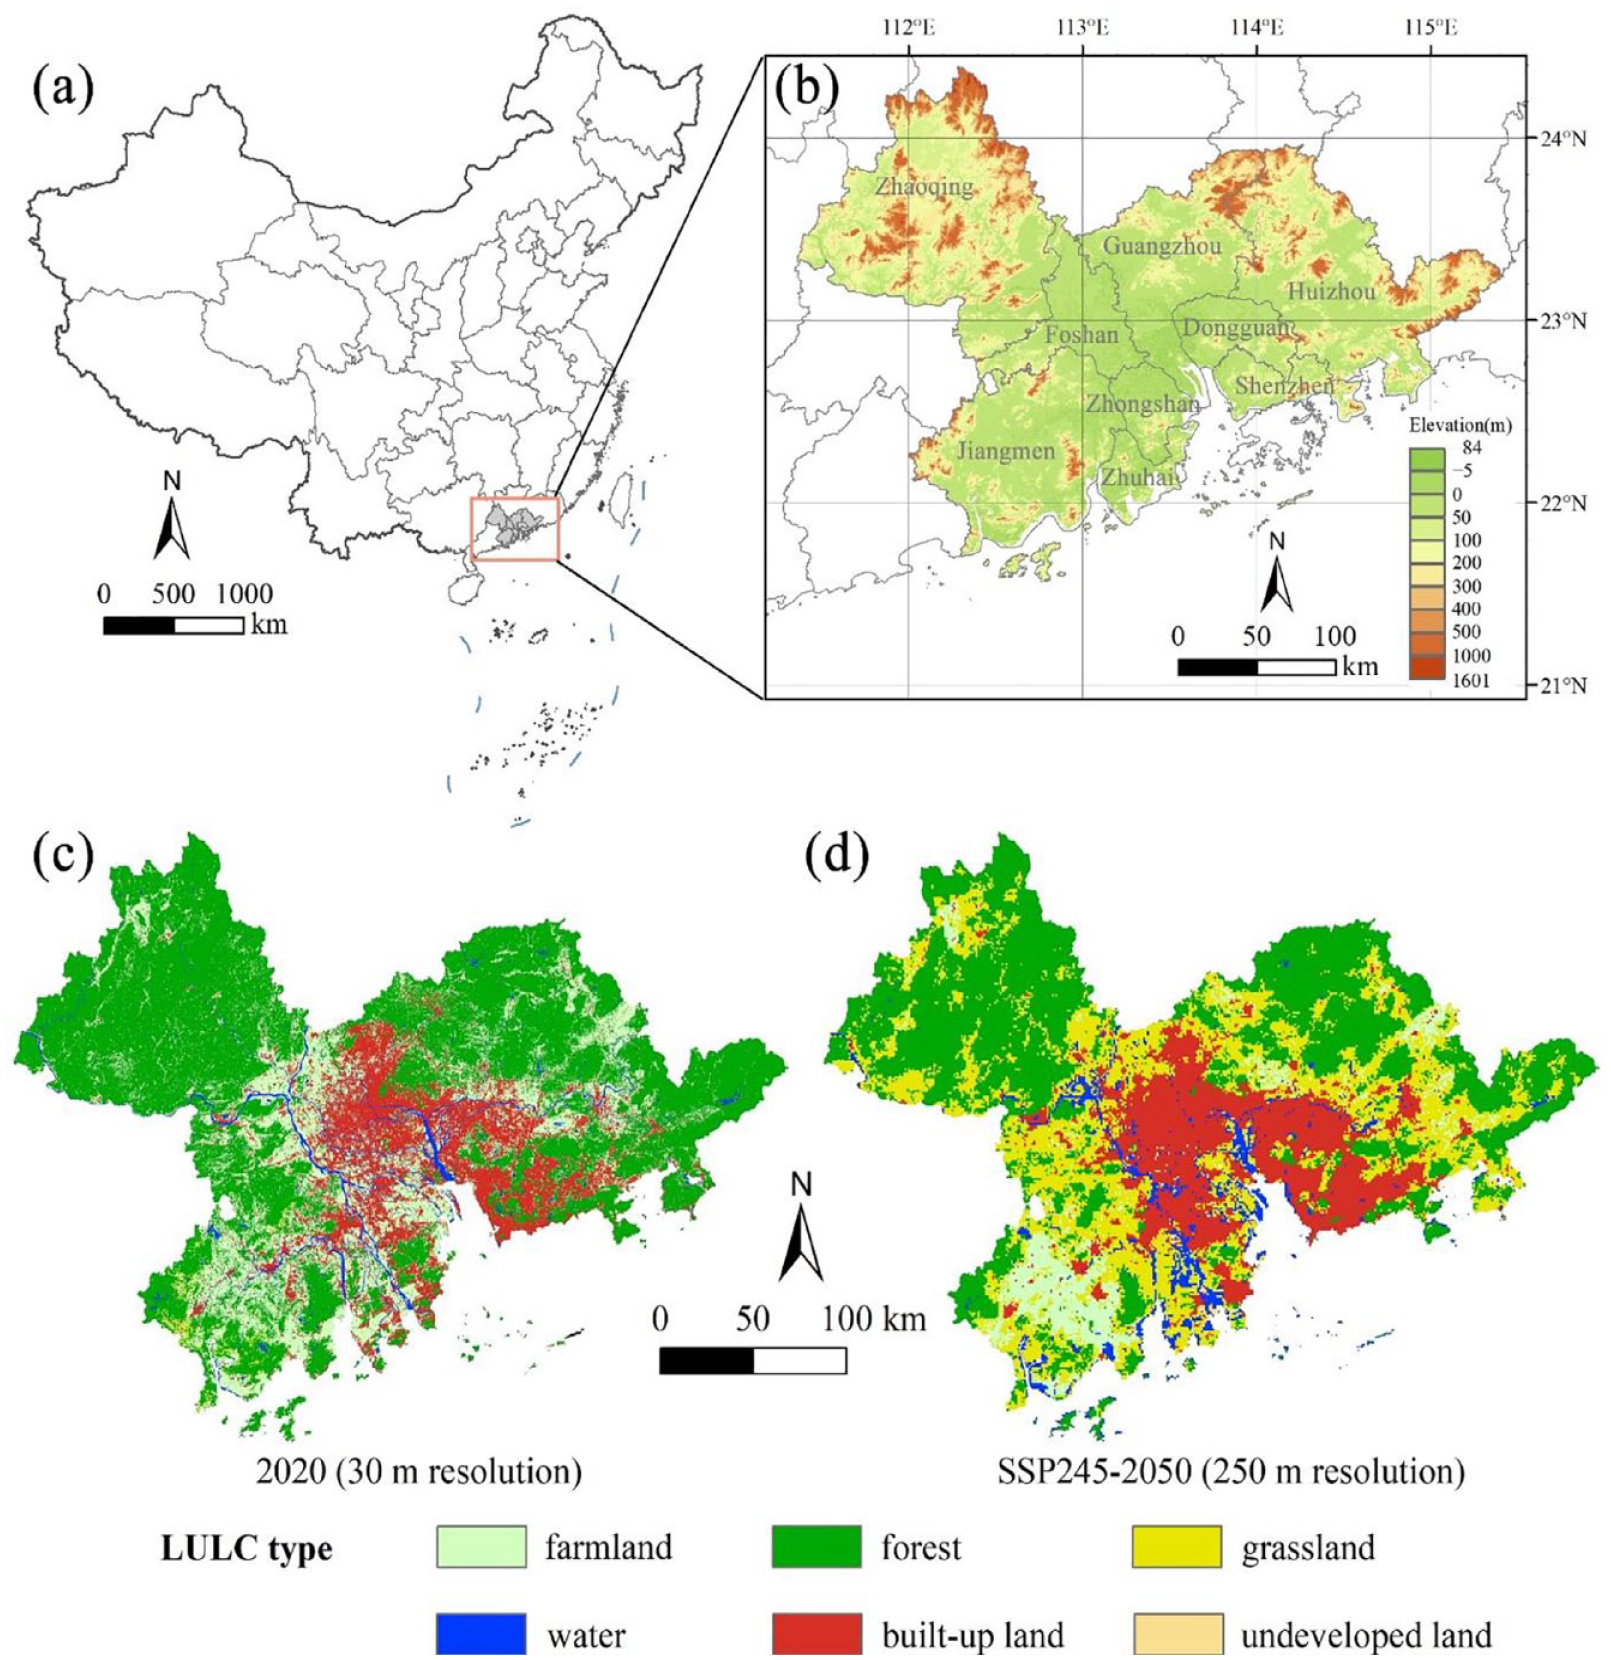
The study area: (a) location; (b) DEM; (c) historical land use/land cover map of 2020; and (d) representative future land use/land cover map under SSP-245 scenario of 2050.
Data sources
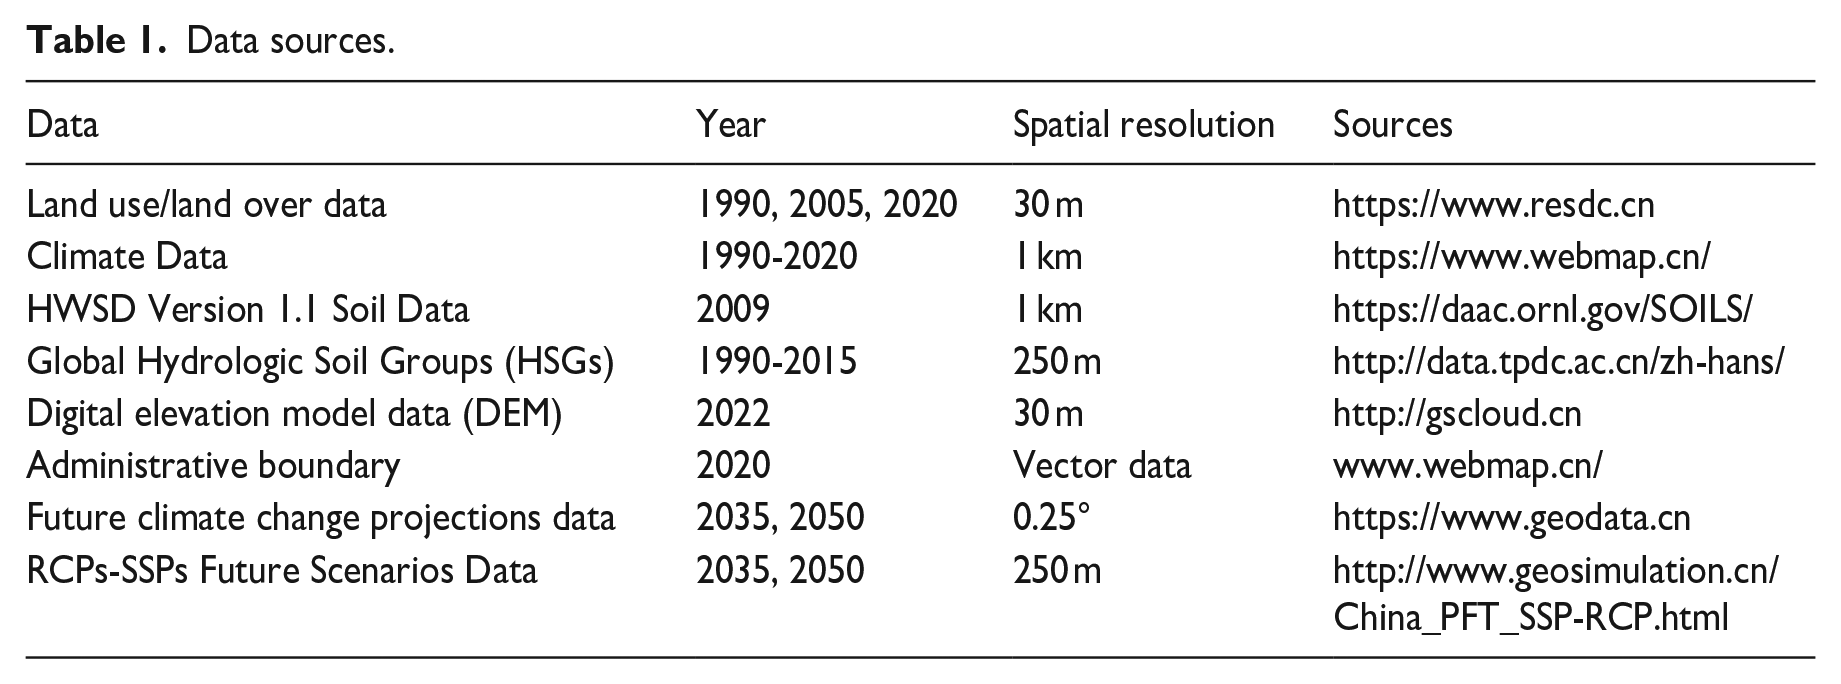
The data sources used in this study are as follows. (1) The historical land use/land cover (LULC) data of 1990, 2005, 2020 has a spatial resolution of 30 m. These LULC types are farmland, forest, grassland, built-up land, water, and undeveloped land with resampling the spatial resolution to 250 m. (2) Monthly data on rainfall, average temperature, and potential evapotranspiration were used to assess WY, WP, FM, and UC with a spatial resolution of 1 km. (3) Soil texture data (including measurements of sand, silt, clay, and organic carbon content) were used to calculate WY and SC. (4) The soil hydrological group data were utilized to estimate the FM with a spatial resolution of 250 m. (5) The Digital elevation model data (DEM) is employed for the calculation of SC and WP with a spatial resolution of 30 m. (6) The administrative boundary of the PRD was used to map the boundary. (7) The future periods LULC data of 2035 are obtained from data products (Liao et al., 2020), with a spatial resolution of 1 km. (8) The future climate change projections data based on a combination of shared socio-economic pathways (SSPs) and radiative forcing emission typical concentration pathways (RCPs) (Tang et al., 2023) were used to represent the future climate parameter input to InVEST model. The SSP-RCP scenarios provide a new approach for modeling ecosystem services under the coupled effects of land use and climate change (Yang et al., 2022). All data sources are listed in Table 1.
Data sources.
ESs quantification
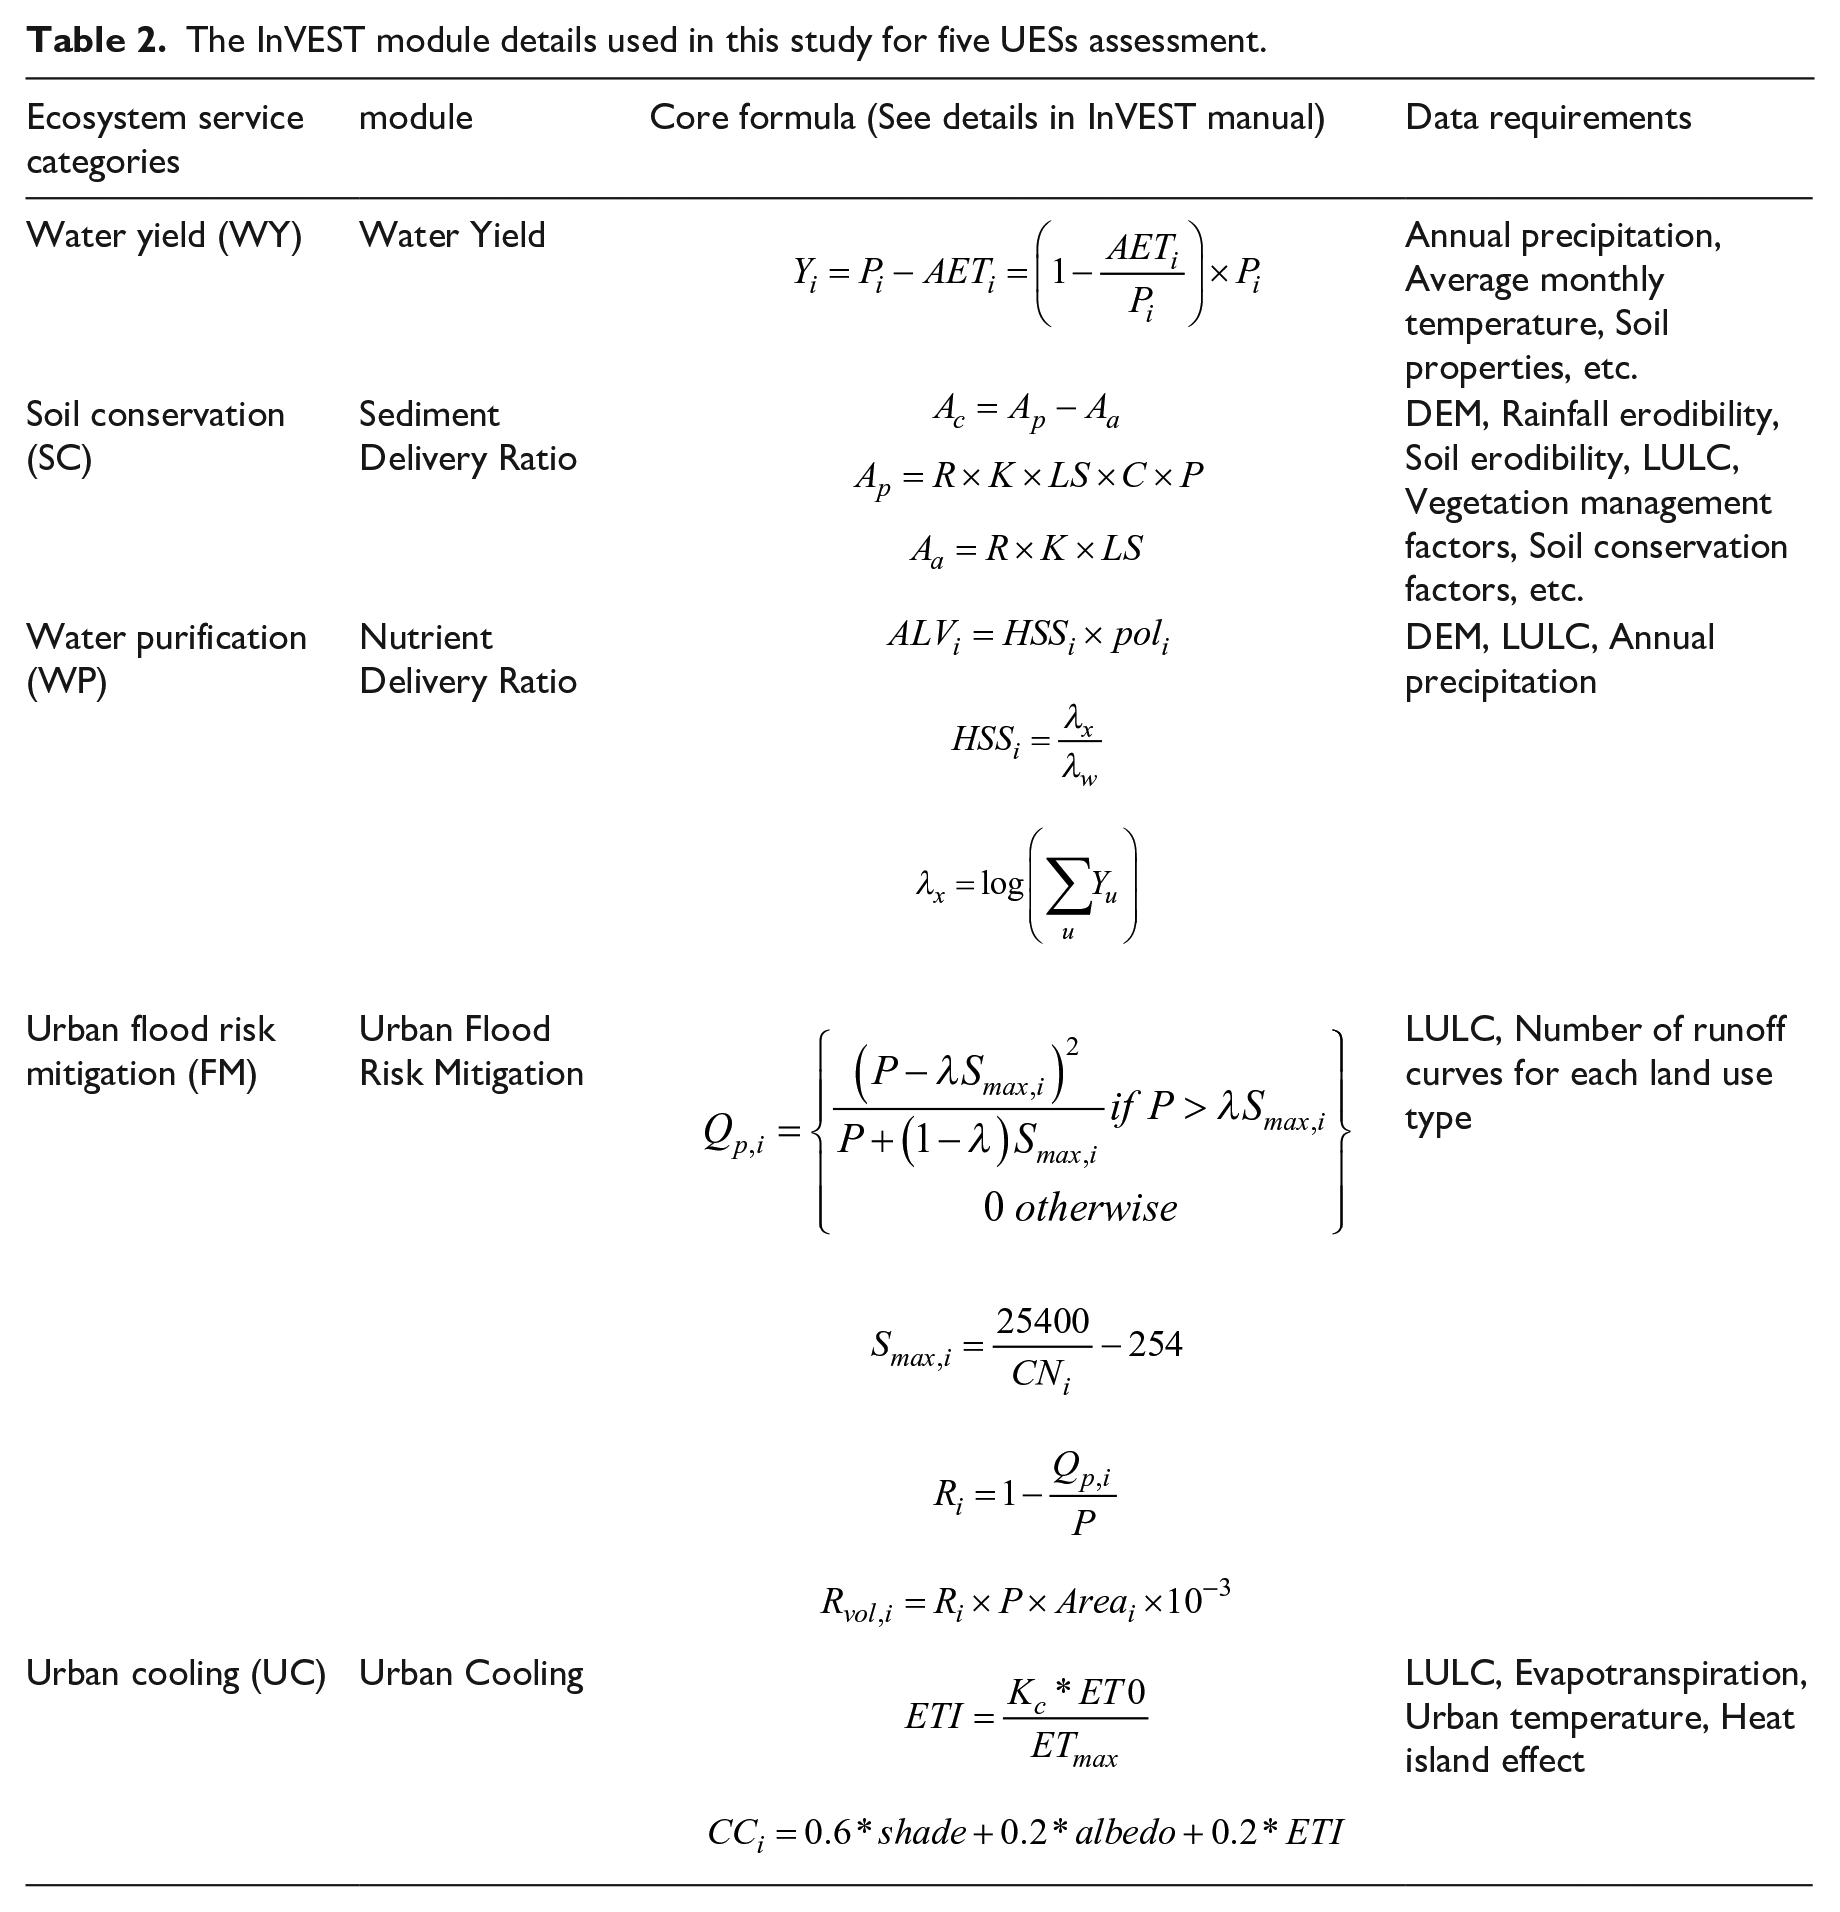
Based on the four categories of ecosystem services (ESs) defined by the Millennium Ecosystem Assessment, this study focuses on water yield, soil conservation, water purification, urban flood risk mitigation, and urban cooling, which represent supporting, regulating, and provisioning services. The InVEST model was employed to rapidly assess these five urban ecosystem services from 1990 to 2050 at 15-year intervals and under three RCP-SSP scenarios for the stages of 2035 and 2050. All the modules and core formulas used in the InVEST model are listed in Table 2.
The InVEST module details used in this study for five UESs assessment.
Dominant factors identification
ES value standardization
We used a normalized method to reproduce the data in standardization as the follow formula:
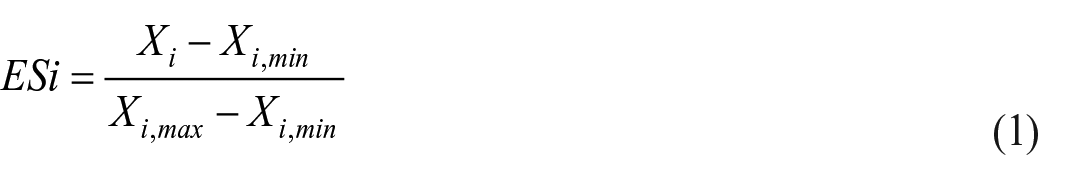
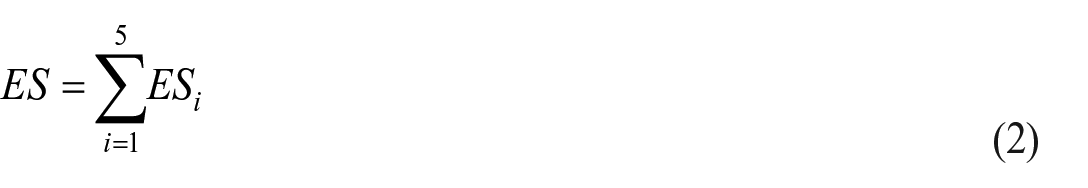
Where,
Scenarios settings
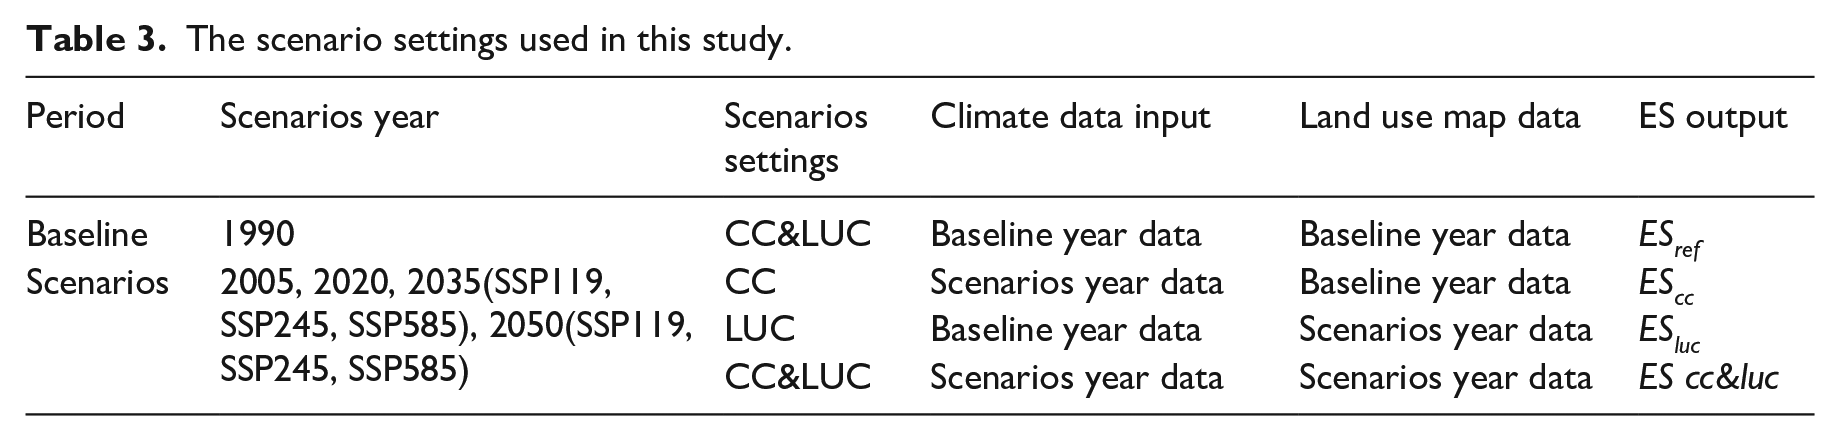
The year 1990 is selected as the baseline scenario. Hypothetical scenarios are constructed based on data from 2005, 2020, 2035, and 2050 (Table 3). Scenario analysis is employed to separate the impacts of land use and climate change on ecosystem services (ESs) into three components: the separate impact of climate change, the separate impact of land use change, and the combined impact of both (Hicke et al., 2004). The scenarios are defined as follows: (1) Climate Change Scenario (CC): This scenario assumes that only the climate changes, while land use remains constant at the baseline year’s levels. Thus, changes in ESs are solely attributed to climate factors. (2) Use Change Scenario (LUC): This scenario assumes that only land use changes, while the climate remains constant at the baseline year’s levels. Therefore, changes in ESs are solely attributed to land use changes. (3) Combined Change Scenario (CC & LUC): This scenario reflects the actual conditions in a given year, considering both land use and climate factors. These scenarios enable the isolation and comparison of the individual and combined effects of climate and land use change on ESs.
The scenario settings used in this study.
Dominant factors calculation
Relative contribution index (RCI) and combine effect index (CEI) were used to quantify the relative contribution and combine impact of land use and climate change on ecosystem services (Daneshi et al., 2021; Peng et al., 2020). The formulas are as follows:


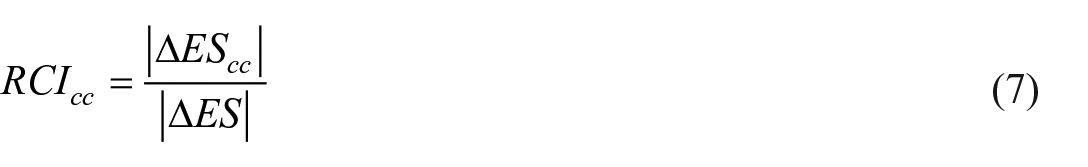
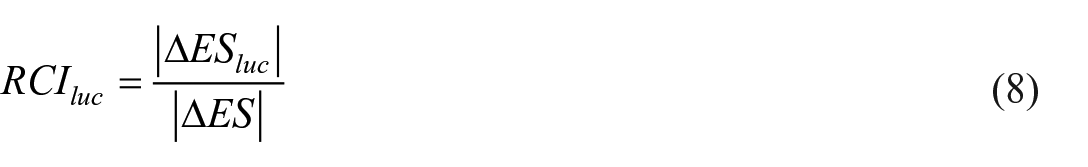
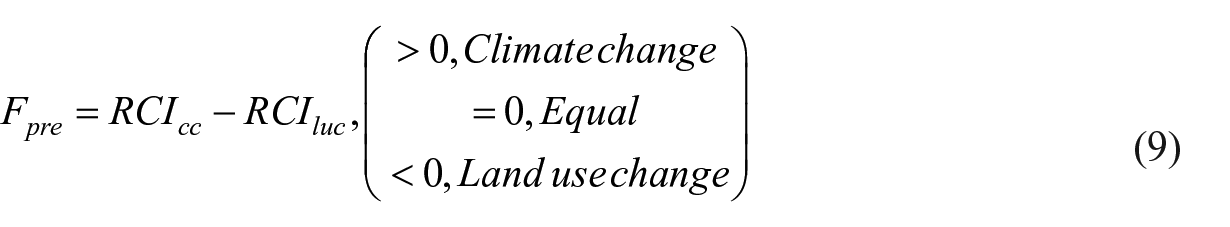
Where
To further explore the dominant role of the two driving forces in the combined impact on ecosystem service changes (inhibition effect/synergistic effect) and to quantify the corresponding impact degree, this study utilizes the combined impact index, as expressed:
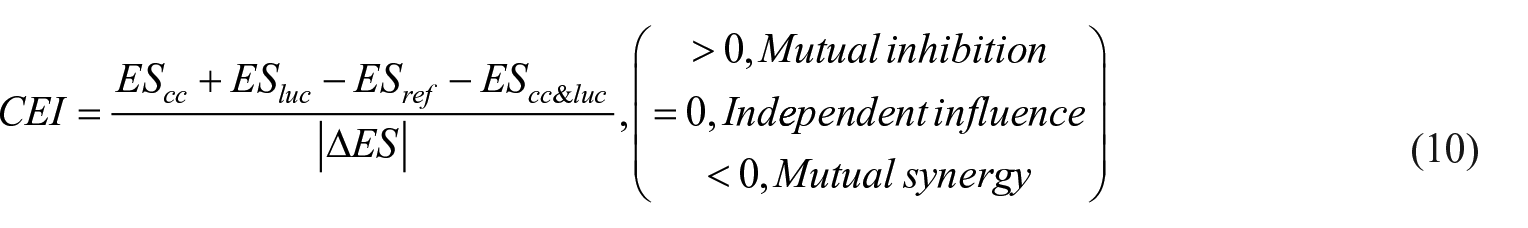
Where
Results
Historical and future changes in ESs under different scenarios
The five ESs showed different spatial patterns and temporal dynamics (Figures 2–4), due to the influence of natural and land use factors. The results revealed that all five ecosystem services exhibited high values in the peri-urban areas and low values in the urban core of the Pearl River Delta. WY, FM, and UC showed an overall increasing trend, while SC and WP exhibited fluctuating trends from 1990 to 2050.
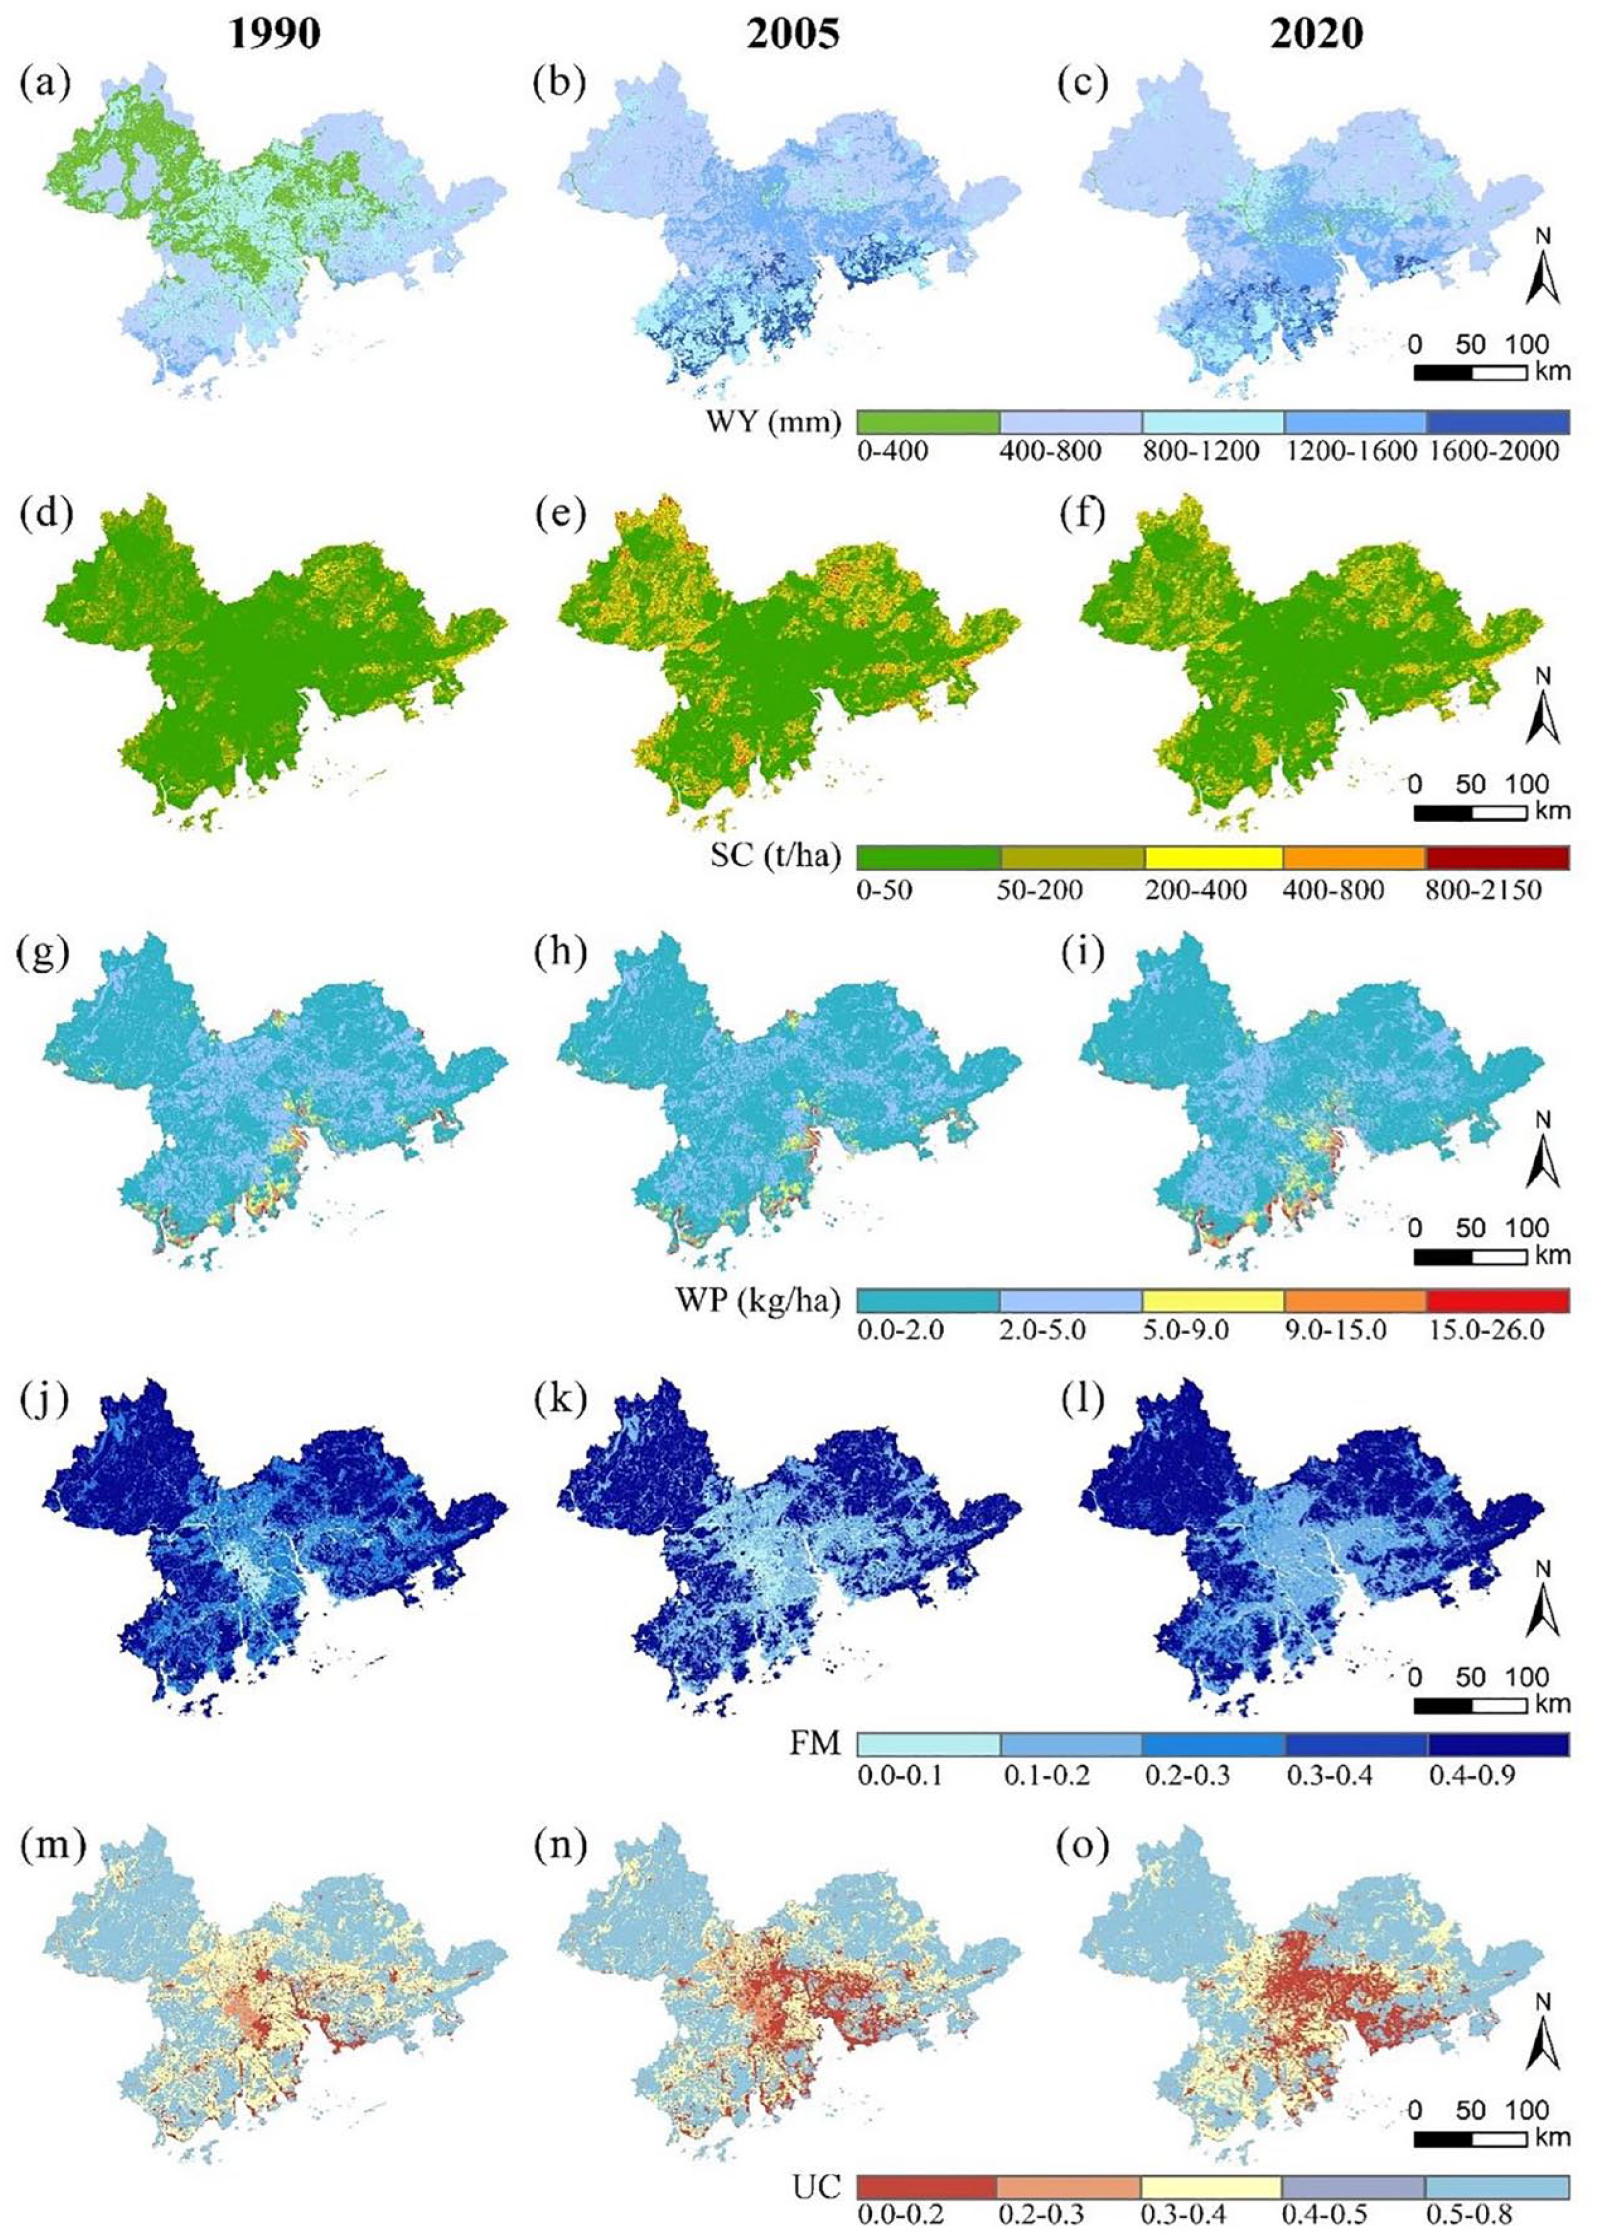
Spatial patterns of five ESs during 1990-2020: (a) Water yield in 1990; (b)water yield in 2005; (c)water yield in 2020; (d) soil conservation in 1990; (e) soil conservation in 2005; (f) soil conservation in 2020; (g) Water purification in 1990; (h) Water purification in 2005; (i) Water purification in 2020; (j) urban flood risk mitigation in 1990; (k) urban flood risk mitigation in 2005; (l) urban flood risk mitigation in 2020; (m) urban cooling in 1990; (n) urban cooling in 2005; and (o) urban cooling in 2020.
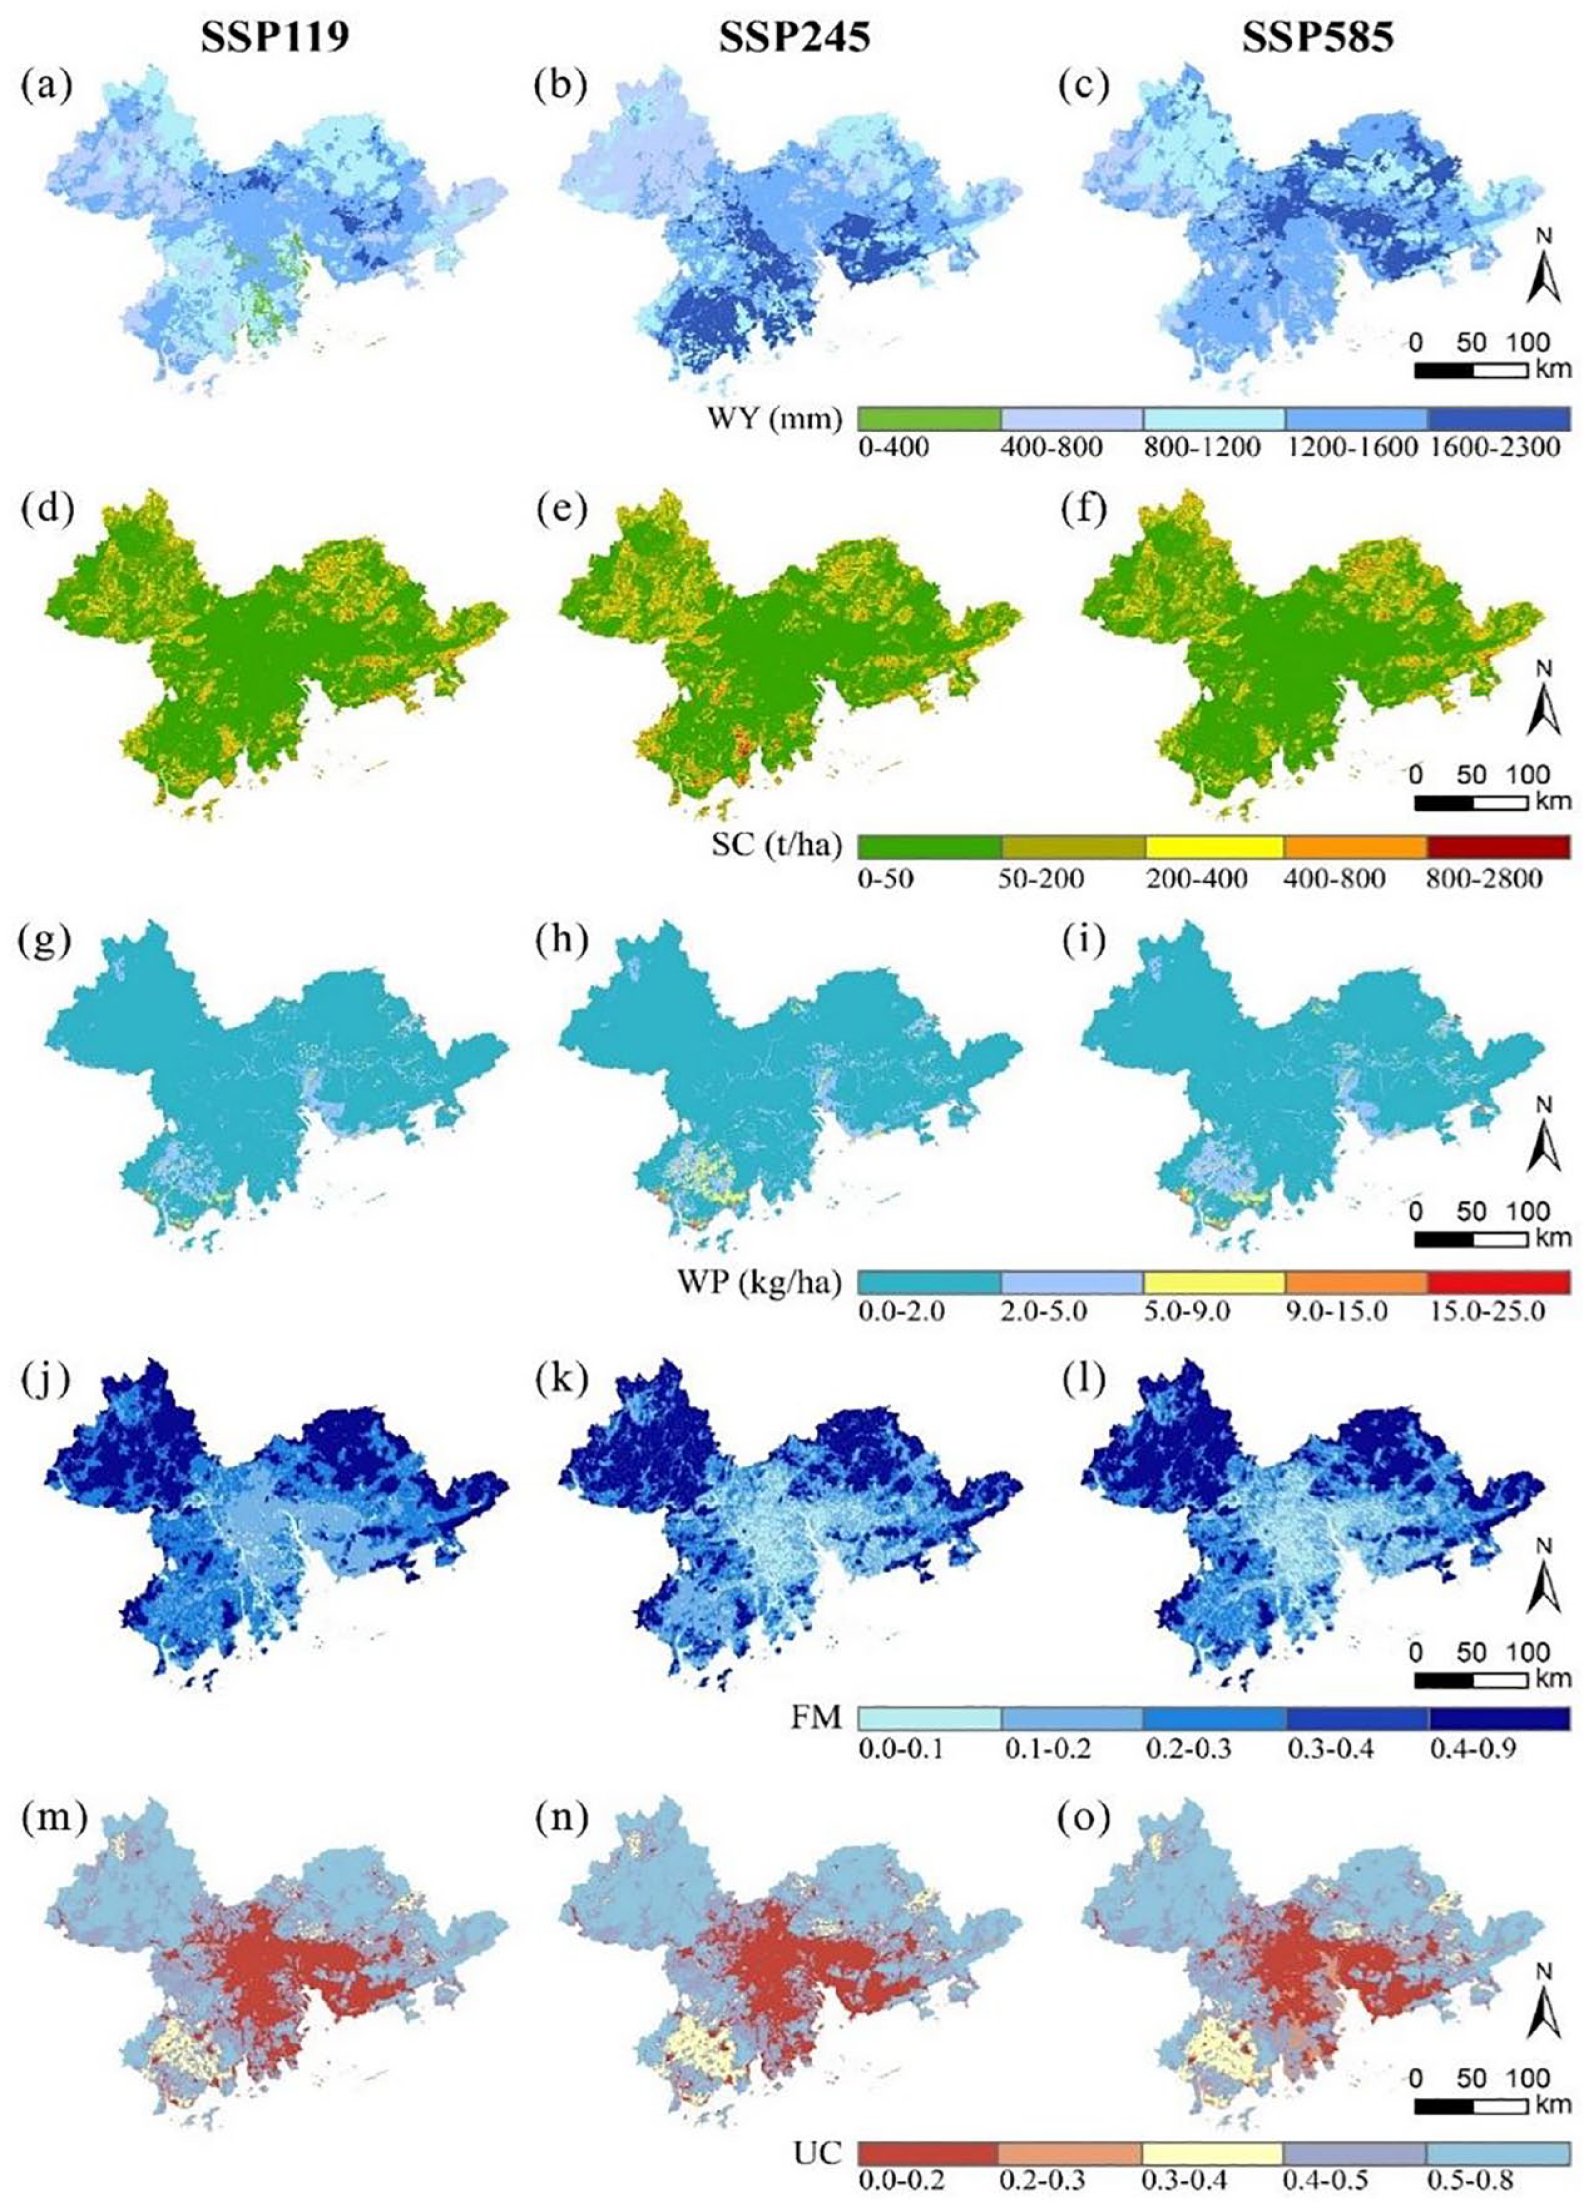
Spatial patterns of five ESs under different scenarios in 2035: (a) Water yield under SSP119; (b)water yield under SSP245; (c)water yield under SSP585; (d) soil conservation under SSP119; (e) soil conservation under SSP245; (f) soil conservation under SSP585; (g) Water purification under SSP119; (h) Water purification under SSP245; (i) Water purification under SSP585; (j) urban flood risk mitigation under SSP119; (k) urban flood risk mitigation under SSP245; (l) urban flood risk mitigation under SSP585; (m) urban cooling under SSP119; (n) urban cooling under SSP245; and (o) urban cooling under SSP585..
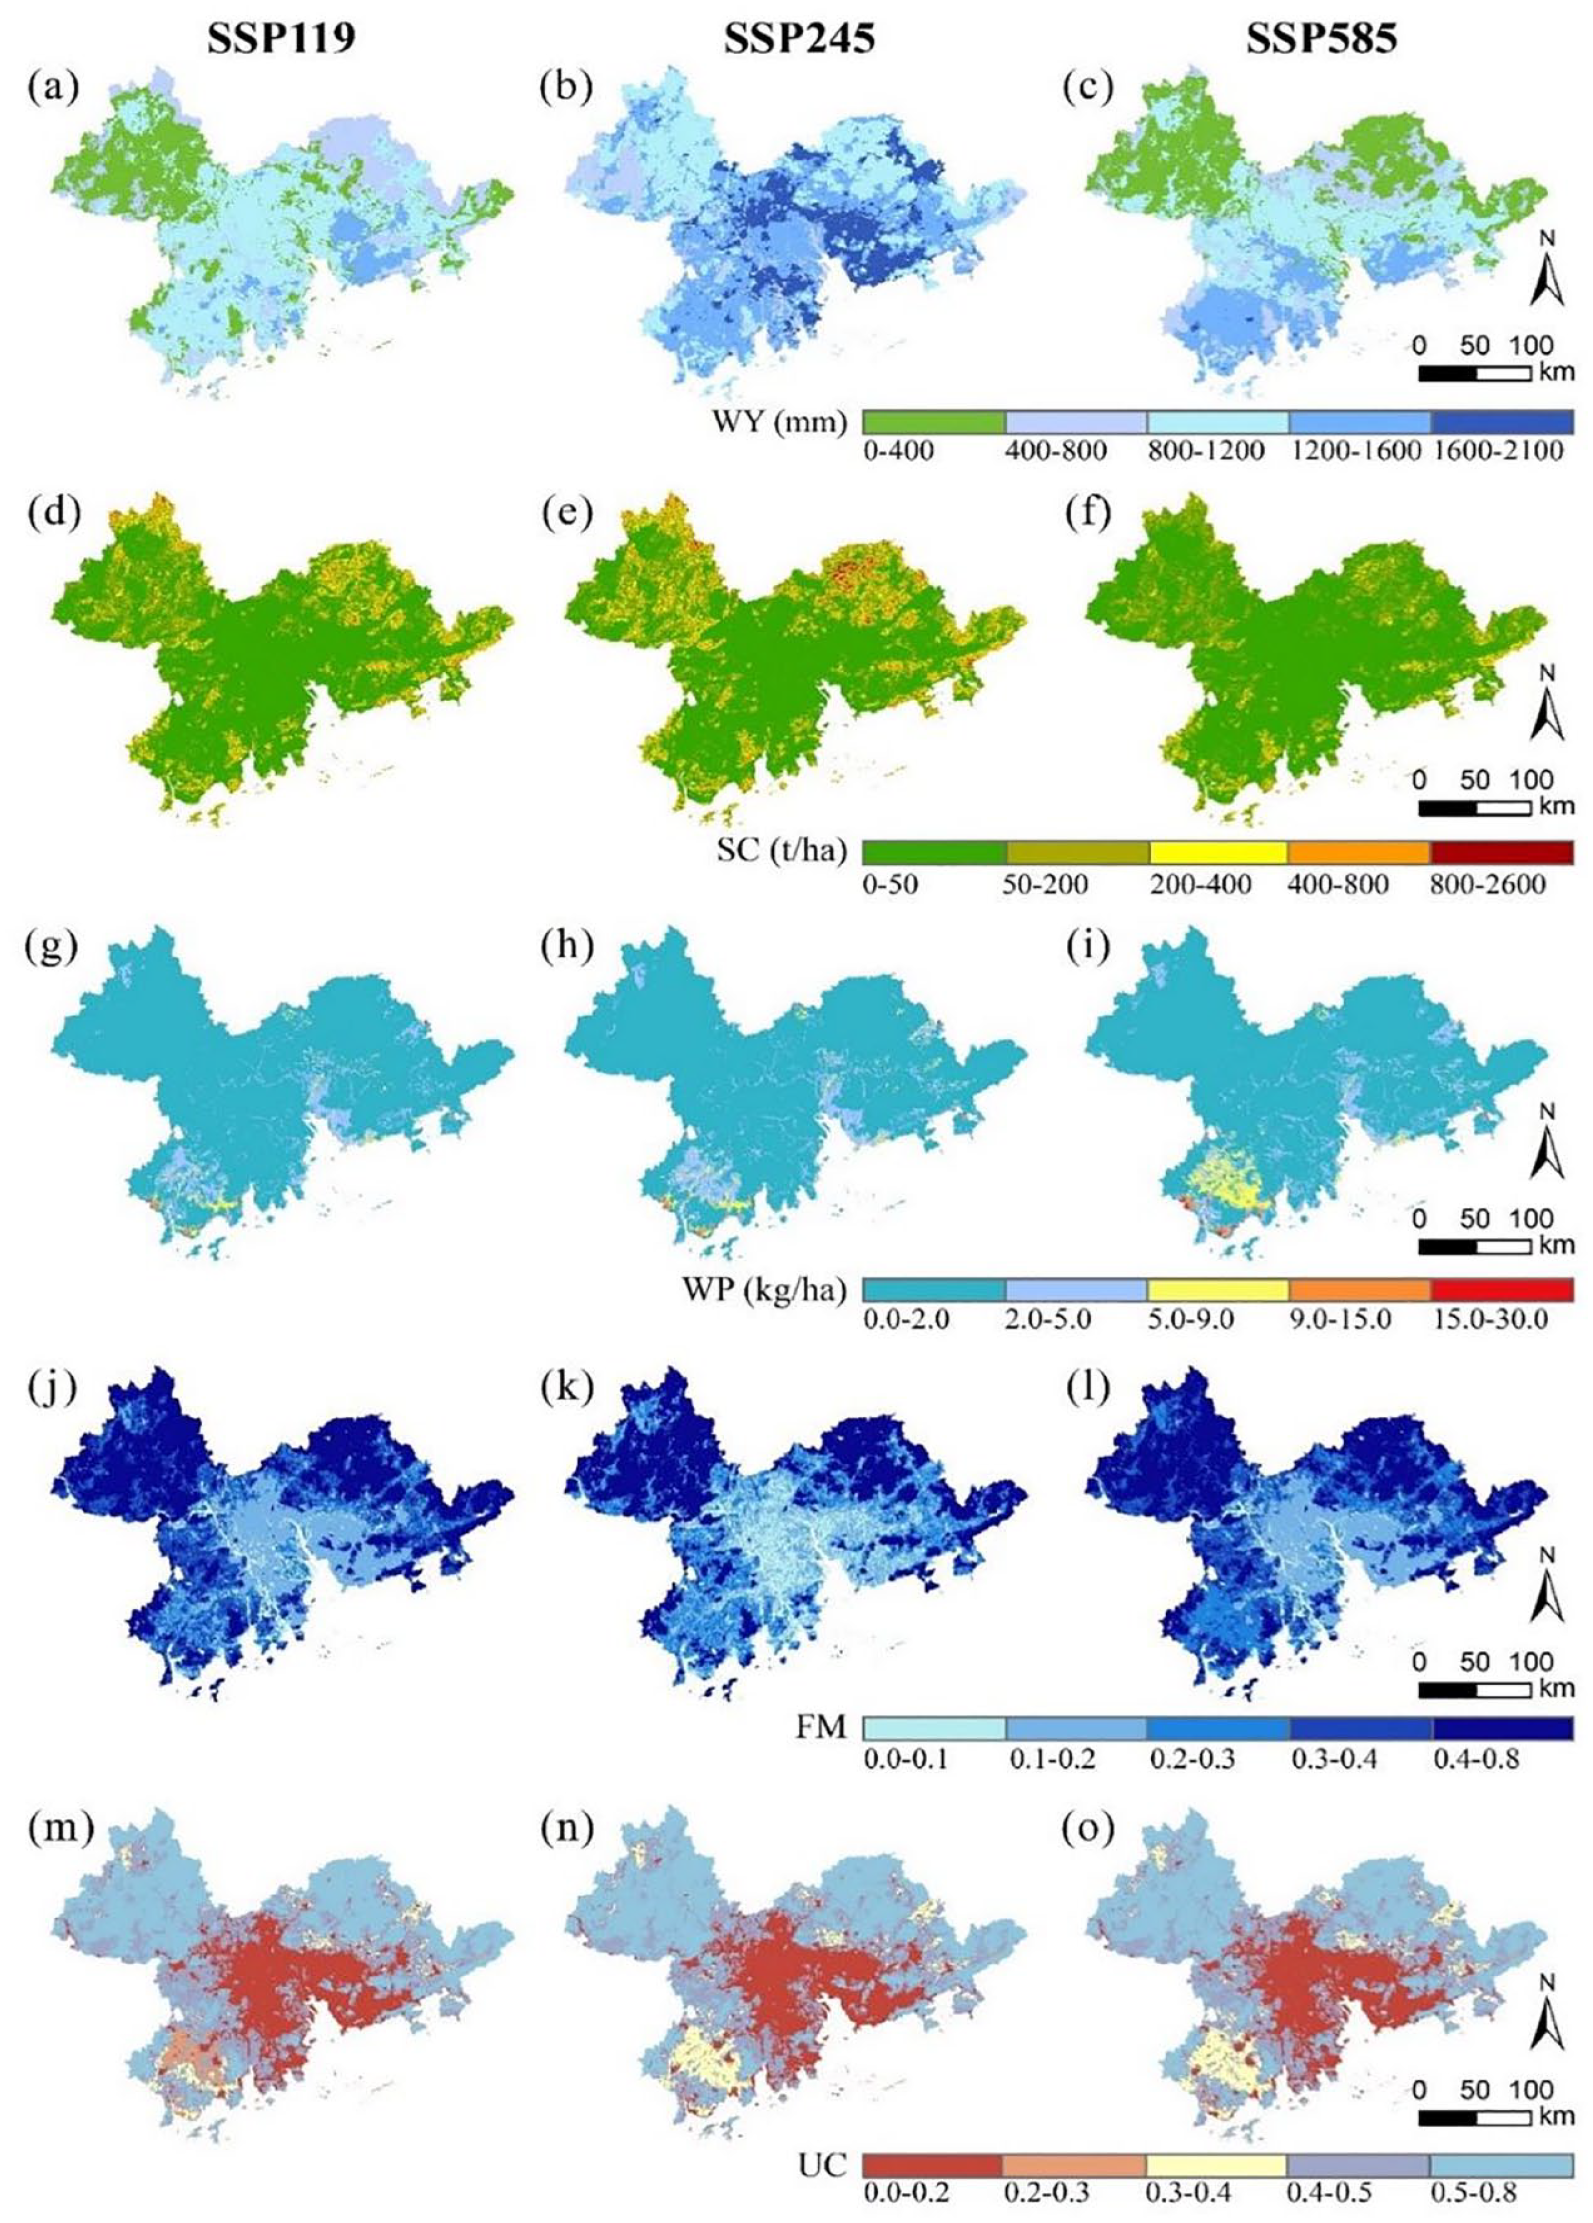
Spatial patterns of five ESs under different scenarios in 2050: (a) Water yield under SSP119; (b)water yield under SSP245; (c)water yield under SSP585; (d) soil conservation under SSP119; (e) soil conservation under SSP245; (f) soil conservation under SSP585; (g) Water purification under SSP119; (h) Water purification under SSP245; (i) Water purification under SSP585; (j) urban flood risk mitigation under SSP119; (k) urban flood risk mitigation under SSP245; (l) urban flood risk mitigation under SSP585; (m) urban cooling under SSP119; (n) urban cooling under SSP245; and (o) urban cooling under SSP585.
From 1990 to 2020, the water yield in the Pearl River Delta (PRD) showed a slight increasing trend, rising from 652.28 mm in 1990 to 964.83 mm in 2005, and then decreasing to 894.63 mm in 2020 (Figure 2a). Under the SSP119, SSP245, and SSP585 scenarios, this trend is projected to continue, with an average of 1180.17 mm in 2035 and 912.03 mm in 2050(Figures 3a and 4a). The future water yield (2035-2050) will be 208.85 mm higher on average across these scenarios compared to the historical period (1990-2020). The SSP245 scenario predicts the highest water yield, with an average of 1215.54 mm (Figure 5a).
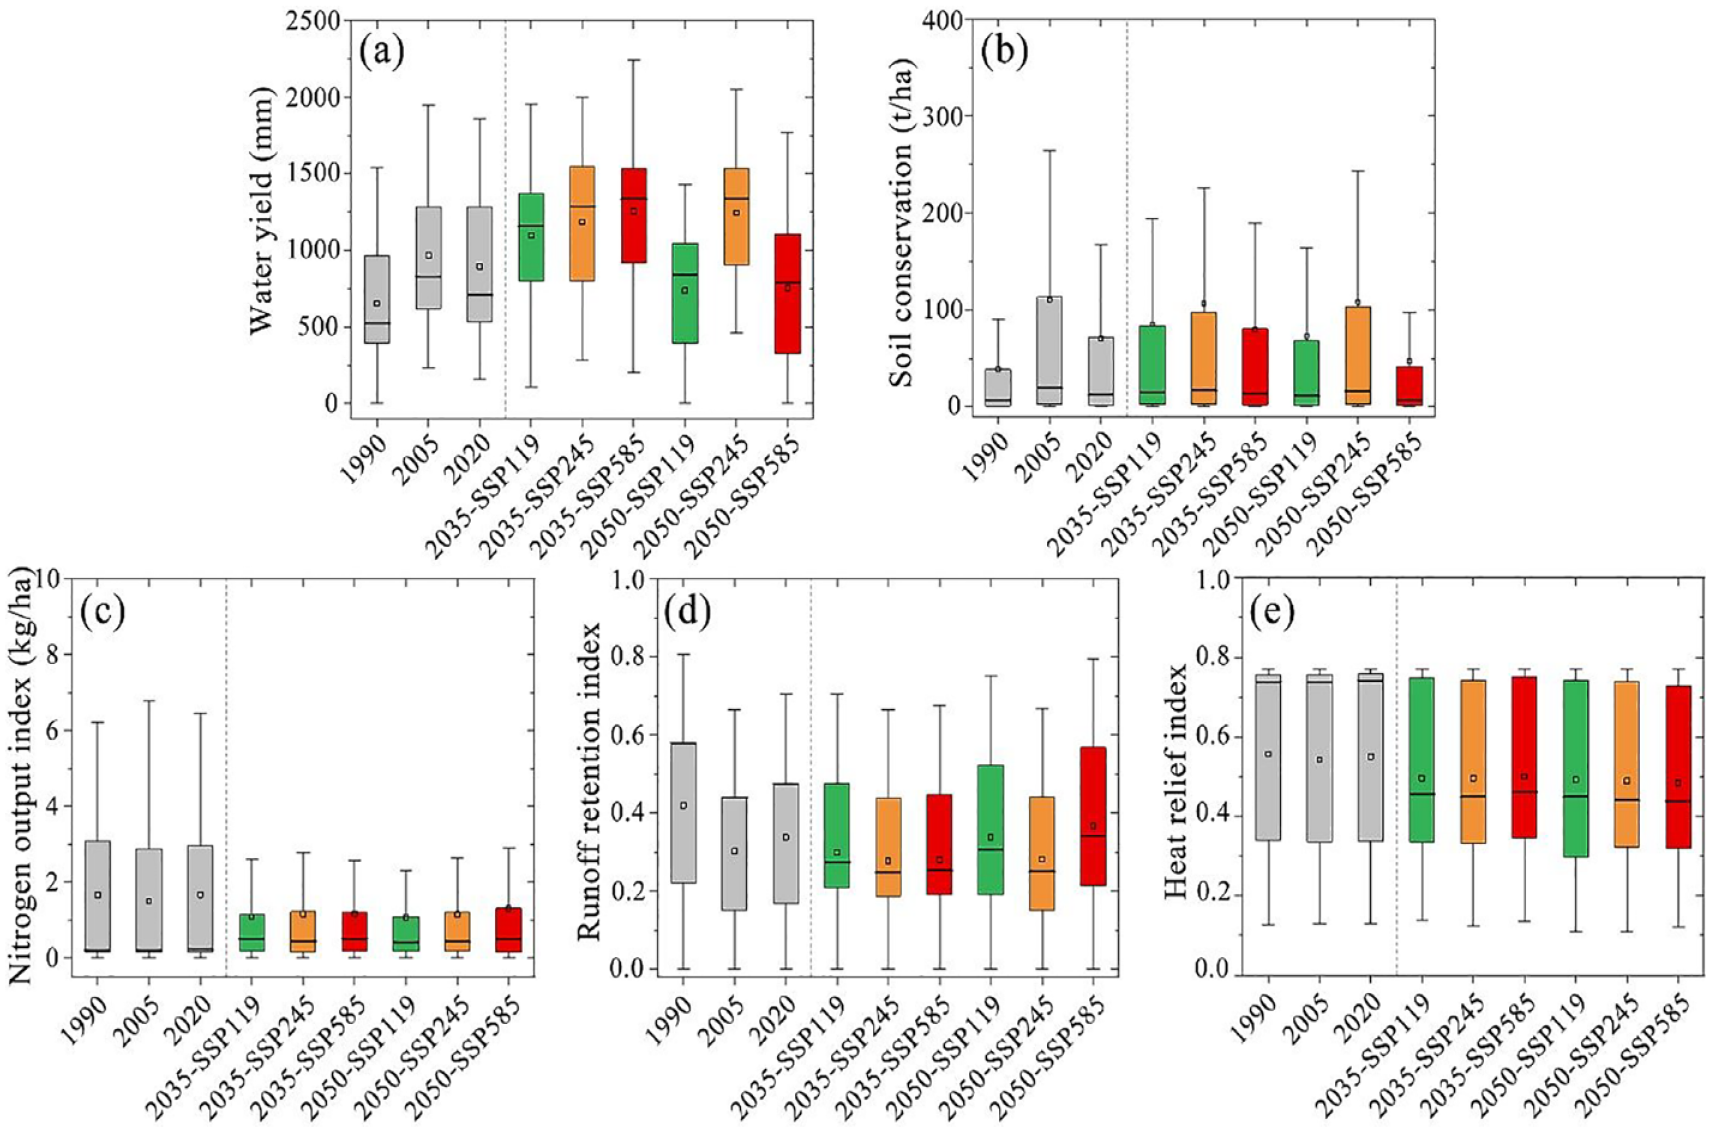
The variation boxplot of ESs change during 1990-2050: (a) Water yield; (b) soil conservation; (c) water purification; (d) urban flood risk mitigation; and (e)urban cooling.
Soil conservation in the PRD increased from 33 t/ha in 1990 to 95.52 t/ha in 2005, before decreasing to 60.95 t/ha in 2020 (Figure 5b). Under the SSP119, SSP245, and SSP585 scenarios, soil conservation is expected to increase to 72.14 t/ha, 85.56 t/ha, and 69.56 t/ha in 2035, and 60.83 t/ha, 89.74 t/ha, and 36.99 t/ha in 2050, respectively. Soil conservation services are generally higher in 2035 than in 2050. Spatially, low-value areas are concentrated in the central region, while higher-value areas are found in Zhaoqing and the northern regions between Guangzhou and Huizhou, which are predominantly forested and have significant terrain variations. The SSP245 scenario will produce the highest soil conservation service, while the SSP585 scenario will yield the lowest.
Water purification, represented by the nitrogen output index, shows that higher nitrogen output per unit area indicates lower purification capacity. From 1990 to 2020, nitrogen output per unit area in the PRD experienced a minor decrease followed by an increase (Figure 5c). Average values were 1.52 kg/ha in 1990, 1.35 kg/ha in 2005, and 1.53 kg/ha in 2020. Under the SSP119, SSP245, and SSP585 scenarios, these values range from 0.91 to 1.0 kg/ha in 2035 and 0.91 to 1.12 kg/ha in 2050. Water purification services are lower in central areas, which are important for peri-urban agriculture and urban development, and higher in the forested northwest and northeast regions. The spatial pattern is distinctly varied, with higher levels in the central and southern parts and lower levels in the northwest and northeast (Figure 2g–i).
Urban flood risk mitigation services in the PRD are relatively low. The mean runoff retention index was 0.42 in 1990, 0.30 in 2005, and 0.34 in 2020. Under future RCPs-SSPs scenarios, this index stabilizes, ranging from 0.27 to 0.36 (Figure 5d).
The heat relief index was used to assess urban cooling services. From 1990 to 2020, cooling services were moderate, showing a slight decline (Figure 5e). The cooling capacity in the highly urbanized central region weakened in 2005 and 2020 compared to 1990. Forests demonstrated a strong cooling effect, with values up to 0.7, and grasslands around 0.52. Between 2035 and 2050, cooling services in PRD cities slightly decreased, with averages of 0.50 and 0.49.
Dominant factors of ESs change
Comparisons of five ecosystem services from 2005 to 2050 under various scenarios, against the baseline year of 1990, reveal that climate change predominantly influenced soil conservation (SC), contributing over 76.24% and showing a slight decline from 2005 to 2050 (Figure 6b). Land use change was the primary driver for water yield (WY), water purification (WP), flood mitigation (FM), and urban cooling (UC), with an average contribution exceeding 67.16% from 2005 to 2050 (Figure 6a, c–e). The contribution rates for WY and FM fluctuated, while WP tended to stabilize. The contribution of land use change to UC increased and then decreased, while the opposite was true for climate change. UC significantly increased between 2005 and 2050. In future scenarios, dominant factors will positively impact WY under SSP119, while SC and WP will be significantly affected under SSP245. FM and UC will face negative impacts under SSP585. Spatial variations in dominance by land use and climate change are evident, especially in the central PRD. Areas mainly influenced by land use change are located in the southwest, while those affected by climate change are in the east of the PRD.
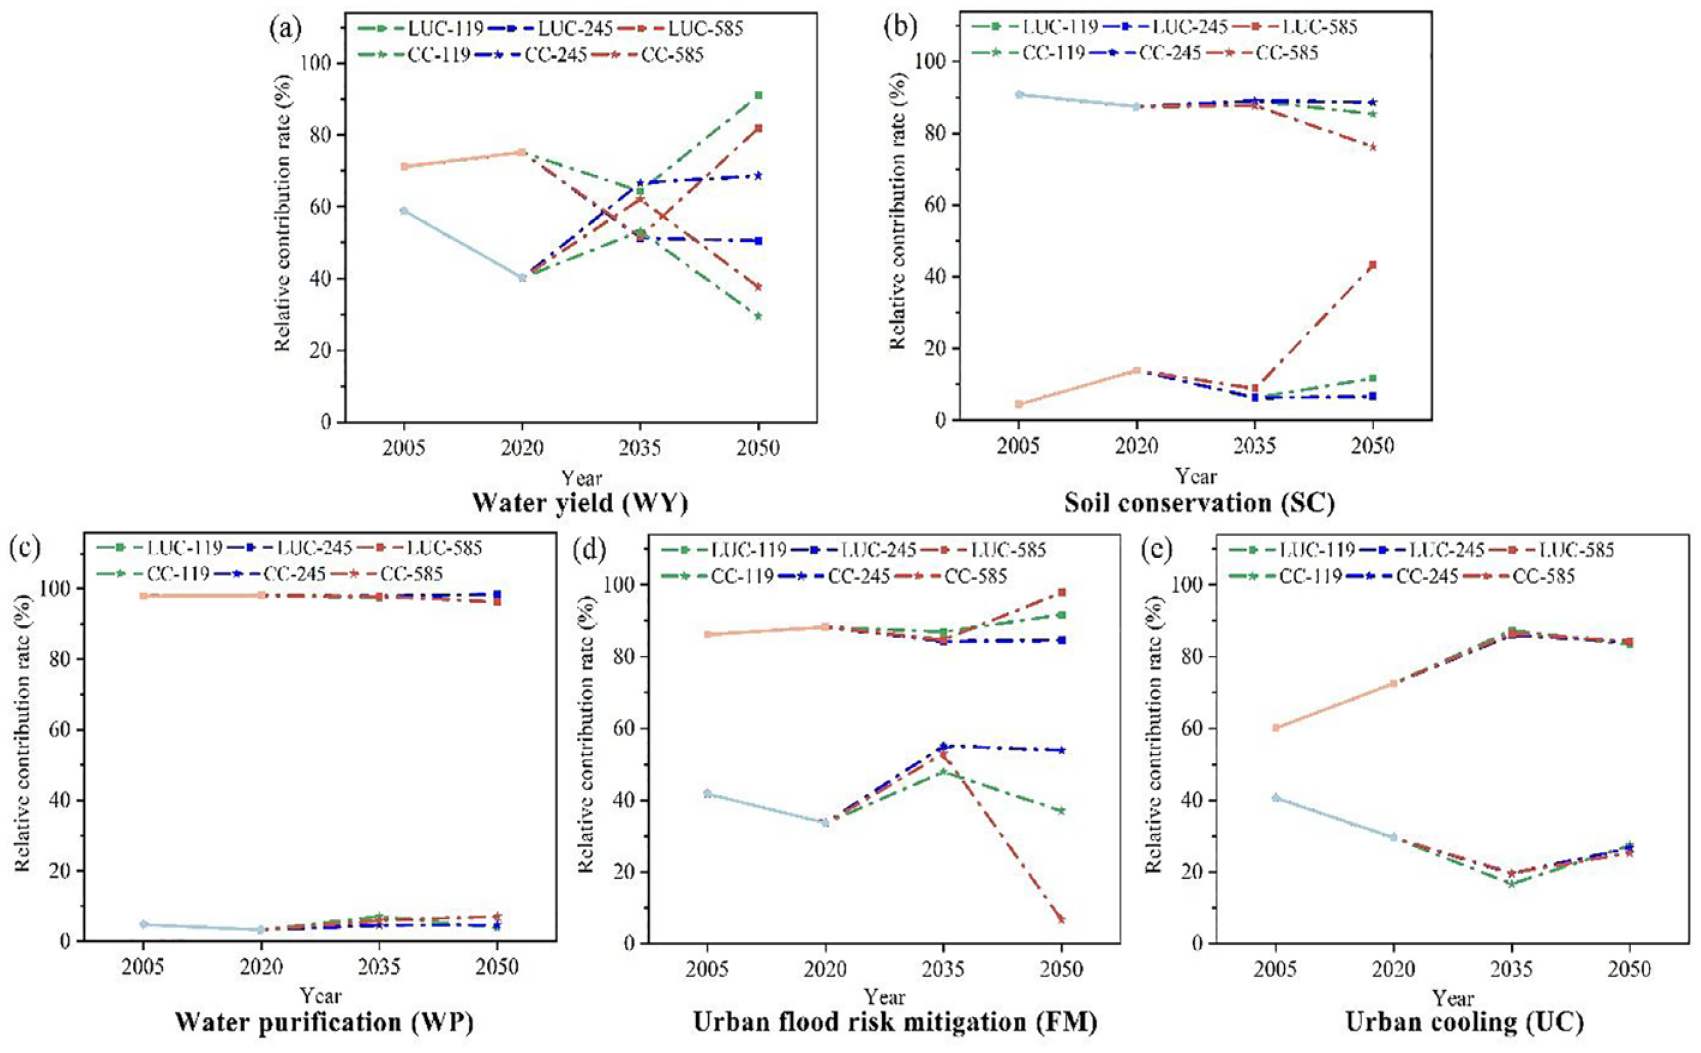
Relative contribution rate of two driving factors to five ESs: (a) Water yield; (b) soil conservation; (c) water purification; (d) urban flood risk mitigation; and (e)urban cooling.
The combined impacts of land use and climate change vary across different ESs (Figure 7). The average synergistic impact of land use and climate change on WY service is 52.83%, which has improved the WY increased in the scenarios of 1990-2020, and 2035-SSP585 and 2050-SSP119. The inhibitory impact of land use and climate change on SC, WP, FM and UC are 56.48%, 51%, 48.04% and 50.4% respectively.
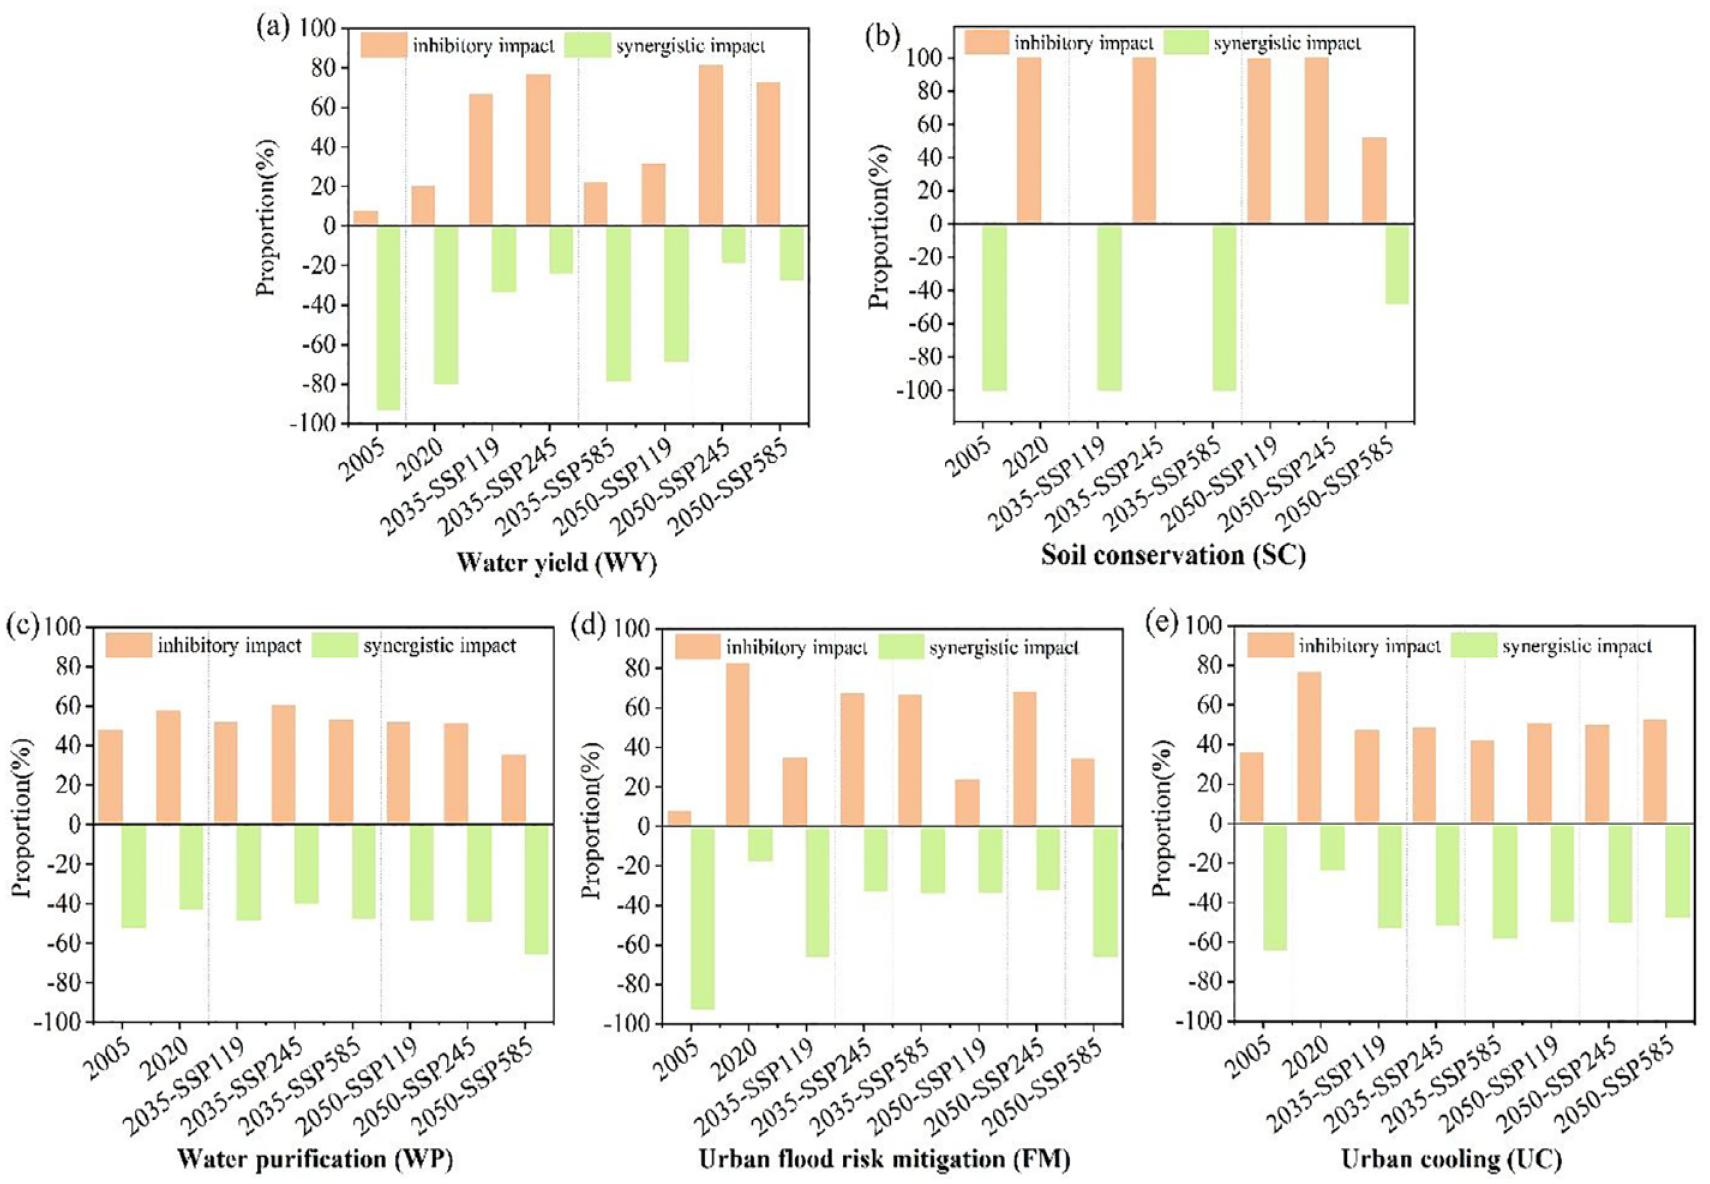
The combined effects of land use and climate change on five ecosystem services: (a) Water yield; (b) soil conservation; (c) water purification; (d) urban flood risk mitigation; and (e)urban cooling.
Discussion
Climate and land use change are common driving forces with both positive and negative impacts on multiple ecosystem services (ESs). While we have identified their individual and combined impacts, a more nuanced understanding is required regarding specific climate change indicators and land use patterns. Climate change significantly affects ESs by altering biophysical processes at the regional scale (Cui et al., 2021; Peng et al., 2020; Pham et al., 2019). Previous studies have shown that changes in hydrological processes and carbon dioxide concentrations can influence regional water yield and carbon storage, among other services (Clerici et al., 2019; Pham et al., 2019). Additionally, land use patterns exert spatial interaction effects that have not been extensively measured to date. Some studies suggest that the average changes in ESs caused by climate change can be obscured by urbanization (Peng et al., 2020). Consistent with these findings, our experiments in the Pearl River Delta Urban Agglomeration area revealed that water yield (WY) and soil conservation (SC) are significantly affected by climate change, while water purification (WP), flood risk mitigation (FM), and urban cooling (UC) are positively related to land-use changes driven by urban expansion. Future scenarios indicate that land-use change contributes more significantly to ESs changes in urban areas than climate change. These results highlight that the combined effects of land-use and climate change leading to ESs degradation are the primary ecological challenges faced by ecosystem management at the urban agglomeration scale. Inevitably, complex interactions between land use and climate control these ESs degradations in urbanized areas (Peng et al., 2020), making it difficult to completely separate their impacts. The current method employed only measures the relative contributions of these two factors and allows for quantitative impact comparisons. However, it does not delve into the interaction mechanisms between land use, climate change, and ESs changes.
In the Anthropocene, the compounded challenges of global urban growth and climate change pose significant threats to sustainable development goals (Fletcher et al., 2024). Cities and their supporting areas, often situated in climate hazard-prone regions such as coastal or riparian zones, are at the forefront of these challenges (Ziari et al., 2023). Urbanization and climate change present a complex trade-off, impacting cities and necessitating affordable and effective solutions that deliver ecosystem services while simultaneously providing additional synergistic benefits to human well-being (Qu et al., 2024). Cities are particularly vulnerable to extreme weather risks such as floods, droughts, and heat waves (Laino and Iglesias, 2023). As our study indicates, identifying the spatial effects of climate and land use change under different RCPs-SSPs scenarios can help pinpoint priority areas for restoration targets in urban ecosystem management. This approach enables a more strategic and informed response to the challenges posed by urbanization and climate change, ultimately contributing to the sustainable development of urban ecosystems.
In urban agglomeration areas, fostering climate resilience and implementing effective land use and ecosystem adaptation strategies are crucial for nature-based solutions. Urban nature offers a potential wealth of solutions to address the compound challenges presented by urbanization and climate change. Nature-based solutions, also known as green infrastructure, ecosystem-based adaptations, or urban ecological infrastructure (Francisco et al., 2019), are increasingly being integrated into cities to promote public health and safety, enhance livability, foster equity, and restore natural hydrologic and ecological processes (Depietri and McPhearson, 2017; Nesshöver et al., 2017). These solutions also hold significant promise for bolstering urban resilience to the shocks and stressors associated with climate change (Babí Almenar et al., 2021; Hobbie and Grimm, 2020), often through the provision of ecosystem services (McPhearson et al., 2015). Restored or constructed ecosystems as nature-based solutions are gaining traction in urban settings. Spatial identification of ecosystem services (ESs) under the combined effects of land use and climate change can serve as a strategic approach to guide the construction and implementation of nature-based solutions
Conclusion
Climate and land use change in urban areas have been evident over the past two decades and are projected to continue until mid-century. While numerous case studies have quantified the impacts of land use and climate change on ecosystem services (ESs) changes, few have projected these changes under future scenarios. In this study, we employed the scenario hypothesis method to quantify the relative contributions of land use and climate change to five ESs from 1990 to 2050, identifying the dominant driving forces and assessing their combined effects. The results indicate that climate change has significantly affected soil conservation services, whereas water yield, water purification, urban flood risk mitigation, and urban cooling services are predominantly impacted by land use change. Under future RCPs-SSPs scenarios, these dominant factors are expected to positively influence water yield, soil conservation, and water purification services, while negatively affecting urban flood risk mitigation and urban cooling. From 2005 to 2050, the combined effects of land use and climate change on soil conservation, water purification, urban flood risk mitigation, and urban cooling services predominantly exhibit mutual inhibition. In contrast, the impact of land use change on ESs is expected to remain dominant until the middle of this century.
Footnotes
Consent to Participate
Informed consent was obtained from all individual participants included in the study.
Declaration of conflicting interests
The author(s) declared no potential conflicts of interest with respect to the research, authorship, and/or publication of this article.
Funding
The author(s) disclosed receipt of the following financial support for the research, authorship, and/or publication of this article: This work was supported by Guangdong Basic and Applied Basic Research Foundation (Grant No.2022A1515010062).