
Abstract
Building carbon emissions (BCEs) from the construction industry are crucial to realizing the ‘Dual-Carbon’ Goals of China, but their spatio-temporal and stage differences are not fully understood. Here, we explored the spatial and temporal differences of building carbon emissions in the Yangtze River Delta urban agglomeration by combining life cycle assessment and spatial analysis, and further compared the contribution rates of each influencing factor to BCEs based on the LMDI-STIRPAT model. The results revealed that from 2005 to 2020, the growth rate of building carbon emissions in the Yangtze River Delta urban agglomeration slowed after 2013, with a spatial trend of ‘slow in the east and fast in the west’. With respect to the whole process, the contribution of building materials production and transportation to BCEs is the most significant. Additionally, the types of building materials and energy used in each stage have changed dramatically over the 16 years. Furthermore, GDP per capita and carbon intensity are the strongest positive and negative drivers, respectively. These findings provide a complete understanding for a regional exploration of BCEs and contribute to formulating low-carbon building policies within urban agglomerations.
Keywords
Introduction
With urbanization and economic development, global warming due to rapidly increasing carbon dioxide (CO2) emissions is posing a serious threat to the sustainable development of human society (Lee et al., 2021). The construction business, one of the three major industrial sources (industry, transportation, and construction) of energy consumption and CO2 emissions (Atmaca and Atmaca, 2022; Zhang et al., 2019b, 2024a), plays a critical role in China’s ‘carbon peaking and carbon neutrality goals’. The Report of Building Energy Consumption and Carbon Emissions in China for 2022 (China Association of Building Energy Efficiency, 2023) shows that whole-process building carbon emissions (BCEs) accounted for up to 50.9% of China’s carbon emissions in 2020, becoming the country’s main contributor (Xiong et al., 2024; Zhang et al., 2024b). Therefore, exploring the characteristics of the dynamic changes and influencing factors of BCEs contributes to realizing the ‘dual-carbon’ goals and the sustainable development of the building industry in China.
Previous studies have focused mainly on methods for estimating, analyzing and decomposing BCEs. Regarding estimation methods, many studies have focused on national and provincial scales, but fewer on the scale of cities and urban agglomerations. At national scale, Zhang and Wang (2016) used a hybrid input-output method to assess the energy consumption and carbon emissions of China’s construction sector. Hu et al. (2022) established an integrated China Building Energy and Emission Model (CBEEM) to evaluate the BCEs of construction and operation stages in China. At the provincial scale, Chen et al. (2022a) and Xu et al. (2024) estimated the operation-stage and embodied BCEs at the provincial scale in China based on the China Building Energy and Emission Database and the P-LCA method, respectively. Besides, Wang et al. (2024a) proposed using nighttime light remote sensing and geographically weighted regression modeling to estimate BCEs in North Brabant. These calculation methods have made it possible to assess and analyze carbon emissions from the construction sector. However, as urban agglomerations are increasingly seen as key drivers of both economic growth and environmental impacts (Luqman et al., 2023; Wu, 2019), this level of in-depth investigation is becoming increasingly necessary and it can provide a more comprehensive understanding of BCEs in highly urbanized and densely populated areas (Ma et al., 2022), thus underpinning an effective regional response to the challenge of climate change.
Existing research has mainly focused on the operation stage or specific building types to assess the dynamic changes in BCEs. However, the dynamics of BCEs within the whole process are not clearly quantified. For example, Wang (2024) and Liang et al. (2024) discussed the spatio-temporal trends of the operation-stage and embodied BCEs in the Yangtze River Delta urban agglomeration (YRDUA) respectively. Xiang et al. (2024) analyzed the spatial and temporal evolution and spillover effects of carbon emissions from public buildings in China from the perspective of the tertiary sector. Geng et al. (2022) examined the characteristics of carbon emissions from residential buildings in the city cluster of the Guangdong-Hong Kong-Macao Greater Bay Area at various stages, as well as their socio-economic drivers. However, these studies have not analyzed the whole-process of BCEs or compared spatio-temporal and stage-by-stage characteristics, despite their importance to policy-making. (Mao et al., 2024)
Existing methods used the Logarithmic Mean Divisia Index (LMDI) decomposition method or the STIRPAT model separately to explore the influencing factors, but few studies have combined them and applied them to the field of BCEs. Previous studies have extensively explored the drivers of BCEs, including population (Chen et al., 2022b; Huo et al., 2020), urbanization rate (Xiang et al., 2024), built-up area (Zhu et al., 2022), economic growth (Li et al., 2022) and energy intensity (Chen et al., 2022b). Commonly used methods for factor decomposition include the LMDI method and STIRPAT model. For example, Li et al. (2022) used the LMDI method to discuss the changes in the carbon emission reduction of commercial buildings in provincial building operations. Zhao et al. (2023) utilized the hybrid LMDI model to investigate the factors that drive direct and indirect BCEs in Hangzhou, China. Zhang et al. (2024a) studied the driving mechanisms of BCEs in Shandong Province based on the Kaya-LMDI method. Some scholars have also used the STIRPAT model to research the influencing factors of BCEs. Chen et al. (2022b) assessed the influencing factors of the construction stage of large public buildings using the improved STIRPAT model. Hao et al. (2023) combined the ridge regression method and STIRPAT model to develop a new model of factors affecting BCEs in Suzhou, China. The LMDI model is effective in measuring how much each factor contributes to changes in carbon emissions, eliminating issues with residual terms. On the other hand, the STIRPAT model addresses the economic interpretability challenges that the LMDI decomposition method might encounter when variables are added, as well as the constraints of model rigor. In other words, these two models complement each other. Although they have been successfully applied in other areas (Chai et al., 2018; Liu et al., 2022), few studies have integrated them to analyze the factors influencing BCEs.
To address the above shortcomings, this paper will analyze the characterization of changes in and influencing factors of BCEs in the YRDUA from 2005 to 2020 and answer the following key questions: How do BCEs change in the YRDUA during the whole process over time and space, and what are the main drivers of these changes? A four-step strategy is adopted to answer these questions. First, we comprehensively estimated BCEs at the city scale. Second, we used statistical analysis, geographic information system (GIS) methods and the LMDI-STIRPAT model for an overall analysis of the characteristics of carbon emission changes and the contributions of influencing factors, from both regional and whole-process perspectives. Finally, we proposed targeted energy-saving and emission-reduction suggestions to provide empirical evidence for formulating effective policies to reduce BCEs.
Study area and data
Study area
The YRDUA is located at the core of the eastern coastal economic belt of China and consists of 26 cities, including Shanghai, nine cities in Jiangsu (such as Nanjing, Wuxi, and Suzhou), eight cities in Zhejiang (such as Hangzhou, Ningbo, and Jiaxing), and eight cities in Anhui (such as Hefei, Wuhu, and Anqing). The total land area covers approximately 211,700 square kilometers (Figure 1). Since the release of the ‘Yangtze River Delta Urban Agglomeration Development Plan’ in May 2016 (General Office of the State Council of the People’s Republic of China, 2016), the YRDUA has actively implemented the concept of green development, striving to serve as a demonstration zone for constructing a beautiful China and promoting sustainable and high-quality development of the urban agglomeration. As one of the most economically dynamic regions in the world and one that attracts the largest influx of migrants, the YRDUA occupies a pivotal strategic position in China’s modernization efforts and comprehensive opening-up strategy (General Office of the State Council of the People’s Republic of China, 2019; Wu et al., 2022). In recent years, with the accelerated advancement of regional economic integration, the YRDUA has faced the dual challenges of efficient land resource utilization and ecological environmental protection. During this process, the continuous expansion of urban construction land (Hou et al., 2024; Yang et al., 2024; Zhang et al., 2019a) has been accompanied by a year-on-year increase in carbon emissions from the construction industry. Against the backdrop of promoting energy-saving and low-carbon buildings (Ministry of Housing and Urban-Rural Development, PRC, 2022), an in-depth investigation into the carbon emission characteristics of the construction industry in the YRDUA is highly valuable for formulating regional carbon peak implementation plans (Wang, 2024) and exploring green urban development models.
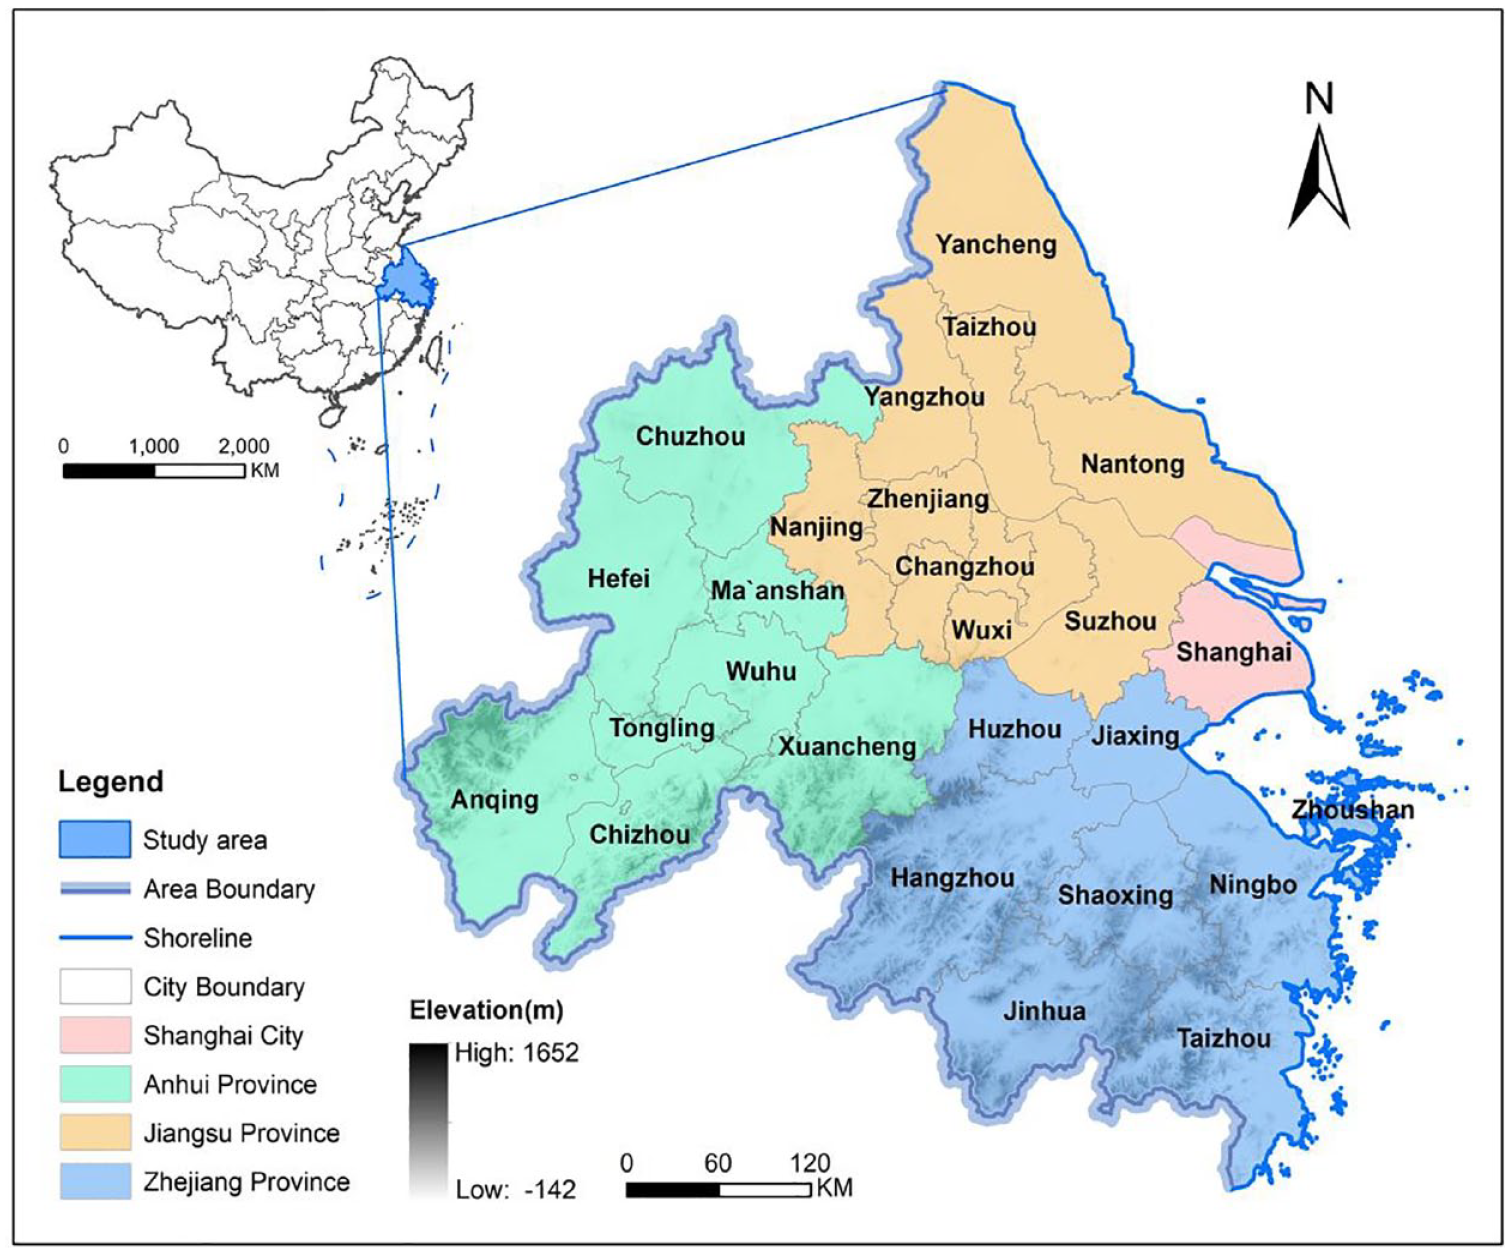
Overview of the study area.
Data
The whole-process carbon emissions in the construction industry are accounted for annually. The data on the consumption of various building materials (steel, cement, wood, glass, and aluminum), average transport distances for building materials, and various energy consumption statistics (such as those for ‘wholesale and retail’, ‘accommodation and catering’, ‘residential life’ and ‘others’ from the energy balance sheet) were obtained from the China Energy Statistical Yearbook (National Bureau of Statistics, 2006a) and the China Construction Industry Statistical Yearbook (National Bureau of Statistics, 2006c) from 2006 to 2021, as well as regional statistical yearbooks. On the basis of the carbon emission coefficients specified in the Standard for Calculating Carbon Emissions of Buildings (GB/T 51366-2019) (Ministry of Housing and Urban-Rural Development, PRC, 2019), we converted the consumption of building materials and energy into carbon emissions at each stage of the full process of construction. Using the data from Shanghai as an example, we compared and validated our results with the findings in the China Building Energy Consumption Research Report (China Association of Building Energy Efficiency, 2023) to ensure that the calculated results fell within a reliable range.
To conduct a more comprehensive analysis of the factors influencing carbon emissions in the construction industry, we also selected key indicators, such as the regional gross domestic product (GDP), year-end permanent resident population (POP), and gross construction output (BG). These data were sourced from the China Statistical Yearbook (National Bureau of Statistics, 2006b) and local statistical yearbooks. Additional auxiliary geographic data, including the administrative boundaries of the YRDUA and its prefecture-level cities, were obtained from the National Geomatics Center of China, with a spatial resolution of 1:1,000,000.
Methods
This study analyzes the characteristics and influencing factors of BCEs from both regional and whole-process perspectives (Figure 2). First, we used a life cycle assessment (LCA) model for the construction process to calculate BCEs and explored their spatio-temporal evolution characteristics through methods such as spatial autocorrelation analysis. Second, we analyzed the differences in BCEs across various stages by calculating the contribution ratio of each stage. Third, we selected key influencing factors and applied the LMDI method and the STIRPAT model to explain the differences in the contribution rates of influencing factors from the two perspectives.
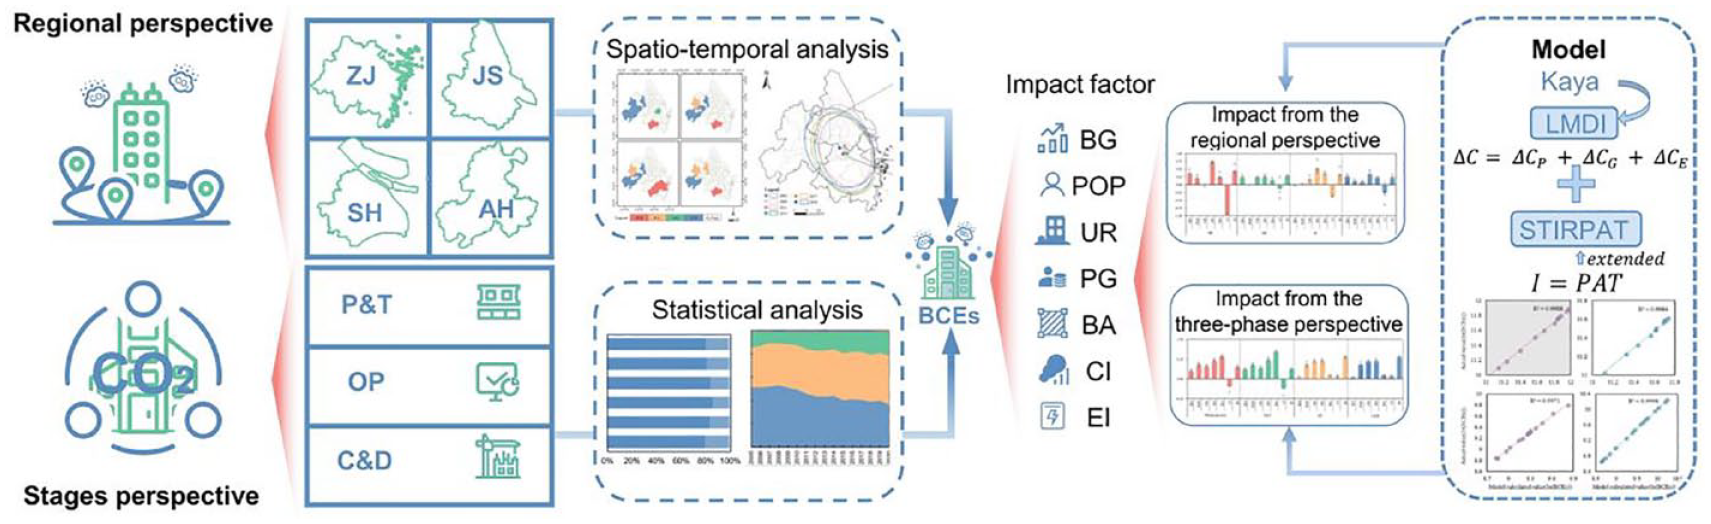
Research framework. ZJ, JS, SH and AH represent Zhejiang, Jiangsu, Shanghai and Anhui, respectively. P&T represents the production and transportation stages of construction materials, OP represents the operation stage of the building, and C&D represents a combination of the construction and demolition stages.
Quantifying the BCEs
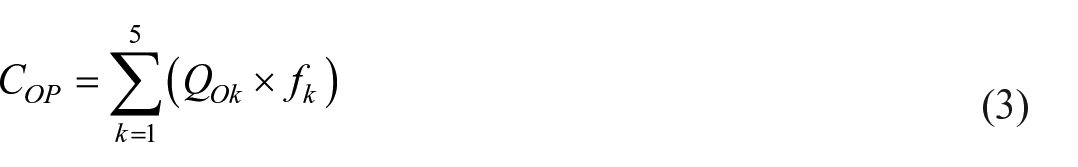
In this work, we divided the whole process of the construction industry into three major stages, namely, the production and transportation of building materials, construction and demolition, and operation, according to the detailed definitions in Building Carbon Calculation Standards (GB/T 51366—2019). A process-based LCA method was adopted to establish a statistical accounting model for the whole-process carbon emissions of the construction industry (Peng, 2016) (Online Supplemental Figure S1).
The total carbon emissions from the life cycle of the construction industry


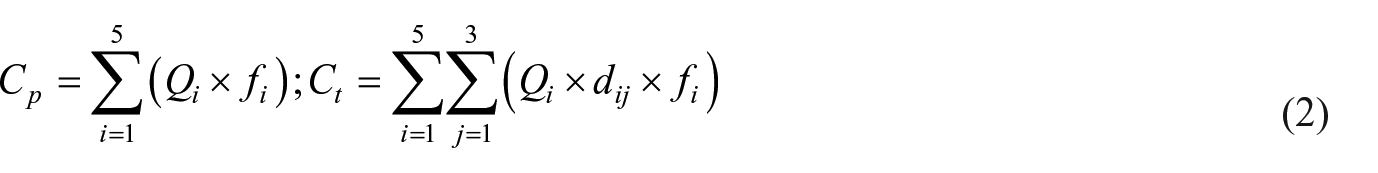
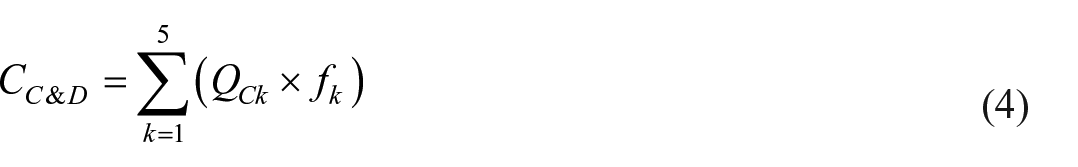
where
Identifying the spatial aggregation of BCEs
Spatial autocorrelation analysis can be used to identify spatial heterogeneity and clustering patterns. To describe the degree of correlation in BCEs among cities, both global and local indicators can be employed (Cliff and Ord, 1982). Moran’s I (Moran, 1950) is currently the most widely used method for measuring spatial autocorrelation (Anselin, 1995). The global Moran’s I index reveals the overall spatial autocorrelation in the study area. In contrast, the local Moran’s I index measures the correlation of each city with its neighboring cities in terms of BCEs. The formulas for calculating these indices are as follows:
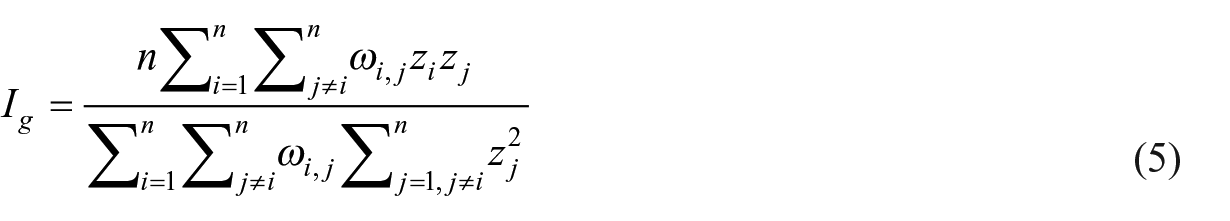
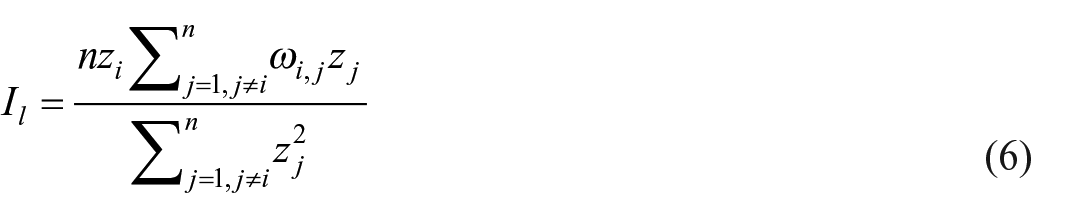
where
Analyzing the spatio-temporal dynamics of BCEs
The standard deviational ellipse (SDE) is a robust tool for analyzing the spatial and temporal dynamics of BCEs. This method was first proposed by American sociologist D. Welty Lefever and his colleagues in 1926 (Lefever, 1926; Longley, 2011). As a spatial statistical method, SDE can accurately reveal multiple spatial distribution characteristics, including centrality, dispersion, directionality, and spatial patterns (Duranton and Overman, 2002). The key parameters of the SDE include the centroid, orientation angle, and major and minor axes of the standard deviational ellipse (Bachi, 1962; Warntz and Neft, 2006). The centroid
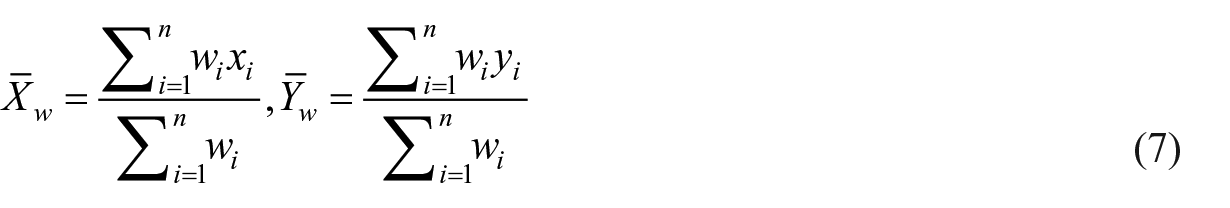
where
Examining the contributions of influencing factors to BCEs
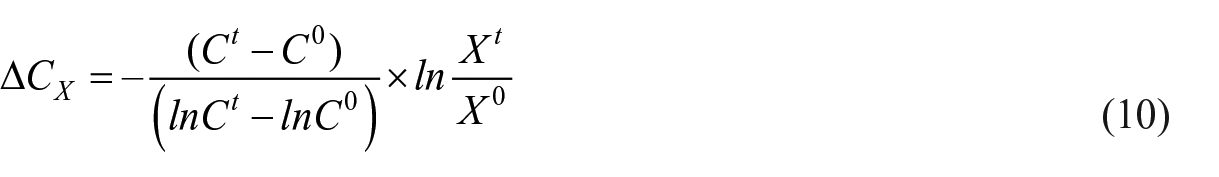
For the contributions of carbon emissions, methods such as LMDI decomposition, the IPAT model and its derivatives (ImPACT and STIRPAT models), and the Environmental Kuznets Curve (EKC) are commonly used to study the contributions of influencing factors to BCEs (Wu et al., 2021). This study utilizes the LMDI method to quantify the contribution rates of influencing factors. The LMDI, introduced by Ang et al. (1998) and built upon the Kaya identity (Kaya, 1989), is an analytical model used to assess the driving forces behind carbon emissions, effectively avoiding issues caused by residual terms. For this study, the changes in BCEs over a time period

where
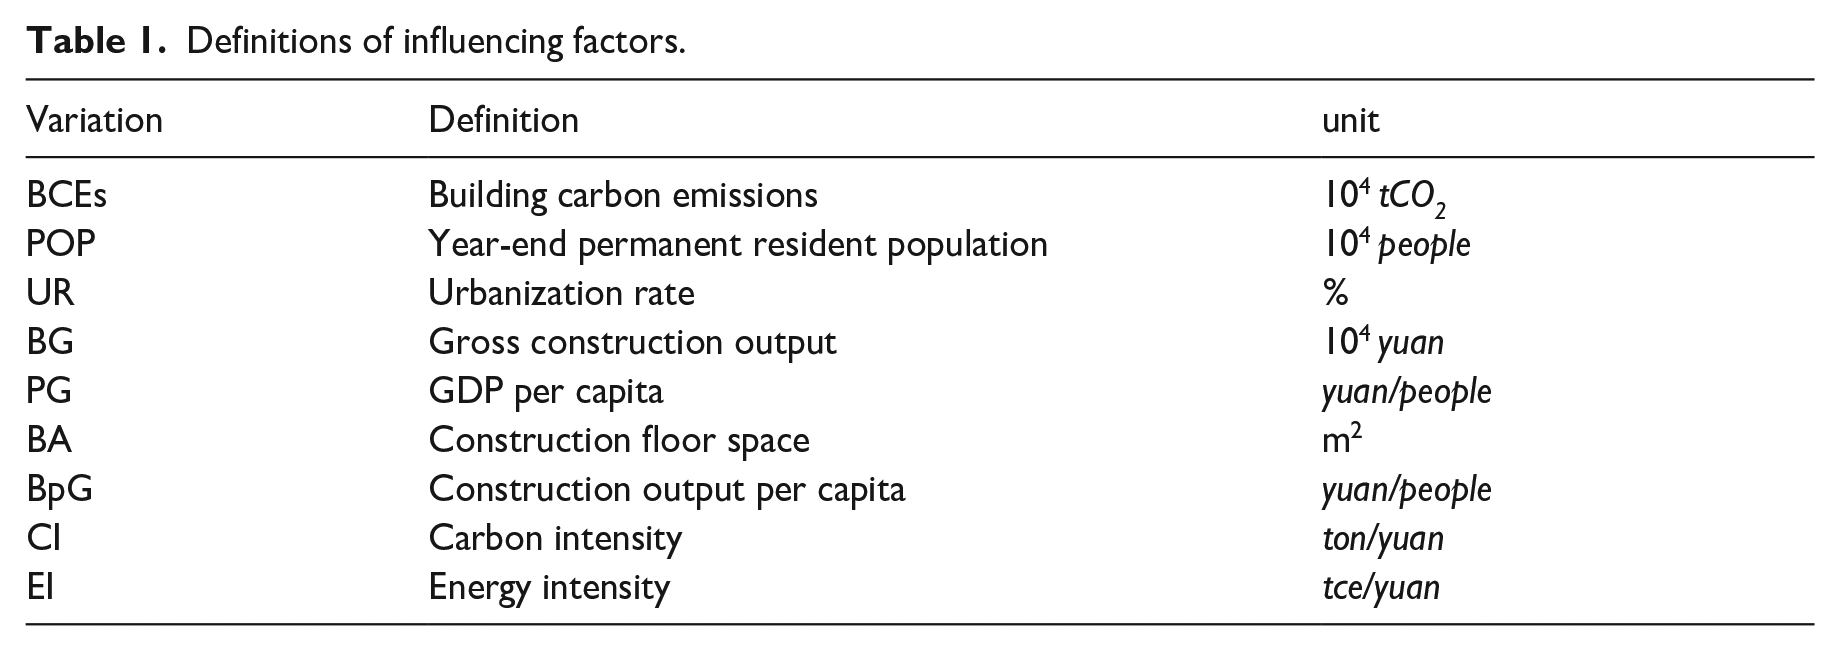
However, LMDI decomposition based on the Kaya identity faces challenges when additional variables are introduced, such as the construction indicators that are weakly correlated with the economy, as these new variables may lack clear economic interpretation (González-Torres et al., 2021). In contrast, the flexible STIRPAT model offers greater adaptability and richer statistical value (Wang and Xue, 2023; Wu et al., 2024; York et al., 2003). It only requires maintaining a multiplicative form and does not need to adhere to the strict requirements of the Kaya identity. Therefore, in this study, we extend the STIRPAT model and apply LMDI decomposition to explore the contribution rates of various influencing factors to BCEs. The STIRPAT model, a ‘top-down’ approach initially developed by York et al. (2003) as an improvement to the IPAT equation, allows for nonmonotonic and disproportionate changes in influencing factors, making it widely used in pollution emission research across various fields (Gao et al., 2019; Tan et al., 2024; Xu et al., 2020). In this study, we referred to previous studies to select potential influencing factors (Table 1). After conducting Pearson correlation analysis (Online Supplemental Figure S2), seven influencing factors, including the building area per unit (BA) and energy intensity (EI), had P values less than 0.05, indicating statistical significance. However, the per capita output value of the construction industry did not pass the significance test and was excluded from the analysis. The final model was extended using the remaining seven factors to meet our research design requirements, and the expanded model was formulated as follows:

where BCEs represent the total regional BCEs; B, C, . . ., D, E, and F correspond to the seven independent variables; a is the model coefficient; b, c, . . ., d, e, and f are the elasticity coefficients of the respective variables, indicating the percentage change in carbon emissions resulting from a 1% change in each variable; and e represents the model error term.
Definitions of influencing factors.
To calculate the carbon emission contribution rates of various factors across different stages and regions, we incorporate the coefficient terms from the extended STIRPAT model into
where
Additionally, when the STIRPAT model is used to study the influencing factors of carbon emissions, the constructed multiple linear regression model is prone to spurious regression. This occurs when the Variance Inflation Factor (VIF) test indicates VIF ⩾ 10, suggesting the presence of multicollinearity (Alauddin and Nghiemb, 2010). Fortunately, ridge regression uniquely addresses multicollinearity issues (Assaf et al., 2019; Kasarda and Shih, 1977; Mahajan et al., 1977). After the VIF test, the seven variables selected in this study exhibited severe multicollinearity (Online Supplemental Figure S2). Therefore, it is necessary to employ ridge regression to solve the expanded STIRPAT models for the overall, three-stage, and four-region cases. An examination of the difference between the model’s calculated and actual values revealed that the
Results
Trends of BCEs in the urban agglomeration
Overall, the total BCEs in the YRDUA showed an increasing trend from 2005 to 2020, with an average annual growth rate of 15.6% (Figure 3). The year 2013 was the turning point of the growth rate change, and the average annual growth rate before and after that changed significantly, from 20.9% to 2.6%. This may be induced by policies such as the Green Building Action Programme (National Development and Reform Commission & Ministry of Housing and Urban-Rural Development, 2013) enacted by China during this period, and a series of actions and technical guidelines were launched across regions (General Office of the People’s Government of Jiangsu Province, 2013; Zhejiang Provincial Department of Housing and Urban-Rural Development, 2013), proposing carbon reduction initiatives to develop green building materials and strengthen building energy efficiency operation and management. Furthermore, as the construction sector was affected by the COVID-19 pandemic (Jeon et al., 2022; Zaidan et al., 2024), a 2% decline occurred in 2020 compared with the overall peak observed in 2019.
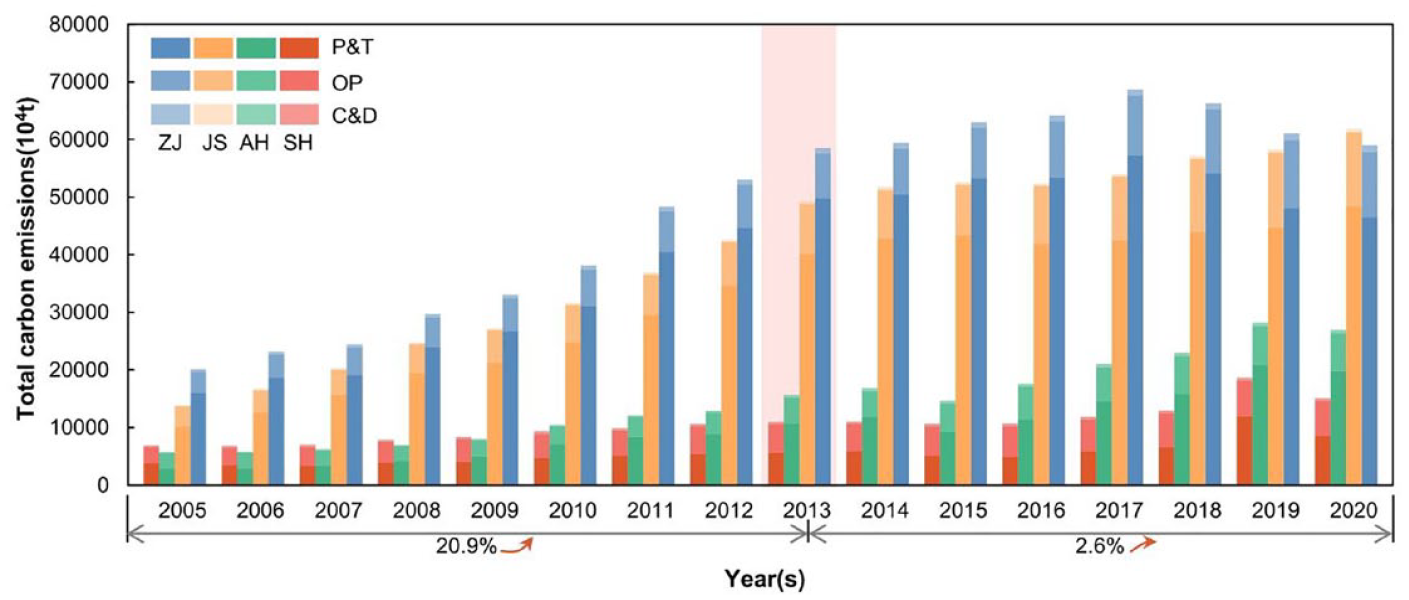
Temporal dynamics of total BCEs and process-based BCEs in the 2005~2020 period. ZJ, JS, SH, and AH represent Zhejiang, Jiangsu, Shanghai and Anhui, respectively. P&T represents the production and transportation stages of construction materials, OP represents the operation stage of the building, and C&D represents a combination of the construction and demolition stages.
In terms of BCEs by region, Jiangsu and Zhejiang Provinces were significant contributors, accounting for more than 70% of the total BCEs in all years. Zhejiang Province’s average annual growth rate has been less than 3.5% since 2013. After reaching its peak in 2017, it has continued to decrease at a rate of 3.5%. On the other hand, Jiangsu Province continued to grow at an average annual rate of 3.6% and surpassed Zhejiang Province in 2020, after a brief stagnation from 2013 to 2016. In contrast, the BCEs of Shanghai and Anhui Provinces contributed less to the YRDUA, and neither exceeded 20%. However, growth accelerated in both regions after 2015. Anhui Province exhibited particularly robust growth, with an average annual growth rate of up to 18.5%.
Spatio-temporal dynamics of BCEs
At the city level, the distribution of BCEs in the study area revealed a pattern of ‘high in the east and low in the west’, along with a growth trend of ‘slow in the east and fast in the west’ (Figure 4). Most of the cities in Zhejiang Province, Shanghai and Nantong city, which are situated along the southeast coast, significantly contribute to the overall BCEs, each with contribution rates exceeding 5%. Among them, Nantong and Shaoxing city had the highest percentages of BCEs, reaching 18.5% and 17%, respectively. However, the BCEs of many western cities were less than 1%. Compared with total BCEs, the change aspect of BCEs showed an inverse trend, where cities with high BCEs generally experienced lower average annual growth rates. Although prefecture-level cities in Anhui Province presented lower BCEs values, they presented higher overall growth rates. Conversely, many cities in Zhejiang and Jiangsu Provinces experienced significant declines in growth rates after 2015. Among them, Shaoxing experienced the most significant decline, with an average annual growth rate of -6.4% from 2015 to 2020. Notably, as the city with the highest contribution to overall BCEs in the West, Hefei accounted for up to 9.9% of overall BCEs and rose rapidly at an average annual growth rate of 66%, surpassing the growth rate of BCEs in the YRDUA.
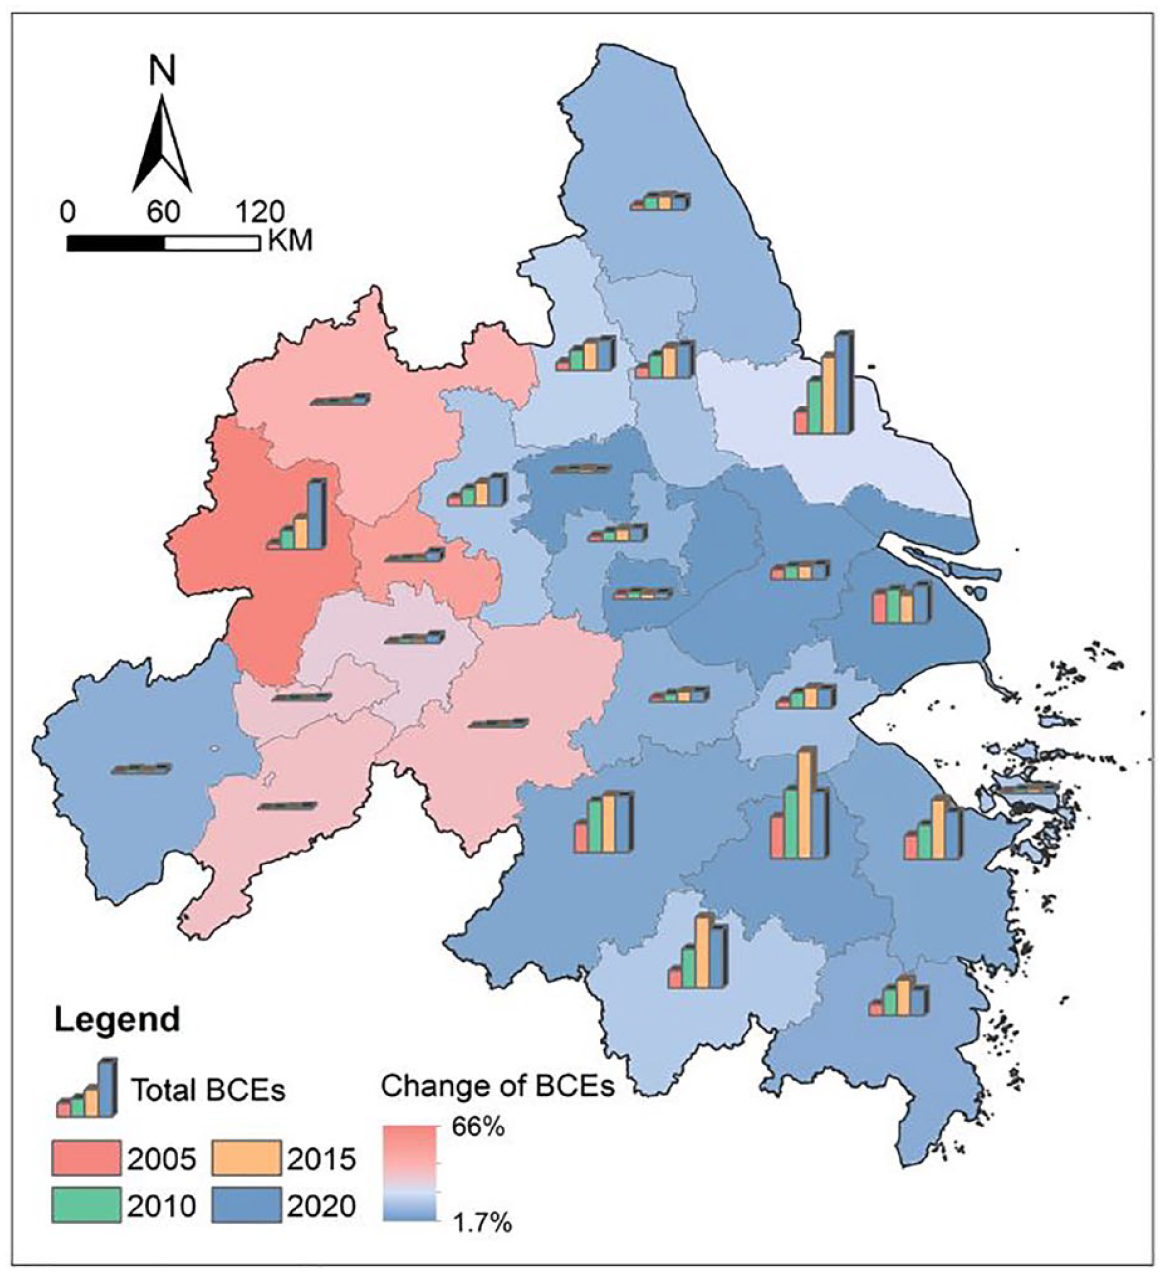
Spatio-temporal variation of BCEs at the urban agglomeration scale.
The spatial aggregation of BCEs in the study area was relatively consistent (Figure 5a). In several years, the global Moran’s I of the YRDUA was above 0, and in all years except 2020, it reached a statistically significant level of 1% (P < 0.01, Z > 1.96) (Online Supplemental Figure S4). This indicates a strong overall spatial aggregation of BCEs in the study area. Regarding the spatial layout, the aggregation characteristics of the study area remained unchanged from 2013 to 2017. From 2005 to 2020, low–low clusters were found primarily in several cities in Anhui Province, while high–high clusters were concentrated in Zhejiang Province. Additionally, there were some dynamic shifts in aggregation characteristics. For example, Hefei and Nanjing transitioned from a low–low to a high–low cluster in 2010 and 2017, respectively, suggesting that neighboring cities still presented lower BCEs.
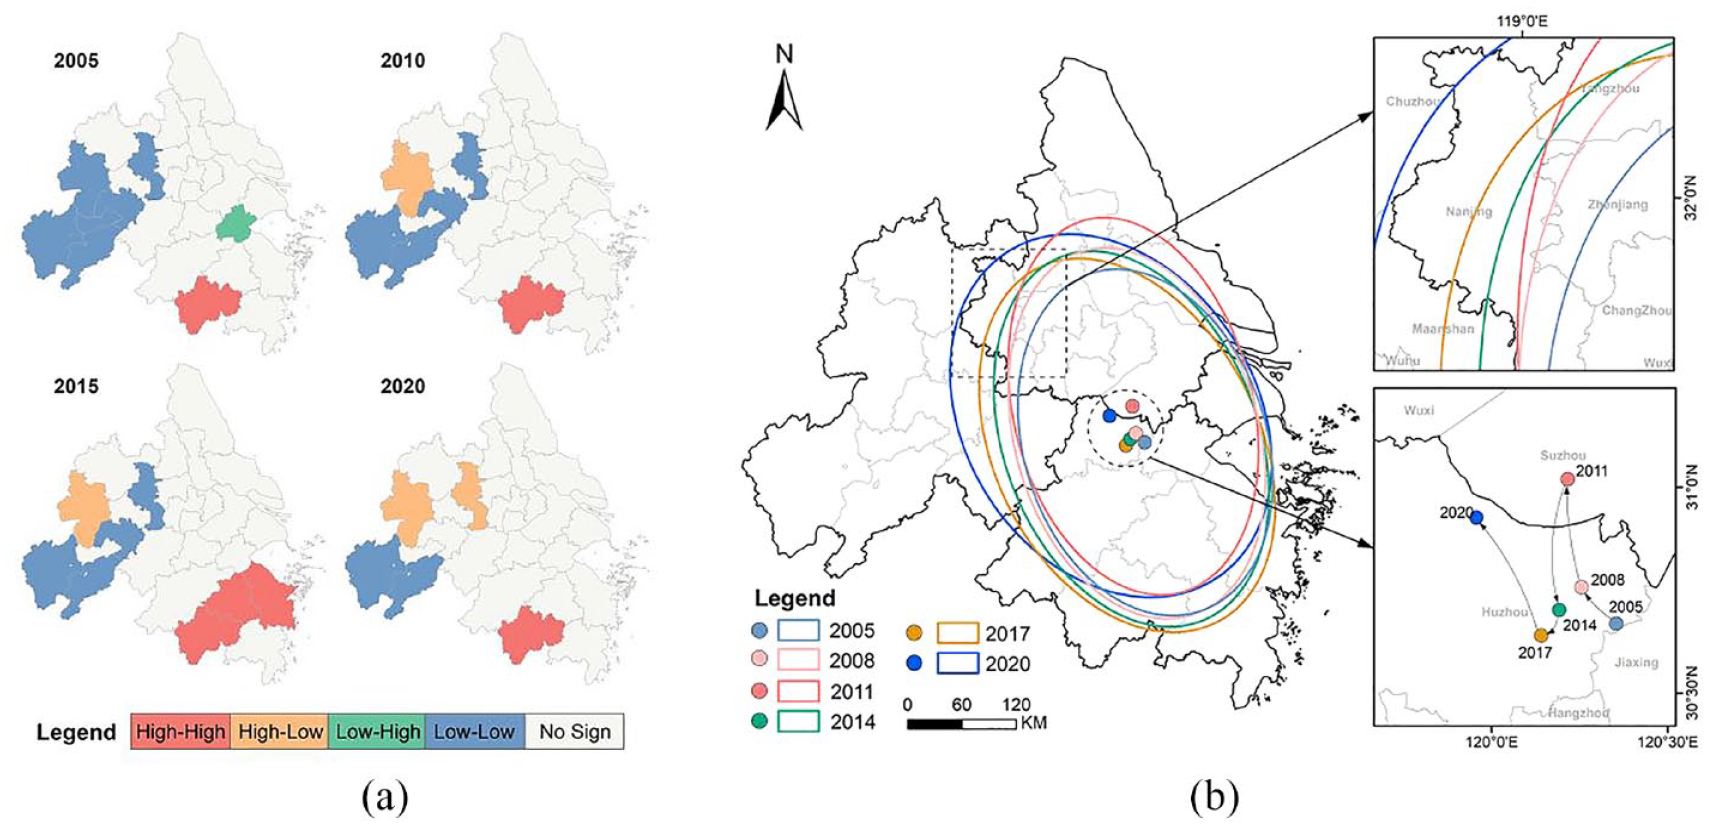
Dynamic characteristics of BCEs in the YRDUA from 2005 to 2020. (a) Distribution of spatial aggregation. (b) Spatio-temporal trend of BCEs.
The evolution of BCEs in the YRDUA was dominated by ‘from east to west’ (Figure 5b). The SDE parameters indicated that the standardized distances of both the long and short axes, as well as the area of the SDE, have been increasing annually. It expanded by 23,676 km2 in 2020 relative to the area in 2015. Additionally, the rotation angle
Contribution of factors to BCEs
Among the three stages of whole-process BCEs, the production and transportation stage of building materials was the main source of BCEs (Figure 6a). Since 2005, the contribution rate of this stage has consistently increased, with an average annual growth rate of 23.6%. The contribution rate exceeded 70% in all years, peaking in 2014, when it accounted for nearly 80%. Although its share decreased from 2016 to 2020, its absolute value continued to rise, illustrating the significance of this stage in emission reduction work. Likewise, the contribution of the building operation stage to the total carbon emissions of the construction industry should not be overlooked. Despite a declining contribution rate observed between 2005 and 2014, the average annual growth rate remained at 10.4%. Additionally, the contribution of this stage gradually recovered from 2016 onward. In contrast, the contribution of building construction and demolition processes to total carbon emissions was relatively minor, with the share remaining at approximately 2% over time and exhibiting a slight downward trend.
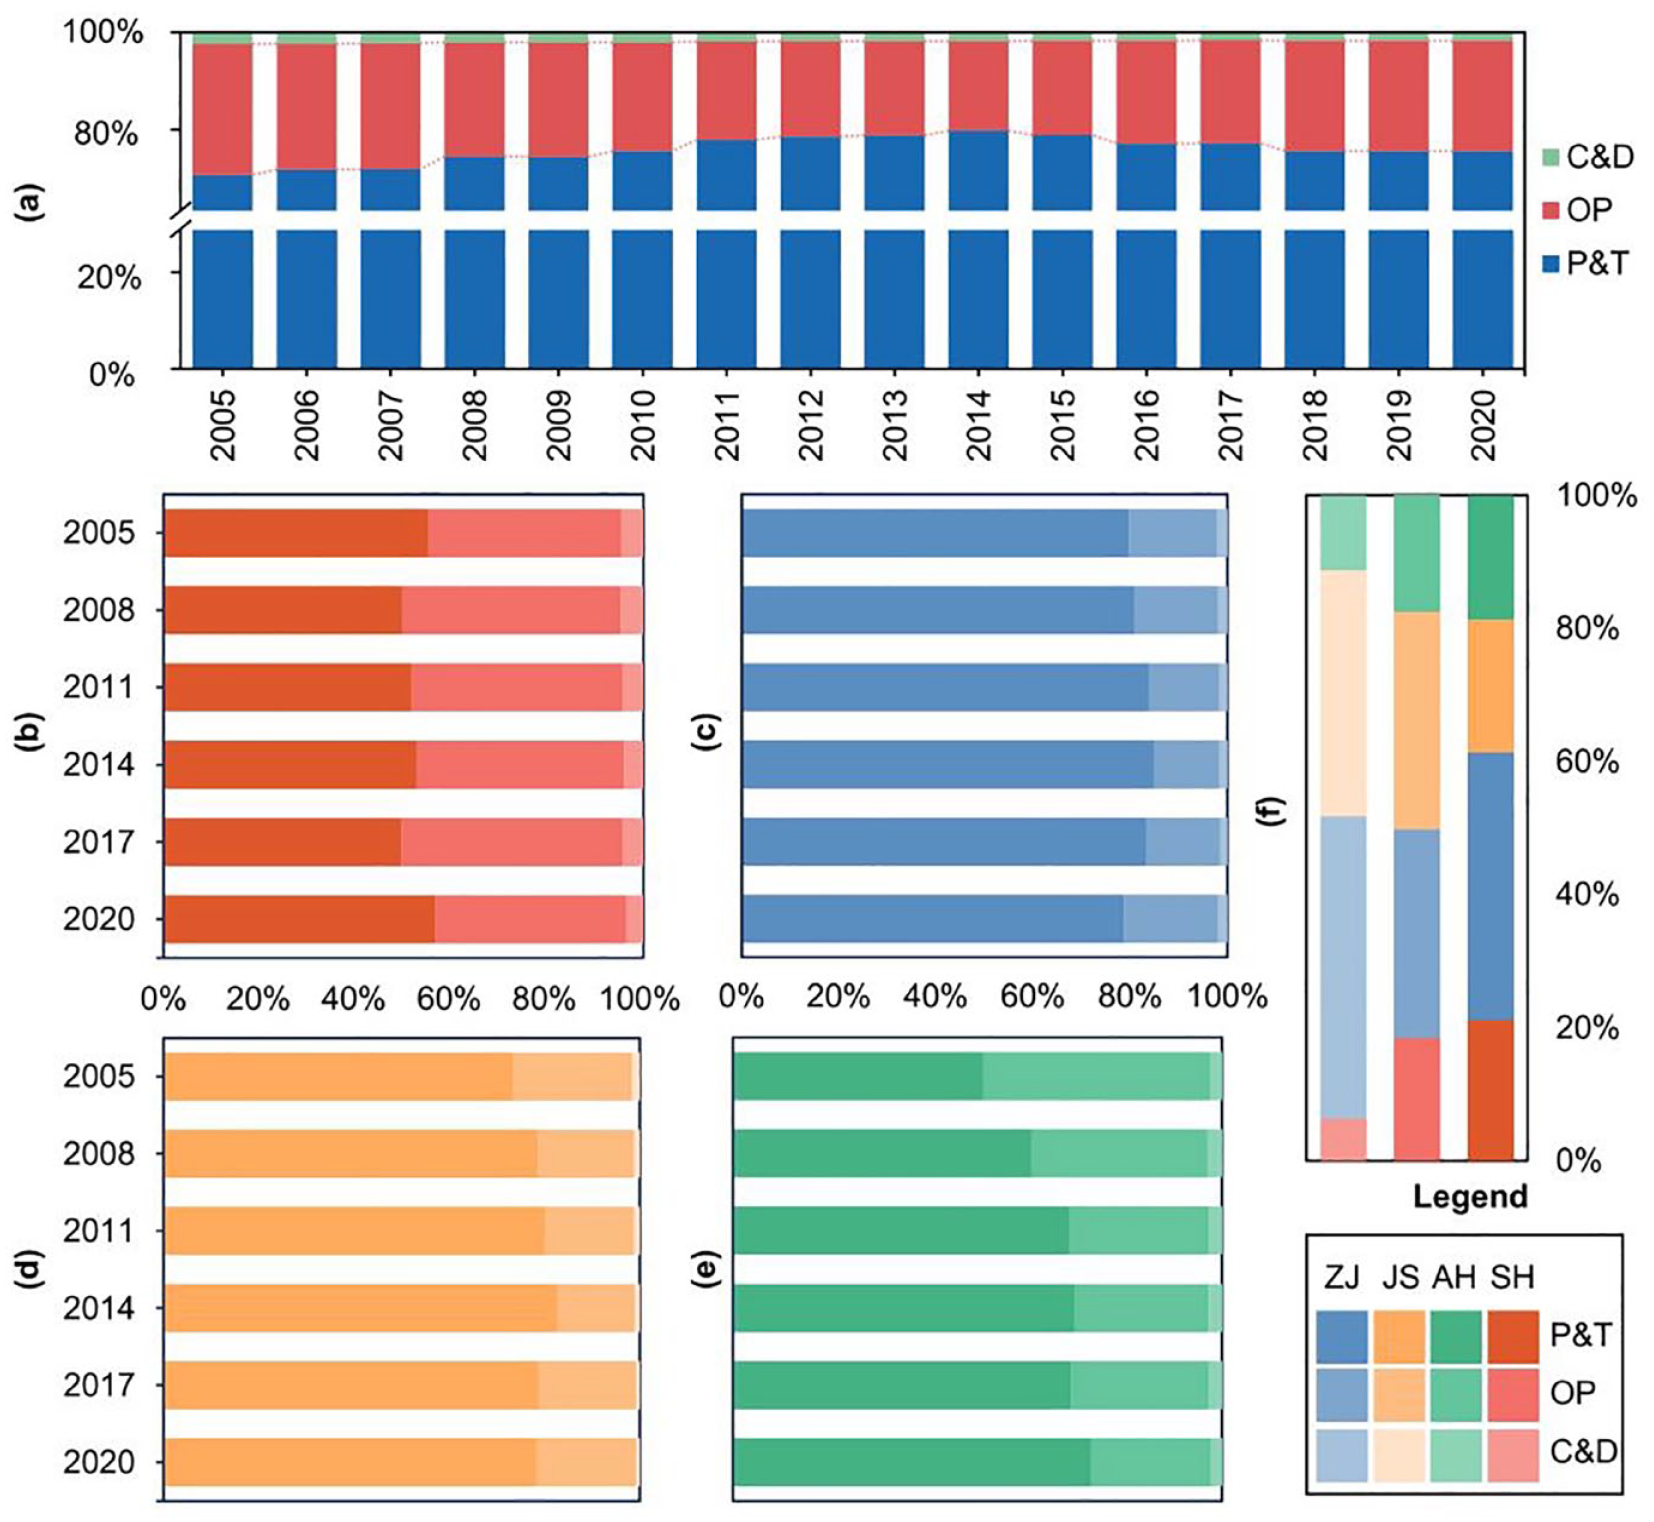
(a) The contribution of each stage to BCEs; the contribution of each stage in different regions: (b) Shanghai, (c) Zhejiang, (d) Jiangsu, (e) Anhui, and (f) the contributions of different regions. See Figure 2 for explanations of the abbreviations.
At the regional level, the stage of production and transportation of building materials was still dominant in all provinces and cities and was positively correlated with the total amount of BCEs (Figure 6). Specifically, Zhejiang and Jiangsu Provinces, which accounted for a substantial total of BCEs, show good performance in terms of their industrial structure and economic dynamism so that they had a higher demand for materials for the development of construction industry and construction materials (Peng, 2022). Therefore, the proportion of this stage was close to 80% (Figure 6b and c), and its contribution to the whole also reached 45.4% and 37%, respectively (Figure 6e). However, Shanghai’s share of BCEs at the operation stage was stable at over 40%, peaking at 46% in both 2008 and 2017. This figure was comparable to its emissions from the production and transportation stage (Figure 6a), which was significantly higher than those of other provinces, although its contribution remained lower than that of Jiangsu Province, which stood at 32.7%. This was because Shanghai led China in terms of urbanization and overall building electrification (Chen et al., 2024a; Ji et al., 2023), and its residents had greater demand for electrical equipment such as lighting, resulting in high carbon emissions from the operation stage (Yan et al., 2024). Conversely, as BCEs grew, Anhui Province demonstrated an increasing proportion of the production and transportation stage and a relatively decreasing proportion of the building operation stage. The trade-offs need to be made between its housing demands and the allocation of resources to the construction industry, in order to promote high-quality development of its construction sector (Peng, 2022; Wang et al., 2024c). Furthermore, the contribution of BCEs from the construction and demolition stages across four regions was all less than 5%, although Zhejiang Province, which has the highest total BCEs, accounted for up to 40.2% of emissions in this stage.
From the perspective of energy and materials, YRDUA has experienced significant transformations in energy structure and material turnover throughout the process (Figure 7). Among the types of energy at the operation stage, fossil energy, represented by coal, was progressively replaced by secondary energy, mainly electricity (Figure 7a). Between 2005 and 2020, the contribution of electricity increased significantly, surpassing 80% from 2016 onward. This shift contrasted sharply with China’s heavy reliance on coal, whose contribution has plummeted from 20% to approximately 1%, indicating a steady transition away from coal. Additionally, natural gas has maintained a stable contribution rate of approximately 10%, whereas fuel oil and heat use has declined, following peaks in 2013 and 2014.
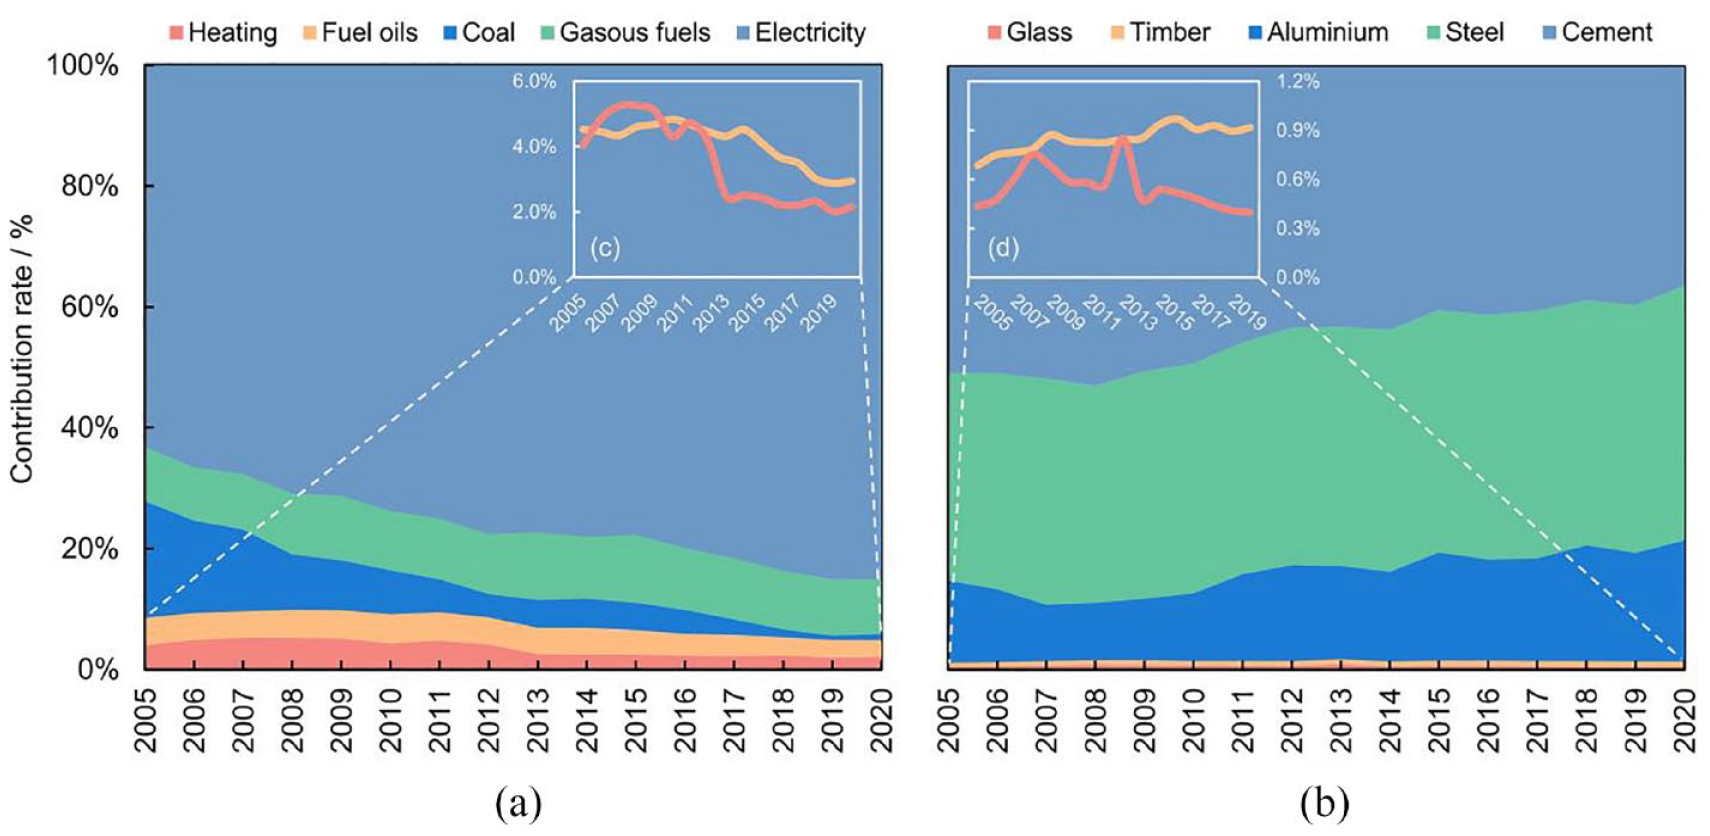
Contribution of various factors to BCEs in 2005~2020: (a) different energy types and (b) different material types. The contributions of (c) energy and (d) materials are enlarged as they are too small in the main plots.
Various materials were the main sources of implied carbon emissions from buildings, which were reflected mainly in the production and transportation stage and the construction and demolition stage. Their changes over the 16-year period showed alternating increases and decreases (Figure 7b). Of the five materials, steel and cement were the main contributors, with a combined share between 79% and 90%. Interestingly, the shares of steel and aluminum rose, whereas cement, a traditional building material, showed the opposite trend. For example, in 2020, the combined contribution of steel and aluminum approached 63%, whereas the share of cement decreased from an initial value of 50.6% to 36.4%. Furthermore, the contributions of wood and glass remained minimal, consistently fluctuating below 1%.
Analysis of factors influencing BCEs
The driving effects of each influencing factor were relatively stable across time but showed anomalies in the 2016~2020 time period (Figure 8). During this period, most of the influencing factors exhibited a significantly greater contribution rate to the driving effect than in the other periods, with the negative driving effect contribution rate of the CI as high as −73.4%. In contrast, the contributions from BA and BG were considerably lower than in other periods. Overall, the driving effects in the latter 11 years were stronger than those in the first 11 years, with PG, BA and POP showing average positive contributions exceeding 20%. This was in contrast to the weaker driving effects observed from the two social indicators, POP and UR.
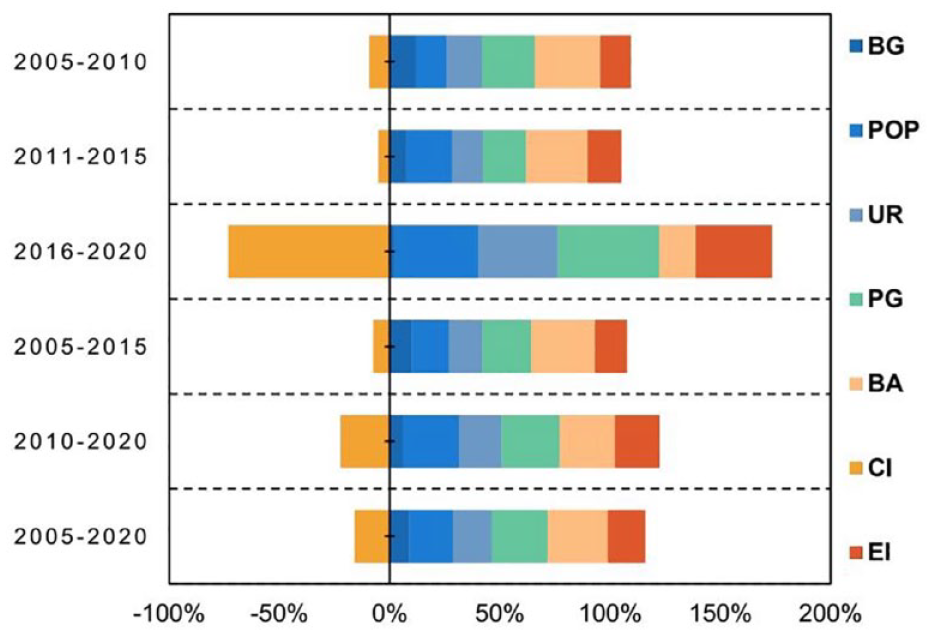
Contribution decomposition of the driving effect. See Table 1 for explanations of the abbreviations.
From the perspective of the stages of the whole process (Figure 9a), the production and transportation stage of building materials presented characteristics close to those of the whole process due to having the highest contribution among the three processes. The driving contributions of the influencing factors were more balanced, among which the positive driving contributions of PG and BA were stronger, both exceeding 25%. CI had a certain negative driving effect. Whereas the operation and construction stages were characterized similarly, the BA and BG had significantly weaker impacts on them, whereas EI had a greater contribution. In terms of the overall ranking change in each stage (Figure 9c), the positive driving contributions of PG and EI were the highest, whereas CI, the only negative driver, ascended from the lowest ranking to become the largest driver since 2010.
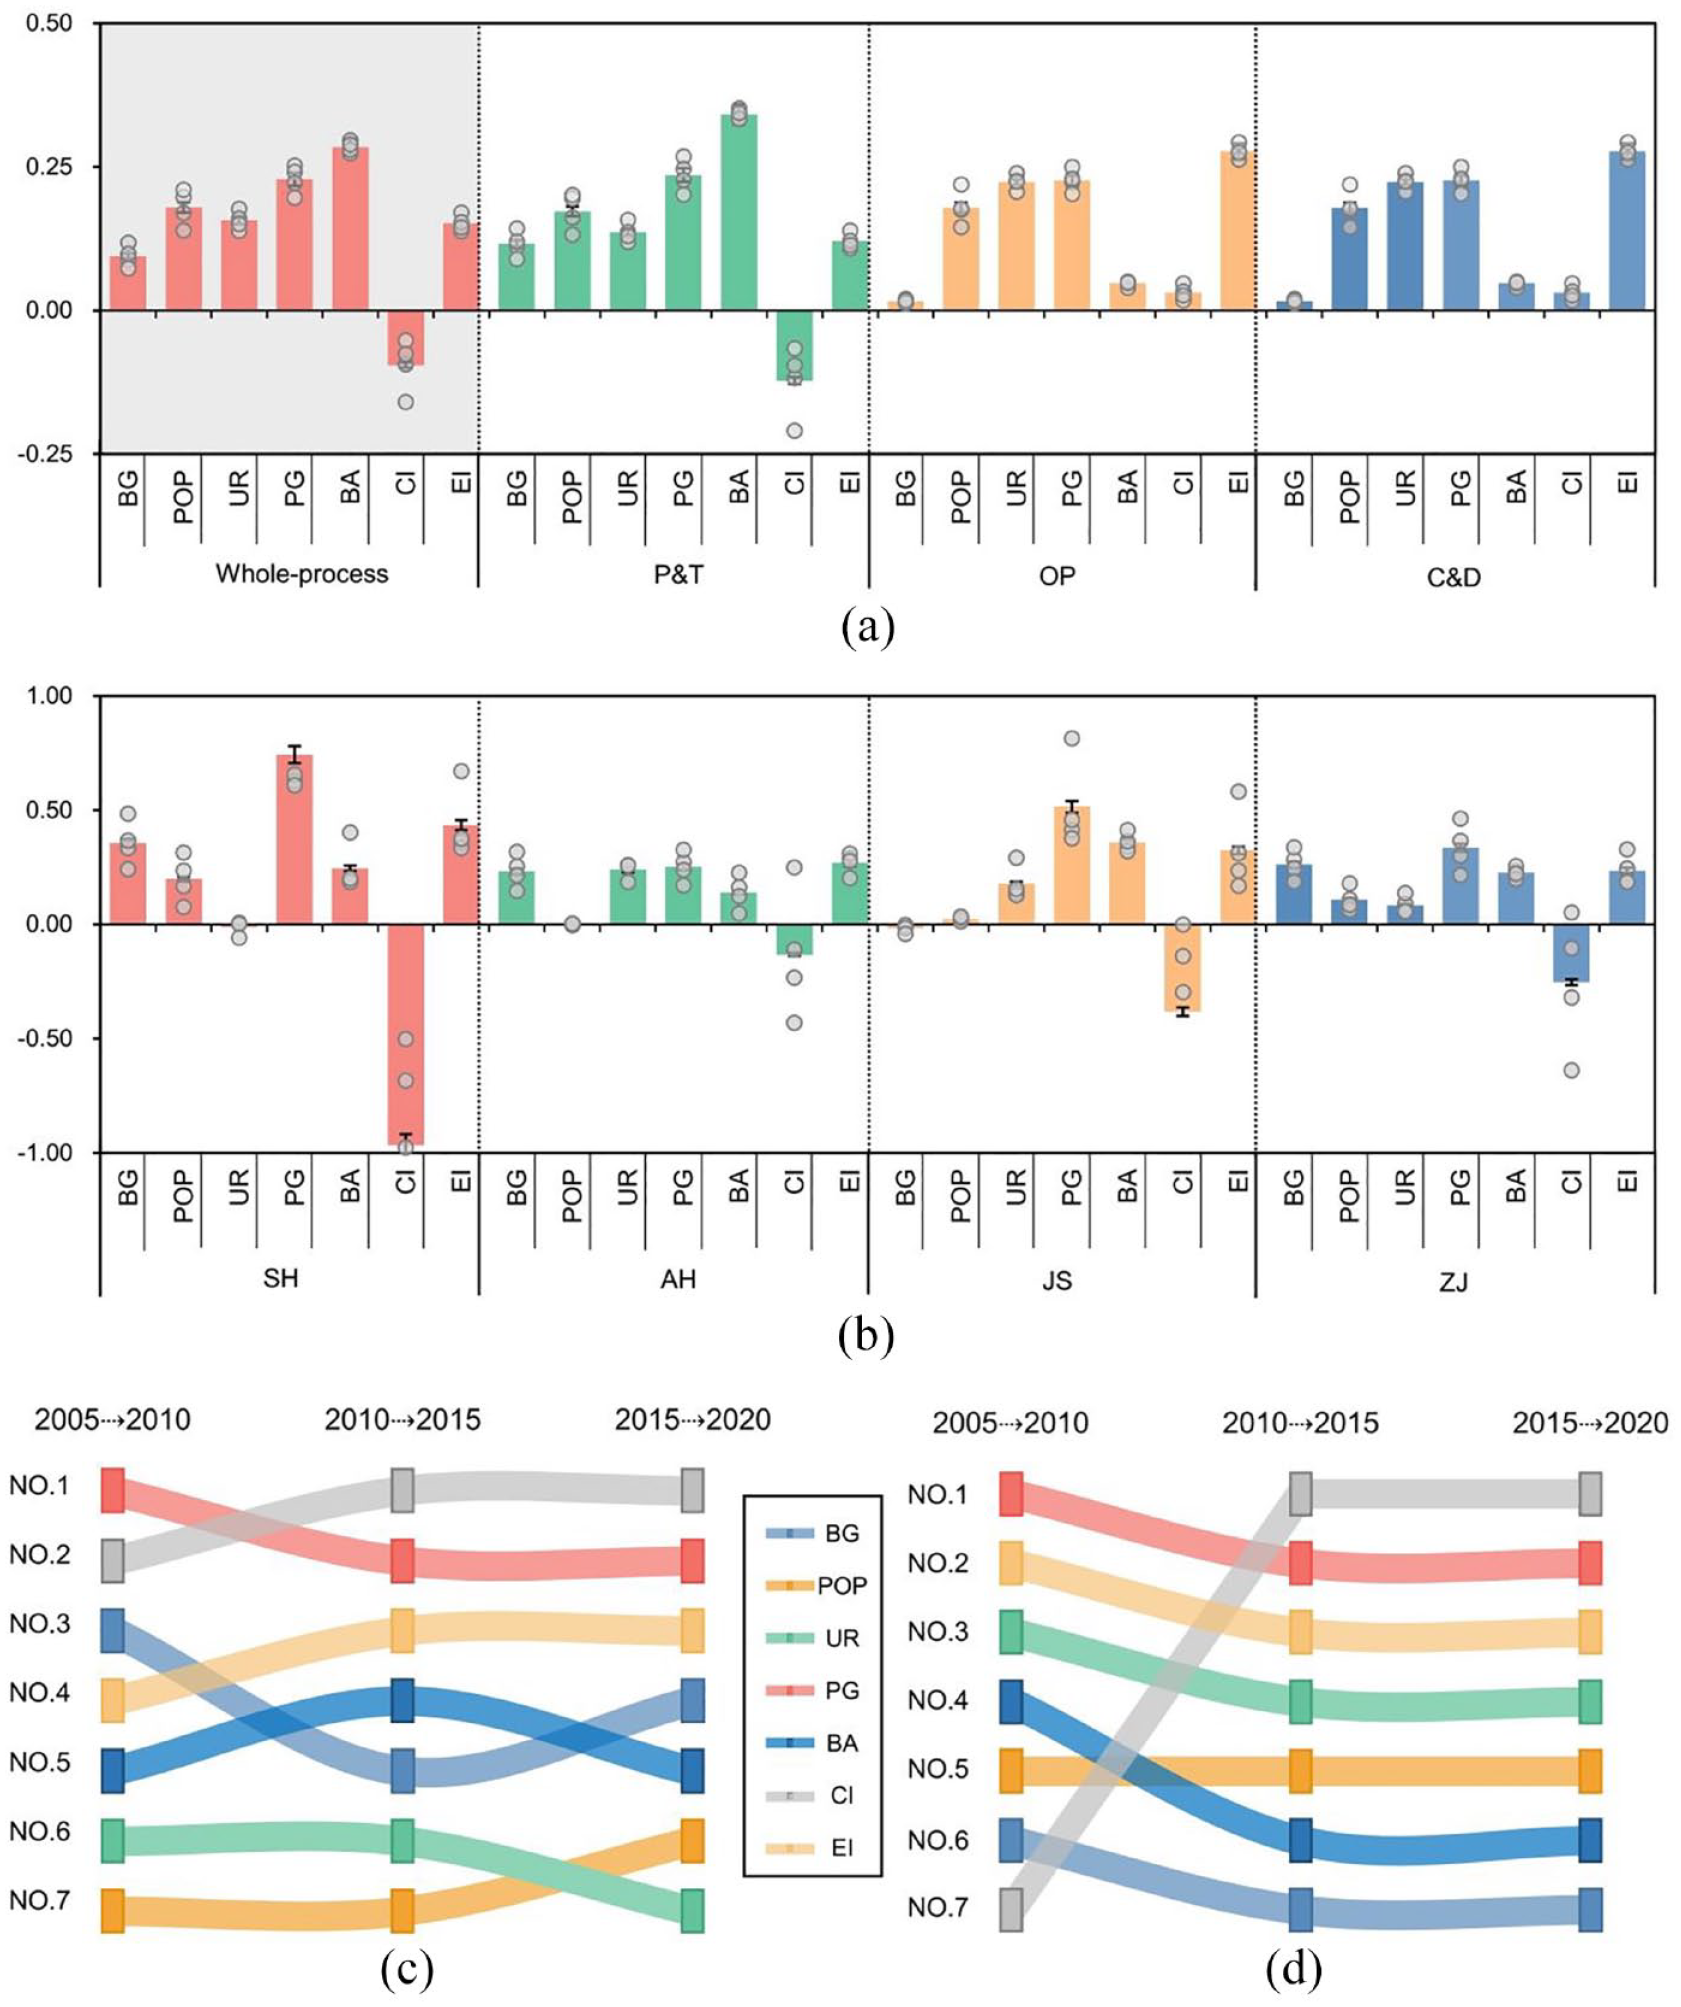
Contribution of each influencing factor to BCEs: (a) by stage and (b) by region; Ranking changes by influencing factor: (c) by stage and (d) by region. See Table 1 for explanations of the abbreviations.
In terms of each region (Figure 9b), the driving effect of each influencing factor on Shanghai was more significant, in which PG and CI were the largest positive and negative influencing factors, respectively. The driving effect was especially significant, with an average contribution rate of more than 75%, compared with the extremely high UR of Shanghai, which has the lowest contribution rate of nearly 0% to its BCEs. In contrast, Shanghai has the lowest contribution to its BCEs, at nearly 0%. The contribution of POP to Anhui and Jiangsu Provinces was also extremely low. In contrast, the contribution of each influencing factor to Zhejiang Province was more balanced, with none exceeding 50%. In terms of the average ranking of each factor in each region (Figure 9d), no factors changed significantly; overall, PG and CI were still the leading contributors, with UR and POP having a lower influence on each region.
Discussion
Differences of BCEs in different regions
In this work, we analyzed the spatio-temporal evolution characteristics of BCEs in the YRDUA and the driving forces in each region over the last 16 years from the perspective of regional differences. The cities of Nantong, Shaoxing, and Hefei in the study area are core emission regions due to their highly developed construction industries. In contrast, the construction industry in Anhui Province, with the exception of Hefei, is relatively underdeveloped, dragging the construction center to a central-east position, resulting in localized spatial heterogeneity. However, the polycentric pattern and uneven distribution of BCEs in this urban agglomeration may trigger the continued expansion of carbon emissions (Wang, 2022) and further restrict the integrated development of the region. As a result, the government must realize coordinated development among urban agglomerations through policy guidance, thus reducing carbon emissions.
The influencing factors differ in their driving forces on the region, with carbon intensity (CI) and per capita GDP (PG) being the strongest negative and positive drivers of the BCEs from the clusters, respectively, which is consistent with the main conclusions of Chen et al. (2023) and Li et al. (2022). These two main factors have the strongest effects on economically developed Shanghai, which is related to the implementation of energy-saving policies and advanced energy-saving building technologies (Lv et al., 2021; Shanghai Municipal Commission of Housing and Urban-Rural Development, 2019; Shanghai Municipal People’s Government, 2024). Shaoxing City in Zhejiang Province and Anqing City in Anhui Province are also examples. Compared with Anqing City, Shaoxing, with a 1.126 million larger permanent population, can generate a 13.4 times greater gross construction output (National Bureau of Statistics, 2006b). These data suggest that the population has a weak influence on the development of the regional construction industry, which corresponds to the weak effect of population on the results and the idea of Chen et al. (2023) that population has a limited impact on developing the building business.
From the results, we suggest that a differentiated strategy is needed for YRDUA’s management of BCEs, which emphasizes not only the strict restriction of emissions in high-emission regions but also the economic incentives and technical support for low-emission regions (Lu et al., 2023). It also aims at interregional integration as well as green and coordinated development (General Office of the State Council of the People`s Republic of China, 2019, 2024). Additionally, the government and other departments should fully use their leading roles and promote cross-learning of green experiences within the region (Fu et al., 2020). It is recommended that the spatio-temporal evolution characteristics and internal driving mechanisms should be considered when formulating policies. The YRDUA should be encouraged to strengthen interregional mutual cooperation and promote industrial upgrading to achieve reasonable control of BCEs, which help to jointly promote sustainable development and dual carbon goals within the region.
Emission reduction measures for BCEs at different stages
The YRDUA should develop tailored carbon reduction programs for each sector. During the building materials production stage, we should focus on the cement sector, which is a key driver of the construction industry and climate change in general (Cheng et al., 2023). Moreover, we can identify the best alternative by comparing different building materials (Abera, 2024; Lai et al., 2023) and reduce BCEs at an optimal cost. In particular, Ultra-High Performance Concrete (UHPC) results in lower energy consumption and carbon emissions (Wang et al., 2024b). Sheheryar et al. (2021) experimentally demonstrated that UHPC can reduce the cumulative CO2 emissions of cement and concrete by more than 17% over the studied simulation period, indicating considerable potential for carbon reduction. (Li et al., 2020). At the building materials transportation stage, multistage intermodal transportation can be used to reduce costs, emissions and delivery times (Singh et al., 2024; Wang et al., 2023a). For the YRDUA, which has a well-developed transportation network, policies such as reducing the cost of interprovincial transportation can also be formulated to improve the efficiency of interregional resource circulation, reducing costs and emissions.
The building operation phase, while having lower BCEs than the building materials production and transportation phase, is continuing to increase its contribution, particularly in residential buildings (Atmaca and Atmaca, 2015; Li et al., 2023b). At this stage, although the ‘coal-to-electricity’ initiative has been very successful (Lin and Jia, 2020), carbon emissions from energy consumption dominate the total emissions of the operation stage as the demand for electricity increases. Among the existing technologies, photovoltaic roofs (RPVs) and roof gardens (GRs) are feasible ways to reduce emissions. According to Zhang et al. (2023), RPVs have the potential to reduce 4 billion tons of emissions in 354 Chinese cities (BTs), making it an important measure for reducing the energy consumption of coal power and BCEs (Tang, 2021), whereas rooftop gardens are a more economical option (Cascone et al., 2018). Notably, when 0.06 kg CO2 per kWh is used in summer and winter, the annual consumption of green roofs is reduced by approximately 33%, and the electricity used for cooling is reduced by 10,300 kWh, resulting in a reduction of 203.4 tons of CO2, which also serves as a rainwater intercept and cooler (Wang et al., 2023b). Additionally, PV-Green Roof (PV-GR) systems, which integrate the previous two systems, also have great potential. Chen et al. (2024b) analyzed Xiamen city, where a PV-GR system was implemented and reported that the annual carbon offset was as high as 29.3%.
Building construction and demolition processes, the smallest contributors to the whole process, still play a crucial role in carbon reduction and resource recycling (Zhu et al., 2022). At the construction stage, efforts to promote assembled buildings should be intensified (General Office of the State Council, 2016; Hong et al., 2018). However, according to the research of Luo et al. (2021), Anhui Province in our study area realized less than 20% of the development target of prefabricated buildings, whereas Hao et al. (2020) noted that the adoption rate of prefabricated components recommended by the Jiangsu provincial government is 50%, reducing carbon emissions by approximately 15% throughout the process and proving this technology is valuable for building carbon reduction. Moreover, at the building demolition stage, secondary use and recycling of aggregates from demolition waste has already shown promise as an available alternative to traditional aggregates (Abera, 2024). According to Liu and Li (2023), the comprehensive utilization of 1 t of construction waste can reduce emissions by approximately 63.80 kgCO2eq. Moreover, the aggregate powder obtained from waste aggregates can significantly reduce the hidden carbon emissions of UHPC in the production of building materials by replacing cement (Zhang et al., 2024c), creating a positive feedback loop for reducing BCEs. Other measures that can save energy and reduce emissions are listed in Online Supplemental Table S2. By analyzing the stages and sectors with high contribution through the whole process and seriously implementing the abovementioned measures (Huang et al., 2024), the BCEs in the region can be fundamentally reduced.
Future perspectives
This study also has several limitations. First, owing to the inherent errors in the statistical yearbook data, this study is able to estimate BCEs only via the relatively accurate accounting framework from previous studies. Second, we have not compared the differences between cities at each stage because city-scale BCEs from the whole process are related to each region’s specific accounting system and standard. Furthermore, when we explore the influencing factors, we have focused on only a few important economic and social factors individually while overlooking the climate and ecological factors (Li et al., 2024; Peng et al., 2023) and the interaction mechanism among them. In the future, spatial resolution and comparability can be greatly improved by combining globally released 3D architectural data (Che et al., 2024; Frolking et al., 2024; Li et al., 2023a; Ma et al., 2023) and using spatial allocation models, instead of only statistical data based on rough administrative boundaries. At the same time, there is a need to broaden the types of factors influencing BCEs and to develop new methods compatible with the expanded framework, thereby more accurately analyzing the characteristics of BCEs in different regions and stages.
Conclusions
This study analyzed the spatio-temporal evolution of BCEs in the YRDUA from 2005 to 2020 and the dynamic changes in the three stages of the BCEs via GIS-LCA integrated framework. The growth of BCEs showed a trend of ‘slow in the east and fast in the west’ with several spatial clusters, and the growth of BCEs changed ‘from east to west’ in the predominant direction. Additionally, the materials production and transportation stage contributed the most to the whole-process BCEs, and the power and cement sectors were the main emission sources. In terms of influencing factors, we found that carbon intensity and GDP per capita are the main negative and positive drivers, respectively.
In the future, the following policy recommendations are proposed to promote the low-carbon development of the construction industry in the YRDUA. First, differentiated regional emission reduction policies should be implemented to strengthen regulation and control in high-emission regions while encouraging attention to energy conservation and emission reduction in the economic development of the western region. Second, various departments need to launch targeted carbon reduction programs, and the government should also vigorously cooperate with and promote these new materials and technologies to effectively reduce carbon emissions through technological innovation and industrial upgrading. Additionally, interregional cooperation and coordination should be enhanced to build a synergistic mechanism for the green, low-carbon development of the YRDUA, thus facilitating the region’s overall goal of peaking carbon.
Supplemental Material
sj-docx-1-tee-10.1177_2754124X241305302 – Supplemental material for Spatio-temporal dynamics of building carbon emissions via a GIS-LCA integrated framework
Supplemental material, sj-docx-1-tee-10.1177_2754124X241305302 for Spatio-temporal dynamics of building carbon emissions via a GIS-LCA integrated framework by Zheng Wan, Tianci Gu, Xue-Chao Wang, Shiyu Zhang, Yizhou Xie, Ling Zhang and Qingxu Huang in Transactions in Earth, Environment, and Sustainability
Footnotes
Acknowledgements
We are grateful to the editors and the anonymous reviewers for their valuable comments on improving the manuscript.
Author contributions
Original idea and writing original draft – Z.W., Q.H.; writing, review and editing – X.C.W., T.G., S.Z., Y.X., L.Z. All authors critically reviewed the manuscript and approved the final version.
Declaration of conflicting interests
The author(s) declared no potential conflicts of interest with respect to the research, authorship, and/or publication of this article.
Funding
The author(s) disclosed receipt of the following financial support for the research, authorship, and/or publication of this article: This research was supported by the National Natural Science Foundation of China (42361144859), the Beijing Nova Program (20220484163), and the Beijing Normal University Tang Scholar.
Supplemental material
Supplemental material for this article is available online.
Author biographies
References
Supplementary Material
Please find the following supplemental material available below.
For Open Access articles published under a Creative Commons License, all supplemental material carries the same license as the article it is associated with.
For non-Open Access articles published, all supplemental material carries a non-exclusive license, and permission requests for re-use of supplemental material or any part of supplemental material shall be sent directly to the copyright owner as specified in the copyright notice associated with the article.