
Abstract
China is the world's largest carbon emitter, its carbon peaking and carbon neutrality goals significantly reduce climate change and global warming problems. Although the Chinese government proposed carbon emissions will peak by 2030, how do different development models affect carbon emissions in the future? Here, we analyzed the spatial and temporal trends of carbon emissions over the past two decades. Then we constructed the STIRPAT carbon emissions model based on ridge regression analysis. Finally, one national STIRPAT model and eight STIRPAT models at the sub-regional scales were generated because the effects of population, economy, and energy consumption vary significantly across regions and periods. Meanwhile, we established nine different future development models based on various population, economy, and energy consumption levels, and forecast their carbon emissions from 2020 to 2060 by eight sub-region STIRPAT models. Our results documented that (1) China's carbon emissions significantly increased by 445.79 million-ton/yr between 2000 and 2019. Meanwhile, population, total energy consumption, and GDP were growing at a rate of 7.60 million people/yr, 185.37 million-ton/yr, and 4791.74 billion-yuan/yr, respectively. (2) Ridge regression results indicated that carbon emissions are positively influenced by population, economic growth, and energy consumption in all regions, but the degree of influence varies across sub-regions. (3) In 2060, carbon emissions will be lowest across all variables at low levels of development and highest at high levels of development. Meanwhile, low energy consumption and population levels are possibly the main directions for controlling carbon emissions in the future. The findings indicate that the carbon peak target could be achieved by 2030 by controlling population and energy consumption alone. However, relying solely on these strategies may pose significant challenges in meeting the dual carbon targets, which emphasizes the need for a scientific foundation to inform low-carbon development policies. The findings provide a scientific basis and reference for the low-carbon sustainable development in China.
Introduction
The ongoing surge in carbon emissions has led to numerous climatic and environmental issues, including global warming, urban heat islands, and a decline in biodiversity (Lenton et al., 2019). These issues carry serious implications for both natural ecosystems and human survival and development (Cheng et al., 2023; Wang et al., 2021). For several decades, governments worldwide have been galvanizing efforts and pledging to reduce carbon emissions (Huang et al., 2024). Yet, the global climate crisis persists, unresolved. To neutralize carbon emissions and mitigate global warming, a global consensus on temperature control has been proposed based on the Paris Agreement, which states that the temperature will increase by 2°C by the end of the century compared to the preindustrial level, and we should try to control the increased temperature within 1.5°C (Change, 2018; Horowitz, 2016). Consequently, an increasing number of nations have pledged to achieve carbon neutrality (Black et al., 2021; Huang et al., 2024). In this regard, China has also articulated its own ‘net-zero’ carbon emission strategy (Huang et al., 2024). In 2020, China announced its double carbon (carbon peaking and carbon neutrality) goals, with the ambition to peak carbon emissions by 2030 and achieve carbon neutrality by 2060 (Zhao et al., 2023). Precisely forecasting future carbon emissions is crucial for assessing the trajectory toward carbon neutrality and for informing ecological and economic policy decisions. The key challenge is to develop models capable of reliably forecasting future emission trends.
Currently, carbon emission forecasting research has primarily focused on two approaches: time series forecasting and factor-based forecasting. Time series forecasting is limited by small data volumes, which constrains model selection and training, leading to less accurate predictions. Factor-based forecasting, which utilizes relevant factors to predict carbon emissions, faces challenges related to data collection and impact factor selection. Some studies (such as Ma et al., 2019; Stevens et al., 2020; Waheed et al., 2019) have investigated the driving mechanisms of carbon emission and tried to explore the most effective way to reduce carbon emission. Economic and energy structure effects are the main positive drivers for Chinese carbon emissions, while population is a positive driver with a lower effect (Ma et al., 2019). The relationship among carbon emission, economic development, and energy consumption has been discussed from a global perspective (Waheed et al., 2019), and energy consumption and economic development increased carbon emissions overall. However, carbon emission is negatively related to income and financial levels (Milindi and Inglesi-Lotz, 2023). High-income and high financial levels would reduce carbon emissions, while low-income and low financial levels would exacerbate carbon emissions (Ehigiamusoe and Lean, 2019). The effect of population size on carbon emission is lower, while the effect of population structure on carbon emission is larger (Huang et al., 2024; Zhu and Peng, 2012). Moreover, the relationship among economic growth, energy consumption, and carbon emission was demonstrated for different regions from 1947 to 2005 (Niu et al., 2011), but this relationship is complex because these variables are diverse. Urbanization, industrial structure, and land use intensity also play critical roles in influencing carbon emissions. For instance, increased urbanization tends to elevate carbon emissions due to higher energy demands and changes in land use patterns (Fan and Zhou, 2019; Sun and Huang, 2020). Moreover, shifts in industrial structure from heavy manufacturing to service-based industries can lead to a reduction in carbon emissions, as less energy-intensive sectors gain prominence (Liu et al., 2022). Additionally, land use intensity, particularly in the context of agricultural and industrial expansion, significantly impacts carbon emissions through changes in land cover and resource exploitation (Houghton et al., 2012). These factors contribute to the complexity of carbon emission trends across different regions and periods.
China has already articulated a multitude of strategies aimed at emission reduction (Jiang et al., 2013). In 2020, China’s carbon emissions experienced a modest increase of 2% over 2019 levels, with a growth rate significantly subdued compared to other years (Fang et al., 2021). Concurrently, carbon intensity (carbon emissions per unit of GDP) decreased by 18.8% in 2020 compared to 2015. The proportion of non-fossil energy consumption in total primary energy consumption rose to 15.9%, while the forest stock surpassed the initial goal of 16.5 billion cubic meters, reaching over 17.5 billion cubic meters (Ren et al., 2021). However, China remains the largest contributor to global carbon emissions, responsible for 28.8% of the world’s carbon emissions from energy sources (Huang et al., 2024). Given its status as the world's most populous nation, China's energy demands are substantial (Zhu and Peng, 2012). The country’s industrial sector has historically relied on coal resources, and any adjustments to the energy mix to reduce carbon emissions could potentially impact the productivity of the original industrial sectors (Niu et al., 2011). Furthermore, the timeframe China has allocated for the duration from carbon peaking to carbon neutrality is just 30 years, which is considerably shorter than that of other nations, placing immense pressure on China to enhance energy efficiency and reduce carbon emissions. These emission reduction achievements and the still severe challenges bring uncertainty to the realization of the double carbon goals. Therefore, a thorough analysis of the historical spatiotemporal patterns and a forecast for the future trends of carbon emissions is imperative.
In this study, we first analyzed the spatiotemporal patterns of carbon emissions in China from 2000 to 2019. Then, carbon emission regression analysis was performed to explore the driving mechanisms and construct forecasting models for future development. Third, nine development models for the future were set based on different economic, population, and energy consumption levels. Their carbon emissions from 2020 to 2060 were forecast by the STIRPAT model. Finally, we proposed a low-carbon strategy and long-term scientific development recommendations for China to achieve the double carbon goals. The specific objectives are (1) to reveal the historical spatiotemporal patterns of carbon emissions in China; (2) to demonstrate the driving mechanisms of carbon emissions; and (3) to forecast the future carbon emission trends in different development models. Our findings could provide a theoretical basis for the coordinated development of economic growth and low carbon emissions.
Materials and methods
The study area
The study area (Figure 1) encompasses mainland China, excluding Hong Kong, Macao, and Taiwan. This vast country features a diverse landscape, with the east characterized by numerous plains while the west comprises many plateaus and mountains. The eastern territory experiences a monsoon climate, which can be further classified into subtropical, temperate, and tropical variations. In contrast, the northwestern region has a temperate continental climate, while the Qinghai-Tibet Plateau presents exhibits an alpine climate. From south to north, the climate zones include tropical, subtropical, warm temperate, middle temperate, cold temperate, and the Qinghai-Tibet Plateau zone. Population density decreases from the southeast coast to the northwest inland. The distribution of the population is extremely unbalanced, with the majority concentrated in the southeastern region, while the northwestern part is sparsely populated. This disparity is attributed to the overall development of industry and the service industry in coastal areas, the prosperity of import and export trade, and the general economic growth. Consequently, we divided the study area into eight subregions based on varying levels of climate, economy, and population (Figure 1).
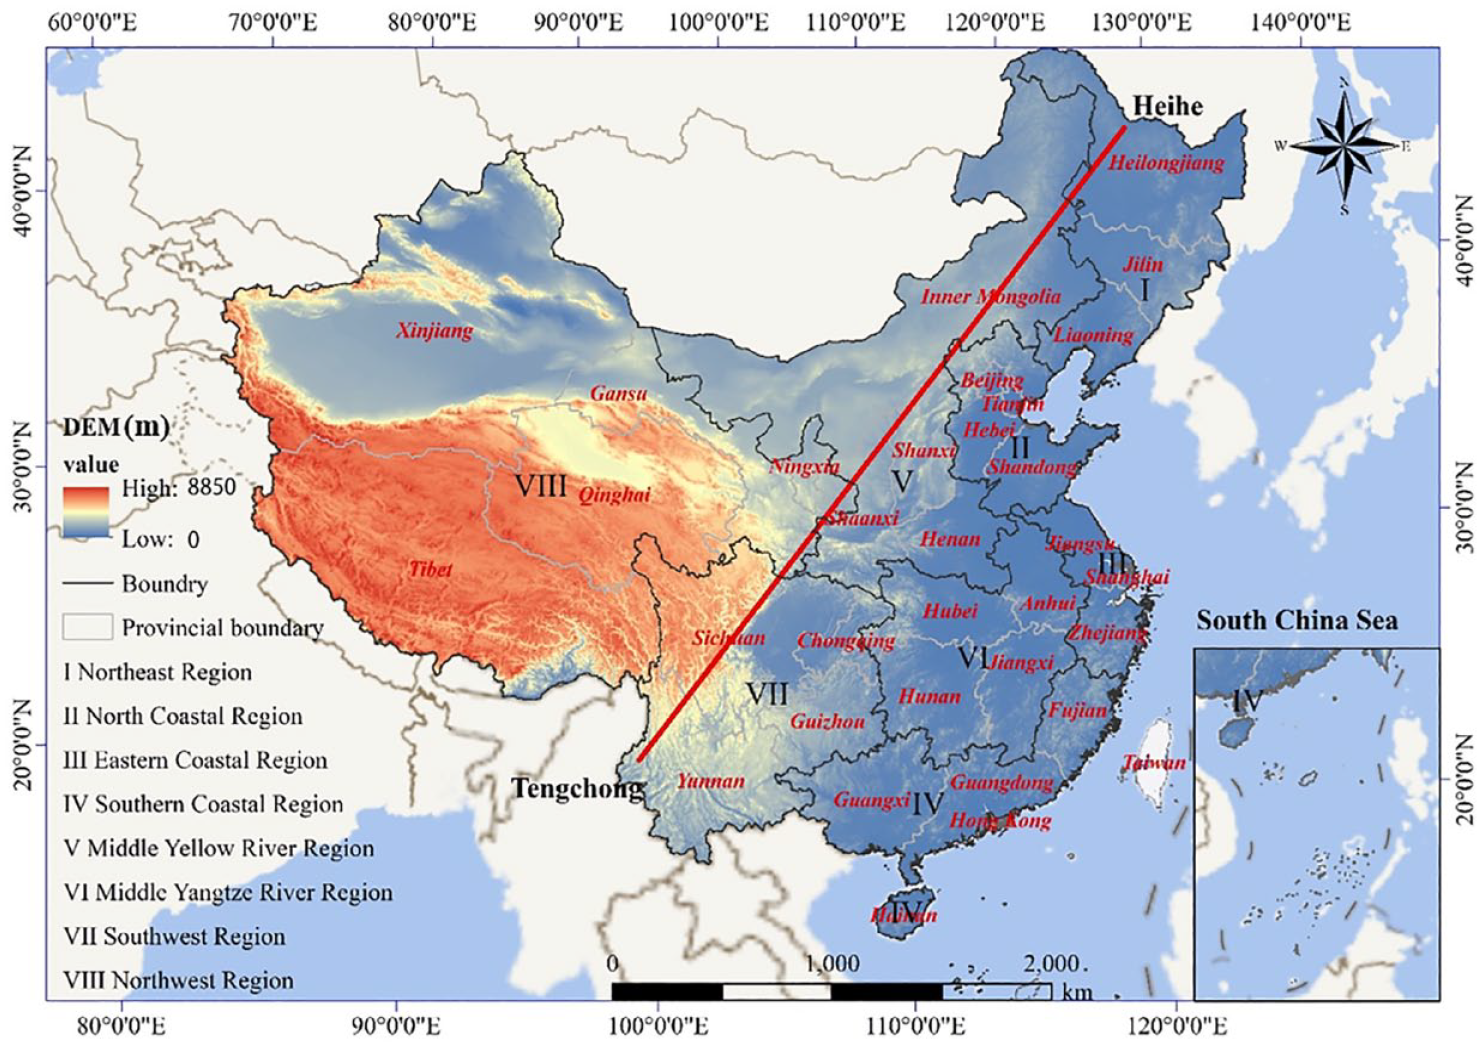
The study area and its eight sub-regions.
Data sources and processing
Carbon emission data from 31 provinces in China during 2000-2019 were obtained from the Carbon Emission Accounts and Datasets (CEADs, https://www.ceads.net.cn/), provided by the IPCC Geographical Emissions Accounting Methodology (Mi et al., 2017; Shan et al., 2016). Meanwhile, statistical data (such as total energy consumption, population, and GDP) were obtained from the China Statistical Yearbook from 2001 to 2020. All data were standardized to better compare the individual effects.
According to the research framework (Figure 2), our study consists of three main parts. First, we analyzed the spatiotemporal patterns of carbon emissions in China during 2000-2019. Second, we applied various regression techniques to explore the driving mechanisms behind these emissions. We selected the ridge regression analysis to generate the simulated carbon emissions from 2000 to 2019, comparing the simulated values with actual emissions to verify the reliability of the regression model. Third, we established nine development models based on three levels: economic growth, population, and energy consumption, reflecting historical trends. The STIRPAT model was then employed at both national and provincial scales to project future carbon emission scenarios from 2020 to 2060.
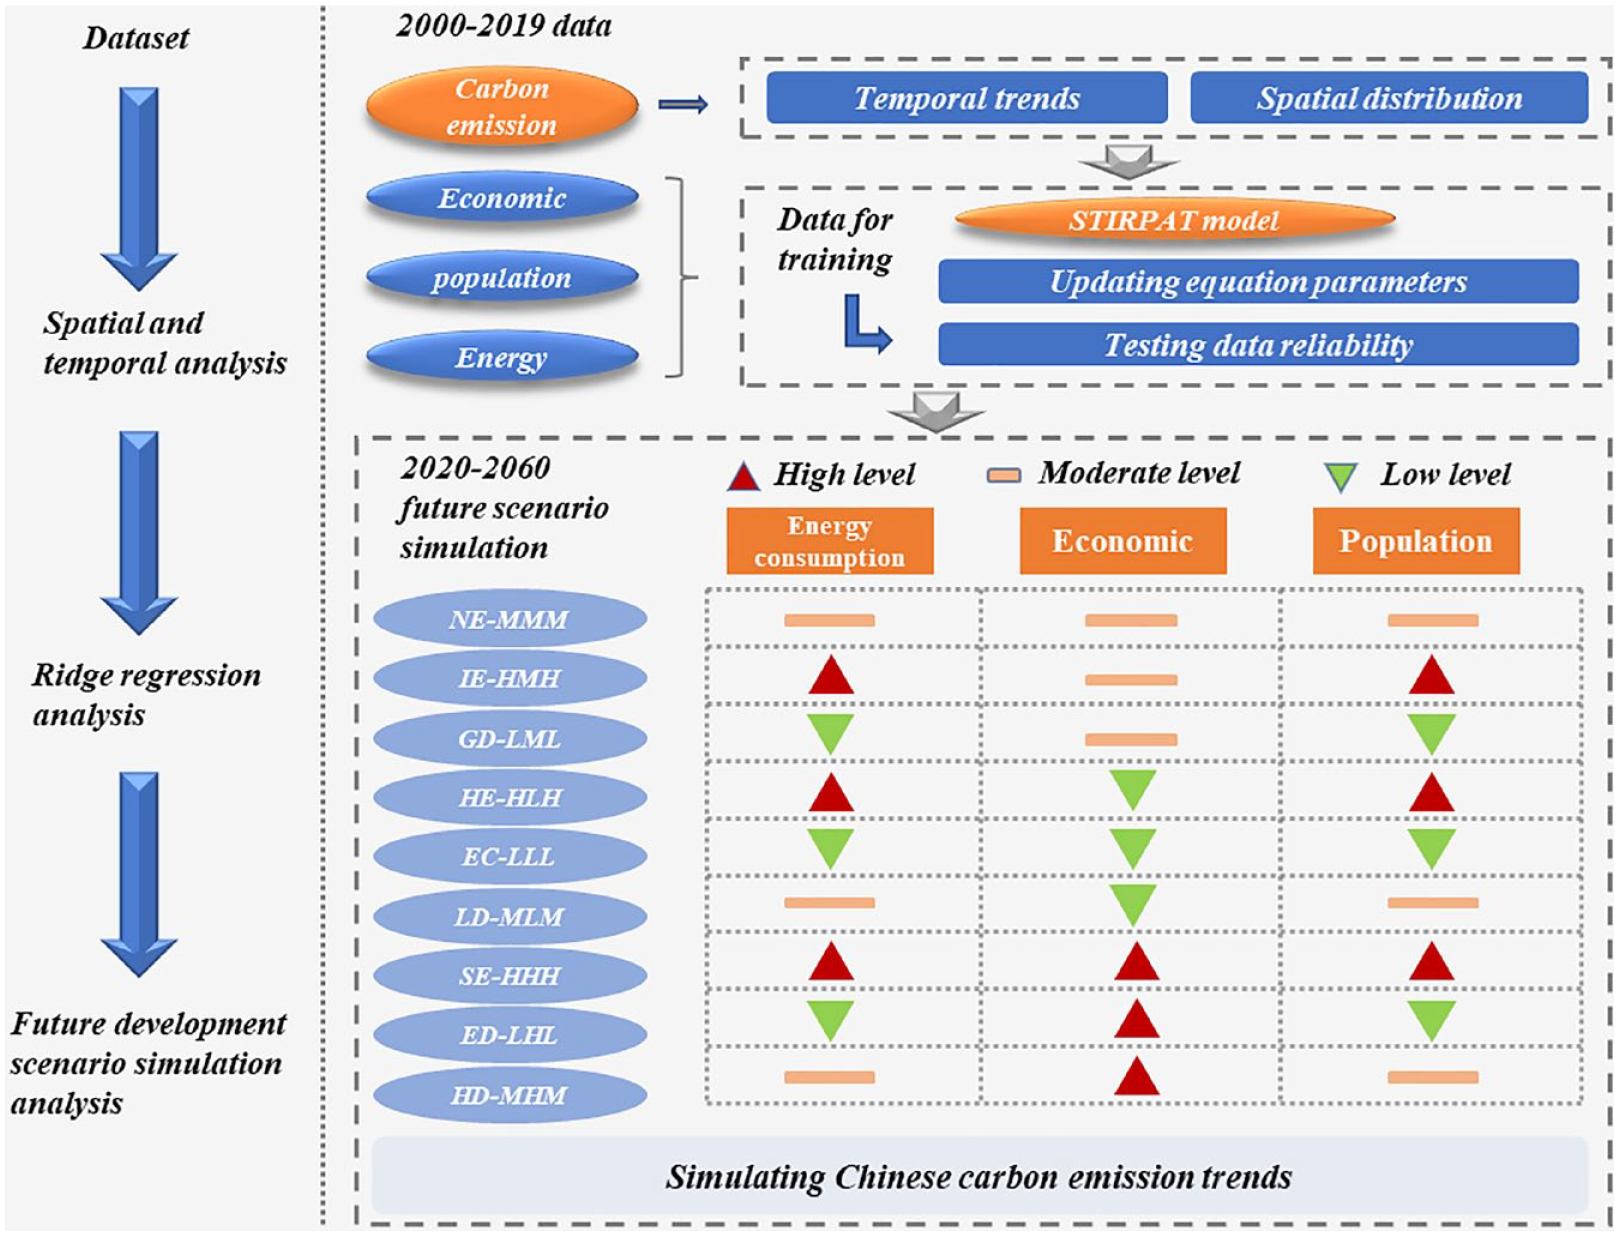
Flowchart of this study.
STIRPAT model
The STIRPAT model could reveal the individual effects of economic, demographic, and technological variables on the environment (York et al., 2003), and thus has been widely applied in carbon emission forecasting studies (Fang et al., 2018, 2021; Huang et al., 2019; Wang et al., 2019; Wu et al., 2018). It has excellent expandability. In this paper, we constructed the STIRPAT model (Eq.1) by using different energy consumption, economic, and population levels as independent variables and total carbon emission as the dependent variable.

Where C denotes total carbon emission (million tons), E denotes energy consumption level, R denotes economic level, and P denotes population level. Meanwhile,
Taking the logarithm of both sides of Eq.1, it can be transformed into a linear equation (Eq.2).

Independent and dependent variables at the national and provincial scales from 2000 to 2019 were used to fit Eq.2, demonstrating the driving mechanism of carbon emission. Then, we used the fitted regression models to simulate carbon emissions from 2000 to 2019. Due to the variations in climate, economy, and population, we got eight fitted models for eight sub-regions. We were able to get two simulated Chinese carbon emission values. One is generated by the national regression model, and the other is the sum of carbon emission values in eight sub-regions generated by these eight sub-region regression models. Finally, we compared the two simulated values to the actual carbon emissions in the past 20 years to verify the reliability of these STIRPAT models, which helped us choose to use national and provincial fitted models to simulate future carbon emissions.
Scenario setting in future
Based on total energy consumption, GDP, and population (population size) across eight sub-regions in China over the past 20 years, we propose various development models for the future. An increase in population is always accompanied by increased energy consumption (Khan et al., 2021; Lizunkov et al., 2018). Therefore, the levels of population and energy consumption level are maintained in a synergistic manner (i.e., one of the same high, medium, and low levels), while economic development is significantly reliant on energy, it does not imply that increased energy consumption always translates to economic growth (Waheed et al., 2019). With this viewpoint, we outline nine future scenarios (Table 1).
Carbon emission scenario setting in different development models.
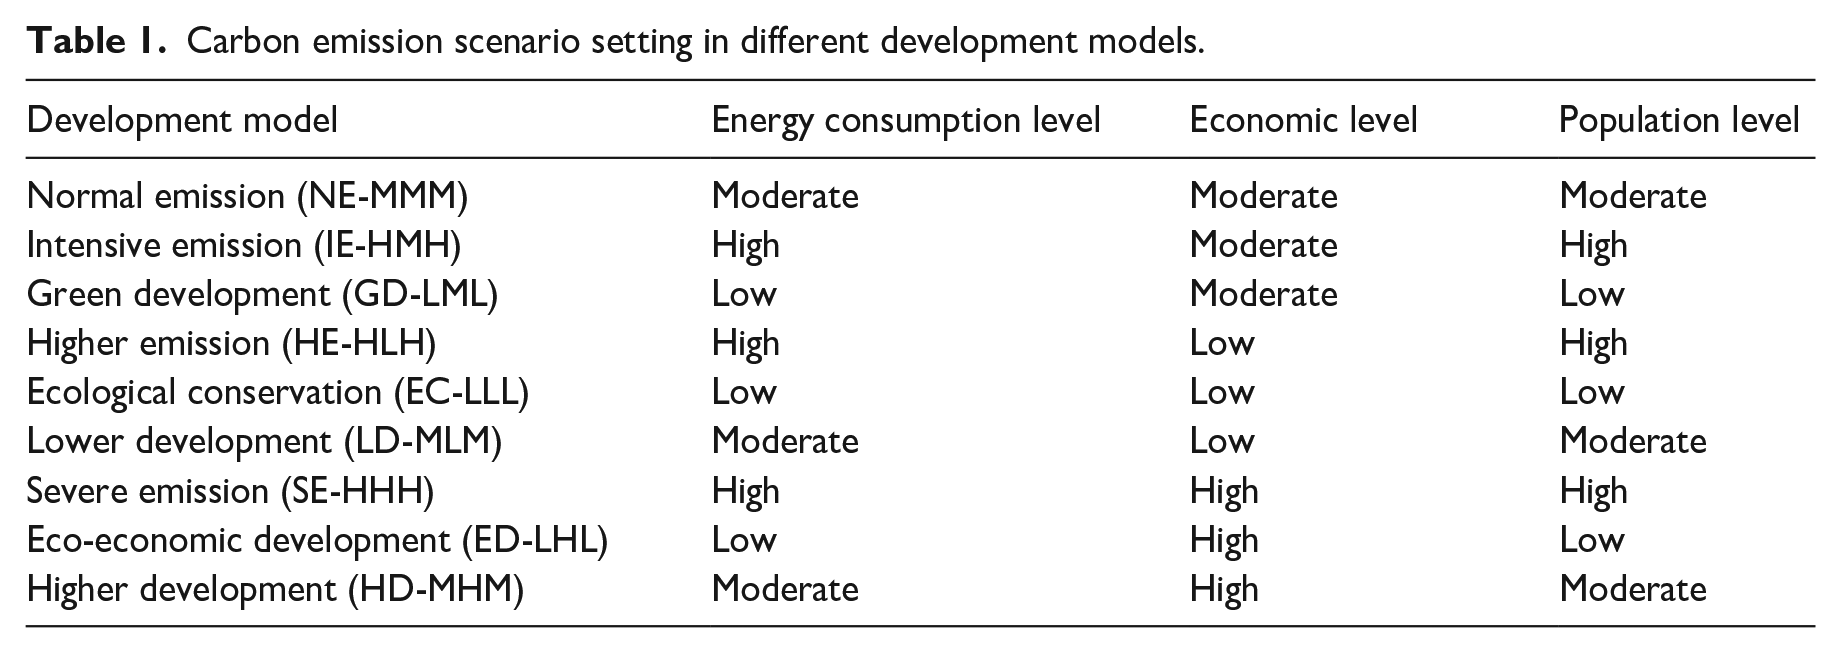
The total energy consumption level in the future is determined by the average annual growth rate and average annual growth magnitude of the indicators between 2000 and 2019. Regional GDP in the future is determined by the average annual growth rate of GDP from 2000 to 2019. The future population development pattern is determined by the average annual growth rate and the expected peak. The high level refers to a peak in 2040, the moderate level refers to a peak in 2030, and the low level refers to a peak in 2020. All starting values are based on 2019 data, and these parameters of different levels in nine future development scenarios (Table 1) are set for Northeast Region (Online Supplementary Table S1), North Coastal Region (Online Supplementary Table S2), Eastern Coastal Region (Online Supplementary Table S3), Southern Coastal Region (Online Supplementary Table S4), Middle Yellow River Region (Online Supplementary Table S5), Middle Yangtze River Region (Online Supplementary Table S6), Southwest Region (Online Supplementary Table S7) and Northwest Region (Online Supplementary Table S8).
Results
Spatial and temporal variations of carbon emissions from 2000 to 2019
China's total carbon emissions rose from 3053.32 Mt in 2000 to 10881.69 Mt in 2019 (Figure 3a), reflecting a growth of 256.39%. Among the contributions of the eight sub-regions, the North Coastal Region accounted for the most of China's total carbon emissions from 2000 to 2019, followed by the Middle Yellow River Region (Figure 3b). The Northwest Region had the lowest carbon emissions during this period. Overall, carbon emissions increased across all sub-regions from 2000 to 2019, although the rate of increase declined over the years.
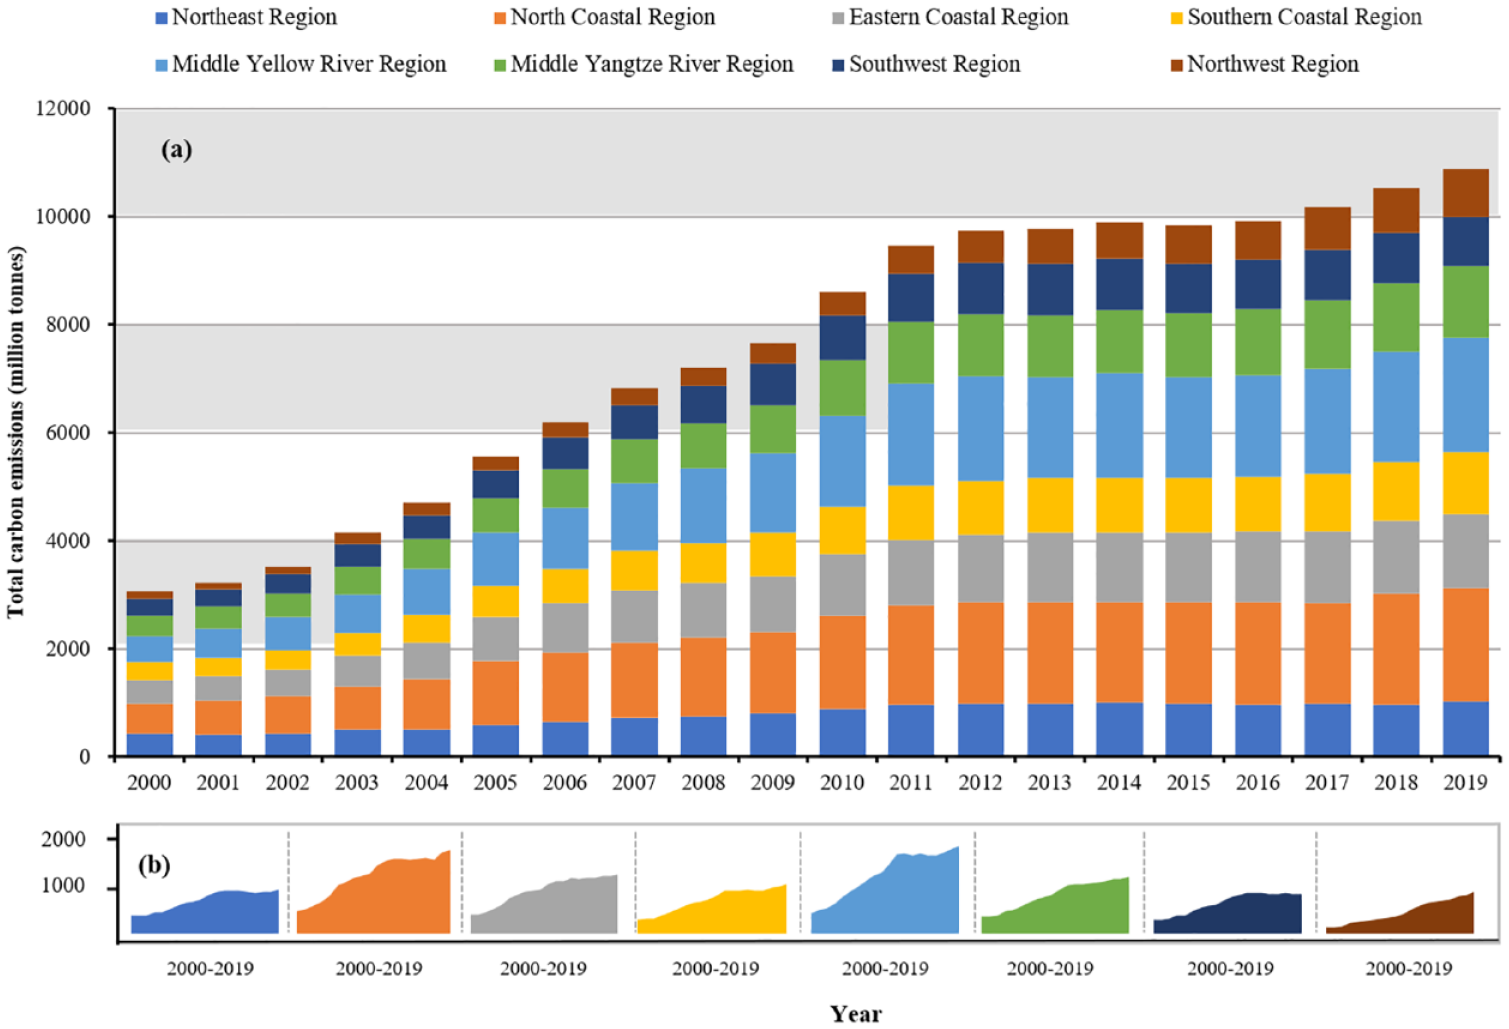
Carbon emission change in China (a) and in eight sub-regions (b) from 2000 to 2019.
China's carbon emissions significantly increased with 445.79 million-ton/yr from 2000 to 2019 (Figure 4). During this period, population, total energy consumption, and GDP grew synergistically. The population increased linearly at the rate of 7.60 million/yr. Total energy consumption rose at a rate of 185.37 million-ton/yr and can be divided into two growth stages. The first stage, from 2000 to 2011, had an average annual growth rate of about 9%, while the second stage, from 2012 to 2019, saw a decline to an average annual growth rate of about 3%. GDP increased with 4791.74 billion-yuan/yr and can be divided into three stages, with 2004 and 2010 serving as turning points. From 2000 to 2003 and 2011 to 2019, the average annual growth percentage of GDP was about 10%, and it was about 18% during 2004-2010. Overall, from 2000 to 2019, China's economy grew rapidly, with the average annual growth percentage of GDP exceeding that of total carbon emissions.
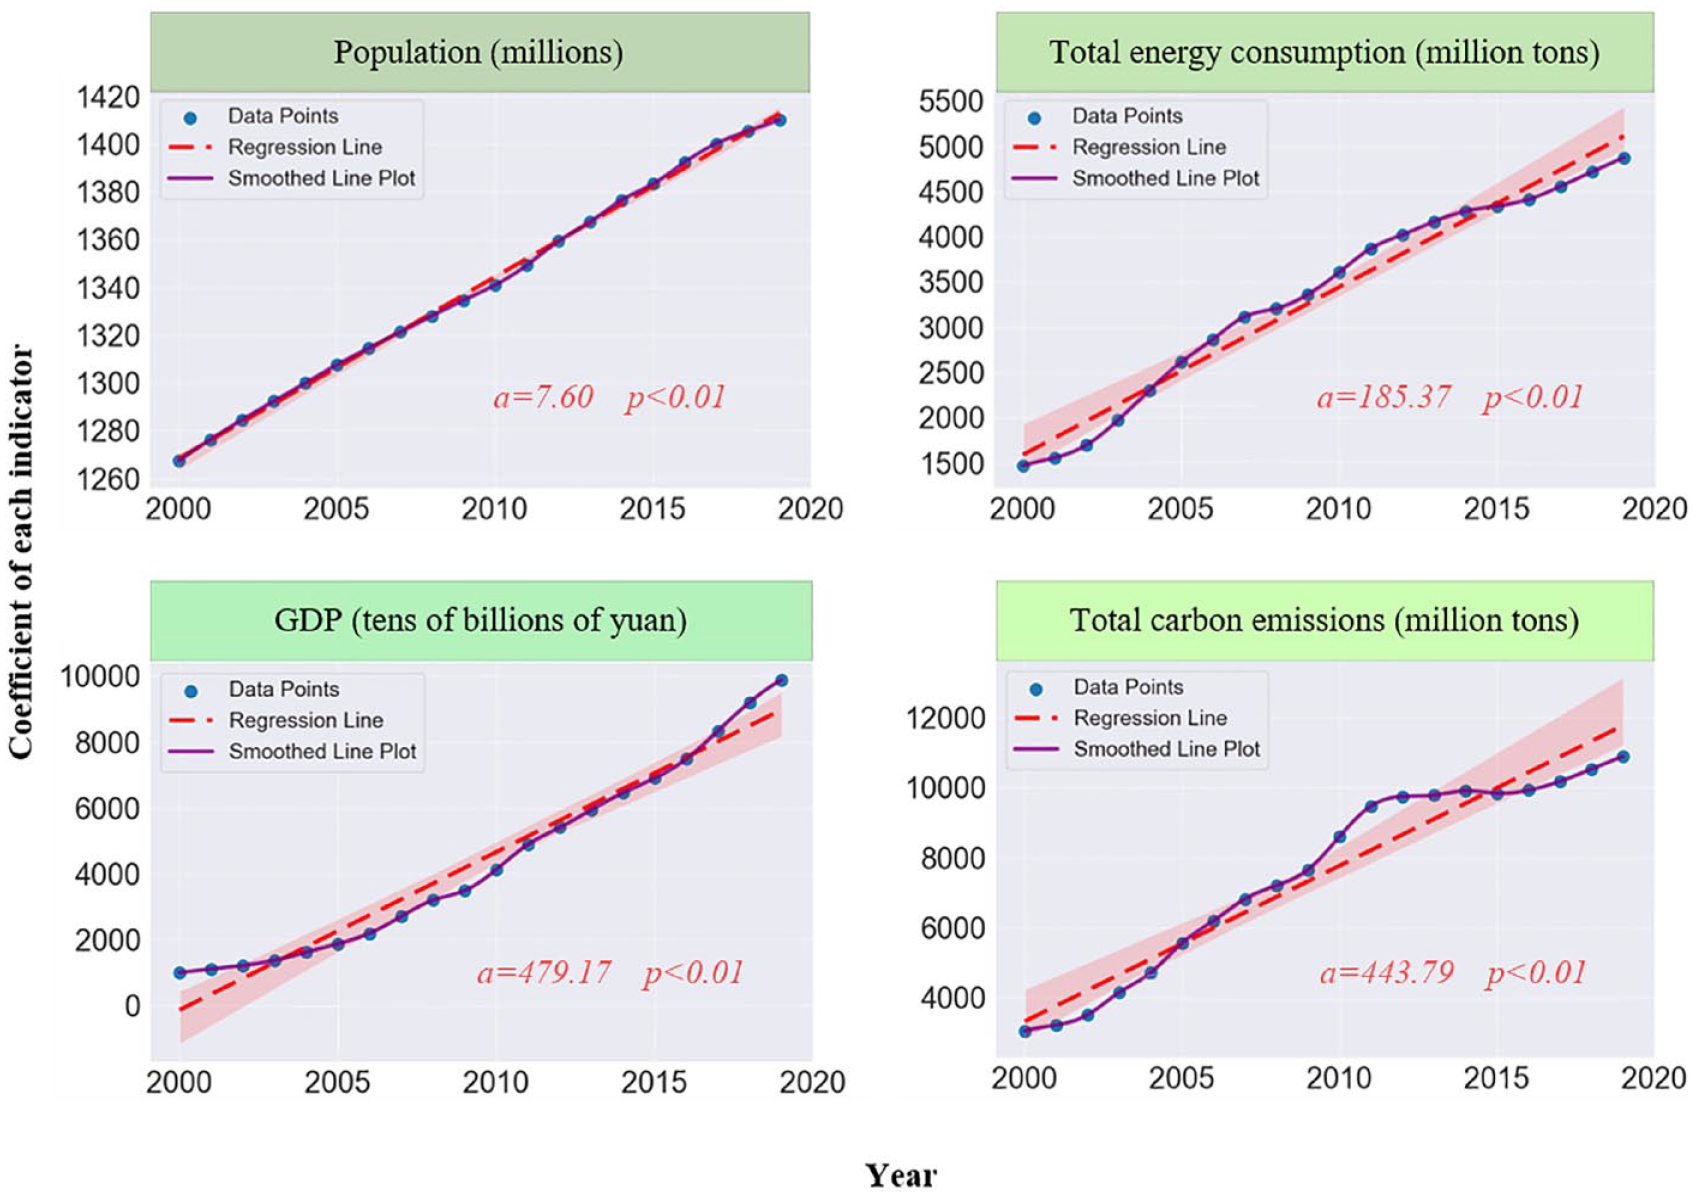
Temporal variations of China’s population, total energy consumption, GDP and total carbon emissions from 2000 to 2019.The changing trend is described by the modelled slope which is a in the figure. Meanwhile, we used the t statistic to test the significance of the modelled slope, which is documented by the p value in the figure.
Carbon emission regression analysis based on the STIRPAT model
First, multivariate linear analysis was performed for the standardized data. The R2 value for the ordinary least square (OLS) was 0.997. However, the variance inflation factors (VIF) for the three indicators were greater than 10, indicating a strong correlation among the independent variables. Additionally, the p-values for these coefficients were greater than 0.05 (Table 2), suggesting significant covariance among the indicators. Consequently, the OLS estimation was deemed unreliable.
The ordinary least square estimation of Chinese carbon emissions from 2000 to 2019.
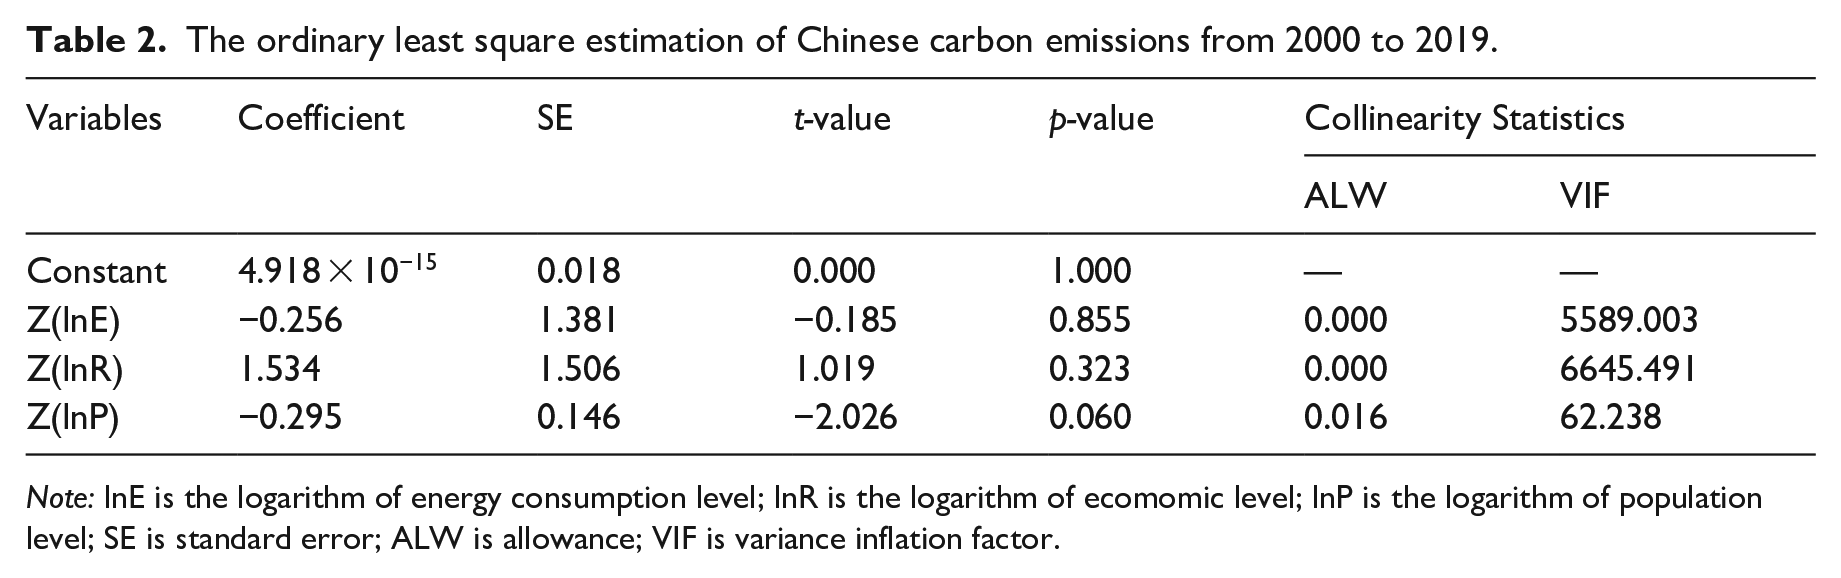
Note: lnE is the logarithm of energy consumption level; lnR is the logarithm of ecomomic level; lnP is the logarithm of population level; SE is standard error; ALW is allowance; VIF is variance inflation factor.
Ridge regression analysis is an enhancement of the OLS method that addresses the autocorrelation of independent variables to obtain more reliable results. The ridge traces for each variable can be generated using the ridge regression program in SPSS software. The coefficient curve for each variable tends to be stable when the bias parameter k > 0.2 (Online Supplementary Figure S1). Therefore, k = 0.2 was selected for the ridge regression estimation when k = 0.2, the regression fit achieved 97.1%, and the p-value is less than 0.01 for the F test (Table 3). The STIRPAT model at the national scale was formulated as Eq.3 through the ridge regression analysis.

Ridge regression analysis of Chinese carbon emission from 2000 to 2019.
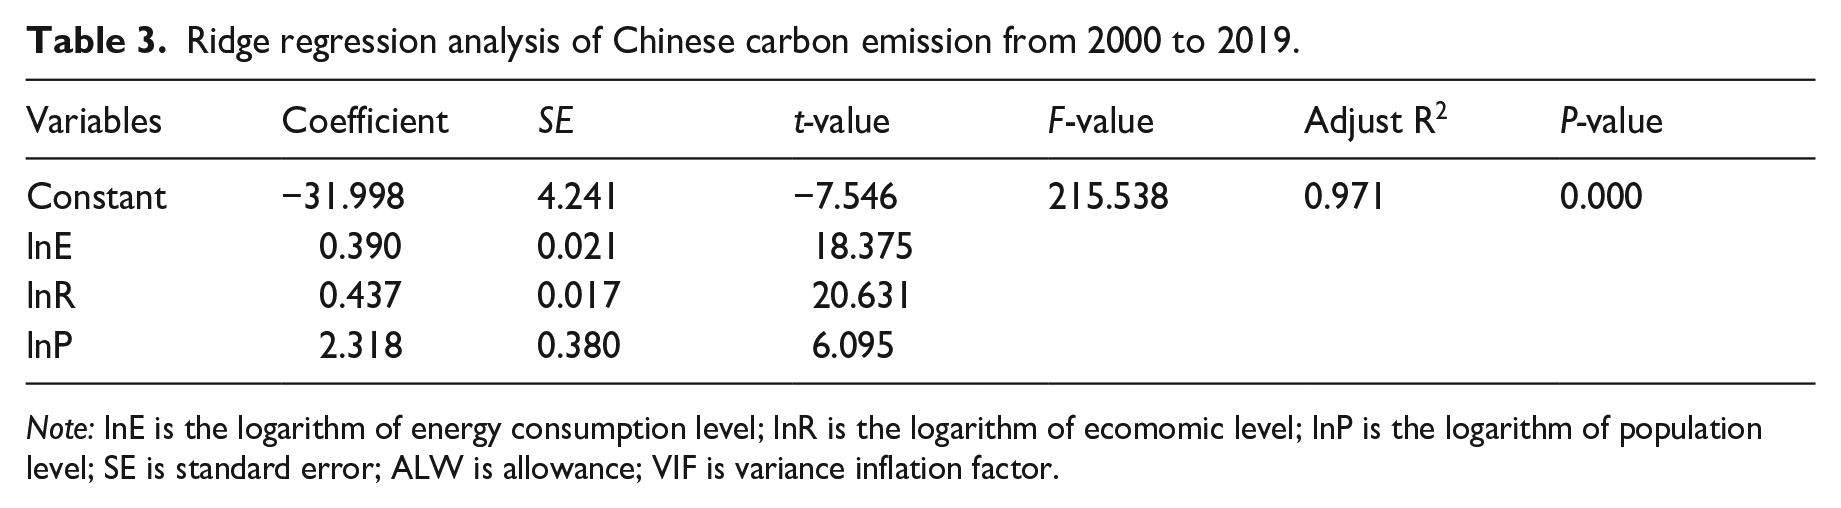
Note: lnE is the logarithm of energy consumption level; lnR is the logarithm of ecomomic level; lnP is the logarithm of population level; SE is standard error; ALW is allowance; VIF is variance inflation factor.
Therefore, we used the ridge regression analysis to fit the carbon emissions for the eight sub-regions. When the bias parameter k = 0.2, the curves in the ridge traces of each sub-region tended to be stable. So, the bias parameter k was also set to 0.2, and the estimated results of carbon emissions for the eight sub-regions were generated (Table 4). The coefficients of the population level (lnP) and constant of the Southwest Region were −0.254 and 0.286, which differ significantly from the nationwide and other sub-regions. While the coefficients of the other seven sub-regions have no significant difference compared with the estimated result of Chinese carbon emission. Moreover, the dominant variable is energy consumption (lnE) for the Northeast Region and Southwest Region, while is population level (lnP) for the other six sub-regions.
Ridge regression analysis with k = 0.2 of carbon emissions for China and eight sub-regions.
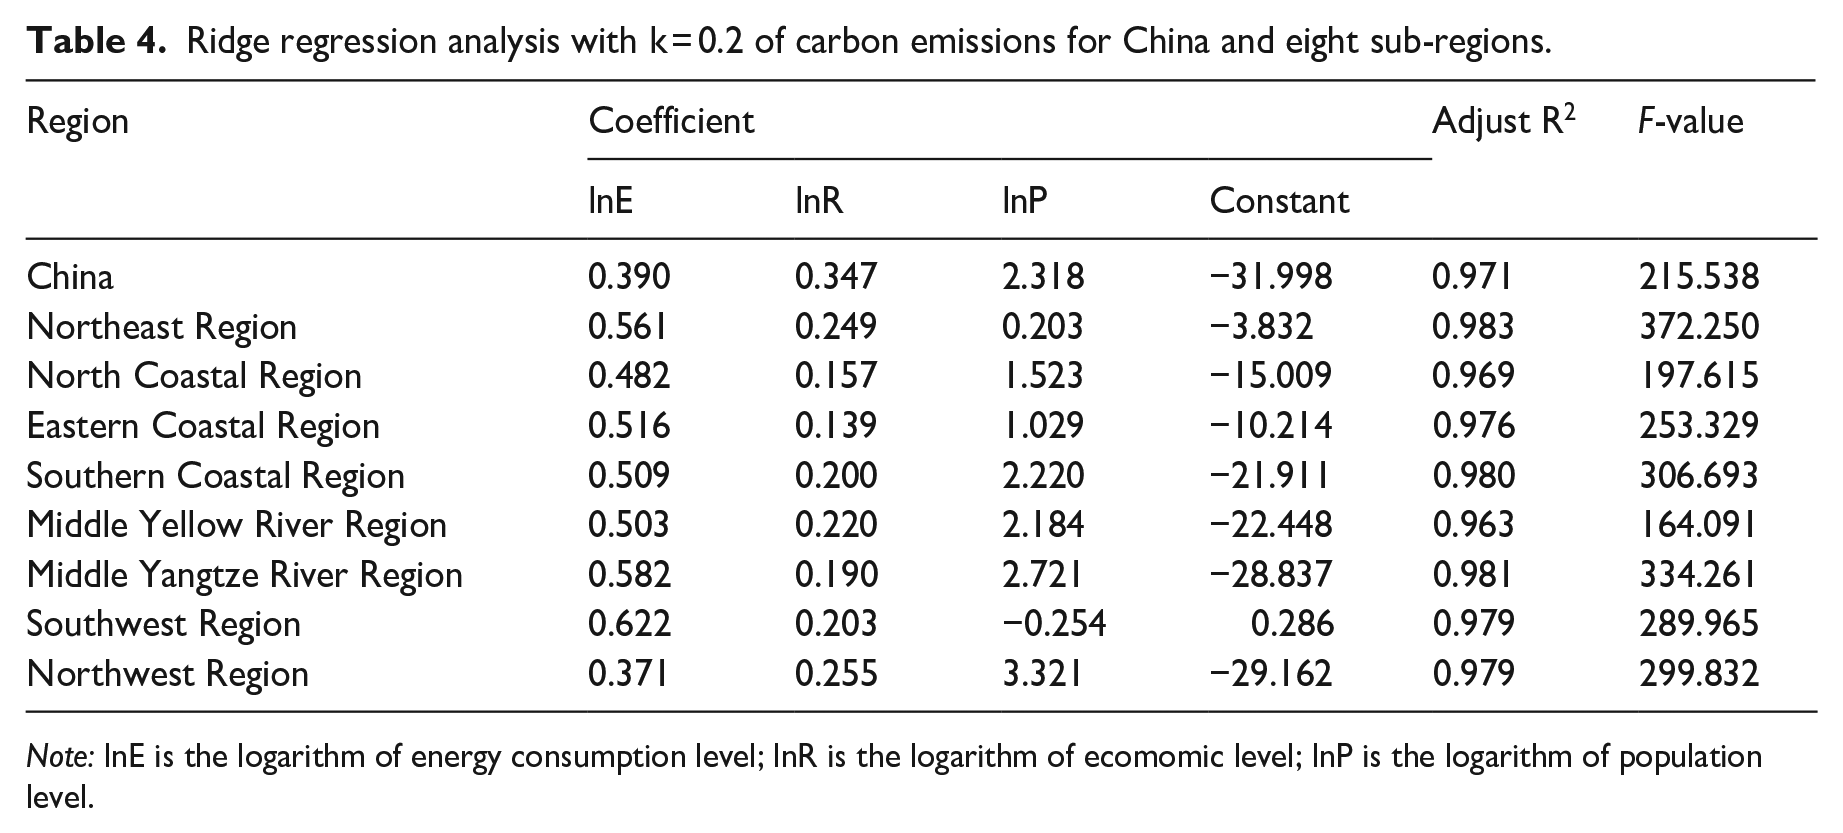
Note: lnE is the logarithm of energy consumption level; lnR is the logarithm of ecomomic level; lnP is the logarithm of population level.
According to Table 3, we generated the Chinese simulated carbon emission from 2000 to 2019 based on the STIRPAT model at the national scale generated by the ridge regression analysis. The simulated and actual values for the Chinese carbon emission generally match (Figure 5a). But there are still some errors, especially after 2009, when the gap between simulated and actual values gradually became obvious.
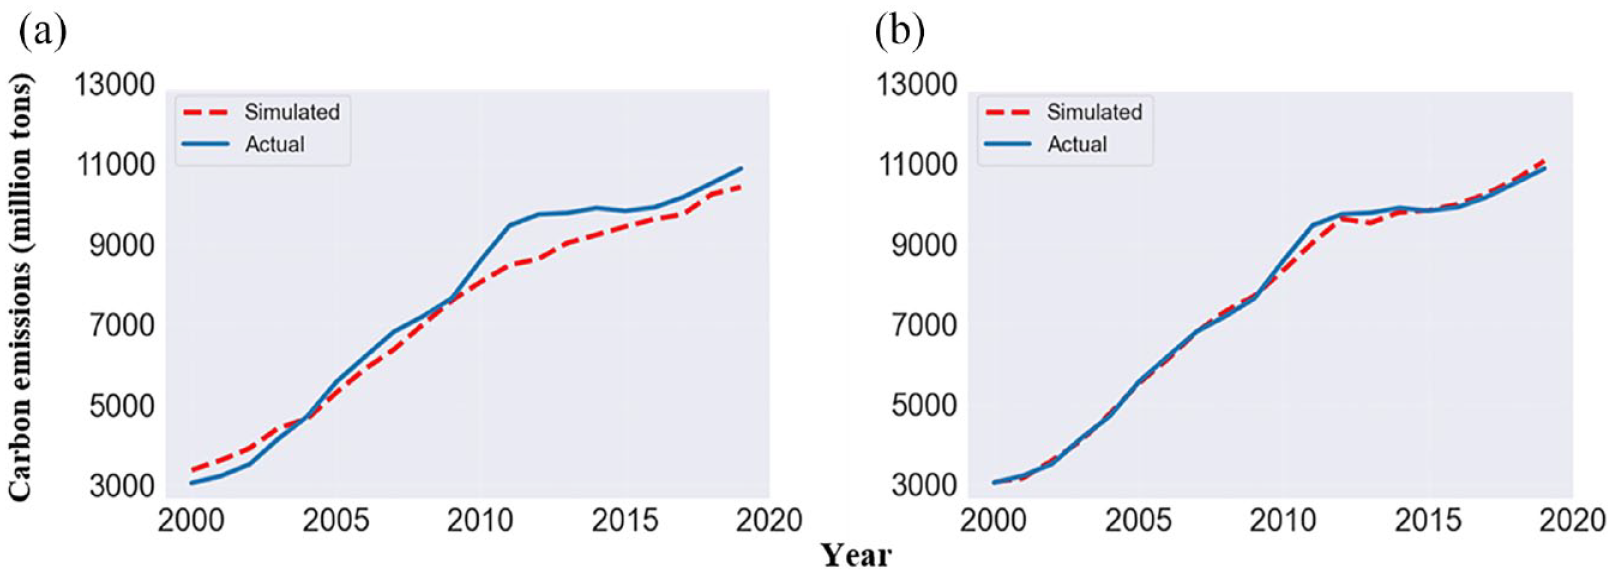
Comparison between actual and simulated carbon emissions in China from 2000 to 2019 based on national STIRPAT model (a) and the eight sub-regions STIRPAT models (b).
Meanwhile, the ridge regression results for the eight sub-regions (Table 4) were utilized to estimate their carbon emissions from 2000 to 2019. The simulated carbon emissions closely matched the actual values of these eight sub-regions during this period (Online Supplementary Figure S2). Therefore, we added all simulated carbon emissions of the eight sub-regions to obtain the Chinese simulated carbon emission. Although some errors in this value were obtained by summarizing carbon emissions of the eight sub-regions (Figure 5b), it is more suitable than the result presented in Figure 5a.
Scenario simulation of carbon emission from 2020 to 2060
Based on Table 4, we simulated the national carbon emissions by accumulating eight sub-regions for the nine development models from 2020 to 2060 (Table 5). Meanwhile, we set 20 Mt carbon as the error threshold to reduce the uncertainty, which is the annual change within 20 Mt is considered no significant change for carbon emissions.
Carbon emission simulation for nine development models from 2020 to 2060 based on eight sub-regions STIRPAT models.
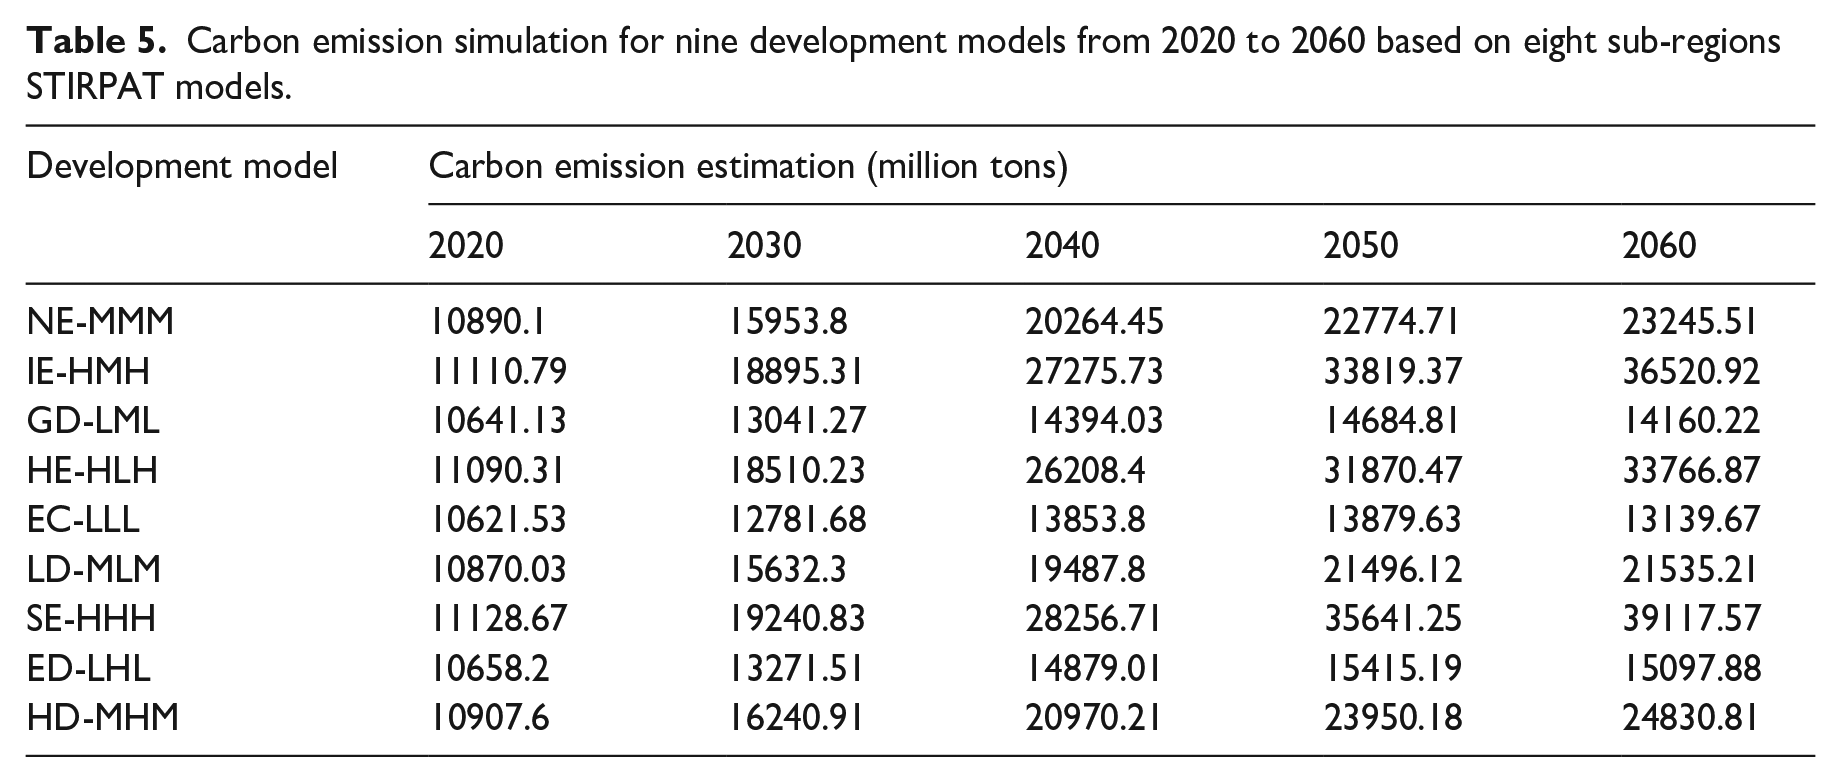
From 2020 to 2060, carbon emission increased for the NE-MMM, IE-HMH, HE-HLH, LD-MLM, SE-HHH, and HD-MHM development models (Figure 6). In the SE-HHH model, Chinese carbon emission will reach 39,117.57 Mt in 2060, which is the highest of all the development models. However, carbon emission will increase and then decrease for the GD-LML, EC-LLL, and ED-LHL development models. In the GD-LML and EC-LLL development models, carbon emission will peak around 2040, and the peak is 14,394.03 Mt and 13,853.80 Mt, respectively. However, the EC-LLL development model will generate a comeback after 2044 and eventually reach a new peak in 2050 at 13,879.63 Mt again. The ED-LHL development model will peak in 2050 at 15,415.19 Mt. Three development models (GD-LML, EC-LLL and ED-LHL) will reach the carbon peak with lower energy consumption and population levels.
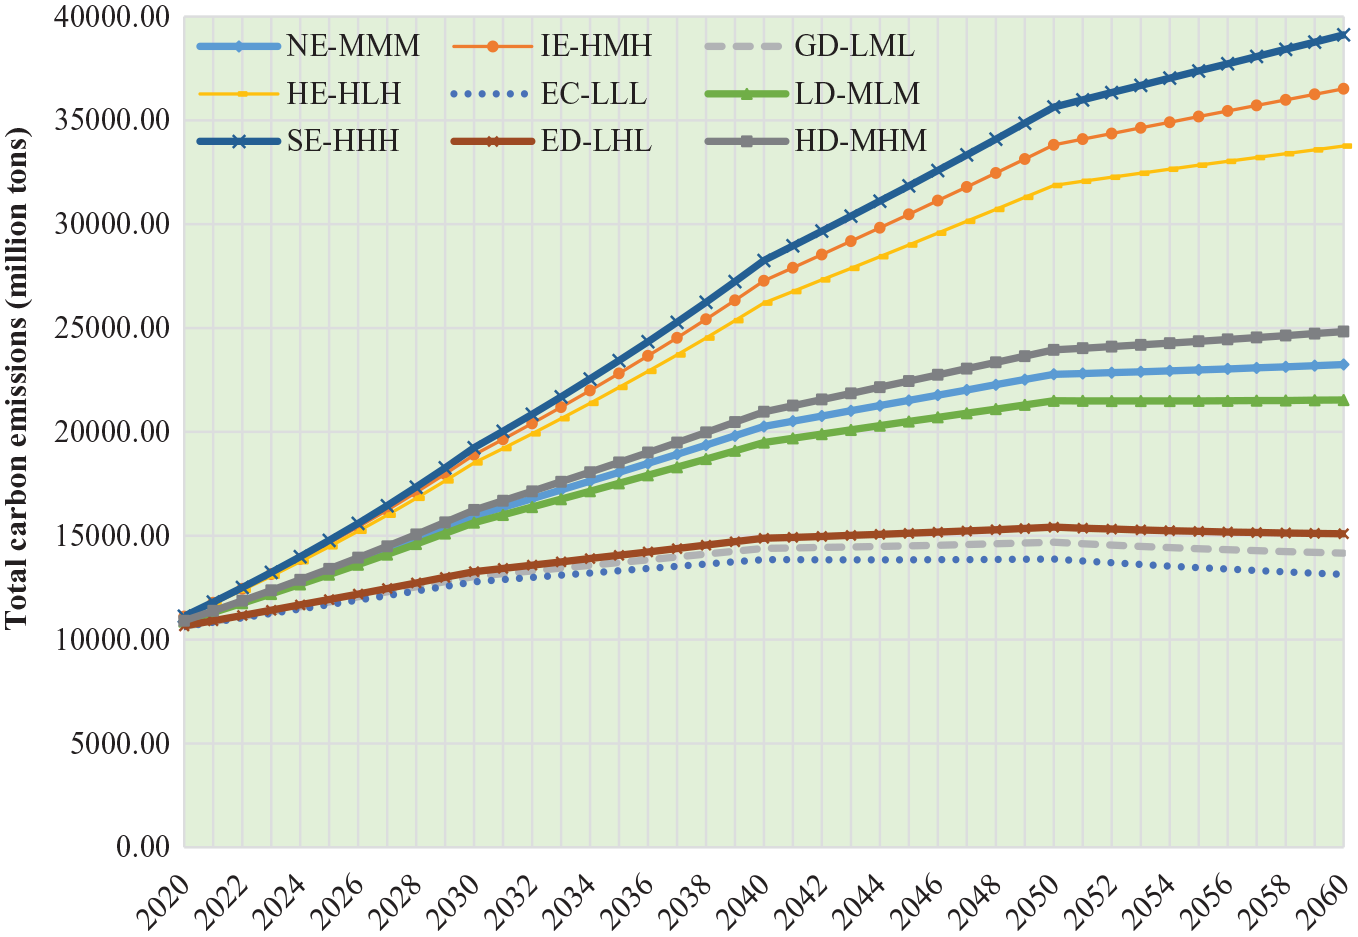
Chinese carbon emission change trend from 2020 to 2060 for nine development models based on eight sub-regions STIRPAT models.
Discussion
Carbon emission changes and its driving mechanism
Carbon emissions vary across different regions and stages of development, influenced by several factors including economic development, population quality, and energy consumption (Dong et al., 2020; Jiang et al., 2017). The ridge regression analysis revealed a positive relationship between carbon emission and energy consumption, economic level, and population level (Table 3), with coefficients of 0.39, 0.437, and 2.318, respectively. This finding is supported by other studies, such as that by Ma et al. (2019). Meanwhile, research by Zheng et al. (2019), Fang et al. (2021), and Huang et al. (2019) similarly reported that economic level and population are positive drivers of carbon emissions, noting that economic level and population have not significantly decoupled in developing countries like China and India, which have higher carbon emissions (Dong et al., 2020). Moreover, economic growth and rising energy consumption contribute to increased carbon emissions in developing countries compared to other nations (Gao et al., 2021; Waheed et al., 2019). Although variations in carbon emission exist among regions in current studies (Fang et al., 2021; Karasoy, 2019; Wu et al., 2018), these papers consistently show that the economy, population, and energy consumption all positively affect carbon emissions, with economic level being the most significant factor. Moreover, data on China's carbon emissions (Figures 3 and 4) indicate that the growth rates of both economic and energy consumption have significantly declined post-2011 compared to the period before. The carbon emission growth rate also decreased in 2011, marking a turning point influenced by energy consumption and economic development.
Carbon emissions of different development models in the future
Comparing the carbon emissions of nine development models, the IE-HMH, HE-HLH, and SE-HHH models exhibit higher carbon emissions. Among these three development models, only the economic level varies, showing a positive correlation between carbon emissions and the economic level. According to Figure 6, we could reclass the nine development models into three groups: (1) high energy consumption and population levels; (2) moderate energy consumption and population levels; (3) low energy consumption and population levels. Significant differences in carbon emissions exist among these three groups, with emissions increasing alongside the economic level in each category. This suggests that energy consumption and population size play more substantial roles in future carbon emissions than economic development (Fang et al., 2018; Huang et al., 2019; Wang et al., 2019). Therefore, the development models with low energy consumption and population levels (GD-LML, EC-LLL, and ED-LHL) are likely to achieve a significant reduction in carbon emissions. In addition, economic development can be decoupled from carbon emissions through improvements in energy efficiency and technology (Chen et al., 2022), providing a pathway for achieving the EC-LLL development model. However, some studies (Zhu and Peng, 2012) indicate that the population is not the primary driver of carbon emissions, which contrasts with our findings. This may be explained by the large population size of China (Huang et al., 2024; Zhao et al., 2022). Overall, none of the nine development models are projected to peak carbon emissions by 2030. The GD-LML and EC-LLL models are expected to peak around 2040, while the ED-LHL model is projected to peak in 2050. Achieving the double carbon goals will be challenging if adjustments are made solely to economic development, population, and energy consumption.
Suggestions for controlling carbon emission
According to the simulations based on the STIRPAT model, China’s carbon emissions are expected to continue rising in the short term. The nation faces significant pressure to peak carbon emissions by 2030 and achieve carbon neutrality by 2060. As the largest contributor to global carbon emissions (Huang et al., 2024; Zhu and Peng, 2012), China should prioritize balancing economic development with environmental sustainability, aiming for efficient, green, and economic development, which is essential for achieving sustainable development and building an ecological civilization. This paper identifies three key variables: population, economy, and energy consumption, which offer valuable insights.
Energy consumption
With its large population, China has a high energy demand, making it challenging to reduce carbon emissions while meeting increasing social energy needs (Zheng et al., 2019). It is predicted that the higher the energy consumption levels correlate with increased carbon emissions. Carbon emissions are mainly caused by fossil fuel consumption, and China's production pattern relies heavily on fossil fuels (Tatum, 2022). Therefore, we proposed modifying the energy framework by lowering dependence on fossil fuels while boosting the usage of innovative energy alternatives like non-fossil, non-carbon, renewable, and clean energy sources (Huang et al., 2024). These alternatives should be supported by modern technologies to effectively replace conventional fossil energy sources (Khan et al., 2021; Lizunkov et al., 2018).
Second, key industries must manage their energy consumption, as industrial emissions account for the largest share of China’s carbon footprint (Gao et al., 2021). Within China's industrial structure, the carbon emission line industry accounts for a staggering 85% of the total emissions (Cheng et al., 2023; Gao et al., 2021). A prime example of the use of fossil fuels is the power sector, with more than half of power production being fueled by coal and an astounding 70% of power plants being coal-fired (Stevens et al., 2020; Waheed et al., 2019). As a result, carbon emissions from power generation are responsible for a staggering 44% of China’s total national emissions (Gao et al., 2021). Fortunately, technical solutions exist to reduce fossil energy consumption in these key sectors (Huang et al., 2024). One such solution is the wind power-photovoltaic energy storage coupling mode (Saidi and Omri, 2020), which can replace thermal power and provide fast energy storage response, two-way regulation, and energy buffering. This technology is poised to play a vital role in transitioning to a low-carbon energy system (Xing et al., 2023). The primary objective is to shift the current fossil energy-dominated structure in key industries toward reduced carbon emissions for a sustainable future.
Third, China has undergone an intense period of economic expansion, during which enormous amounts of energy have been consumed to maintain its growth momentum (Li et al., 2021). In contrast, developed nations have successfully decoupled economic activity from carbon emissions by adopting advanced technologies that enhance energy efficiency (Wang et al., 2021). Unfortunately, the carbon emission efficiency of China still requires considerable improvement, as observed by Zou et al. (2021). As such, the third recommendation for China is to improve energy efficiency by employing efficient energy utilization practices to increase energy output while decreasing consumption (Zou et al., 2021). This approach aligns with the country’s social development goals and will contribute to achieving a more sustainable future.
Economic level
According to the forecast carbon emission results of nine development models, continued economic growth and an elevated economic level in China significantly contribute to the persistent increase in carbon emissions (Zhao et al., 2023). While economic development is integral to national growth and prosperity, reducing emissions cannot come at the cost of economic progress (Wang et al., 2019; Wu et al., 2018). To achieve a low-carbon economy in China, it is vital to decouple economic growth from carbon emissions.
One critical strategy towards this objective is enhancing energy efficiency, which requires aligning energy consumption with the country’s economic development (Fang et al., 2021; Gozgor et al., 2018). Historically, China’s economic expansion has been heavily reliant on fossil fuels, resulting in a concerning increase in carbon emissions. However, technological advancements now offer the opportunity to achieve economic development while simultaneously reducing energy consumption and associated carbon emissions (Saidi and Omri, 2020).
Another approach involves regulating macroeconomic aggregates. These aggregates encompass various factors, including natural resource leasing, financial development, and green investments (Huang et al., 2024; Zou et al., 2021). Previous research has yielded mixed results regarding the impact of macroeconomic policies on carbon emissions. Yet recent studies indicate that green investment can effectively reduce carbon emissions and maintain ecological balance in both the short and long term in China (Li et al., 2021). Thus, promoting green investments could significantly lower carbon emissions in the country.
Population level
The carbon emission forecasts from nine prevailing development models suggest that a high population level could potentially drive a surge in carbon emissions, thereby imposing an urgent need for strategies that aim at reducing emissions stemming from population expansion (Khan et al., 2021). Assuming a constant per capita energy consumption pattern, population growth leads to increased energy demand, and consequently a rise in carbon emissions. However, the Chinese population growth rate has declined in recent years (Zhu and Peng, 2012), which is expected to have minimal impact on energy demand. Therefore, mitigating emissions can best be achieved via the curtailment of carbon emissions per capita. This will require raising awareness about low-carbon environmental preservation efforts, promoting low-carbon travel and eco-friendly lifestyles, and enhancing public consciousness regarding environmentalism, with the ultimate objective of reducing reliance on fossil fuels (Khan et al., 2021; Lizunkov et al., 2018).
Limitations and uncertainties
The STIRPAT model is widely regarded for its flexibility and comprehensive approach to analyzing environmental impacts (Fang et al., 2021; Wu et al., 2018), yet it has several limitations. Firstly, quantifying variables, particularly technology, presents significant challenges. The impact of technology on carbon emissions is complex and multifaceted, involving not only production efficiency but also the adoption rates of clean technologies and the lifecycle impacts of products. This complexity can lead to the omission of crucial variables in the model. Secondly, the STIRPAT model often assumes linear relationships between independent variables and their effects (Fang et al., 2018; York et al., 2003). However, these relationships may be non-linear, featuring thresholds and tipping points that the model does not account for. Lastly, the STIRPAT model may inadequately consider spatial and temporal variations (Huang et al., 2019; Wang et al., 2019). The effects of population and energy consumption differ significantly across regions and periods, which may be oversimplified or overlooked in a national-scale model. Therefore, we divided China into eight sub-regions and fitted eight STIRPAT models.
Conclusion
This study provides an in-depth analysis of the spatial-temporal patterns of carbon emissions in China, offering insights into potential future development pathways under different scenarios. The findings indicate a significant increase in China’s carbon emissions from 2000 to 2019, with the North Coastal and Middle Yellow River Regions identified as the primary contributors. Ridge regression analysis reveals that population, economic growth, and energy consumption exert different influences on carbon emissions across regions, underscoring the necessity for region-specific strategies. Future scenario analysis suggests that low energy consumption and managed population growth are crucial for meeting carbon reduction targets. Notably, under the EC-LLL scenario, China could achieve its lowest carbon emissions by 2060, whereas the SE-HHH scenario predicts the highest emissions. While effective management of population and energy consumption can significantly reduce carbon emissions, relying solely on these strategies may make it challenging to achieve double carbon goals. This underscores the necessity for a solid scientific foundation to inform policy formulation for low-carbon development.
Supplemental Material
sj-docx-1-tee-10.1177_2754124X241300289 – Supplemental material for China’s carbon emission forecasts in different development models
Supplemental material, sj-docx-1-tee-10.1177_2754124X241300289 for China’s carbon emission forecasts in different development models by Chunbo Huang, Xintao Gan, Jing Cheng, Lin Jin and Changhui Peng in Transactions in Earth, Environment, and Sustainability
Footnotes
Authors contributions
Chunbo Huang: Conceptualization, Writing—review and editing.
Xintao Gan: Data collection and analysis, Writing—original draft preparation.
Jing Cheng: Writing—original draft preparation.
Lin Jin: Methodology, Conception and design, Supervision.
Changhui Peng: Validation, Conception and design.
Declaration of conflicting interests
The author(s) declared no potential conflicts of interest with respect to the research, authorship, and/or publication of this article.
Funding
The author(s) disclosed receipt of the following financial support for the research, authorship, and/or publication of this article: This work is financially supported by the Natural Science Foundation of China (Grant number 42001218) and the General Project of Hubei Social Science Fund (Grant number 2021211, HBSK2022YB357).
Supplemental material
Supplemental material for this article is available online.
Author biographies
References
Supplementary Material
Please find the following supplemental material available below.
For Open Access articles published under a Creative Commons License, all supplemental material carries the same license as the article it is associated with.
For non-Open Access articles published, all supplemental material carries a non-exclusive license, and permission requests for re-use of supplemental material or any part of supplemental material shall be sent directly to the copyright owner as specified in the copyright notice associated with the article.