
Abstract
At the optimal analysis granularity and extent, this study reveals the spatiotemporal evolution characteristics of landscape patterns in rural areas of the Fuchun River Basin from 1990 to 2020. It also explores the spatiotemporal differentiation of driving forces using Geodetector and Geographically Weighted Regression. The results indicate that: 1) The optimal analysis granularity for the study area is 30 m × 30 m, and the optimal analysis extent is 200 m. 2) Compared to the 1990s, the past two decades have seen an increased degree of landscape fragmentation, higher isolation, and stronger human disturbance in the study area, with significant differentiation. These changes are most pronounced in the semi-urbanized areas along the river and in the northern regions. 3) Digital Elevation Model and land cover type are the most critical driving factors. Over time, the explanatory power of most driving factors shows an overall increasing trend. 4) There is a significant spatial heterogeneity in the driving forces. The influence of the Digital Elevation Model and slope is stronger in the north and south, weaker in the central region, while the influence of temperature increases from north to south. The impact of land cover type is stronger in the central area and weaker in the periphery. This study provides a reference for the scientific use of land resources and the protection of ecological spaces in rural areas within highly urbanized regions at the basin scale.
Introduction
In the process of rapid urbanization, changes in landscape patterns caused by land use/cover change are among the most significant factors influencing human well-being and ecosystem services (DeFries et al., 2002; Loveland et al., 2000). Landscape patterns represent the spatial arrangement of different types and quantities of landscape elements, reflecting the combined effects of natural geographical and socio-economic factors across complex spatiotemporal scales (Bailey and Gatrell, 1995; Hu et al., 2021; Turner, 1989). They are a typical indicator of land use transformation (Sun et al., 2013). With urban expansion, significant changes in national spatial patterns have occurred, leading to issues such as irrational development, insufficient utilization of spatial resources (Kong et al., 2021), spatial structure imbalance, and frequent conflicts in land use functions (Zhu et al., 2023). Therefore, in-depth analysis of the dynamic evolution of landscape patterns and their influencing factors during rapid socio-economic transformation is crucial for optimizing land use and promoting high-quality, sustainable spatial development.
The evolution of landscape patterns under the context of land use transformation has become a research hotspot in recent years. Landscape pattern indices, which can effectively condense information about landscape patterns (Sun et al., 2013), have become a primary method in such studies. Utilizing these indices, numerous scholars have conducted extensive work from various perspectives such as ecological security (Kan et al., 2024), urbanization (Zhu et al., 2021), and ‘dual evaluation‘ (Jia et al., 2020), focusing on spatial pattern identification (Yan et al., 2022), regional optimization (Weng et al., 2021), and and national spatial pattern simulation (Li et al., 2021a) Building on this, further identification of the driving factors behind landscape pattern evolution is essential for a comprehensive understanding of regional development’s dynamic processes and intrinsic mechanisms, which is significant for optimizing spatial planning and management (Wang et al., 2019). In studying the driving mechanisms, the complexity of geographical processes often results in significant spatial dependency and spatial heterogeneity between landscape pattern evolution and driving factors (Ren et al., 2020). In response, current research, compared to traditional mathematical-statistical models, places more emphasis on the spatial distribution relationships between dependent and independent variables (Xing et al., 2019; Zhou et al., 2020), fully considering the interactions between driving factors and improving the methodological system of driving force analysis through tools such as Geographically Weighted Regression (GWR) (Han et al., 2020) and Geodetector (Wang and Xu, 2017).
Although research on landscape pattern evolution and driving forces has become relatively mature, there are still aspects worth attention in terms of research objects, scope, and analysis scales. Firstly, most current studies focus on urban agglomerations with concentrated industrial development or ecologically sensitive and vulnerable areas (Yin et al., 2024), with less attention given to rural areas that have significant development potential but face severe ecological crises. In China, rural areas are vast, covering more than half of the country’s land area and housing 35.28% of the population (National Bureau of Statistics of China, 2022). Under the backdrop of rapid urbanization, rural areas face issues such as land idleness and rural hollowing (Sun et al., 2024), severely constraining the intensive use of rural land, while also facing risks of ecological space encroachment and ecological land fragmentation (Zhu et al., 2023), which seriously threaten regional ecological protection. Focusing on rural landscape pattern research in the context of national food security and ecological security strategies can provide decision-making support for high-quality spatial development and sustainable urban-rural coordination.
Additionally, previous studies often use administrative boundaries as the research limits (Liang et al., 2022; Xu and Kang, 2017), which, while beneficial for aligning with administrative management policies to some extent, disrupts the organic connection of the natural landscape. In this context, river basins, as fundamental units for coordinating land-water environments within the entire ecosystem (Simonit and Perrings, 2013), form the basis for maintaining regional ecological security. Using river basins as research boundaries facilitates coupling research content with regional ecological characteristics and aids in the coordination of land use policy formulation across administrative units. However, most river basin-level landscape pattern studies currently focus on ecological and hydrological processes (Yin et al., 2024), particularly on the impact of landscape composition and spatial configuration on basin runoff. Research on the evolution of rural landscape patterns from a land use change perspective at the basin scale is urgently needed.
Finally, the distribution and evolution characteristics of landscape elements can yield different conclusions depending on the analysis scale (extent and granularity) (Gustafson, 1998). Selecting the optimal characteristic scale for analysis according to the specific research area is a crucial foundation for studying landscape pattern evolution (Liu, 1992). However, most studies have not treated the selection of optimal analysis extent and granularity as a necessary prerequisite, which can lead to neglecting detailed features when the scale is too large or failing to grasp the overall patterns when the scale is too small (Liang et al., 2021). To address this, methods such as the landscape pattern index differentiation method, area information loss evaluation method, and semi-variance function calculation can be used to gradually establish the optimal analysis scale (Ma et al., 2019; Zhang et al., 2020), making the analysis results of landscape pattern evolution more objective and accurate.
The Fuchun River Basin is a typical region undergoing rapid urbanization located in Hangzhou, Zhejiang Province. Based on land use data from four periods (1990, 2000, 2010, 2020) in rural areas of the Fuchun River Basin, the objectives of this study are: 1) To determine the optimal analysis scale and analyze the evolution characteristics of landscape diversity, landscape fragmentation, and landscape connectivity in the study area over the past 30 years; 2) To explore the driving forces of landscape pattern evolution in the study area using Geodetector and Geographically Weighted Regression, including identifying key driving factors, interaction effects among driving forces, and the spatial distribution patterns of these driving forces. The study results will contribute to a deeper understanding of the dynamic evolution processes of rural landscape patterns in rapidly urbanizing regions and provide references for the scientific utilization of land resources and ecological space protection in similar areas.
Materials and methods
Study area
The Fuchun River Basin (29.5°-30.25°N, 119.5°-120.1°E) is in the low mountainous and hilly region of western Zhejiang Province, covering a total area of 4,524 km2. The basin’s terrain is predominantly mountainous and hilly, accounting for approximately 68% of the total area. The region has a typical subtropical monsoon climate, with an average annual temperature of 17°C and an average annual precipitation of 1,600 mm. The Fuchun River Basin is situated along the core axis of Hangzhou’s ‘Development along the River’ strategy, making it a typical area of rapid urbanization, with an urbanization rate exceeding 80%. The economic level within the basin shows a clear gradient, decreasing from the northeast to the southwest.
In recent years, as the urban-rural dual structure difference has diminished, issues such as rapid urban land expansion and excessive spatial enlargement have increasingly encroached upon rural agricultural land and ecological land in this region. Additionally, the Fuchun River Basin is a key area for ecological conservation in Hangzhou and an important component of the ‘Three Rivers and One Lake’ ecological landscape corridor, with recent efforts focused on creating exemplary ‘beautiful rivers and lakes’ in Zhejiang. Therefore, balancing the conflict between urban expansion and ecological protection is crucial for ensuring the sustainable development of this region.
Since this study focuses on rural landscape patterns and to maintain consistency in the study area’s boundaries over the research period (1990-2020), we followed the approach of previous studies (Long et al., 2019). We excluded urban construction land from the initial year (1990) and extracted the remaining areas as rural regions, resulting in a final study area of 3,811 km2 (Figure 1)
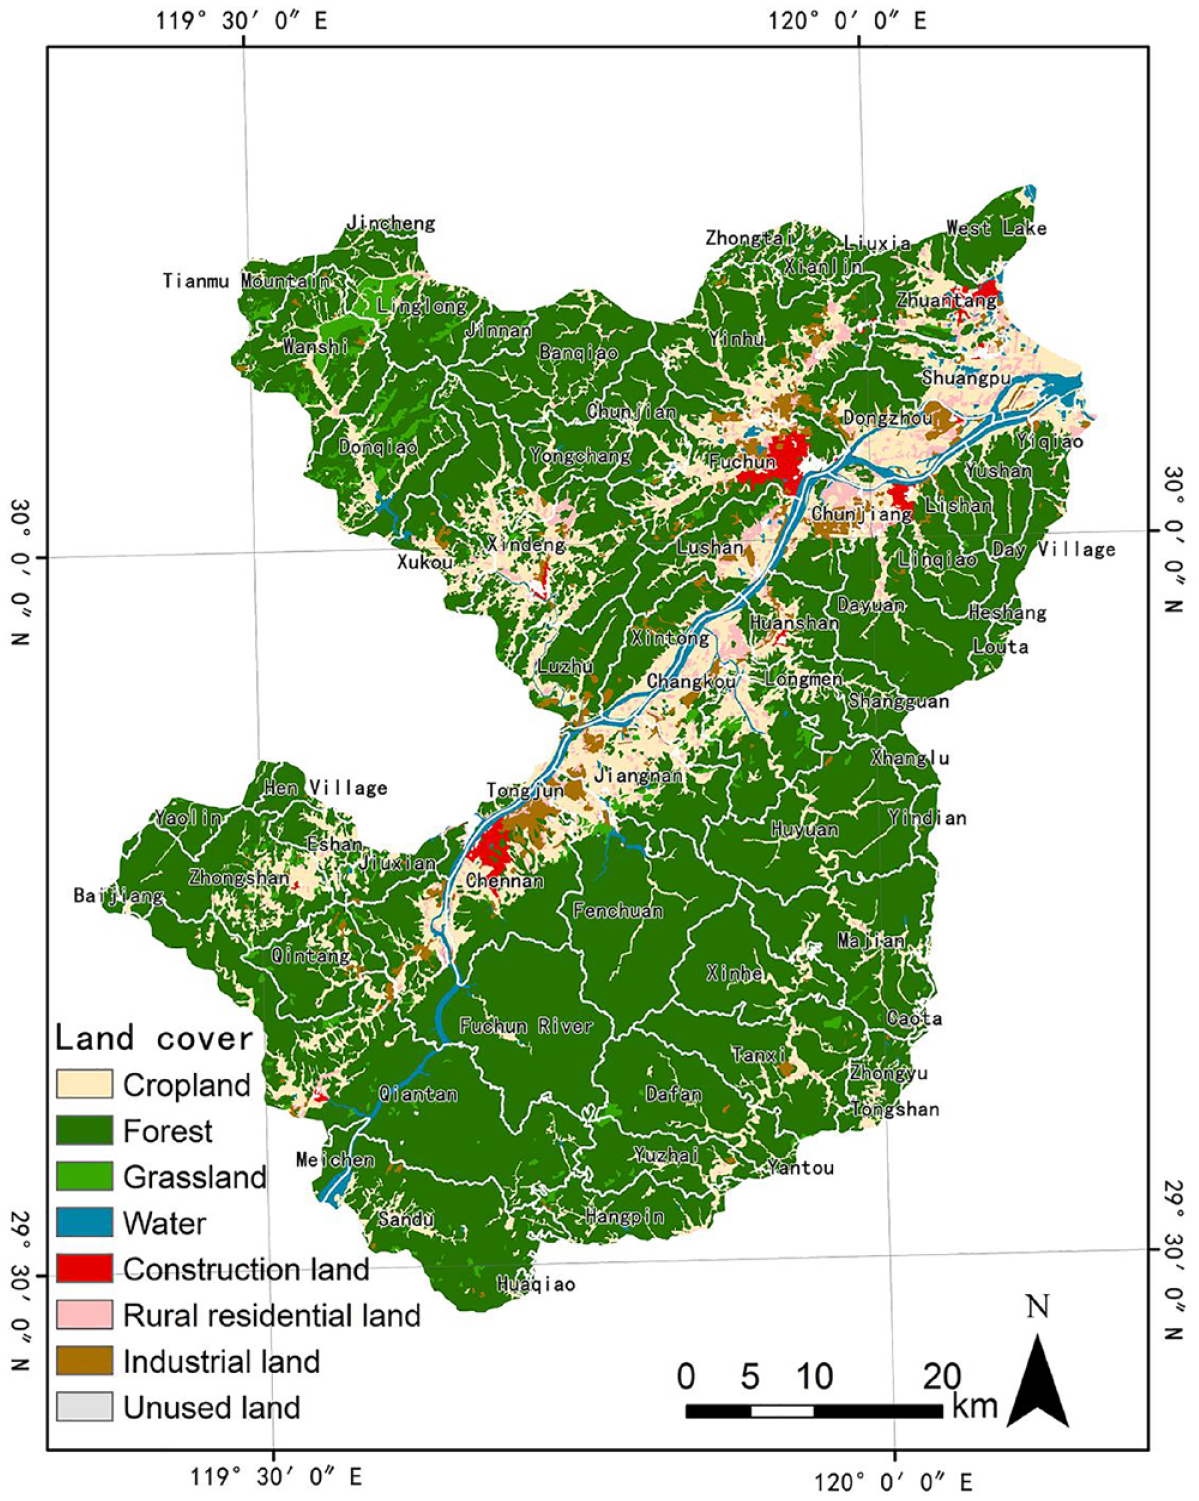
Location and administrative divisions of the Fuchun River Basin.
Data Sources
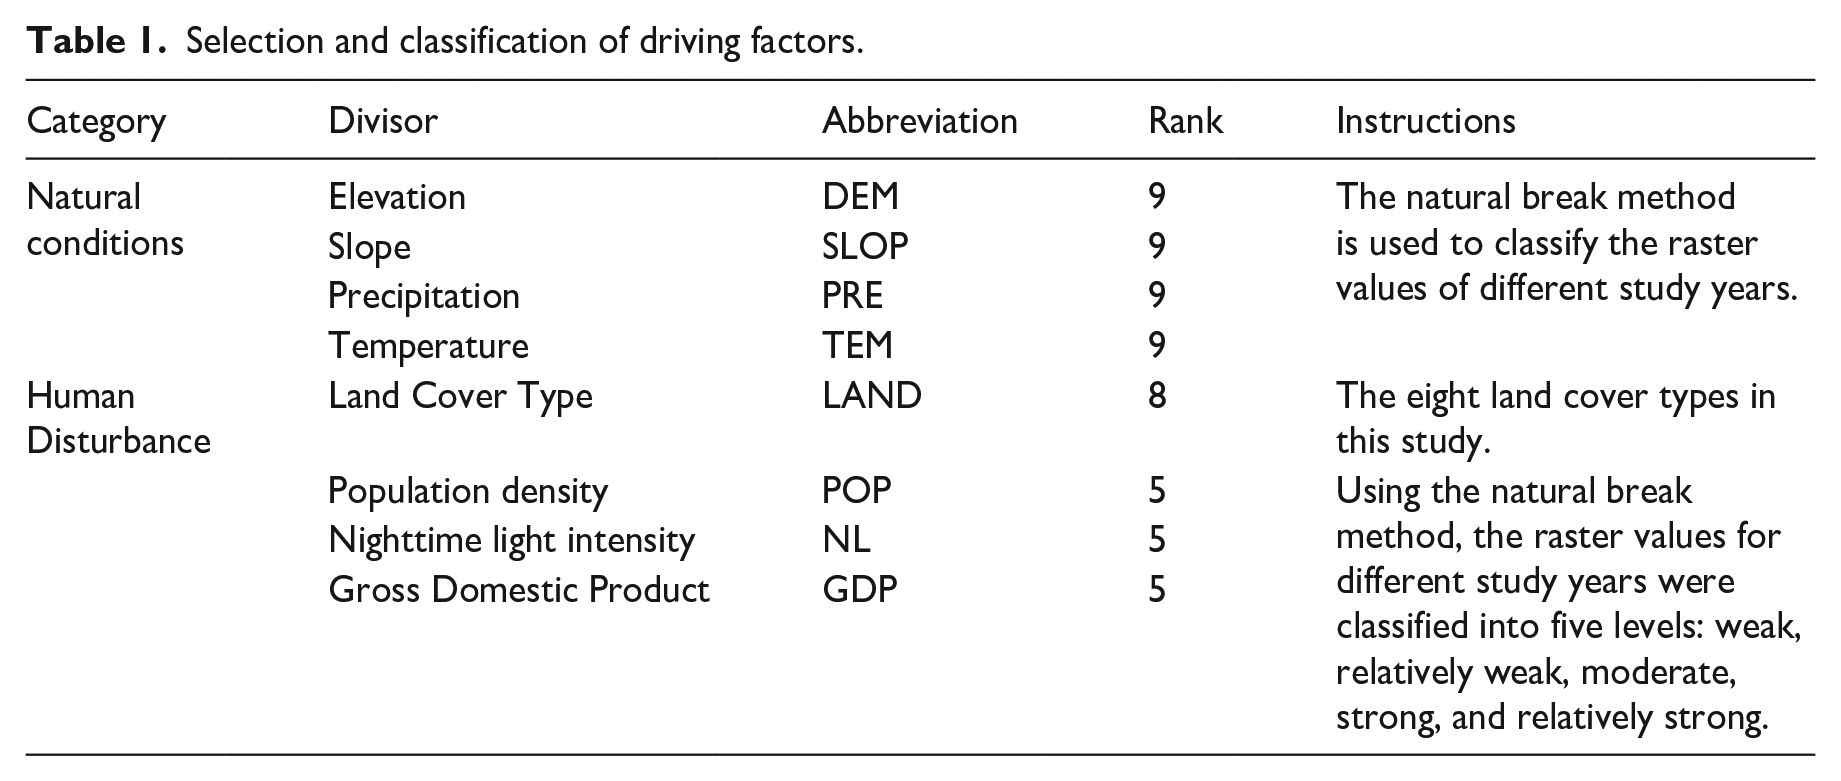
This study primarily utilized the following datasets: 1) Land Use Data: Land use data for the Fuchun River Basin from 1990, 2000, 2010, and 2020 were obtained from the Resource and Environment Data Cloud Platform of the Chinese Academy of Sciences (http://www.resdc.cn), with a spatial resolution of 30 m × 30 m. The overall classification accuracy of this dataset exceeds 93% (Yang et al., 2022). Driving Factors: Based on natural conditions and human disturbances (Feng et al., 2021; Li et al., 2021b), we selected Digital Elevation Model (DEM), slope, precipitation, temperature, land cover type, Gross Domestic Product (GDP), population density, and nighttime light intensity as driving factors (Table 1). Specifically: 2) DEM: Sourced from the Geospatial Data Cloud (https://www.gscloud.cn) with a spatial resolution of 30 m × 30 m. 3) GDP, Population, Precipitation, and Temperature Data: Obtained from the National Earth System Science Data Center (http://www.geodata.cn) and the Resource and Environment Science Data Center of the Chinese Academy of Sciences, all with a spatial resolution of 1 km × 1 km. 4) Nighttime Light Data: Acquired from the Earth Observation Group (EOG) website funded by the National Oceanic and Atmospheric Administration (NOAA) (https://eogdata.mines.edu), with a spatial resolution of 1 km × 1 km.
Selection and classification of driving factors.
Methods
Landscape pattern index analysis
Optimal scale analysis based on landscape pattern index differentiation and area information loss evaluation
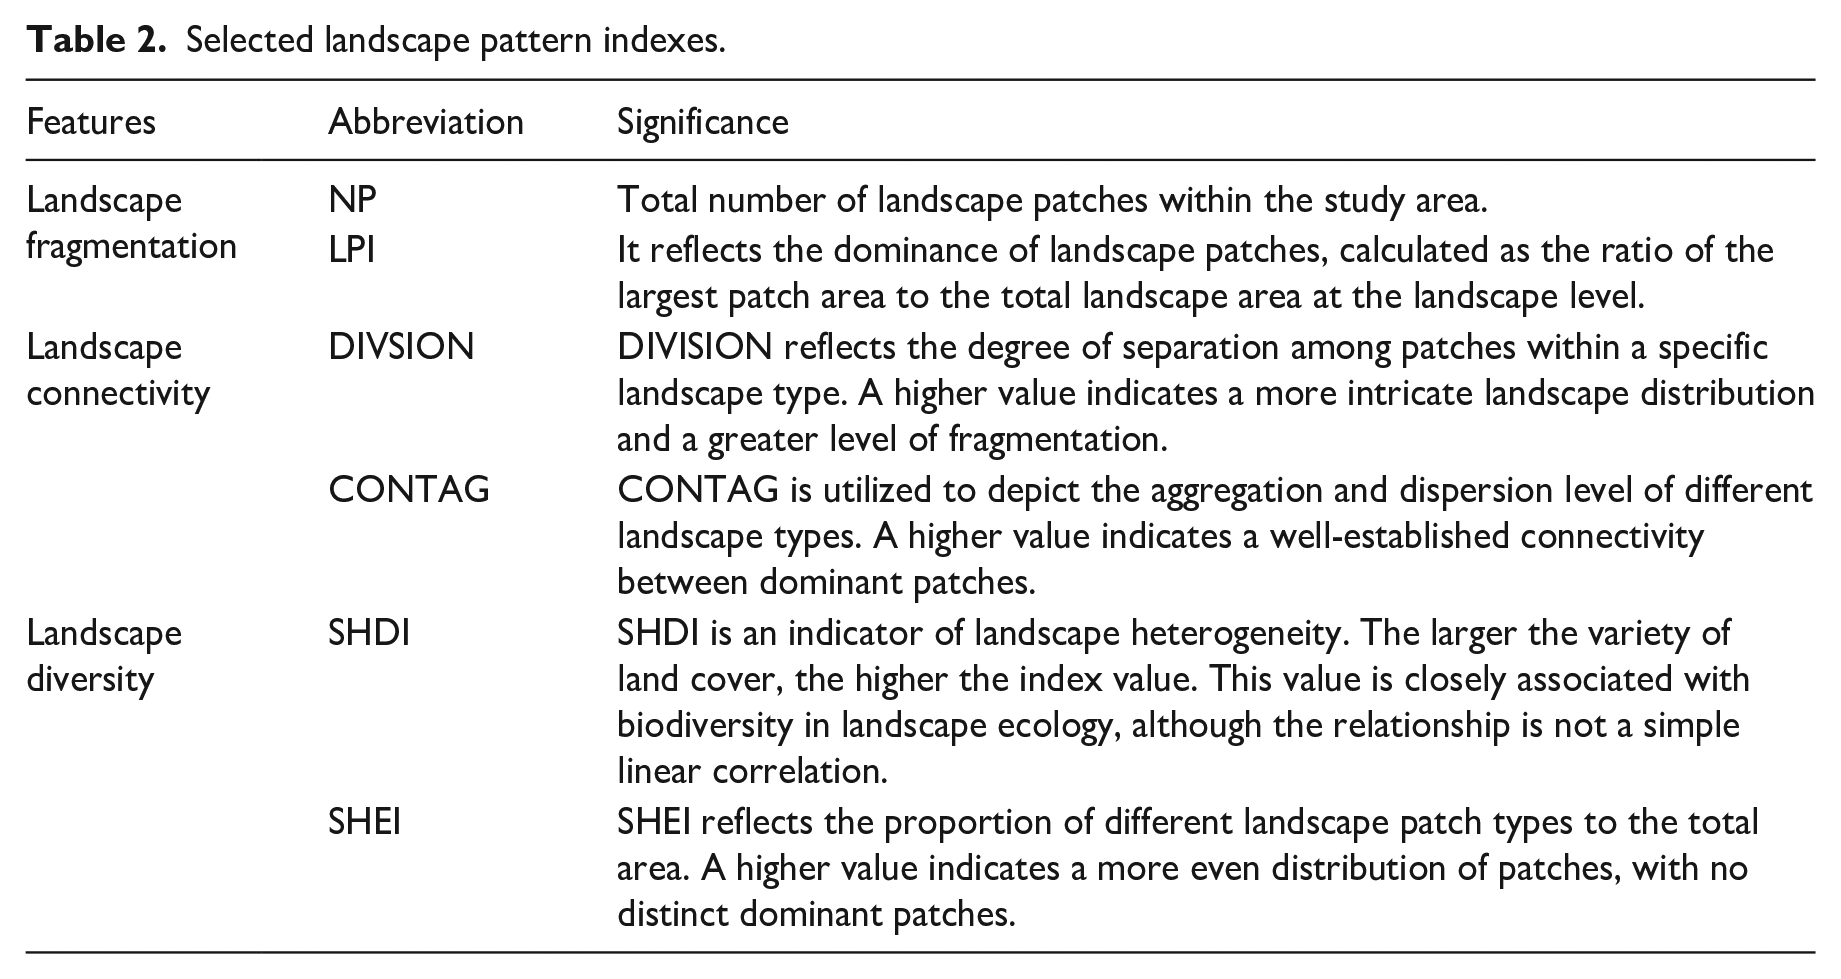
Using the 2020 land use raster data as the base map, we applied a resampling tool to sample the original raster data at intervals of 10 meters, increasing the pixel size from 30 meters to 170 meters, resulting in 15 different sets of images with varying resolutions (pixel sizes). We then selected landscape pattern indices (Table 2) and used Fragstats 4.2 software to calculate the landscape pattern indices for these 15 sets of land cover data at different resolutions (Ji et al., 2013; Wu, 2004). Finally, we analyzed the variation of the landscape pattern indices across different resolutions and selected the optimal resolution within a relatively stable range. Given that larger resolutions tend to lose some landscape information by failing to capture finer details, when multiple stable ranges exist, the smaller resolution range, referred to as the first domain of scale (Wang, 2019), should be chosen.
Selected landscape pattern indexes.
Area loss evaluation can analyze the accuracy of the images after resolution conversion and identify the resolution range with the minimal area loss, thereby determining the optimal resolution for study within an appropriate resolution range. Therefore, it is necessary to assess the area loss at different resolutions using the area change evaluation index model. The formula is as follows:
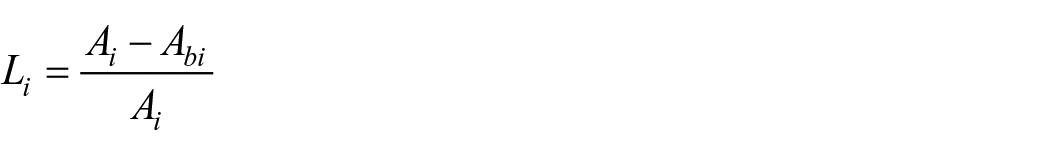
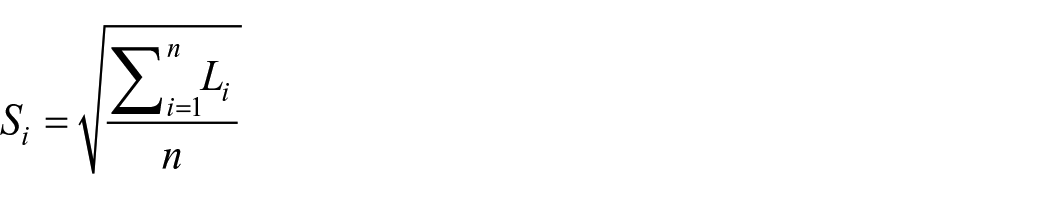
In the formula,
Optimal scale analysis based on semi-variogram function
Combining the moving window method with the semi-variance function, we divided the images at the optimal resolution into segments at intervals of 100 meters within the range of 100 to 1,500 meters. We then sampled and calculated three indices: SHDI (Shannon’s Diversity Index), LPI (Largest Patch Index), and CONTAG (Contagion Index). Finally, we used the semi-variance function to analyze the correlation between landscape metrics and spatial variables, describing the relationship between the data (Wu et al., 2020), thereby determining the optimal analysis extent (the length of the study gradient). The formula for calculating the semi-variance function is as follows:
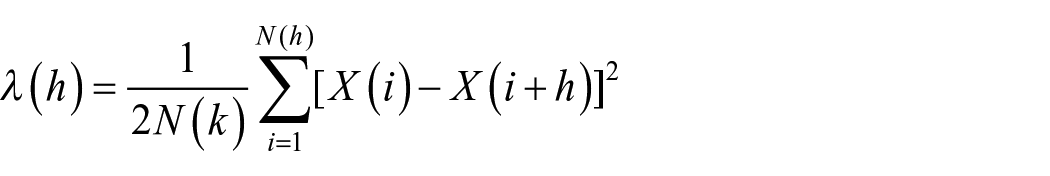
In the formula,
Analysis of landscape patterns at the optimal feature scale
Based on the determination of the optimal analysis scale and extent, the landscape pattern was analyzed with a focus on three aspects (Table 2) (Xie et al., 2023): (1) Landscape fragmentation, primarily assessed using the NP and LPI indices; (2) Landscape connectivity, evaluated through the DIVISION and CONTAG indices; and (3) Landscape diversity, measured using the SHDI and SHEI indices.
Driving force analysis
Factor selection key driver exploration and factor interaction detection based on geographic detectors
Geographic detectors are crucial tools for exploring the spatial heterogeneity of geographic phenomena and identifying potential driving forces. Unlike traditional linear models, geographic detectors can investigate the relationships between driving factors and geographic phenomena without assuming any linearity, and they can assess interactions among complex variables (Kashki et al., 2021). This study primarily employs two modules: the factor detector and the interaction detector.
The factor detector uses the
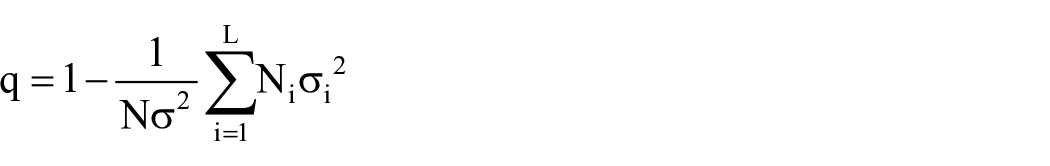
In the formula,
Moreover, driving factors are not isolated; they exhibit complex interactions, and these interactions can produce indirect effects. The interaction detector explores the interactions between factors by comparing the
Type of factor interaction detection.
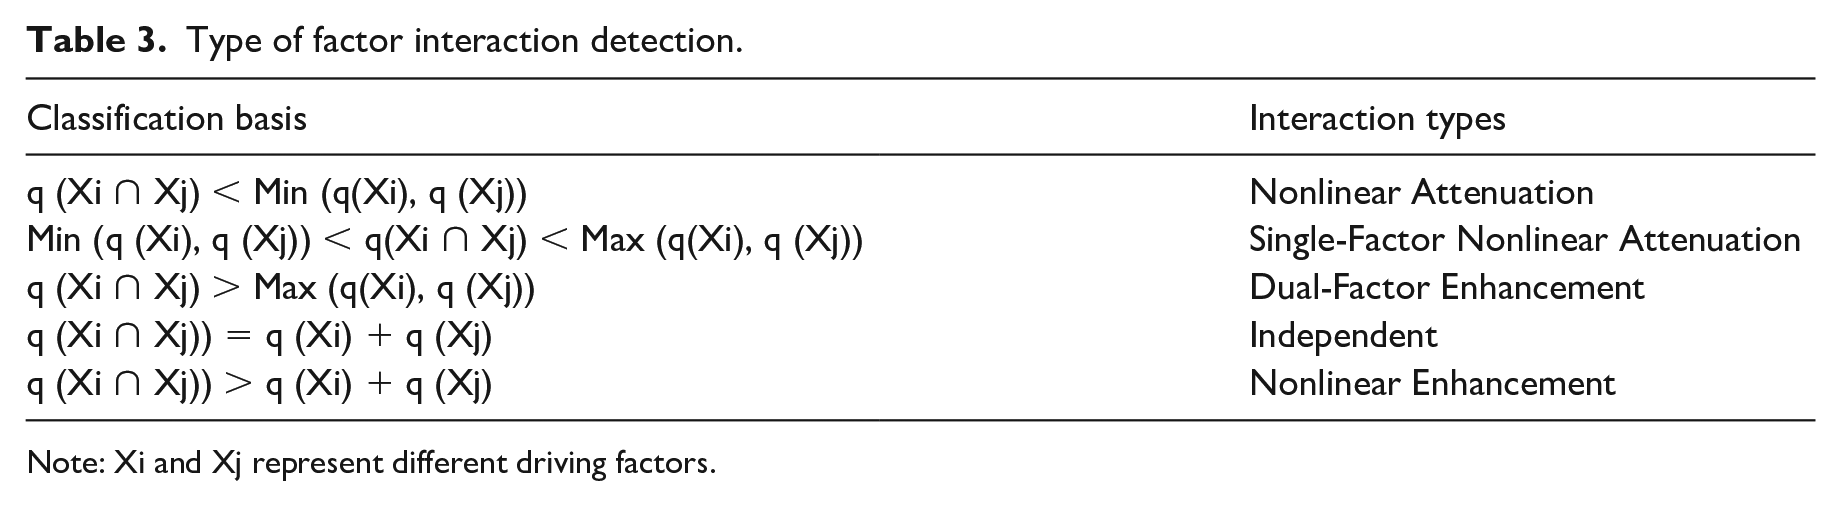
Note: Xi and Xj represent different driving factors.
Spatial distribution analysis of key driving factors based on geographically weighted regression
However, geographic detectors alone cannot visually present the spatial distribution characteristics of driving forces, which may limit the applicability of the research results in guiding regional development strategies. To address this, the Geographic Weighted Regression (GWR) model is an extension of traditional linear regression models (Brunsdon et al., 1998). GWR integrates the geographic location attributes of the data into the regression parameters through weighting, effectively estimating spatial autocorrelation and reflecting the spatial heterogeneity of variables across different regions (Fotheringham et al., 1996). The functional expression of the GWR model is as follows:
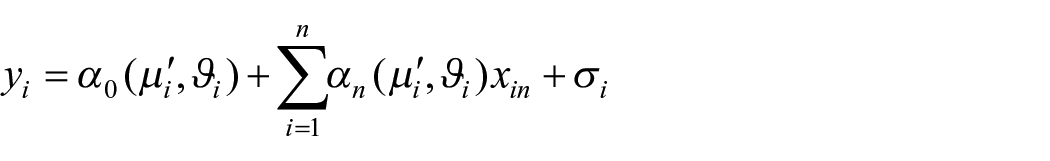
In the formula:
The study evaluates the model’s performance by correcting R2 (Han et al., 2020). A condition number less than 0 or greater than 30 indicates the presence of local multicollinearity among variables, rendering the model results unreliable.
Results
Landscape pattern evolution
As shown in Figure 2, considering the inflection points and stable spatial intervals of various indices, ranges of 30-50 m, 80-90 m, and 130-140 m are identified as overall stable intervals. When multiple stable intervals are present, a smaller resolution interval (the first scale domain) should be chosen to retain more details. Therefore, this study selects the first scale domain (30-50 m) as the optimal analysis resolution range. On this basis, the resolution with the minimal area information loss is chosen as the best analysis resolution. Within the first scale domain, samples are taken at 5 m intervals, and the area information loss index is analyzed. As shown in Figure 3, the area information loss is minimal at a resolution of 30 m × 30 m; thus, this resolution is selected as the optimal resolution for landscape pattern analysis.
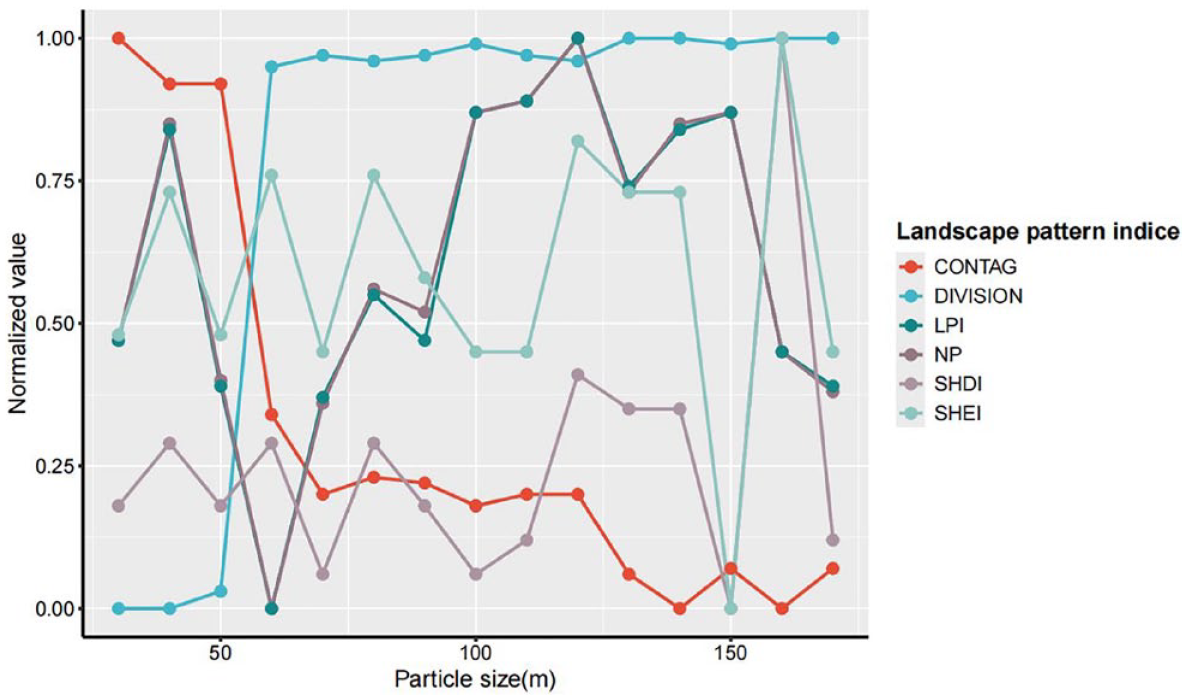
Optimum particle size.
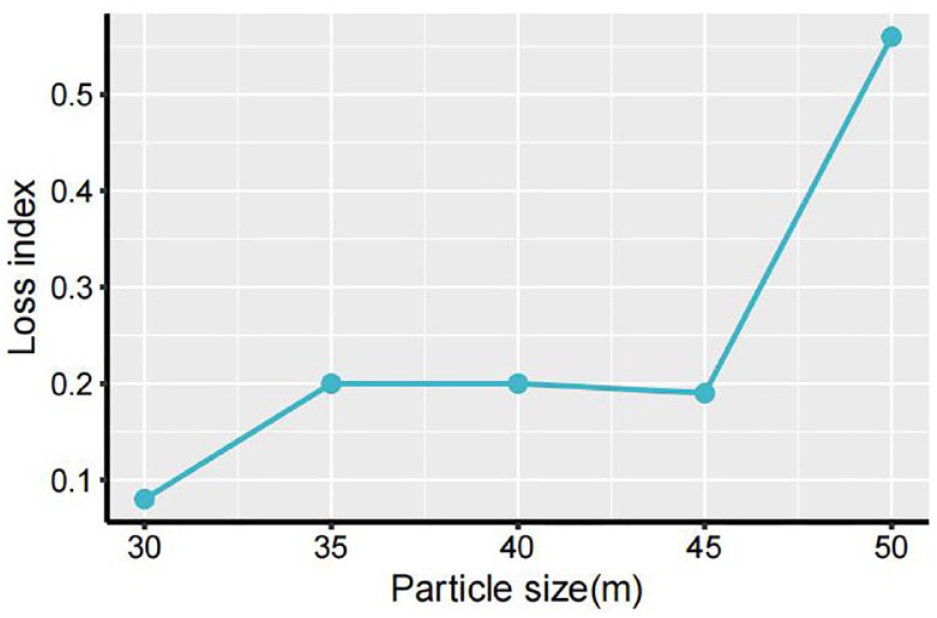
Area information loss index.
Using the moving window tool, data distribution characteristics of the selected landscape pattern indices were obtained at 15 different window sizes within the range of 100-1,500 m, with increments of 100 m. Based on this, semi-variance functions were calculated for 45 sets of landscape pattern indices (by randomly generating 2,000 points and computing the block ratio for all random points,
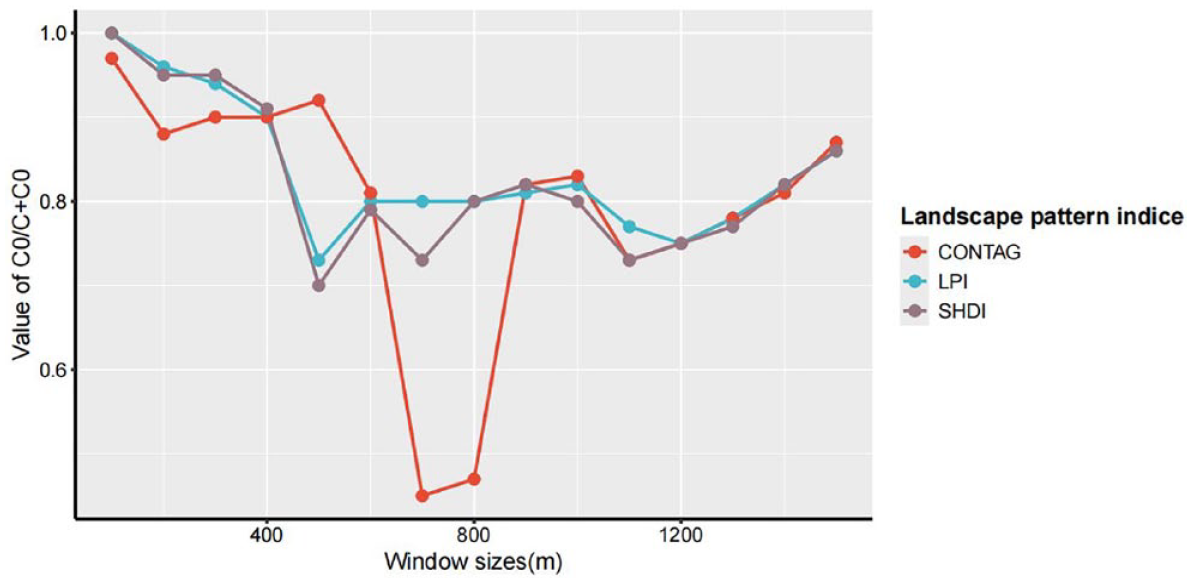
Value of C0/C+C0 of landscape pattern index under different moving windows.
Under the optimal analytical resolution, this study selected six key landscape pattern indices to evaluate landscape fragmentation, connectivity, and diversity, employing the moving window method to spatially visualize these indices. Specifically:
The NP index showed a 19.23% decrease from 1990 to 2000, followed by a subsequent rise, with its 2020 level nearly equivalent to that of 1990 (Figure 5a). Conversely, the LPI index rose by 2.53% from 1990 to 2000, then declined, but remained 1.58% higher in 2020 than in 1990 (Figure 5b). These trends suggest an initial reduction in landscape fragmentation, followed by an increase, resulting in an overall stable state over the last 30 years. High fragmentation areas are predominantly located in the northern watershed and along both banks of the Fuchun River. Notably, fragmentation has escalated in areas such as Yinhui Street, Fuchun Street, and Dongzhou Street in the watershed’s north, as well as in Jiangnan Town and Changkou Town along the river. In contrast, fragmentation has significantly declined in southern areas, including Fuchun Town, Qiantan Town, and Dafan Township (Figure 6).
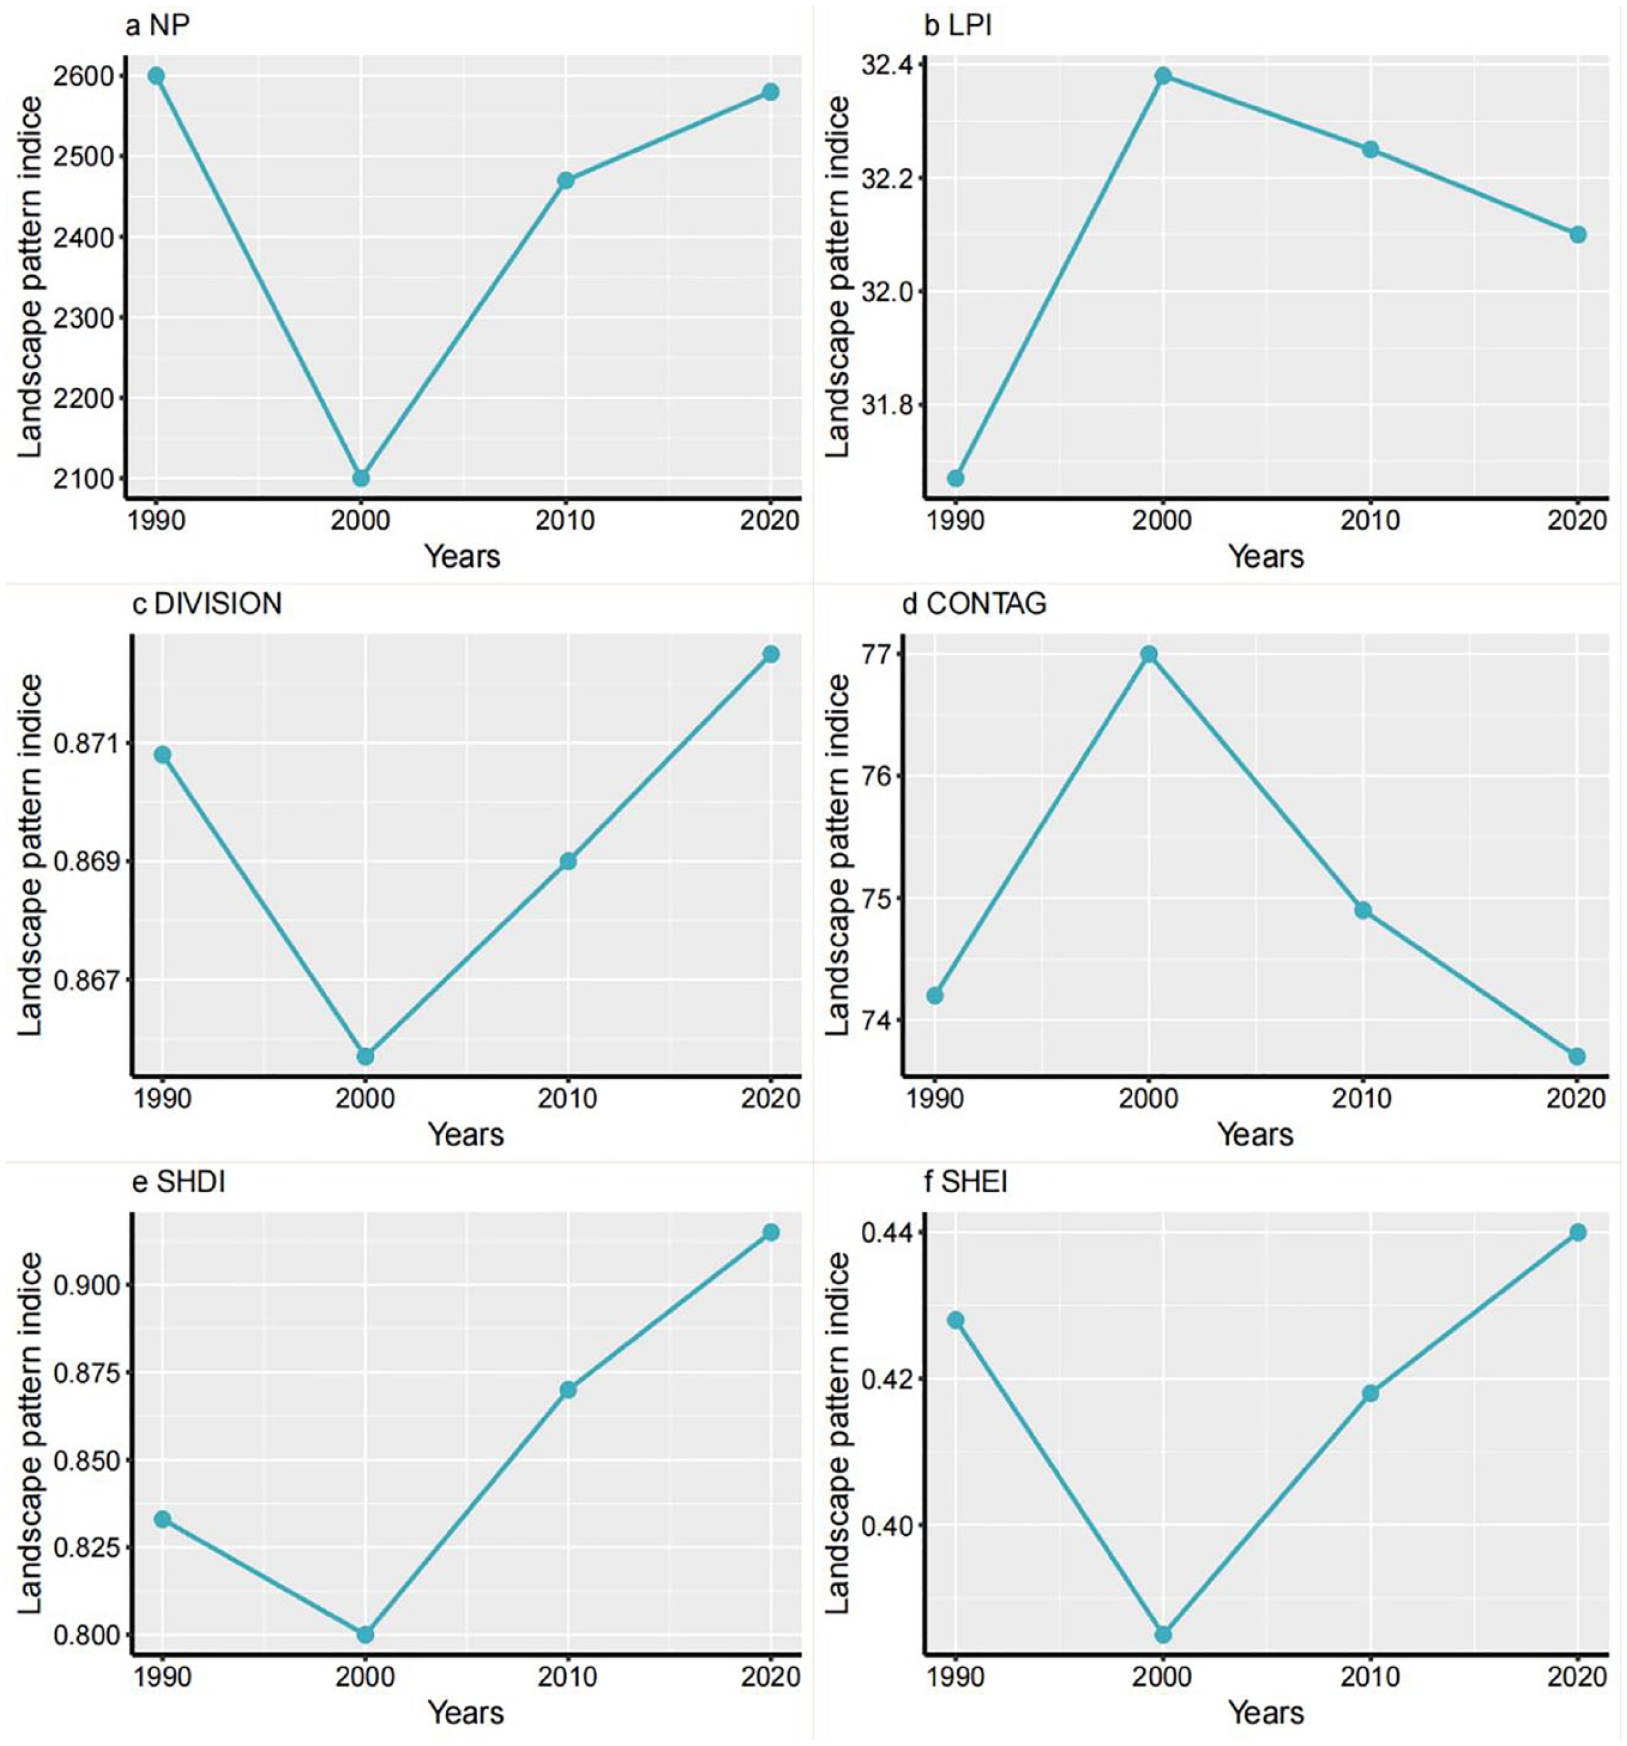
Change of landscape pattern index (a, b, c, d, e, f represent the changing characteristics of NP, LPI, DIVISION, CONTAG, SHDI and SHEI respectively).
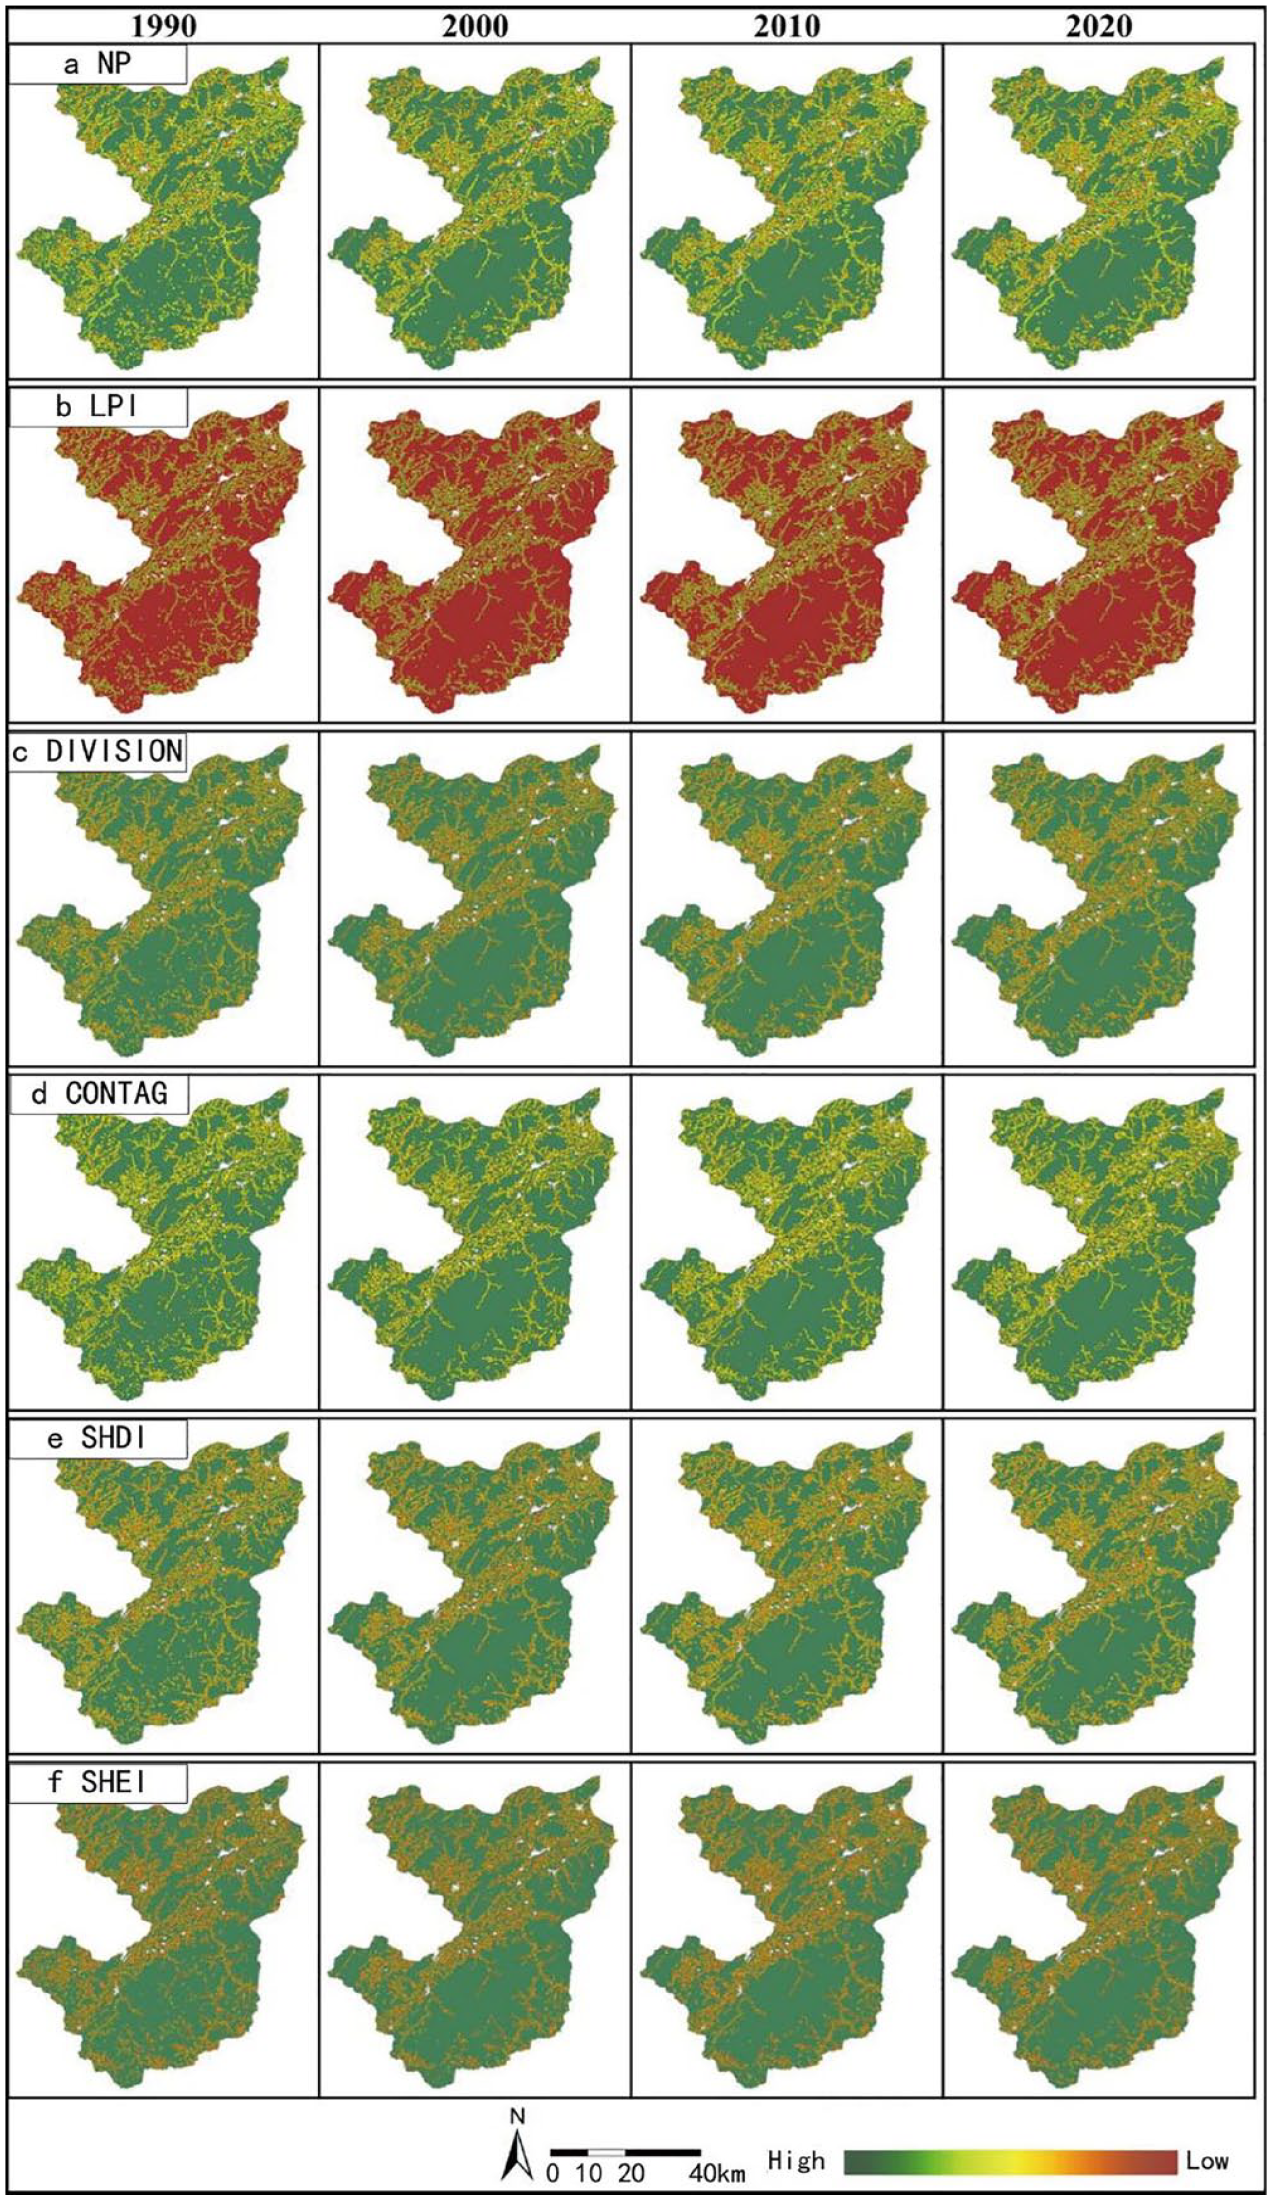
Spatial distribution of landscape pattern index values from 1990 to 2020 (a, b, c, d, e and f represent the distribution characteristics of NP, LPI, DIVISION, CONTAG, SHDI and SHEI respectively).
The DIVISION index declined by 0.87% from 1990 to 2000, then rose, with the 2020 level approximating that of 1990 (Figure 5c). Meanwhile, the CONTAG index increased by 3.71% from 1990 to 2000, subsequently decreasing, but settling 0.94% lower in 2020 compared to 1990 (Figure 5d). These patterns indicate that landscape connectivity in the study area initially strengthened before declining, reflecting an overall reduction. Regions with high connectivity are likewise situated in the northern watershed and along the riverbanks. Connectivity has improved in locations such as Dongzhou Street, Shuangpu Town, and Qiantan Town along the river, while a marked decrease is observed in San Du Town, Yuzhai Township to the south, and Baijiang Town and Yaolin Town to the west (Figure 6).
The SHDI index dropped by 3.61% between 1990 and 2000, then rose, with the 2020 level standing 8.79% above that of 1990 (Figure 5e). Similarly, the SHEI index decreased by 10.47% from 1990 to 2000, followed by an increase, with the 2020 level 2.33% above 1990 (Figure 5f). These findings indicate a trend of initial decline followed by an increase in landscape diversity, resulting in a net growth over three decades. Areas with high diversity are also concentrated in the northern watershed and along both banks of the river. However, diversity has diminished considerably in Yushan Township and Lishan Town in the east, Xinhe Township and Tanxi Town in the south, and Baijiang Town and Yaolin Town in the west (Figure 6).
In summary, the rural landscape patches in the Fuchun River Basin were relatively intact and cohesive, with strong connectivity from 1990 to 2000. Over the past 20 years, however, these patches have progressively become more fragmented and diverse. This intensification of fragmentation, separation, and diversity primarily occurs along the riverbanks and within the northern watershed.
Driving forces behind landscape pattern changes
The p-values for all driver factor influencing rural areas in the Fuchun River Basin are below 0.01, confirming statistically significant correlations. Across the four study periods, each driver factor demonstrates an average explanatory power exceeding 6.53%. Notably, DEM (average explanatory power of 14.60%) and cover type (average explanatory power of 19.64%) emerge as the most influential factors. Most factors exhibit an initial increase followed by a decrease in influence, yet they reveal a general upward trend over the past 30 years (Figure 7).
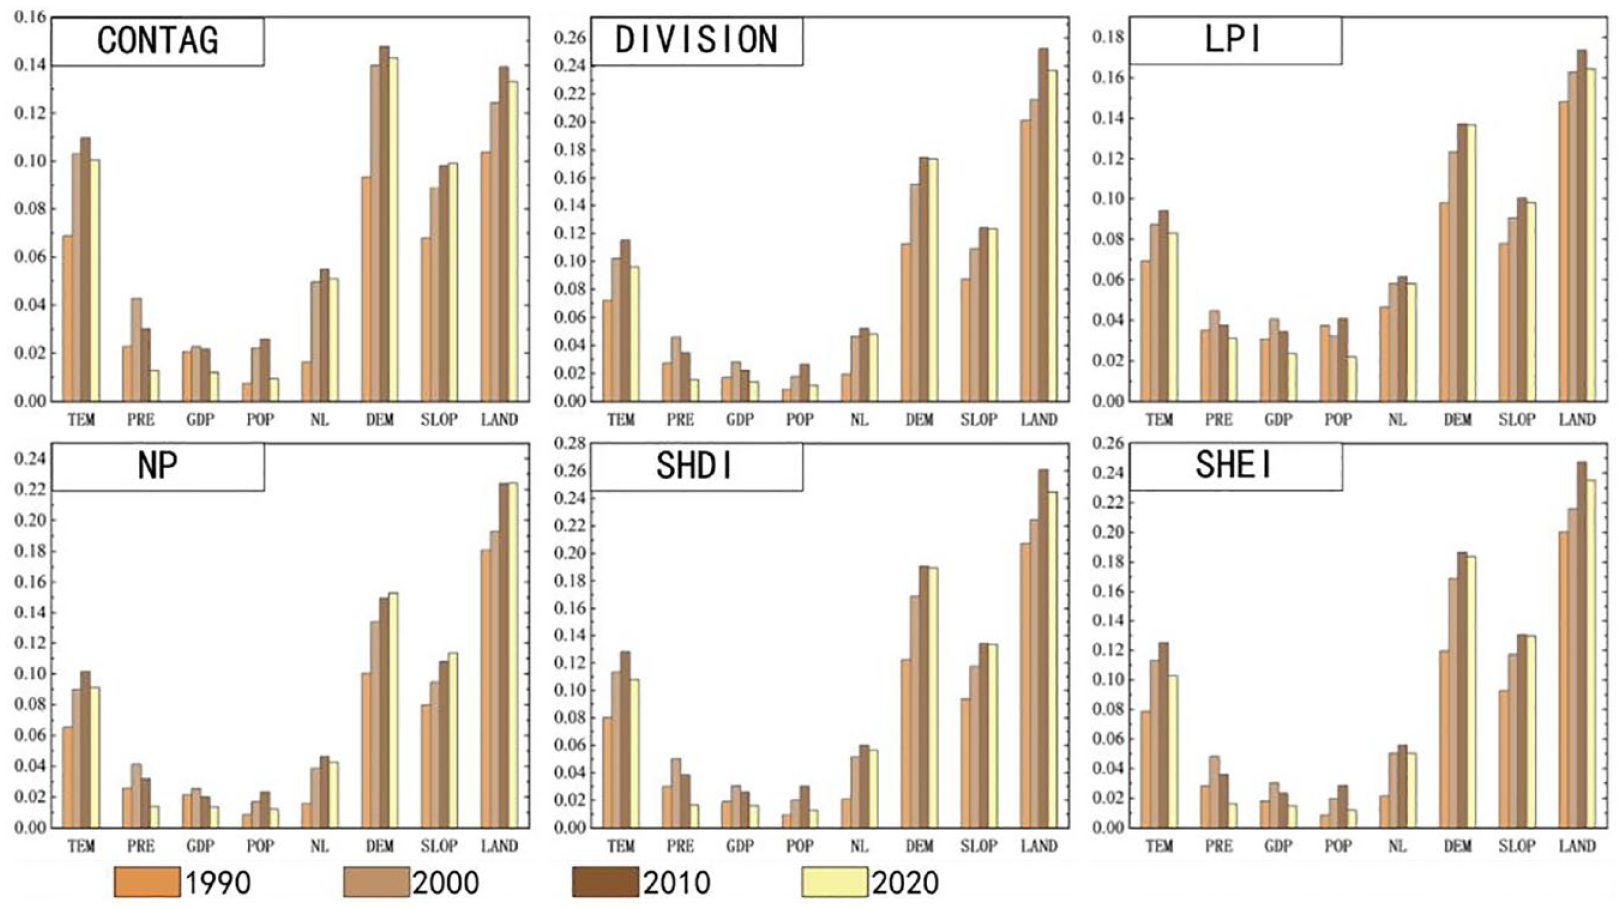
Driving force analysis.
Regarding landscape pattern indices, land cover type, DEM, and slope are identified as the primary drivers influencing the DIVISION, LPI, NP, SHDI, and SHEI indices. Specifically, for the DIVISION, LPI, SHDI, and SHEI indices, the driving forces of these three factors show an initial increase, then a decline, marking an overall downward trend. In contrast, for the NP index, the driving forces of these factors exhibit a sustained decline. Meanwhile, in the case of CONTAG index changes, land cover type, DEM, and temperature are the primary drivers, with their influence initially rising and subsequently declining, displaying an overall upward trend (Figure 7).
The results of the factor interactions in the rural areas of the Fuchun River Basin are presented in Figure 8. In 1990, the LPI index exhibited interactions primarily characterized by two-factor enhancement, whereas for other indices, the interactions were a combination of two-factor enhancement and nonlinear enhancement. In 2000, the NP and SHDI indices demonstrated a mixed interaction form of two-factor enhancement and nonlinear enhancement, while for the remaining indices, interactions were predominantly driven by two-factor enhancement. By 2010, all indices exhibited interactions that were primarily characterized by two-factor enhancement. In 2020, the interactions for the LPI and SHEI indices continued to be dominated by two-factor enhancement, whereas for other indices, the interactions comprised a mixture of two-factor enhancement and nonlinear enhancement.
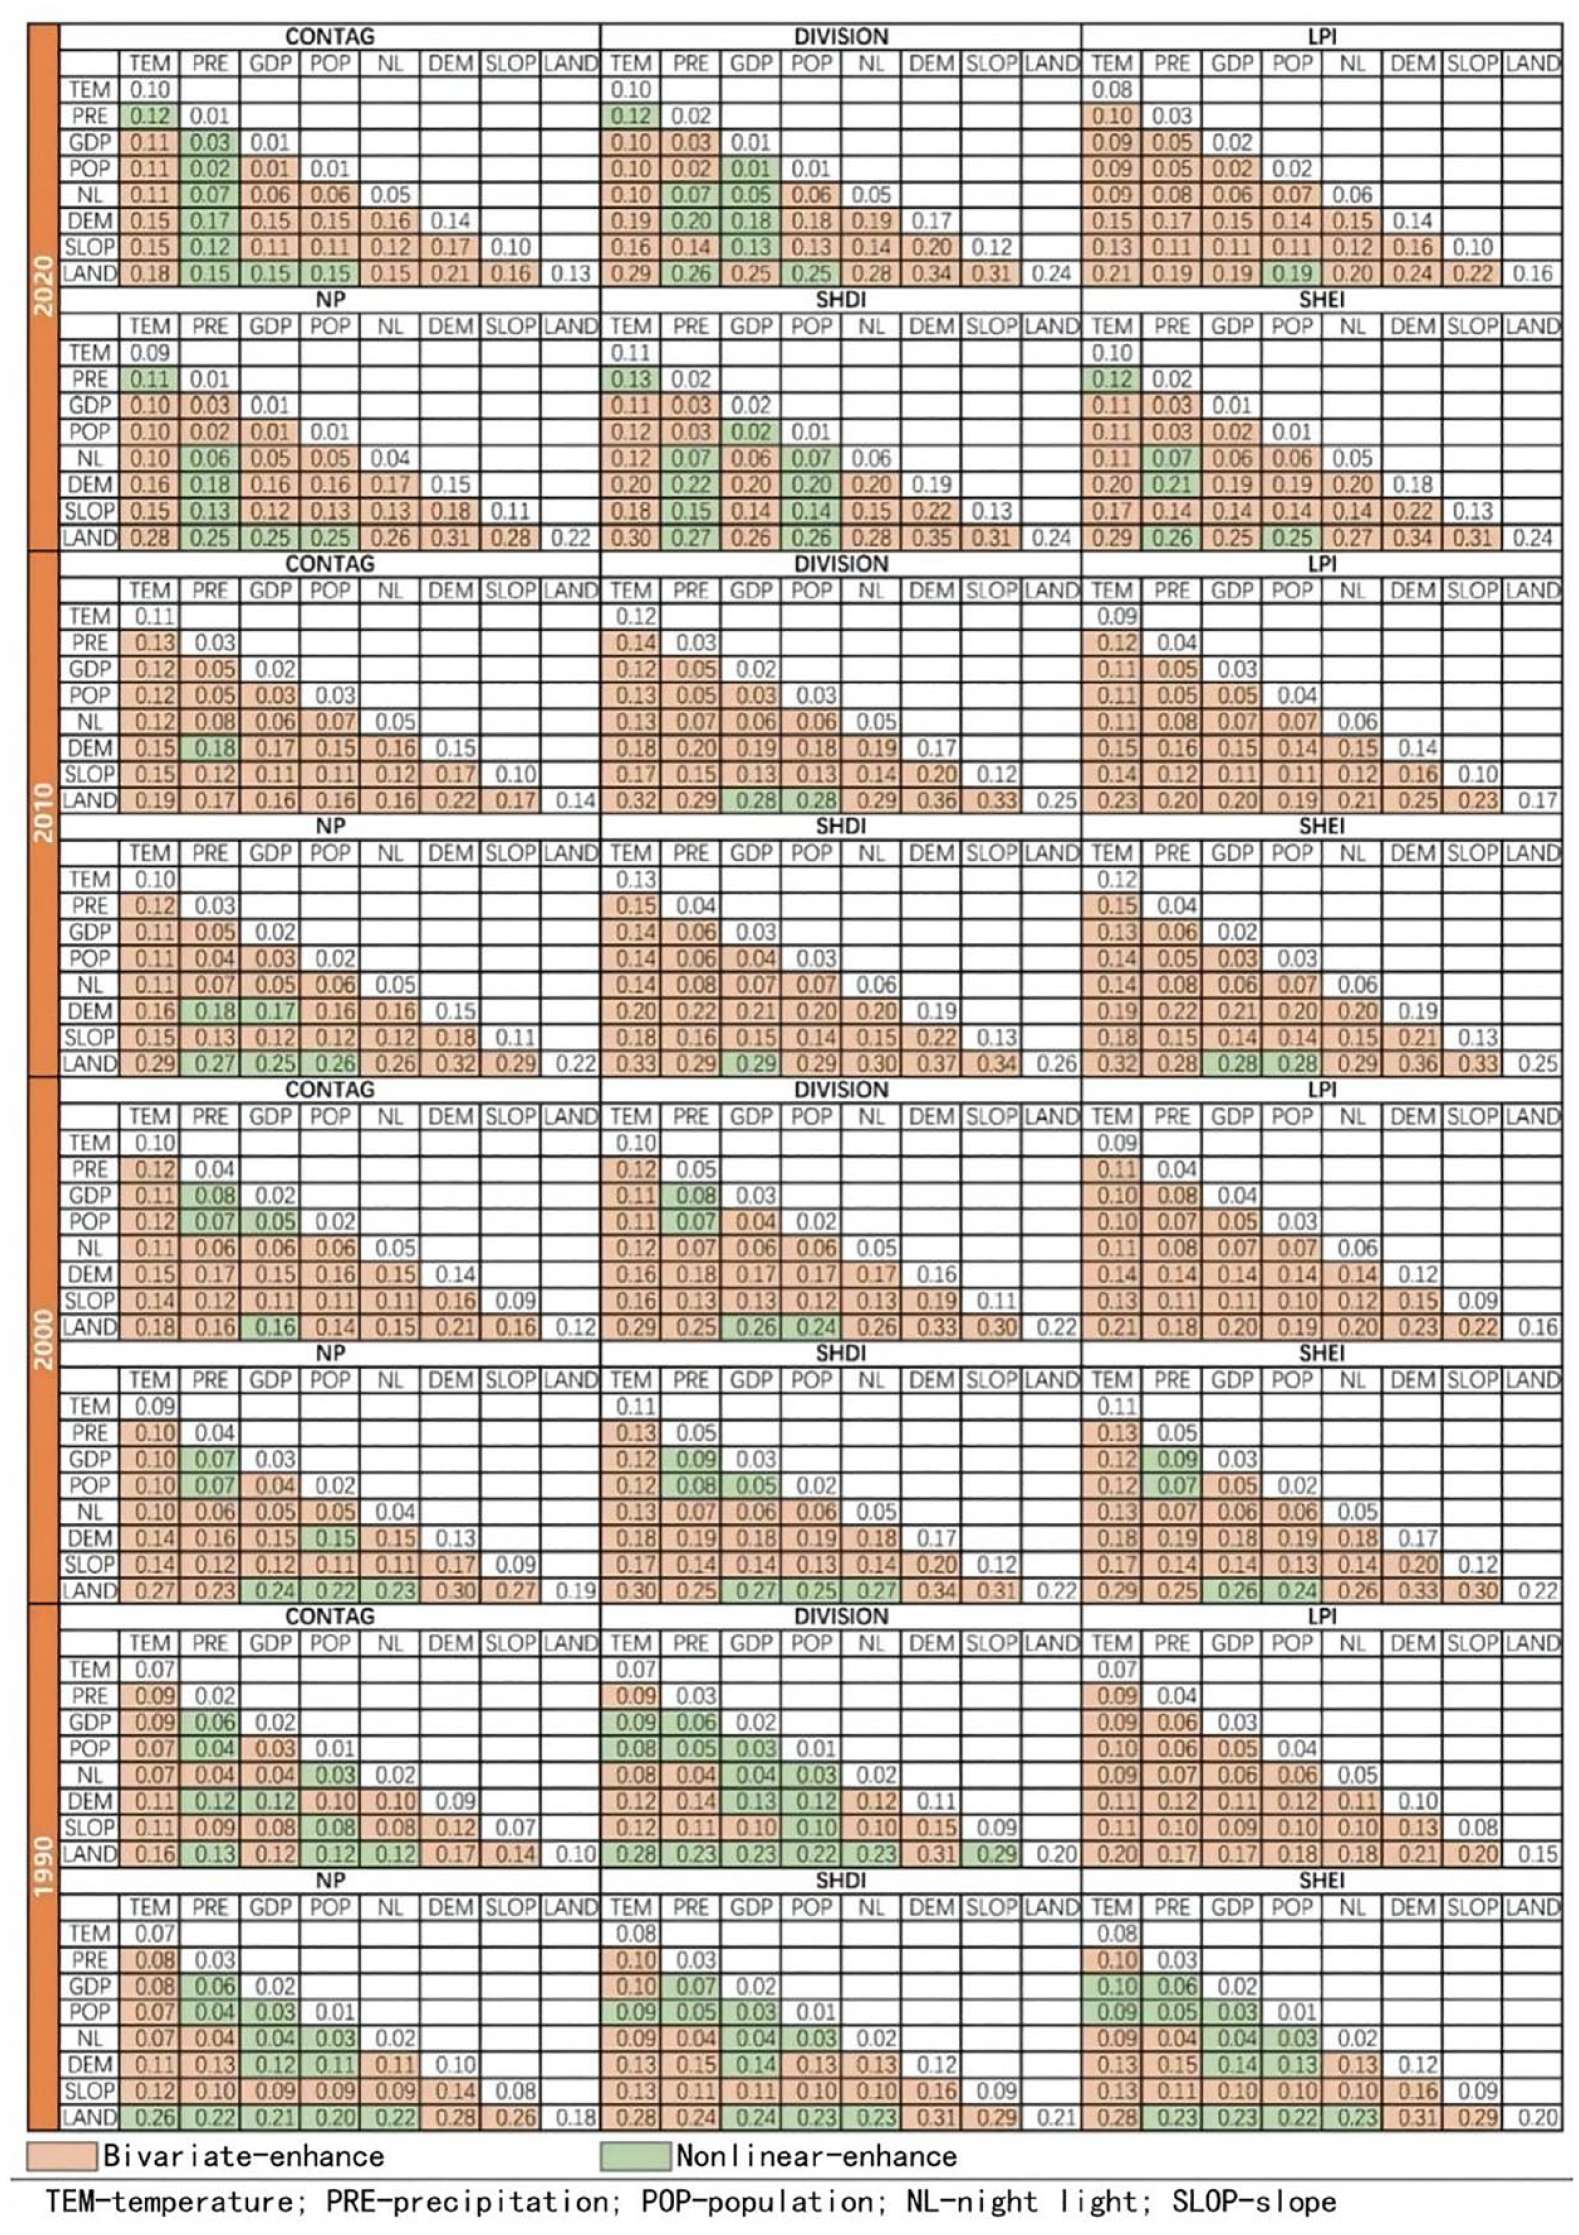
Interactive detection results of driving factors.
Following the identification of key driving factors affecting landscape pattern indices using geographic detectors, a Geographically Weighted Regression (GWR) analysis was performed to further elucidate the spatial heterogeneity of these driving factors in landscape pattern evolution.
As illustrated in Figure 9a, the influence of DEM on the CONTAG index is characterized by higher values in the northern and southern regions, with lower values observed in the central region. Between 2010 and 2020, the influence of DEM in areas such as Gantan Town and Sandu Town in the southern basin increased from ‘moderate’ to ‘high’. Conversely, after 2000, the influence of DEM in northern areas, including Dongzhou Street and Fuchun Street, decreased from ‘moderate’ to ‘low’. The influence of temperature shows a general increasing trend from north to south, maintaining relative stability across the three study periods. The influence of land use type exhibits notable spatial changes: between 1990 and 2000, it progressively decreased from the northeast to the southwest. Post- 2000, the influence shifted from a decrease centered in the eastern region to decreasing trends in the northwest and southwest.
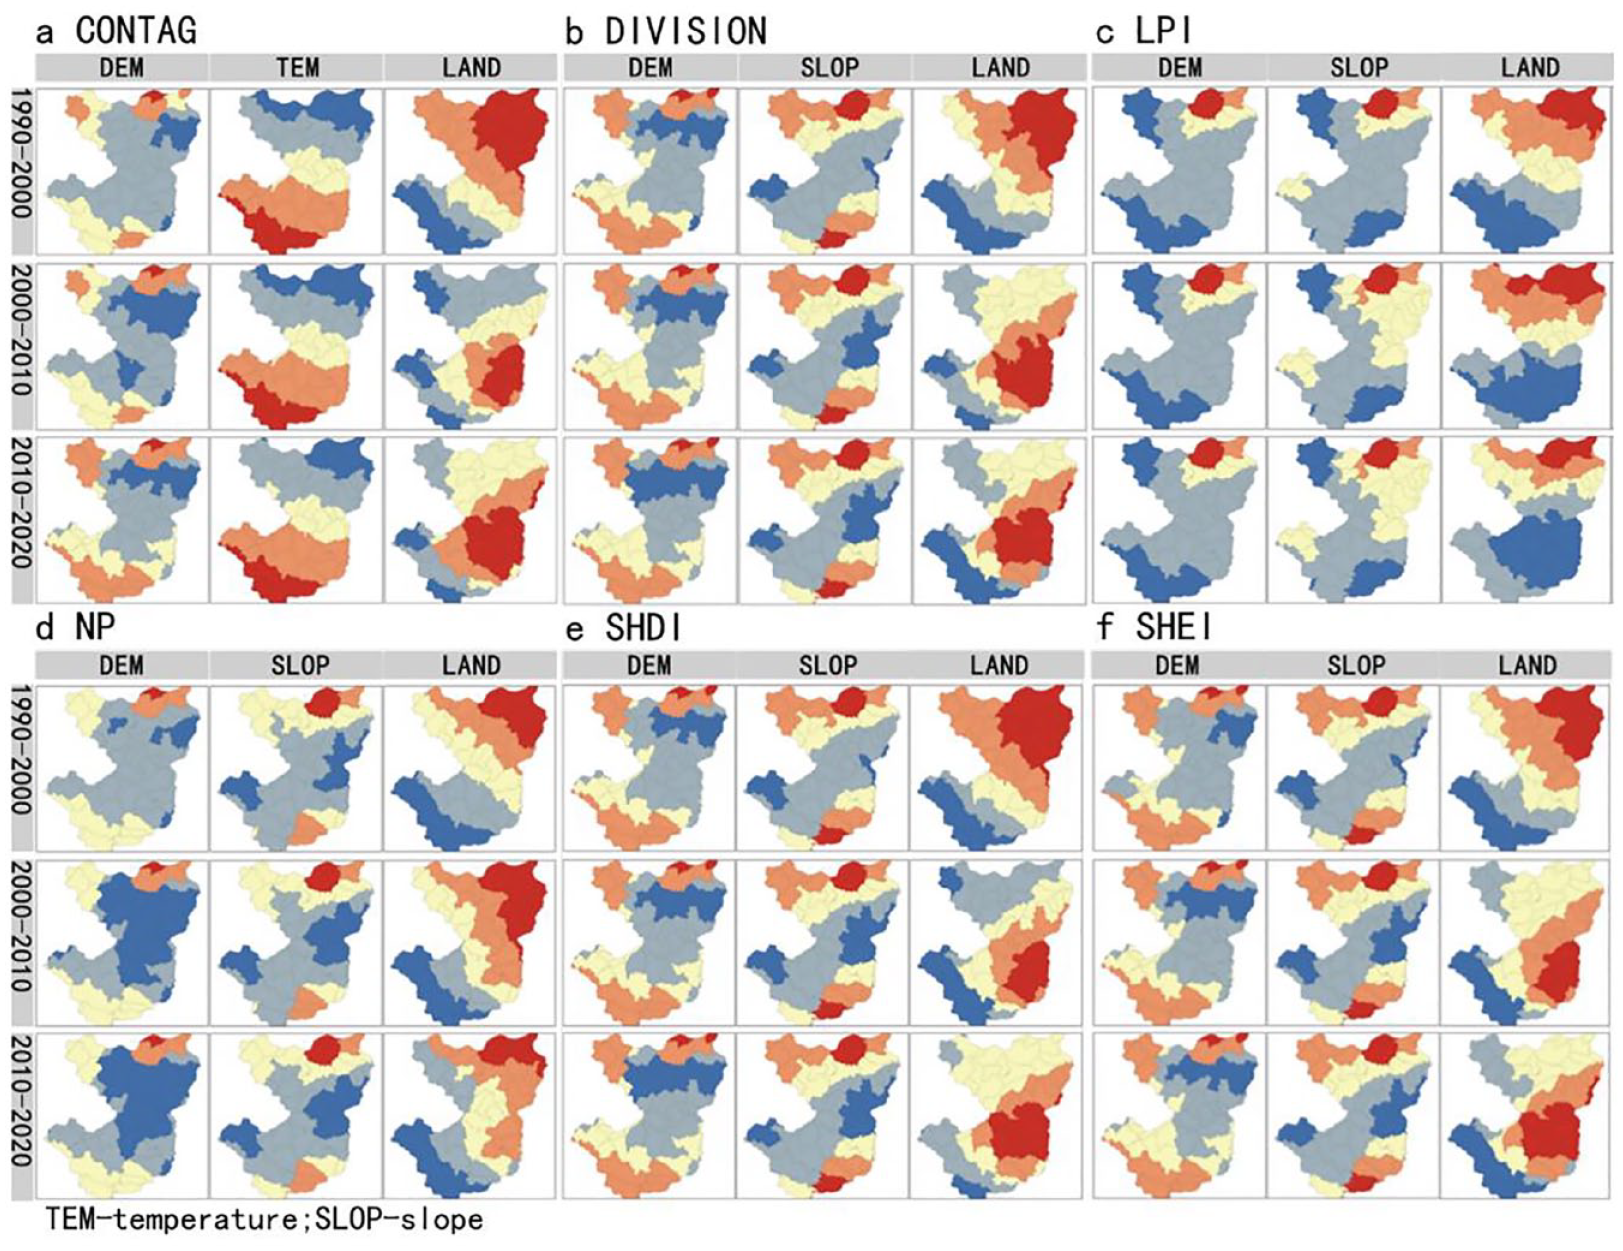
Distribution of the influence of each driving forces (a, b, c, d, e and f represent the distribution characteristics of CONTAG, DIVISION, LPI, NP, SHDI and SHEI respectively).
In Figure 9b, for the DIVISION index, the spatial distribution of land cover type and DEM closely mirrors that of the CONTAG index. Therefore, only the influence of slope is discussed here. The influence of slope is similarly characterized by higher values in the northern and southern regions and lower values in the central area. After 2000, areas such as Dayuan Town and Shangguan Township in the eastern basin experienced a decline in slope influence from ‘moderate’ to ‘low’.
According to Figure 9c, regarding the LPI index, both DEM and slope exhibit a decreasing influence from the northeast towards the west and south. Notably, after 2000, areas such as Huyuan Township and Chang’an Town in the central-eastern part of the basin saw an increase in slope influence from ‘low’ to ‘moderate’. Meanwhile, the influence of land use type in regions like Banqiao Town in the northern basin initially increased before decreasing, whereas areas in the southwest, such as Qintang Township and Zhongshan Township, experienced an increase in influence from ‘low’ to ‘moderate’.
Figure 9d shows that for the NP index, DEM and slope display higher influence in the northern and southern regions, with lower influence in the central area. Following 2000, the influence of DEM in locations such as Changkou Town and Fengchuan Street in the basin’s central region decreased from ‘moderate’ to ‘low’. The influence of land use type exhibits a declining gradient from the north to the southwest. Over the past 30 years, the influence of land use type in areas such as Lishan Town and Lingqiao Town in the northwest initially increased and subsequently decreased.
The influence distribution of land cover type, DEM, and slope for the SHDI and SHEI indices is presented in Figure 9e and f, respectively. These characteristics resemble those observed for the DIVISION index, and thus are not discussed in further detail here.
Discussion
The grain size and amplitude effects in the evolution of landscape patterns in rural areas of the Fuchun River Basin
The calculation results in landscape pattern evolution studies often vary due to differences in the granularity and extent settings, a phenomenon known as the scale effect. Since the 1980s, scale effects have garnered significant attention from numerous scholars (Qiao and Li, 2006; Turner et al., 1989; Wu, 2004). For instance, Li et al. (2021c) compared the impact of different analysis extents on the research outcomes in their study of landscape pattern evolution in major river basins of the Qinghai-Tibet Plateau. However, most current studies on landscape pattern evolution do not consider comparing and determining the optimal analysis scale as a necessary preliminary step. Even in studies that consider scale effects, few simultaneously explore both granularity and extent (An et al., 2021). In this study, the optimal analysis granularity (30 m × 30 m) and optimal analysis extent (200 m) were determined. These results are similar to those obtained by Zhang et al. (2014) in their study of the Minjiang River Valley. However, compared to the study by Feng et al. (2013) on the Guanzhong region, the optimal analysis granularity and extent in this study are generally smaller. The primary reason lies in the constraint imposed by the size of the study area and the complexity of the figure-ground relationship on the choice of the optimal analysis scale. The rural areas of the Fuchun River Basin have a relatively smaller overall range and complex cover types with fragmented landscape patches, where smaller analysis granularity and extent often help to retain more critical detailed features within the site.
The spatiotemporal variations in the evolution of landscape patterns in rural areas of the Fuchun River Basin
The variation in landscape pattern indices at different stages exhibits notable differences, akin to the findings of Zhang et al. (2023) in their study of wetlands in the middle reaches of the Yellow River. In the 1990s, urban development in Hangzhou was still in the ‘West Lake Era’ (Xu, 2021). During this period, the Fuchun River Basin, located in the western suburbs, experienced minimal impact from urban construction and development. Land cover did not undergo dramatic changes, and the regional landscape patches remained relatively intact with good connectivity. However, entering the 21st century, Hangzhou achieved both ‘cross-river development’ and ‘river-embankment development’. As a sub-center of Hangzhou’s networked metropolis and a core axis of ‘river-embankment development’, the Fuchun River Basin has seen an increase in landscape patch fragmentation, higher separation degrees, and intensified human disturbance, resulting in pronounced differentiation. This observation is consistent with Hu and Zhuge’s (2024) study on Xi’an.
From a spatial distribution perspective, the trends of landscape fragmentation and increased complexity of patch shapes are more evident along both banks of the river and in the northern part of the basin. The reasons include the interspersed nature of industrial land, rural residential areas, and agricultural land, along with blurred internal and external boundaries. This region has developed into a transitional area with a mix of urban and rural landscapes, where urban and rural functions overlap (Shaw et al., 2020), known as a semi-urbanized area. Due to the characteristics of semi-urbanized areas—such as complex land ownership, rapid land use changes, and a highly dynamic socio-economic structure (Li et al., 2021a)—scientifically managing its spatial extent and evolution remains a challenge for urban planning and management. Promoting positive development in this region is crucial for advancing urban-rural integration in the future (Liao et al., 2021).
The spatiotemporal variations in the driving forces behind the evolution of landscape patterns in rural areas of the Fuchun River Basin
In the rural areas of the Fuchun River Basin, the Digital Elevation Model (DEM) and land cover types are the primary driving factors, indicating that these elements should be given significant attention in urban and rural spatial planning for the Fuchun River Basin. Due to the complexity of geographical processes, the driving forces of natural factors and human disturbances on regional landscape pattern changes exhibit clear differences across various periods (Dupin et al., 2018; Long et al., 2019). The explanatory power of the selected driving factors in this study has generally increased over the past 30 years, suggesting that these factors remain relevant for future research. Additionally, due to geographic and political variations, the driving mechanisms of landscape patterns display significant spatial heterogeneity (Amuti and Luo, 2014; Ferrara et al., 2016; Zarei et al., 2016). To address this, incorporating Geographic Weighted Regression (GWR) analysis on top of Geographic Detector to identify key driving factors can provide a deeper understanding of the varying impacts of these factors across different regions of the Fuchun River Basin, guiding the delineation of construction units and control of development intensity in various areas (Qian et al., 2023).
For instance, DEM and slope have a significant impact on the landscape pattern evolution in areas such as Xianlin Street and Sandu Town at the northern and southern ends of the basin. In these regions, it is crucial to focus on the strong influence of terrain factors, implementing comprehensive management of slope farmland and soil erosion control projects. This approach would involve relocating industrial, urban, and rural living spaces to areas with gentler slopes, while shifting forest and grassland areas to steeper regions, thereby effectively protecting ecological spaces while alleviating farmland pressure. Conversely, factors such as nighttime lighting and GDP have a pronounced impact on the lands protection areas and priority restoration cape pattern evolution in areas like Tanxi Town and Hangping Town in the southeastern part of the basin. In these regions, emphasis should be placed on human activity factors, promoting the development of specialized towns represented by cultural and tourism industries (Chen et al., 2017), and establishing negative lists for urban construction and environmental access thresholds (Luo et al., 2021; Wu et al., 2019).
Strategic insights for rational land use in rural areas of the Fuchun River Basin
Land use planning policies can effectively control the unchecked expansion of construction land and influence regional landscape morphology and functionality. Research indicates that a 1% increase in the control of total construction land in China can reduce the annual increase in construction land by an average of 44.27 hectares (Zhou et al., 2017). To prevent the continuation of the landscape pattern changes observed over the past 20 years in the rural areas of the Fuchun River Basin—where ecological and agricultural spaces have become increasingly fragmented and separated—it is crucial to strengthen baseline constraints and dynamic monitoring systems for ‘Ecological Protection Red Lines, Permanent Basic Farmland Protection Lines, and Urban Development Boundaries’ (Kong et al., 2020).
Furthermore, for ecological regions with high proportions and contiguous areas, it is necessary to identify key protection areas and priority restoration zones (Gippet et al., 2017; Luo et al., 2020b). Establishing ecological buffer zones and adding ‘stepping stones’ can help reduce human disturbances (Sui and Zeng, 2001; Wu and Chen, 2023). These critical ecological patches should be integrated into existing elements such as urban and rural parks, wetland parks, forest parks, greenways, and wildlife migration corridors, thereby refining and improving the rural ecological space planning atlas.
Finally, special attention should be given to semi-urbanized areas, such as the banks of the river and the northern part of the basin, where landscape pattern fragmentation and patch shape complexity are most pronounced. At multiple scales—regional, municipal, and township—the development and implementation of guidelines for spatial planning (including spatial functions, land use segmentation, and layout) and quantitative control (such as total spatial area, unit indicators, and parcel-specific indicators) are essential (Luo, 2009). These guidelines will support the effective implementation of planning and regulation in semi-urbanized areas.
Limitations and future research directions
The study analyzed the landscape pattern evolution in the rural areas of the Fuchun River Basin over the past 30 years from multiple spatiotemporal scales and enhanced the methodology for analyzing the driving forces of landscape pattern changes by integrating Geographic Detector and Geographically Weighted Regression (GWR). Given that many developing countries are currently undergoing irreversible rapid urbanization processes (Jaeger et al., 2016), the findings of this study can be applied and validated in the scientific utilization of land resources and ecological space protection in these regions.
However, the study has several limitations. Defining rural areas: The study defined rural areas by excluding construction land from 1990 and using the remaining space. Although this approach follows previous research, the classification of land types based solely on satellite remote sensing images remains somewhat generalized. Urban-rural differences manifest in various aspects such as population, industrial structure, and policy strategies. There is a need to establish a more comprehensive indicator system to clearly delineate rural areas.
Temporal sampling points: For practical reasons, the study selected four specific years—1990, 2000, 2010, and 2020—as sampling points to reveal the landscape pattern evolution over the past 30 years. To more precisely and comprehensively model the evolution process, future research should include additional temporal sampling points and shorten the time intervals.
Subjectivity in thresholds and parameters: Although some thresholds and parameters were based on previous research, there remains an element of subjectivity. Future studies should explore more objective methods for parameter setting to minimize the influence of human judgment on the research results.
Conclusions
Key achievements of this study include the determination of optimal analysis parameters, enhancing the objectivity and precision of landscape pattern evolution analysis, and a robust methodological framework combining Geographic Detector and Geographically Weighted Regression (GWR) to elucidate spatial differentiation and interactions among driving forces. The study’s main conclusions are as follows:
(1) The optimal analysis grain for the evolution of landscape patterns in the rural areas of the Fuchun River Basin is 30 m × 30 m, with the best analysis extent being 200 m.
(2) There are significant spatiotemporal differences in landscape pattern evolution. From 1990 to 2000, regional landscape patches were relatively intact, with good connectivity and minimal human disturbance. From 2000 to 2020, fragmentation of landscape patches increased, separation levels rose, and human disturbances intensified, leading to greater differentiation. The trends of landscape fragmentation and increased complexity of patch shapes are more pronounced along both banks of the river and in the northern part of the basin, reflecting the semi-urbanized nature of the region that warrants attention.
(3) There is notable spatiotemporal heterogeneity in the key driving forces behind landscape pattern evolution. The Digital Elevation Model (DEM) (with an average explanatory power of 14.60%) and land cover types (with an average explanatory power of 19.64%) are the most significant driving factors. The explanatory power of most driving factors shows an overall increasing trend, indicating their continued relevance for future research. The influence of DEM and slope is stronger in the northern and southern parts of the basin and weaker in the central region. Temperature’s influence increases from north to south, while the impact of land cover types is stronger in the central area and weaker in the surrounding regions. These findings provide valuable insights for regional zoning control and targeted policy implementation.
Supplemental Material
sj-docx-1-tee-10.1177_2754124X241302104 – Supplemental material for Evolution of landscape patterns and driving forces in rural areas of the Fuchun River Basin
Supplemental material, sj-docx-1-tee-10.1177_2754124X241302104 for Evolution of landscape patterns and driving forces in rural areas of the Fuchun River Basin by Tao Xu, Zhenguo Wang, Yilun Wu, Yaping Zhang, Wenbin Nie and Bin Xu in Transactions in Earth, Environment, and Sustainability
Footnotes
Acknowledgements
We would like to express our profound gratitude to Professor Yang Jie and Professor Huang Xin of Wuhan University for the CLCD dataset. This data set provides the basic data of land use for this study.
Authors’ contributions
Tao Xu: conceptualization, methodology, software writing - original draft preparation. Zhenguo Wang: language polishing, organizing framework, methodology. Yilun Wu: language polishing, methodology. Yaping Zhang: data analysis, visualization. Wenbin Nie: framework revision, content check. Bin Xu: writing - reviewing and editing.
Declaration of conflicting interests
The author(s) declared no potential conflicts of interest with respect to the research, authorship, and/or publication of this article.
Funding
The author(s) disclosed receipt of the following financial support for the research, authorship, and/or publication of this article: This research was financially supported by the Key Research and Development Program of the Zhejiang Provincial Department of Science and Technology under Grants 2019C02023.
Availability of data and materials
The datasets used and analyzed during the current study are available from the corresponding author on reasonable request.
Supplemental material
Supplemental material for this article is available online.
Author biographies
References
Supplementary Material
Please find the following supplemental material available below.
For Open Access articles published under a Creative Commons License, all supplemental material carries the same license as the article it is associated with.
For non-Open Access articles published, all supplemental material carries a non-exclusive license, and permission requests for re-use of supplemental material or any part of supplemental material shall be sent directly to the copyright owner as specified in the copyright notice associated with the article.