
Abstract
In the context of global climate change, the hydrological cycle of the Yangtze River source area has produced significant changes. It is of great practical value to study the influence of regional precipitation changes and precipitation events on regional water resources, especially groundwater. This study uses base flow segmentation and GRACE groundwater reserve calculation technology to examine precipitation’s spatial and temporal variation, especially extreme precipitation events, in the Yangtze River source area. The events analyzed were the extreme precipitation-runoff-base flow response from the Yangtze River source, the extreme precipitation-terrestrial water (surface water and groundwater) response, and the comparison of these events. The findings indicated that extremely strong precipitation, maximum precipitation for five consecutive days, days of moderate rain and above moderate rain intensity precipitation, the longest number of precipitation days, and other extreme precipitation indices had a significantly increasing trend and increased intensity of extreme precipitation events, the regional differences in precipitation trended less significantly. The base flow index gradually increased at a rate of 0.0014 yr-1, suggesting the overall increase of water resources and the contribution rate of groundwater to the runoff was an increased trend . There is a high correlation between the change of water resources in the source area and the change of precipitation, and the increased precipitation influenced an increase in groundwater and regional water resources. These findings inform current knowledge of precipitation-groundwater response mechanisms in alpine and arid regions such as the Qinghai-Tibet Plateau.
Introduction
According to the sixth Assessment Report (AR6) of the United Nations Intergovernmental Panel on Climate Change (IPCC) in 2022 (Intergovernmental Panel On Climate Change, 2023), from 2011 to 2020, the average global surface temperature increased by 1.09°C (0.95–1.2) from 1850 to 1900 and by 0.19°C (0.16–0.22) from 2003 to 2012. Global temperatures are also forecast to increase by at least 1.5°C in the next 20 years. Global warming is expected to increase the frequency and scale of extreme and even destructive climate events (Flato et al., 2013). Such extreme precipitation events can affect regional hydrological cycles, especially groundwater (Khandu et al., 2016). However, precipitation impacts on groundwater are currently difficult to assess (Taylor et al., 2013). Current research develops analytical models to study precipitation impacts on groundwater. For example, Zhang et al. (2016) applied the soil water balance model to study the spatial and temporal dynamics of groundwater recharge in China’s Northern High Plain (NHP) from 1910 to 1950. Zhang et al. (2014) analyzed the trend of climate change and extreme climate characteristics in the North China Plain over the past 60 years. Other scholars have used gravity recovery and climate experiment (GRACE) and Global Land Data Assimilation System (GLDAS) data for related studies (Frappart and Ramillien, 2018; Jiang et al., 2014; Lo et al., 2016; Ramillien et al., 2008).
Recent research has examined extreme precipitation events and changing trends in the Qinghai-Tibet Plateau. For example, Lun et al. (2021) used the coupled model intercomparison project (phases 5 and 6 of the WCRP Coupled Model Intercomparison Project, respectively). They compared the annual precipitation estimation results of the CMIP 6 and CMIP 5 models in Qinghai-Tibet. They showed that the efficiency of the CMIP6 multi-model ensemble (MME) model increased significantly compared with the CMIP5 MME model, especially in areas of 2000–3000 m and >5000 m elevation, and the error of the CMIP6 MME model can be reduced by 40–77% . Lu (2019) used the quantile regression method to study the precipitation pattern of the Tibetan Plateau and indicated that the relationship of precipitation-terrain cragginess depends on the appropriate spatial scale.
In a study of precipitation and groundwater in the Qinghai-Tibet Plateau region, Liu et al. (2020) used a time-variable gravity field model and GRACE data to estimate the equivalent water height in the Qinghai-Tibet Plateau. They found that precipitation is an important source of groundwater recharge. Ren et al. (2023) calculated the groundwater storage (GWS) of the Tibetan Plateau and concluded that the GWS in the eastern and northern parts are decreasing while the GWS in the west and south are increasing. Du et al. (2020) compared the equivalent runoff obtained by GRACE and GLDAS. They found that the storage and runoff in the Yangtze River source area are mainly controlled by precipitation and evapotranspiration.
However, most current studies focus on independent precipitation events or groundwater resource changes rather than the relationship between precipitation and groundwater response, especially for the source areas of the Yangtze River. This vast river system is located in the Qinghai-Tibet Plateau’s hinterland; its source area is an important source for other rivers and is part of the largest nature reserve in China (Song et al., 2021). Environmental changes in the Qinghai-Tibet Plateau have influenced several environmentally degrading events in the source area of the Yangtze River over the past two decades: (1) soil erosion; (2) swamp degradation and land desertification; (3) vegetation degradation and serious rodent damage (Qingguang et al., 2006). These events are closely related to the regional climatic and hydrological changes and seriously affect water sources and ecological resources in the middle and lower Yangtze River basin.
Existing studies mainly focus on analyzing groundwater reserves through remote sensing data, but few synchronize them with ground observation data. Therefore, this study established an observational method of ground-satellite synchronization to solve the problem of the low credibility of a single method. In a previous study, Xu et al. (2023) revealed that many researchers considered the need to compare GRACE and its derivatives with local measurements. The studies of Feng et al. (2013) and Qu et al. (2024) indirectly proved the use of GRACE data to evaluate groundwater resources and ground monitoring data as verification. Currently, the verification of the calculation results of satellite monitoring data is mainly based on the ground observation well data (Chen et al., 2016; Liesch and Ohmer, 2016; Nadeem et al., 2023). There are few studies on the verification of groundwater reserves obtained by base flow segmentation, but existing studies have confirmed that this method has high accuracy for the change of groundwater reserves (Chen and Teegavarapu, 2020; Gan et al., 2022) because groundwater reserves can directly affect the recharge of groundwater to runoff. Therefore, in this paper, the data obtained by the base flow segmentation method and satellite observation method are relatively analyzed, the relationship between it and precipitation is obtained, and the influence of extreme precipitation on regional groundwater resources is analyzed from a new research perspective.
This study examines the linkages between extreme precipitation events and groundwater change in the Yangtze River source area, focusing on the extreme precipitation-runoff-groundwater response mechanisms and the extreme precipitation-terrestrial water-surface water-groundwater response mechanisms. The comparison of these two model results enables a more accurate identification of the effects of extreme precipitation events on groundwater resources. This study provides a reference for assessments of extreme precipitation event impacts on groundwater resources in the alpine and arid regions and for technical, protection, and research-oriented work in these areas.
Data source and methods
Research area
The source areas of the Yangtze River are the Kunlun Mountains in the north, the Tanggula Mountains in the south, the Bayan Kala Mountains in the east, and the Wulan Mountains in the west (Figure 1) . The average height of the mountains surrounding the basin is over 5500 meters above sea level. Most of the other areas are over 4000 meters above sea level, and the average height of the source area is around 4700 meters. In these areas are snow-capped mountains, glaciers, marshes, and lakes, among which glaciers are mainly distributed in the northern and southwest areas of the Yangtze River. There are plains, some with tidal flats, and large marshes. In the southeast mountains and valleys, the relative height difference is more than 1000 meters, the terrain is relatively steep, and the slope is more than 30° in some places. In the six main tributaries of the Yangtze River, including the Tuotuo River, Dangqu, Chuar River, Konuqu, Nichiqu, and Dengerqu, there are 756 mostly small and medium-sized glaciers, with only eight over 20 kilometers long, mostly in the Gradandong Peak area.
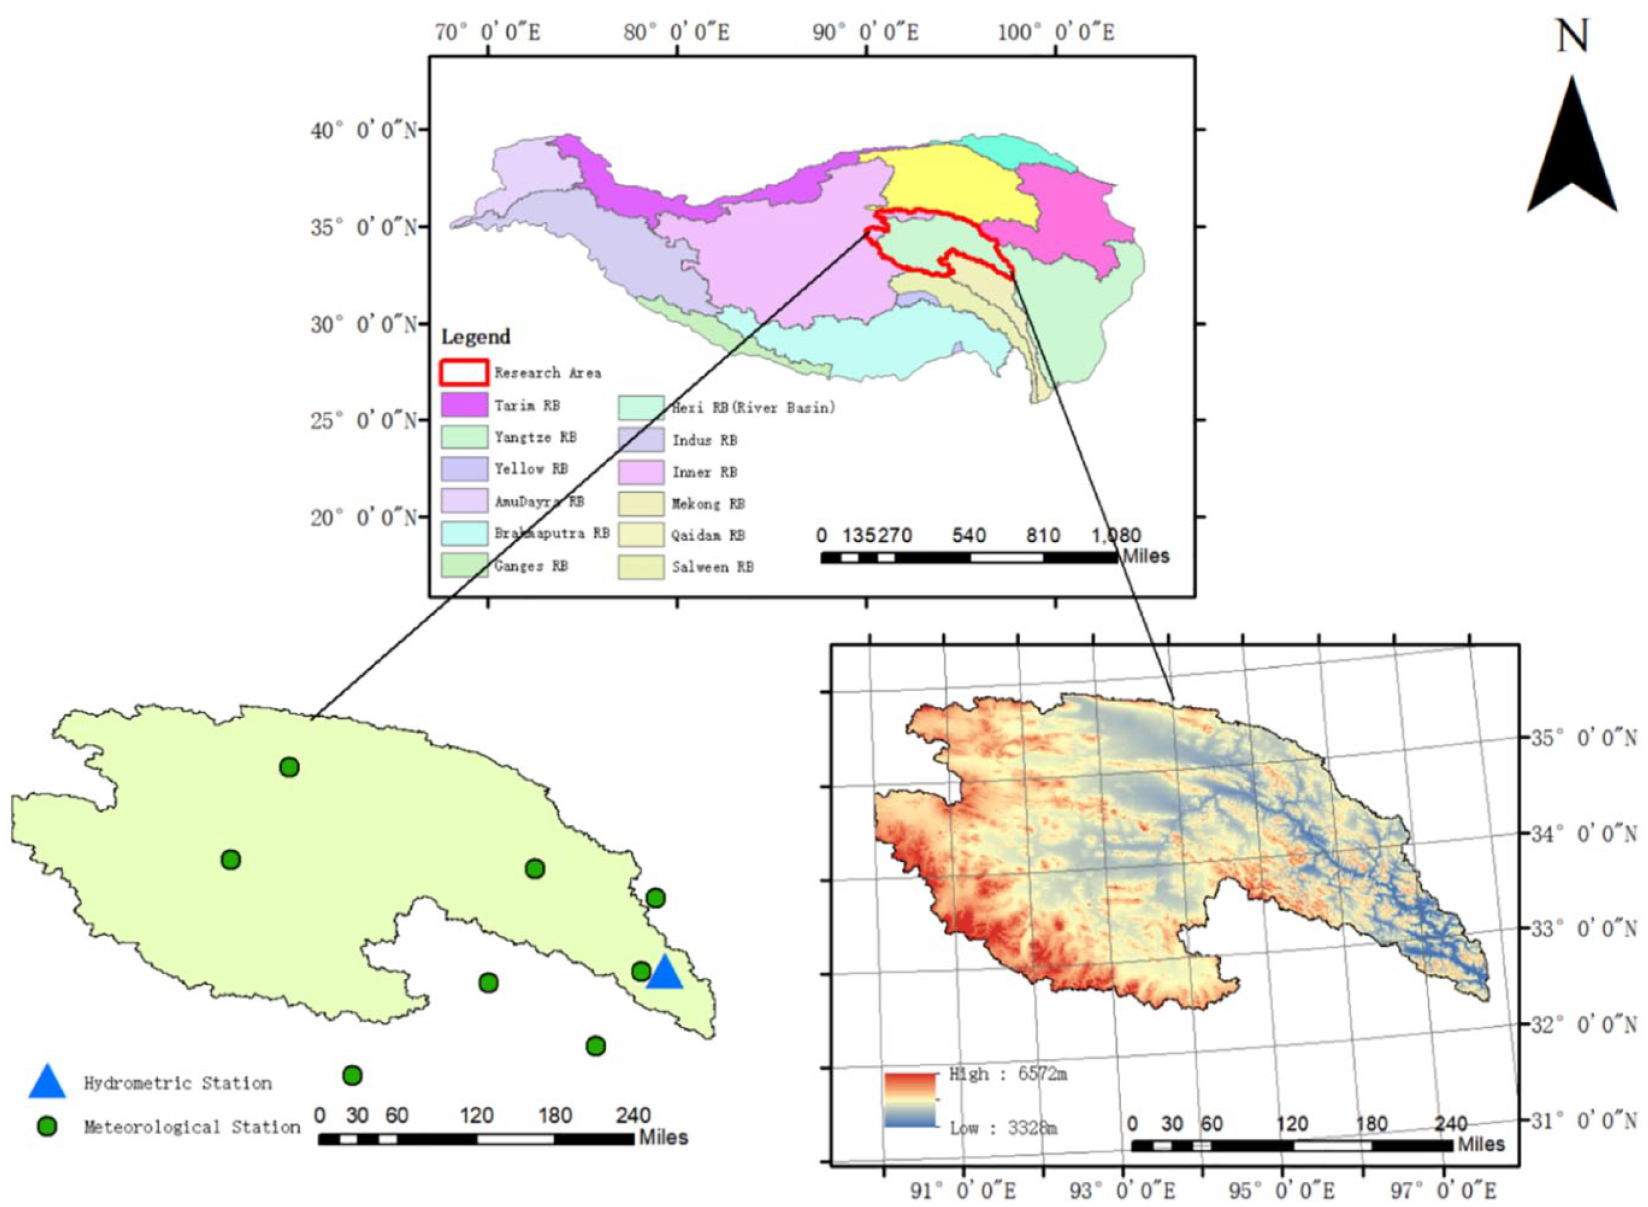
Overview of the study area of the Yangtze River source area.
Data Sources and Processing
The data from eight meteorological stations in the study area were selected for this article. The data sources of this study are shown in Table 1. Before specific analysis, the method was manually checked to complete the data by interpolating or filling 0. However, before using Rclimdex for extreme precipitation index analysis, to ensure the authenticity of the analysis results, the missing test value is set to -99.9 by referring to the Rclimdex manual.
Data source table.
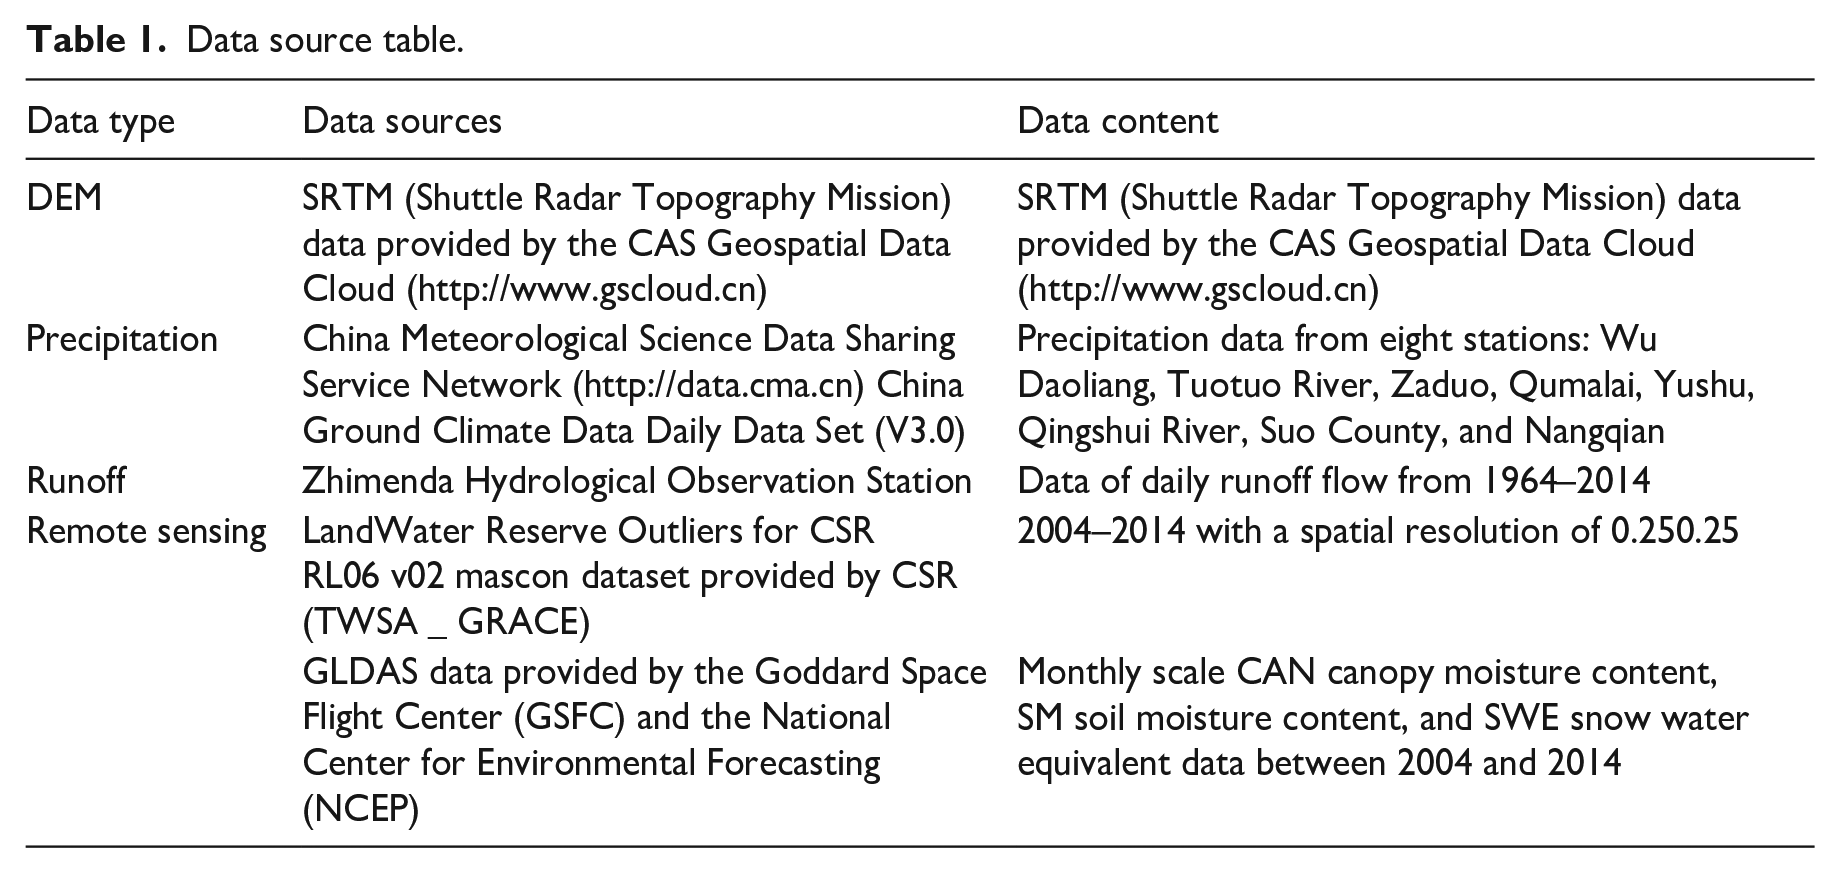
For hydrological data, runoff data is mainly checked by manual inspection, and no missing data is found. For GRACE data, the data interval used in this study did not contain missing tests and overlapping data, and no other processing was required.
Method
Extreme precipitation index analysis method
RClimDex
Using the RClimDex software package, 10 indicators related to precipitation were selected to analyze the mean precipitation data at eight meteorological stations in the Yangtze River source area. RClimDex is a method recommended by the World Meteorological Organization (WMO) to determine climate change indicators and has been successfully used by researchers in several countries (Al Qatarneh et al., 2018; Almazroui et al., 2014; Cheng et al., 2022; Croitoru et al., 2013; Shrestha et al., 2017) The R-based RClimDex, developed by the Climate Research Branch of Meteorological Service of Canada, provides quality control of daily input data and provides a user-friendly interface to calculate the Extreme Climate Index (http://etccdi.pacificclimate.org/software.shtml).
Pearson-III
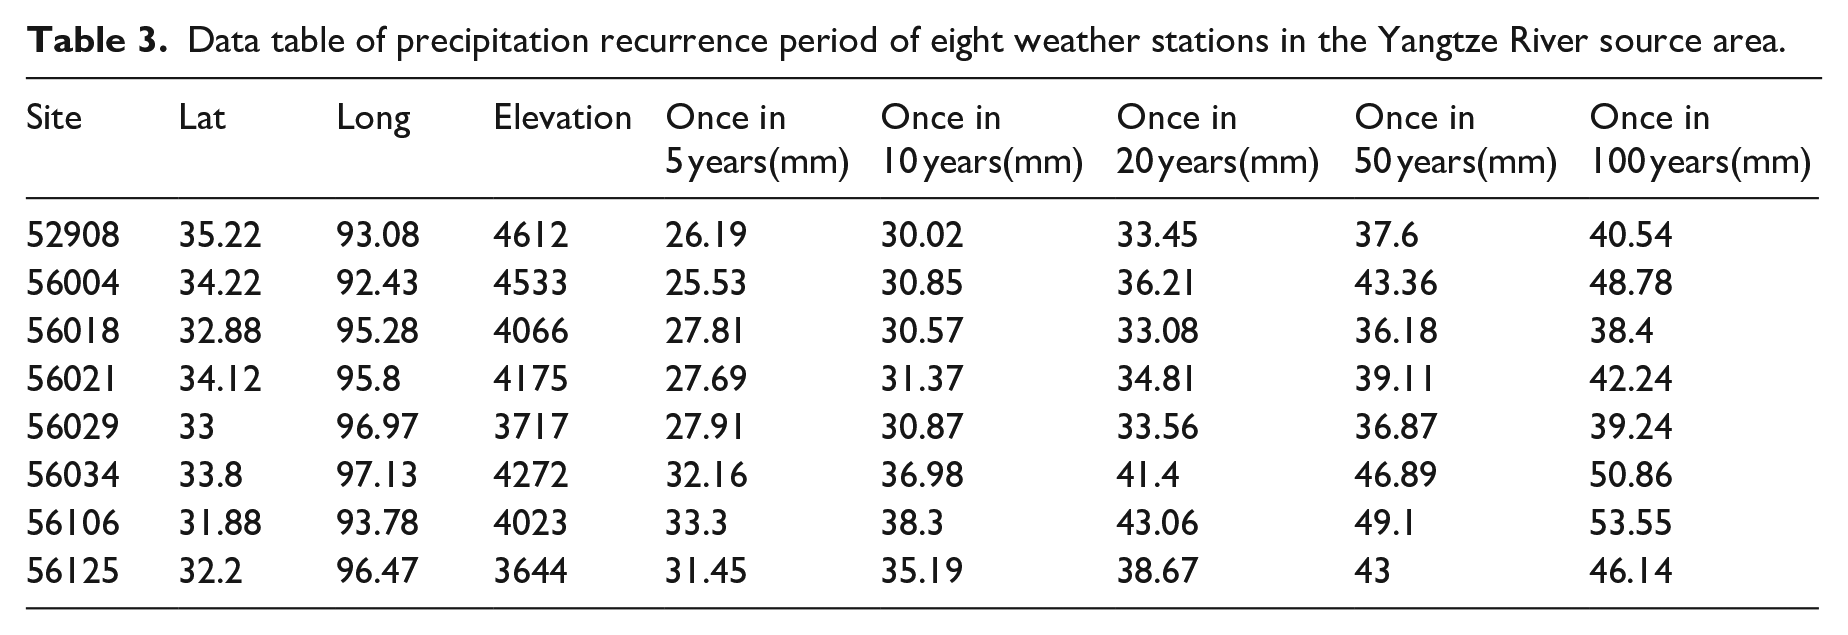
The annual maximum daily precipitation was determined, and the extreme precipitation under different recurrence periods was calculated (Sun et al., 2017; Yan et al., 2013); the historical data were confirmed, the extreme precipitation and frequency of 5, 10, 50, and 100 years, and possible changes to the extreme precipitation intensity in the source area of the Yangtze River were analyzed.
Water resource data extraction method
Improved Kalininin flow segmentation
Runoff base flow segmentation is mainly processed by the digital filtering method (Peters and van Lanen, 2005; Pozdniakov et al., 2022), but the modified Kalinin method was used as it is more consistent to groundwater and runoff links, and for base flow segmentation.

In the formula, Qlow,n is the underground runoff at time tn, Qlow,n-1 is the underground runoff at time tn-1
Remote sensing data processing
The CSR-released RL06 v02 Mascon product (Save et al., 2016) was used, with a spatial resolution of 0.250.25.
The main steps for obtaining the equivalent Water High (EWH) land water reserve anomaly data set in millimeters (mm) using the RL06 v02 Mascon product released by CSR are as follows:
(1) Conduct ellipsoid earth calibration;
(2) The geocentric correction model performs a first-order item correction;
(3) Glacial Equalization Adjustment (GEA );
(4) AOD1B ‘GAD’ field modification;
(5) Replace C20 and C30.
When the GRACE data is missing, the difference must be filled, and due to the 11-month data interruption between GRACE satellite and GRACE-FO satellite data, there are errors, so the singular spectral difference method is used to fill the difference (Yi and Sneeuw, 2021).
GRACE data is land water reserve data, and surface water data must be deducted to obtain groundwater data (Henry et al., 2011; Jin and Feng, 2013). The specific formula is:


CAN is the canopy water content, [CanopInt]; SM is the soil water content, [SoilMori] (four values); SWE is the snow water equivalent, i.e., [SWE _ other]; and the units of these three variables to determine groundwater reserve change (ΔGWS), which can be obtained from the following equation:

CAN, SM, and SWE in the formula were obtained from GLDAS-2.1.
Correlation analysis method
Continuous wavelet transform (CWT)
In georesearch, wavelet analysis is a powerful mathematical analysis method (Labat et al., 2001; Partal, 2012; Qi et al., 2018; Rezaei and Saatsaz, 2021; Wang et al., 2023; Zhang et al., 2012). This method decomposes the temporal signal into two time-frequency dimensions, which inherit and develop the localized characteristics of short-time Fourier transformation and overcome the inadaptation of window width with frequency change. This method can also provide a frequency-sensitive time-frequency window with stronger processing power for non-stationary signals. Morlet Wavelets are more local in the time-frequency domain and contain richer oscillatory information, often used to process hydrometeorological data. For a time series X1 of N length, the continuous wavelet transform is defined as:
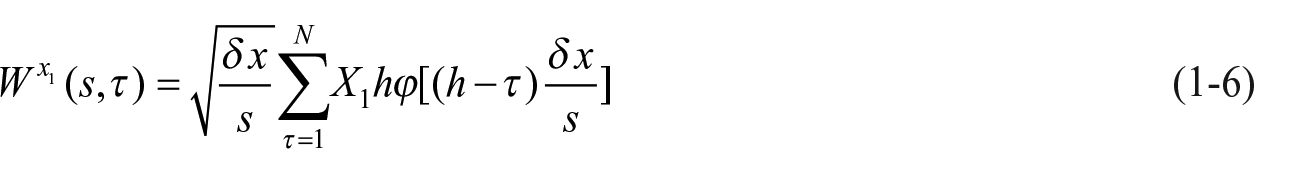
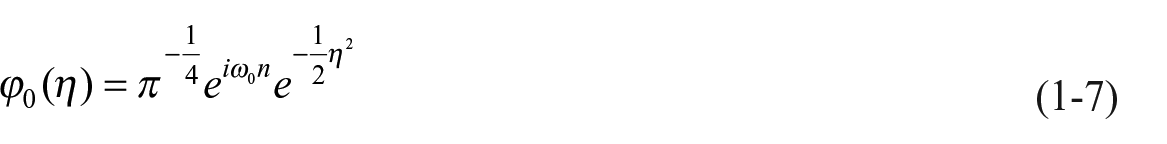
In the formula,
Wavelet coherence transform
Wavelet correlation analysis can measure shared high-energy regions between time-spatial frequencies and their phase relationships. The wavelet-related power spectrum of two standardized time series X and Y, is calculated as follows:
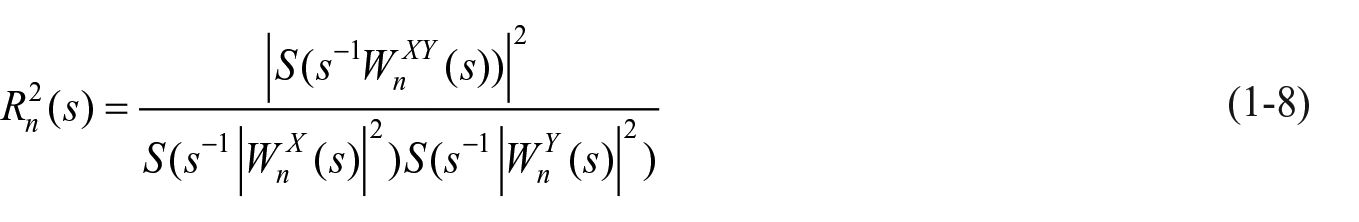
In the formula,
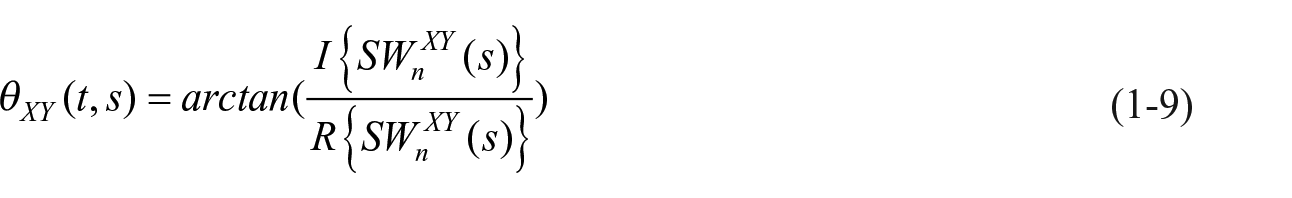

Where I and R are real and imaginary parts, respectively, the phase difference represents the four quadrants, which represent the lead and lag relationships and the correlation of the time series X and Y. The pointing arrows in the wavelet correlation power spectrum indicate these.
First quadrant (0–90): The arrow pointing to the first quadrant indicates a positive correlation between the two time series; this means that they are in phase with similar trends over time. The second quadrant (90–180): An arrow pointing to the second quadrant indicates a negative correlation between the two time series; this means that they are opposite in phase, where an increase in one time series leads to a decrease in another and vice versa. The third quadrant (180–270): The arrow points to the third quadrant in which one time series is ahead of the other; this means that a change in one time series precedes another in time. The fourth quadrant (270–360): An arrow pointing to the fourth quadrant indicates that one time series is behind another time series; this means that changes in one time series occur later than changes in the other.
Results
Temporal and spatial evolution law of extreme precipitation events in the source region of the Yangtze River
The daily precipitation data of the Yangtze River source area from 1964 to 2014 were analyzed, including 10 extreme precipitation index analyses recommended by the World Meteorological Organization (WMO). Pearson-III probability analysis of the maximum daily precipitation data over 5, 10, 20, 50, and 100 years using the ArcGIS anti-distance interpolation method of reproduction data space interpolation clarified the temporal distribution pattern and evolution of extreme precipitation events.
The following conclusions are drawn:
(1) The extreme precipitation index R95p (Annual total PRCP when RR > 95p), R99p (Annual total PRCP when RR > 99p), Rx1day (Monthly maximum 1-day precipitation), and Rx5day (Monthly maximum consecutive 5-day precipitation) all showed a significant increasing trend, and the extreme precipitation intensity in the source area showed an increasing trend. The fitted growth rates were 0.467 mm/yr, 0.0.038 mm/yr, 0.013 mm/yr and 0.065 mm/yr, respectively. The resulting R10, (Annual count of days when PRCP≥ 10mm) and CWD (Maximum length of wet spell), also showed an increasing trend. The annual precipitation period in the source area showed an increasing trend with the fitted growth rates of 0.009 d/yr and 0.042 d/yr, respectively. The analysis results of the two data sets proved that the extreme precipitation intensity, precipitation intensity, and precipitation duration of the Yangtze River source area all showed a simultaneous, increasing trend. The growth trend of PRCPTOT (Annual total precipitation in wet days) and SDII (Simple pricipitation intensity index) results supports the above conclusion (Figure 2; Table 2). Therefore, the intensity and frequency of precipitation events, especially extreme precipitation events, may increase because of global warming.
(2) On the spatial scale, using the fitting analysis of the meteorological station Rx1day index combined with spatial interpolation, the findings indicated a decreasing trend from the southwest to the northeast, decreasing the overall trend. Still, the north-south differences were gradually reduced (Figure 3; Table 3). Based on these findings, with higher precipitation in the southwest, it may be hypothesized that future extreme precipitation increases may result in increased precipitation on groundwater reserves and runoff in the southeast region.
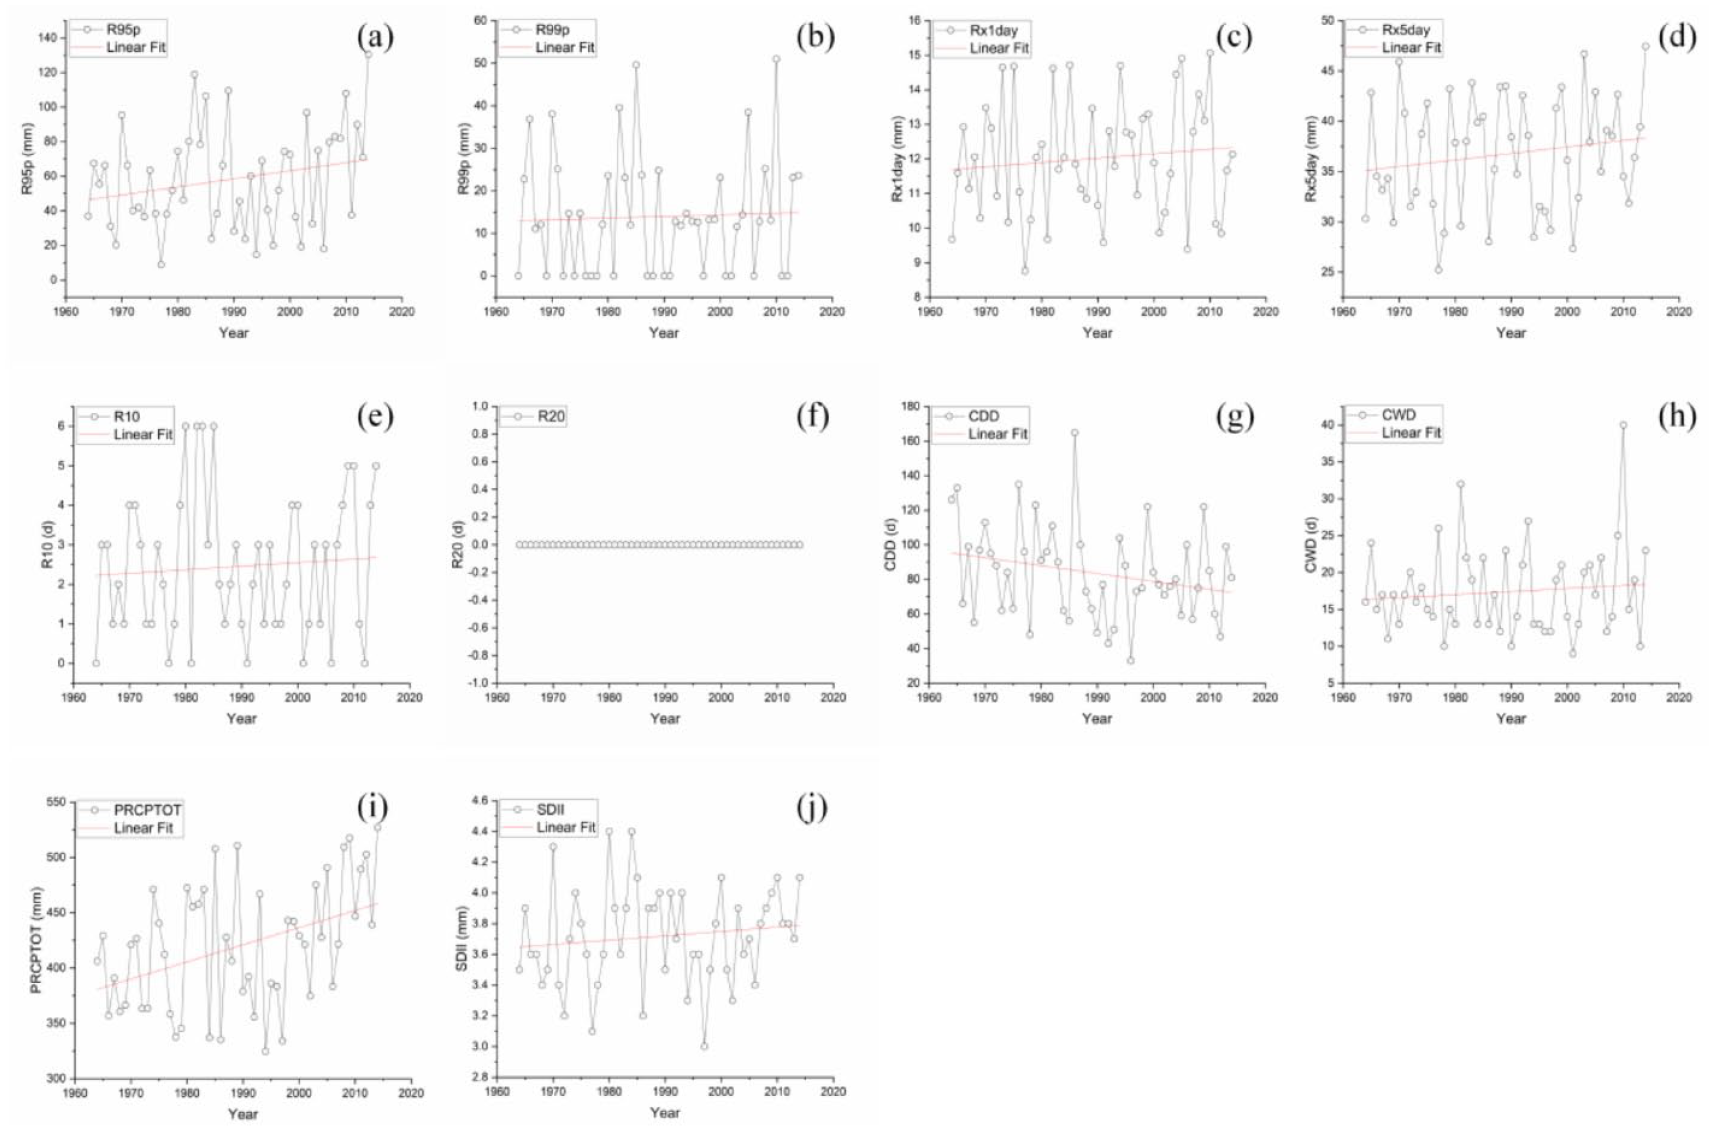
Annual change chart of the extreme precipitation index in the source area of the Yangtze River. (a) R95p. (b) R99p. (c) Rx1day. (d) Rx5day. (e) R10. (f) R20. (g) CDD. (h) CWD. (i) PRCPTOT. (j) SDII.
Data table of linear trend analysis of extreme precipitation index in 8 weather stations in the Yangtze River source area.
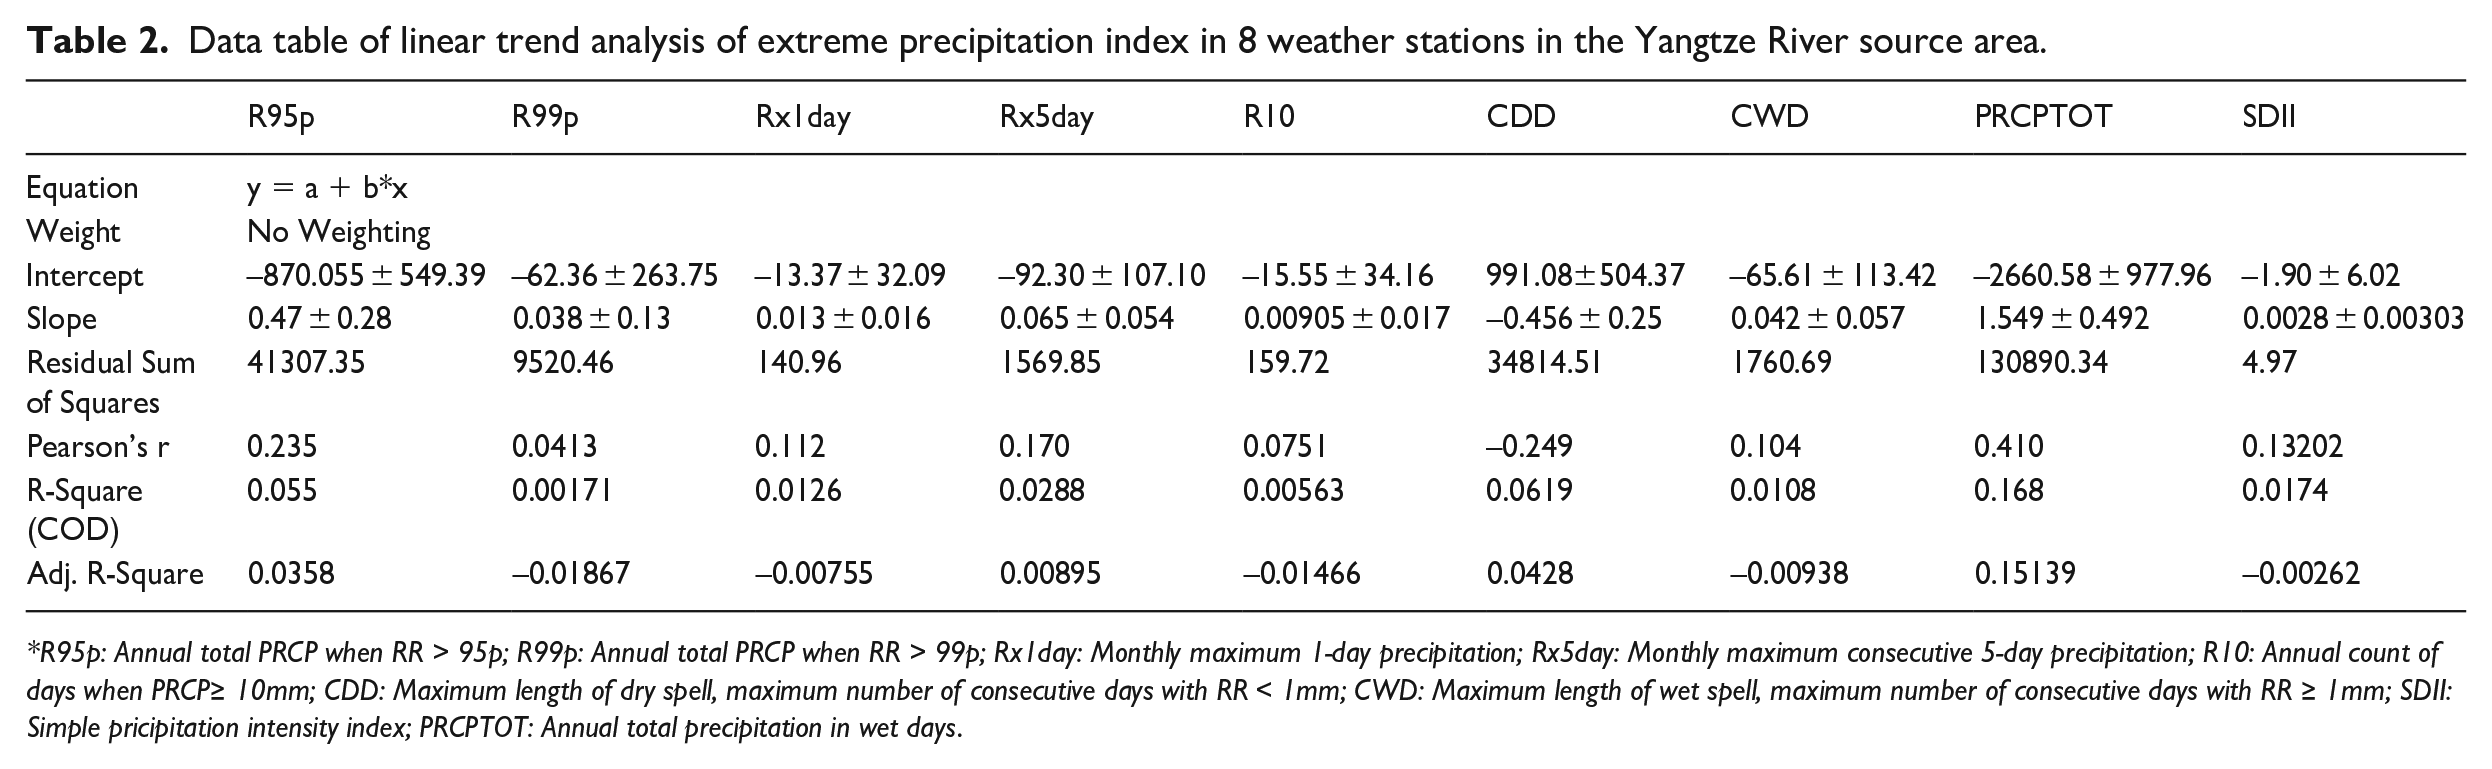
R95p: Annual total PRCP when RR > 95p; R99p: Annual total PRCP when RR > 99p; Rx1day: Monthly maximum 1-day precipitation; Rx5day: Monthly maximum consecutive 5-day precipitation; R10: Annual count of days when PRCP≥ 10mm; CDD: Maximum length of dry spell, maximum number of consecutive days with RR < 1mm; CWD: Maximum length of wet spell, maximum number of consecutive days with RR ≥ 1mm; SDII: Simple pricipitation intensity index; PRCPTOT: Annual total precipitation in wet days.
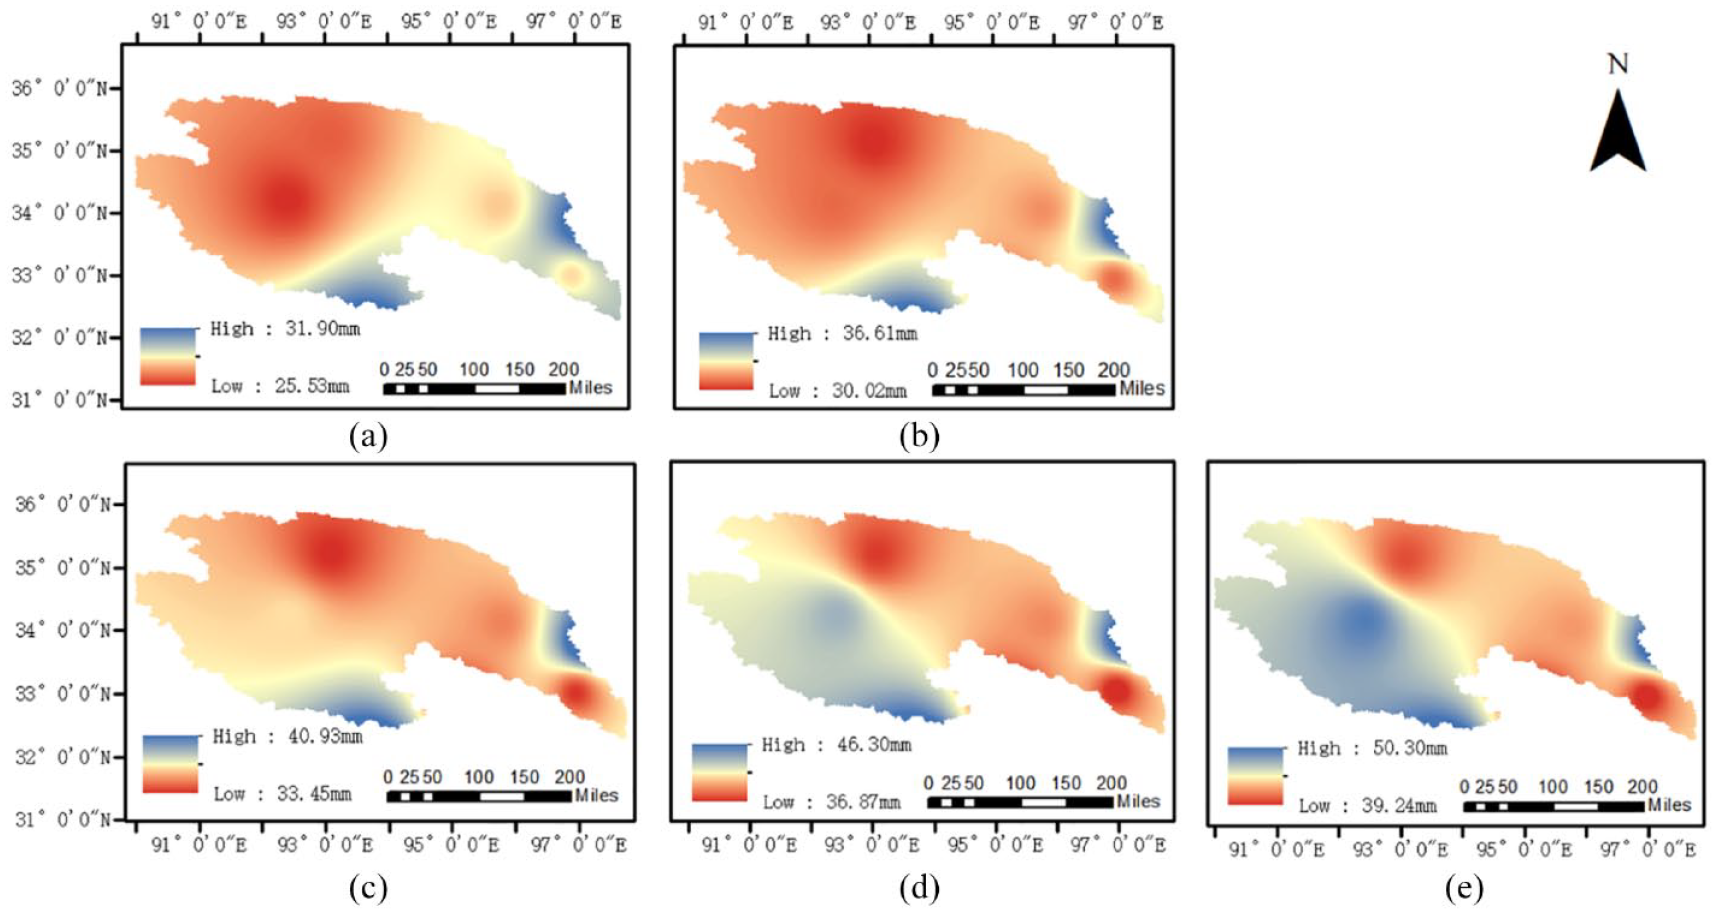
Distribution chart of extreme precipitation in different reproduction periods of Yangtze River source. (a) Once in 5 years. (b) Once in 10 years. (c) Once in 20 years. (d) Once in 50 years. (e) Once in 100 years.
Data table of precipitation recurrence period of eight weather stations in the Yangtze River source area.
Mechanism from the perspective of ground-based data
Base flow segmentation based on the modified Kalinin method
For the 1964–2014 period (Figure 4), we analyzed the annual runoff flow, base flow, and base flow index (BFI) to obtain the annual runoff change, base flow change, and the contribution of groundwater base flow to runoff. Meanwhile, we investigated the base flow segmentation results between 2003 and 2004 (Figure 5). Through the analysis of the data, we know that:
(1) The maximum annual runoff in the source area of the Yangtze River appeared in 2009 at 284,386.8 m3, and the minimum annual runoff appeared in 1979 at 81,187.7 m3. The annual runoff in the source of the Yangtze River showed a relatively obvious growth trend, with a growth rate of 840.20 m3/yr.
(2) The maximum value of the annual base flow in the source area of the Yangtze River appeared in 2009 at 208,518.37 m3, and the minimum value of the annual base flow appeared in 1997 at 39,633.06 m3. Overall, the annual base flow in the source of the Yangtze River showed a growth trend, with a growth rate of 662.20 m3/yr.
(3) The year with the largest contribution of groundwater base flow to runoff was 2009, and BFI was 0.73. The year with the least contribution to runoff was 1982, and BFI was 0.36. Overall, the contribution of groundwater base flow to runoff showed a gradually increasing trend, with an increasing rate of 0.0014 yr−1.
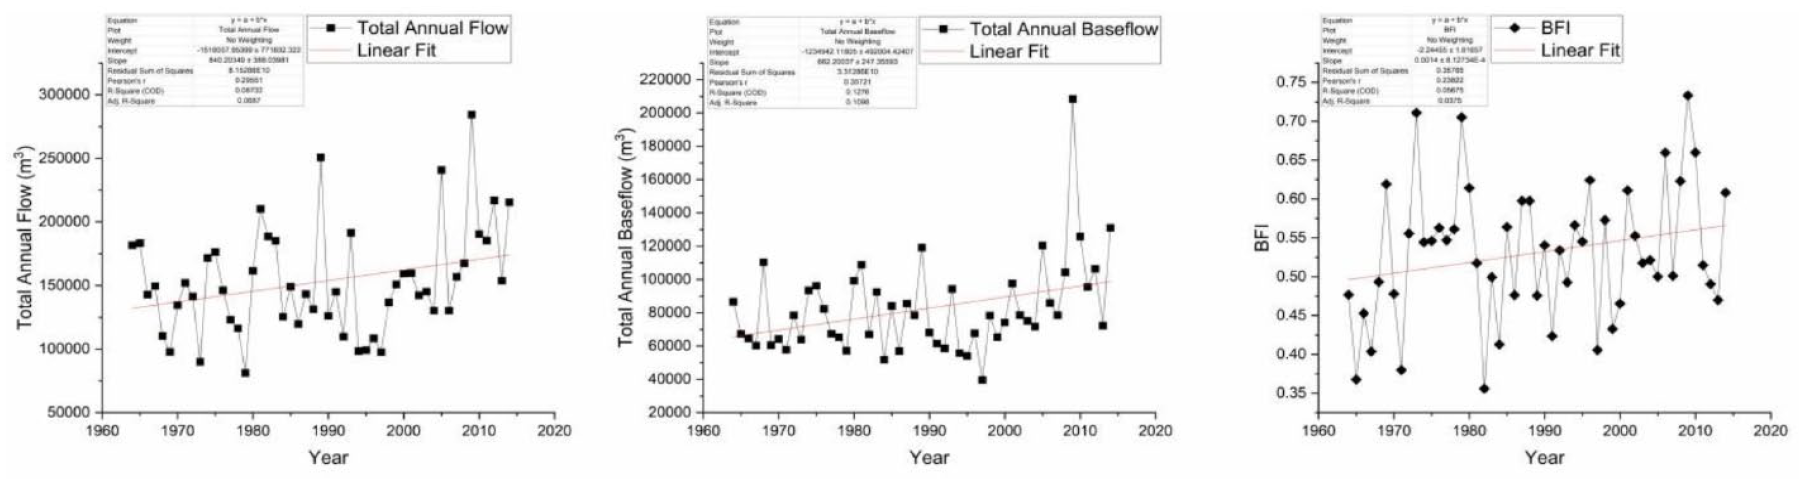
Flow, base flow, and base flow index diagram of Zhimenda Hydrological Station in 1964–2014.
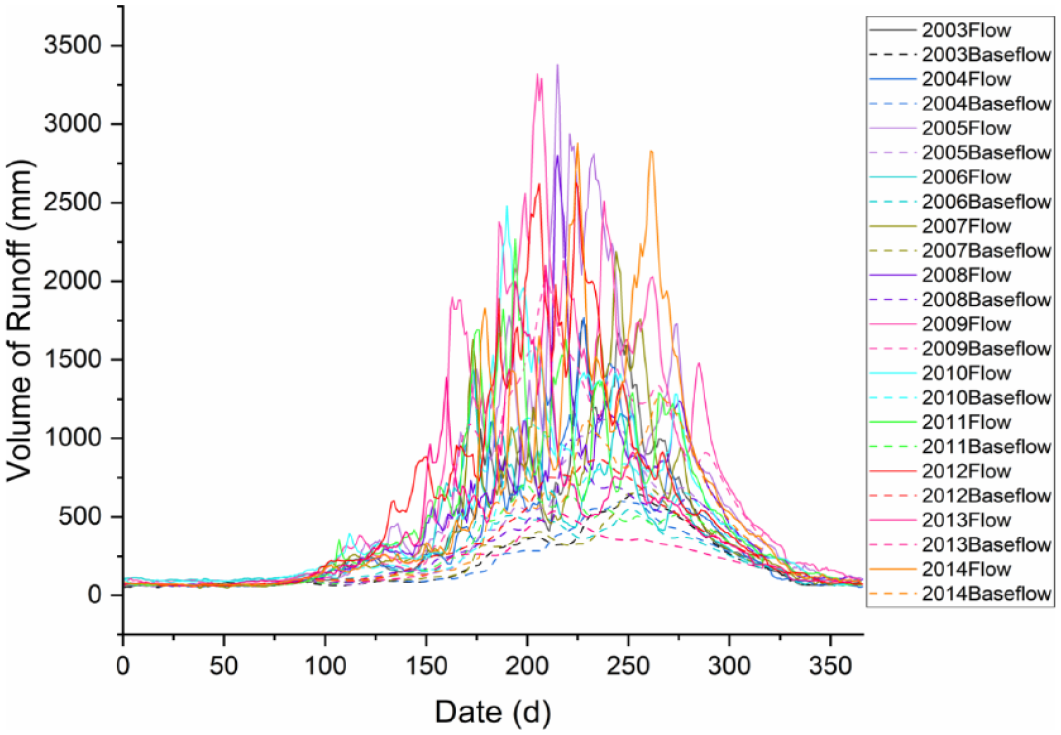
Foundation flow segmentation diagram of daily runoff of Zhaimenda Hydrological Station 2003–2014.
These findings indicate that river runoff, as did groundwater base flow, increased annually. Still, despite the increase of both processes, according to the analysis of the base flow index BFI, the proportion of groundwater base flow in runoff increased. Hence, the contribution of groundwater to regional runoff increased annually.
The runoff-precipitation response mechanism
The continuous and wavelet transforms were used to analyze the daily runoff and precipitation data. Figure 6 shows the 2004–2014 monthly scale precipitation and runoff wavelet coherent analysis spectrograph. The thicker black outline represents the high energy density of the region and the data through the 95% confidence interval test. The thicker black outline of the periphery of the wavelet influence cone (COI) boundary line represents the continuous wavelet transform data edge impression.
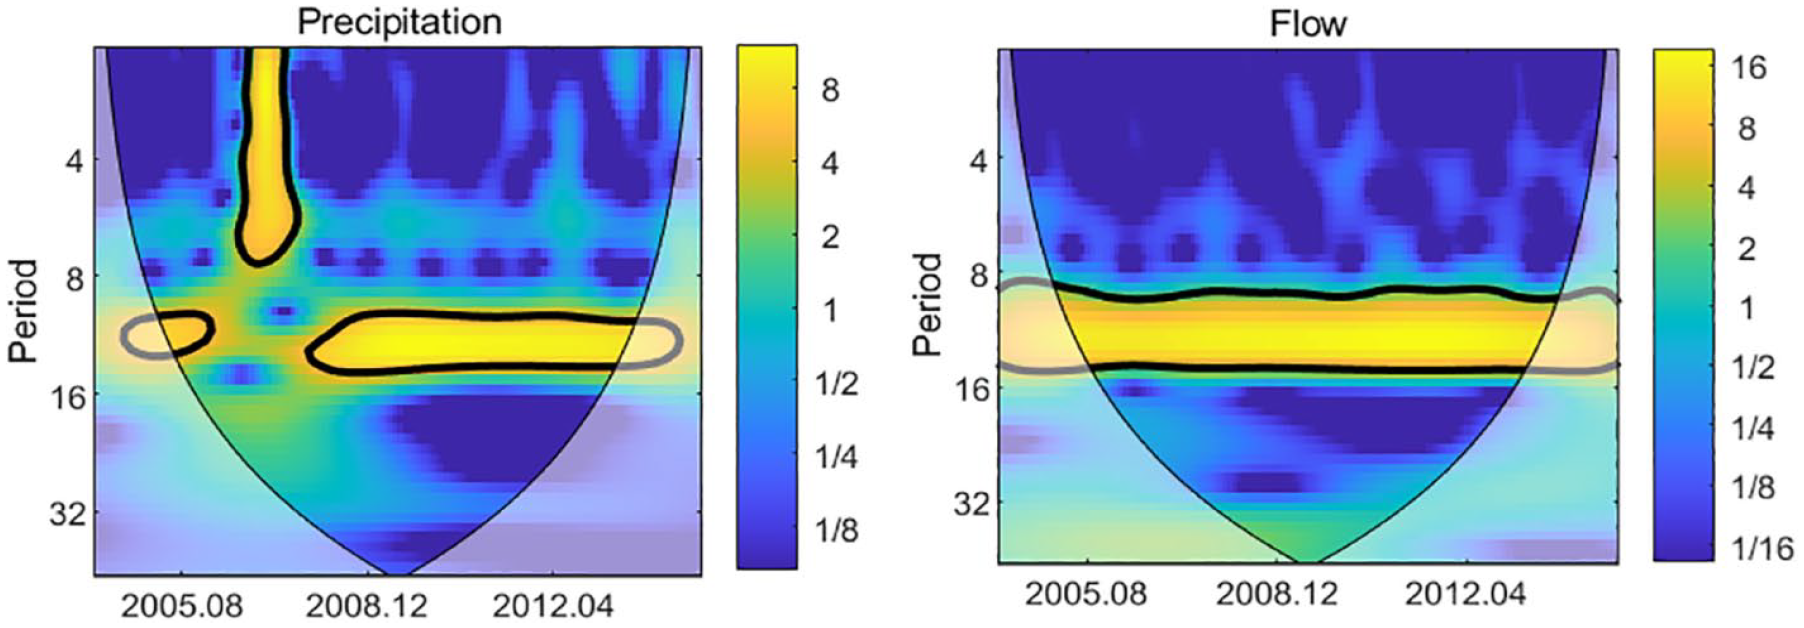
Monthly scale precipitation-flow wavelet transformation map of the Yangtze River Source from 2004 to 2014.
The energy spectrum obtained by continuous wavelet transformation of precipitation shows that the monthly precipitation value data in the main period of 2004–2014 passed the 95% confidence interval test. There was a cycle of approximately 12 months, despite periodic anomalies of precipitation between 2006–2007 (Figure 6). The energy spectrum resulting from continuous wavelet transformation of the runoff shows that the runoff data of the Yangtze River source area from 2004 to 2014 had periodic characteristics, and the data all passed the significance test with 95% confidence intervals (Figure 6). These results align with those of the precipitation data analysis, with the same temporal characteristics, as precipitation and runoff data both have a 12-month period of change.
By cross-wavelet transformation of precipitation data and runoff data, the precipitation-runoff cross-power spectrum (Figure 7a) and wavelet coherence spectrum (Figure 7b) were obtained. From the analysis of these two sets of data, on the scale of 16 August:
(1) There is a stable positive correlation in the time sequence of the two groups of data (the arrow points to the right), and the coherence coefficient is 0.8, which shows that the changing trend of the two at the same time is the same;
(2) Precipitation changes earlier than the runoff (the arrow points to the third quadrant), and this phenomenon indicates that the runoff begins to change after a period of precipitation event.
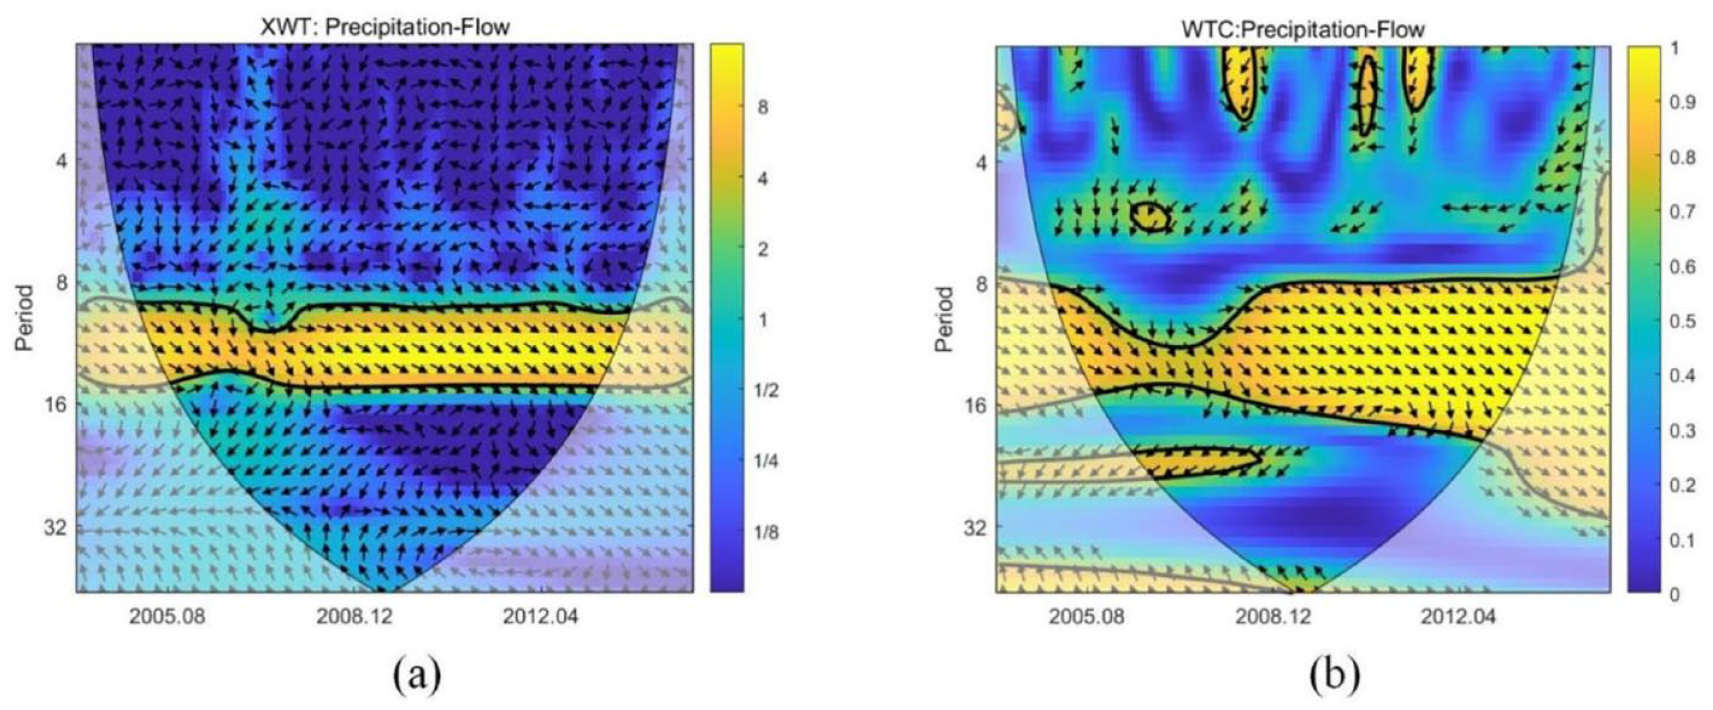
Scale precipitation-runoff cross power spectrum and wavelet coherence spectrum of the Yangtze River source from 2004 to 2014. (a) Cross power spectrum. (b) Wavelet coherence spectrum.
Base flow-precipitation response mechanism
Continuous and cross wavelet transforms were used to analyze the daily base flow rate and precipitation data. Figure 8 shows the coherent analysis spectrum of monthly scale precipitation and base flow wavelet in 2004–2014. The continuous wavelet transformation of the precipitation in 2004–2014 in the monthly value data through a 95% confidence interval test showed a cycle of approximately 12 months. For 2006–2007, there were abnormal precipitation cycles, but there was still a cycle of 12 months (Figure 8). The energy spectrum obtained by the continuous wavelet transform of the base flow shows that the base flow from 2004 to 2014 had periodic characteristics of 12 months, and all the data passed the significance test of 95% confidence interval (Figure 8). These findings align with the precipitation data analysis results, which indicate that the precipitation and base flow data had the same change period of approximately 12 months.
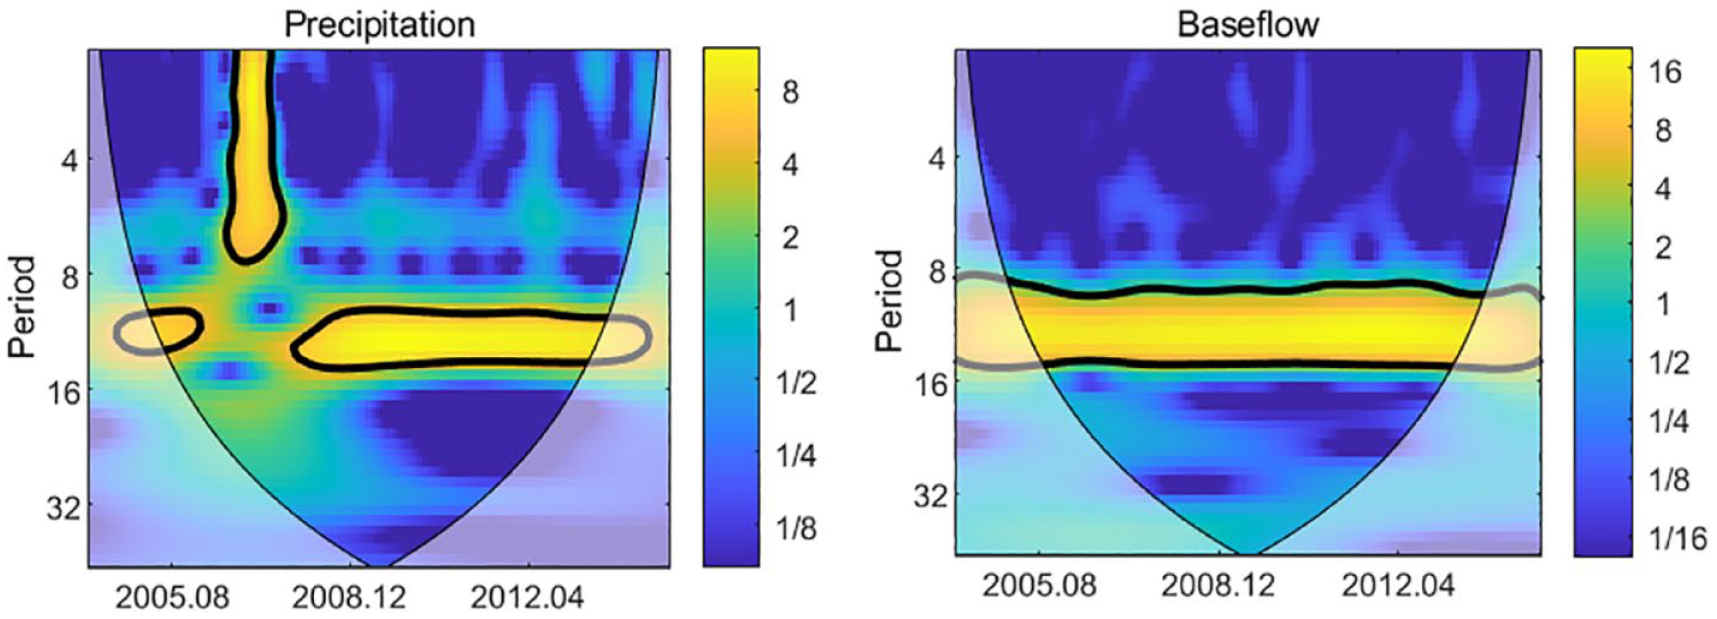
Monthly scale precipitation-base flow wavelet transformation diagram of the Yangtze River Source from 2004 to 2014.
Cross-wavelet transformation of precipitation data and base flow data presents the precipitation-base flow cross power spectrum (Figure 9a) and wavelet coherence spectrum (Figure 9b), which can be seen from the analysis of these two sets of data:
(1) During the whole study period, the two signals changed at a similar frequency in a specific frequency range (the arrow points to the right); that is, there was a stable positive correlation between the changes in the two groups of data in time, and the coherence coefficient was 0.8, indicating that the two changed at the same time.
(2) Precipitation before the base flow changes (arrow points to the third quadrant) shows that the base flow in the area received precipitation changes, but compared with the base flow, the arrow is closer to the second quadrant; therefore, the runoff changes faster than the base flow (Figure 10); this is because precipitation into groundwater occurs more quickly when the runoff from the flow area reaches a certain thickness. This result proves the correlation between precipitation surface water and groundwater.
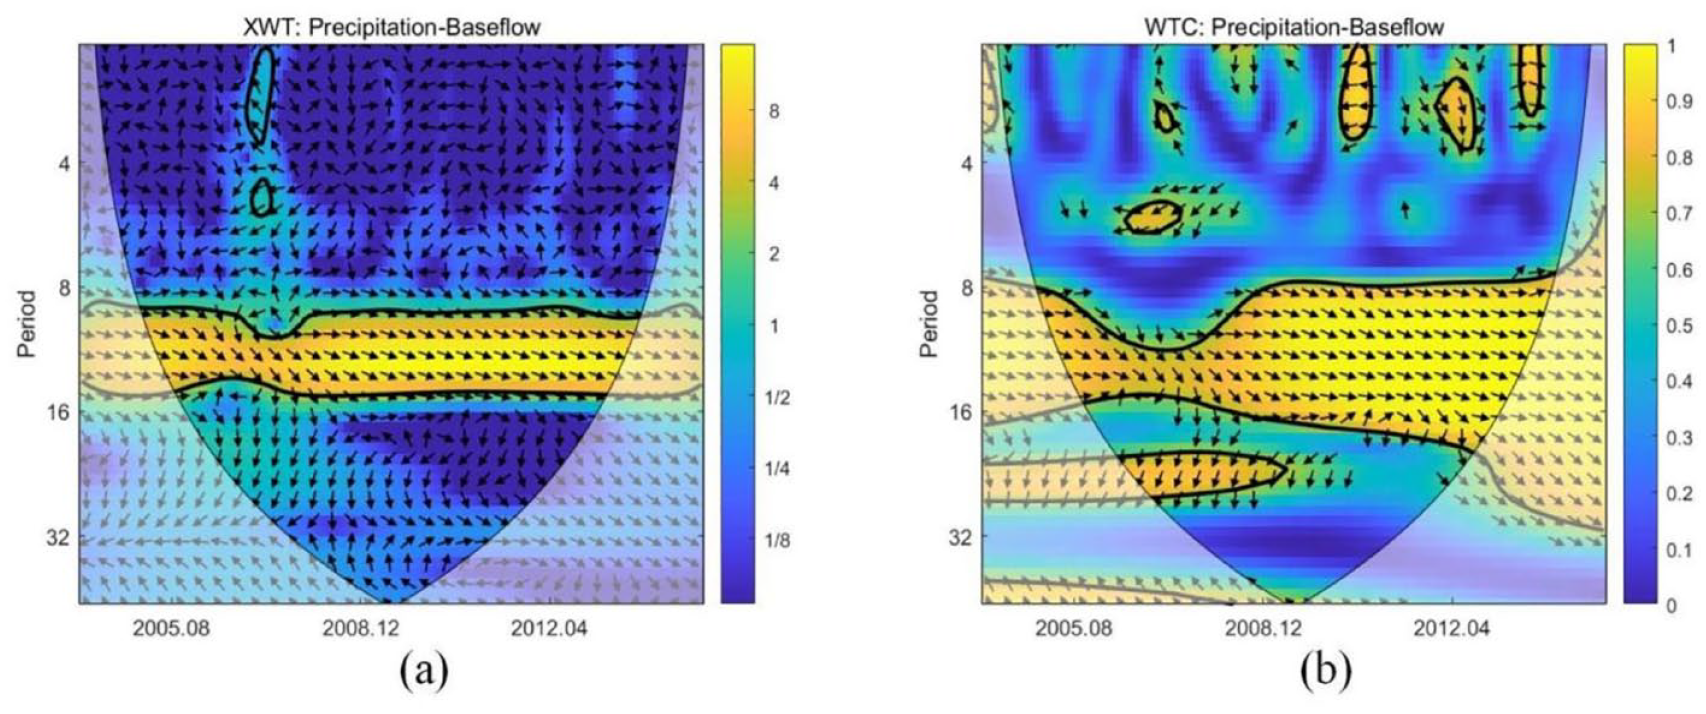
Scale precipitation-base flow cross power spectrum and wavelet coherence spectrum of Yangtze River Source in 2004–2014. (a) Cross power spectrum. (b) Wavelet coherence spectrum.
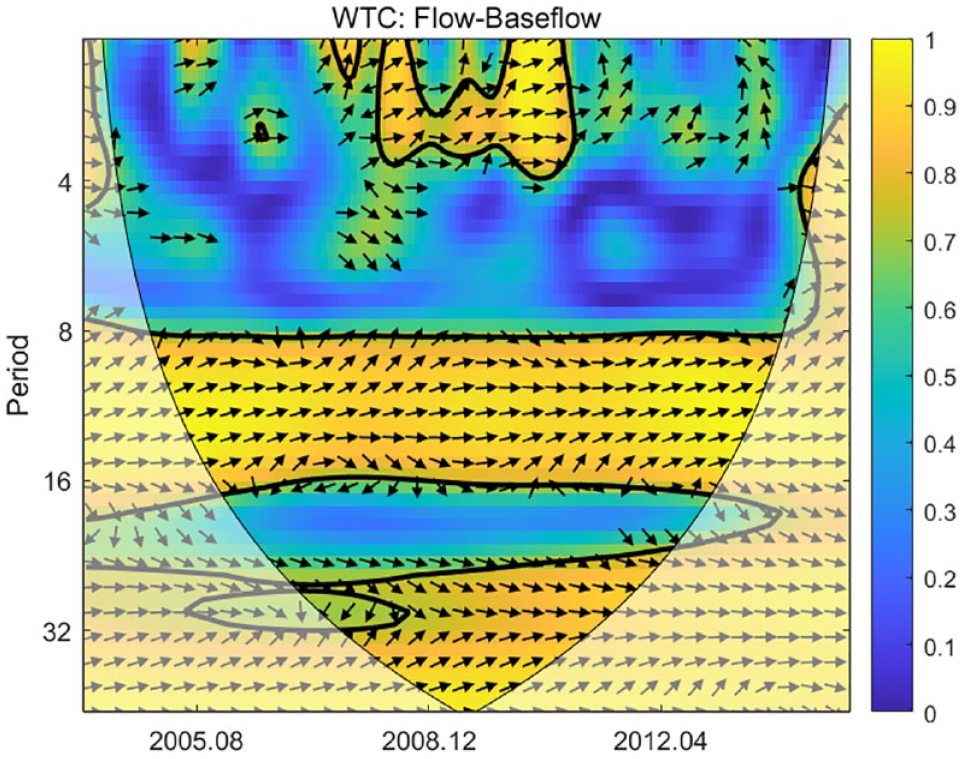
Wavelet coherence spectrum of monthly scale runoff-base flow from the Yangtze River source from 2004 to 2014.
Mechanism from the perspective of satellite-based data
Land water reserves, surface water reserves, groundwater reserves-precipitation response mechanism
The land water reserves, surface water reserves, and groundwater reserves are continuously transformed with the same water precipitation data (Figures 11-17), and the results are indicated:
(1) In terms of periodicity, the data of land water reserves, surface water reserves, and groundwater reserves all showed a periodicity of 12 months and passed the test of 95% confidence interval;
(2) In terms of correlation: ➀ During the whole study period, there is a stable positive correlation between the two sets of land water reserves and precipitation in time, and the coherence coefficient is 0.8; ➁ The correlation coefficient of 0.8 shows the positively correlated trend; ➂ There is no correlation between the data of groundwater reserves and the two sets of precipitation in time, that is, the two do not have the same change trend at the same time.
(3) In terms of lag period: ➀ precipitation precedes the change of terrestrial water reserves, indicating that the change of inland water reserves in the region is controlled by the change of precipitation (arrow points to the right); ➁ surface water reserves precede the change of precipitation, which shows that the change of precipitation is not the main reason for the change of regional surface water reserves in the source area, consistent with the findings of Qi et al. (2015); ➂ The change of precipitation precedes the change of groundwater reserves, and the change of groundwater reserves occurs after the change of precipitation. Using wavelet coherent analysis on the land and groundwater reserves, the findings indicated that the land water reserves increased under the influence of precipitation. Still, as the groundwater from the aquifer requires time to accumulate, the change in groundwater storage also requires a long lag period.
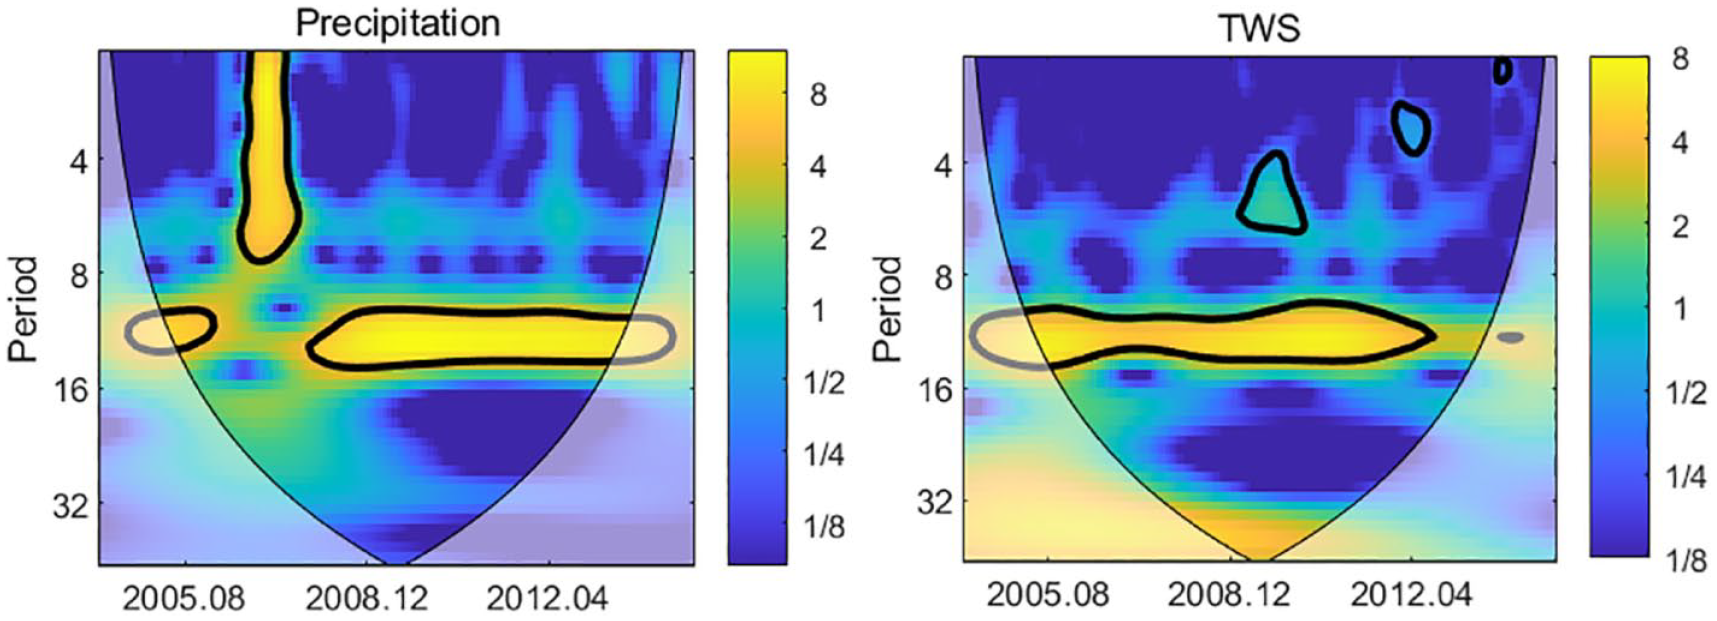
Wavelet transform map of Yangtze River source in 2004–2014.
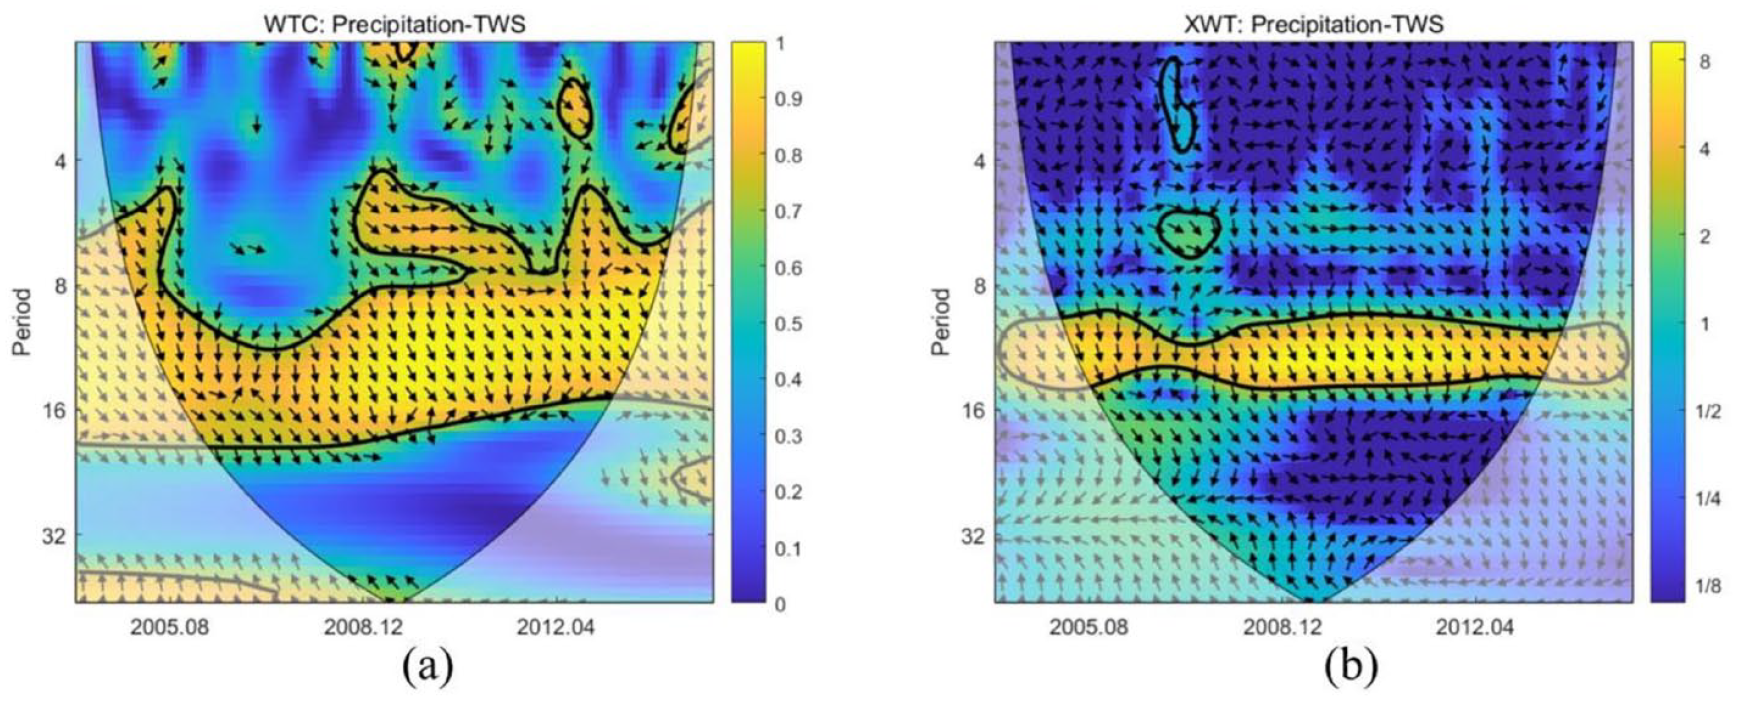
Cross power spectrum and wavelet-coherence spectrum from 2004–2014. (a) Cross power spectrum. (b) Wavelet coherence spectrum.
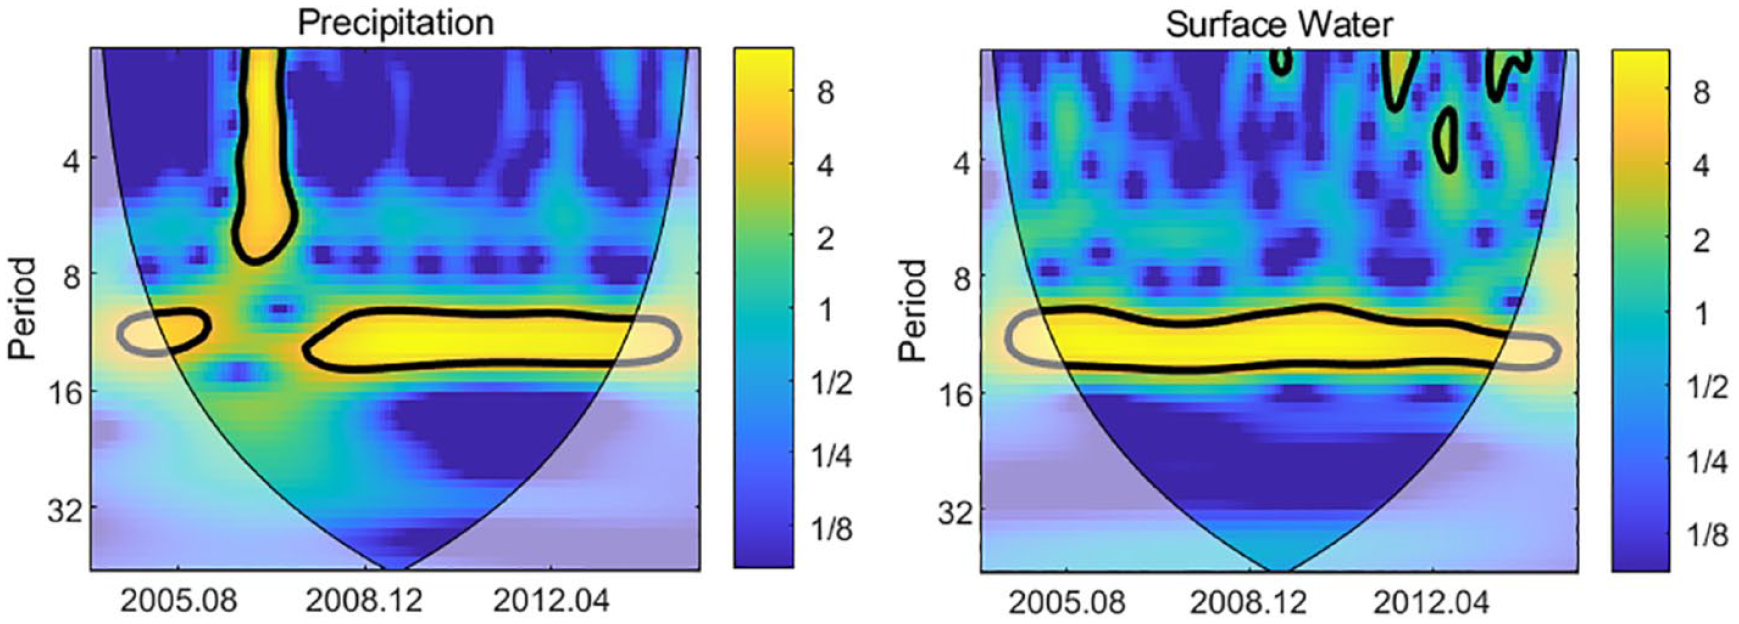
Wavelet transformation map from 2004–2014. (a) Precipitation. (b) Surface water reserves.
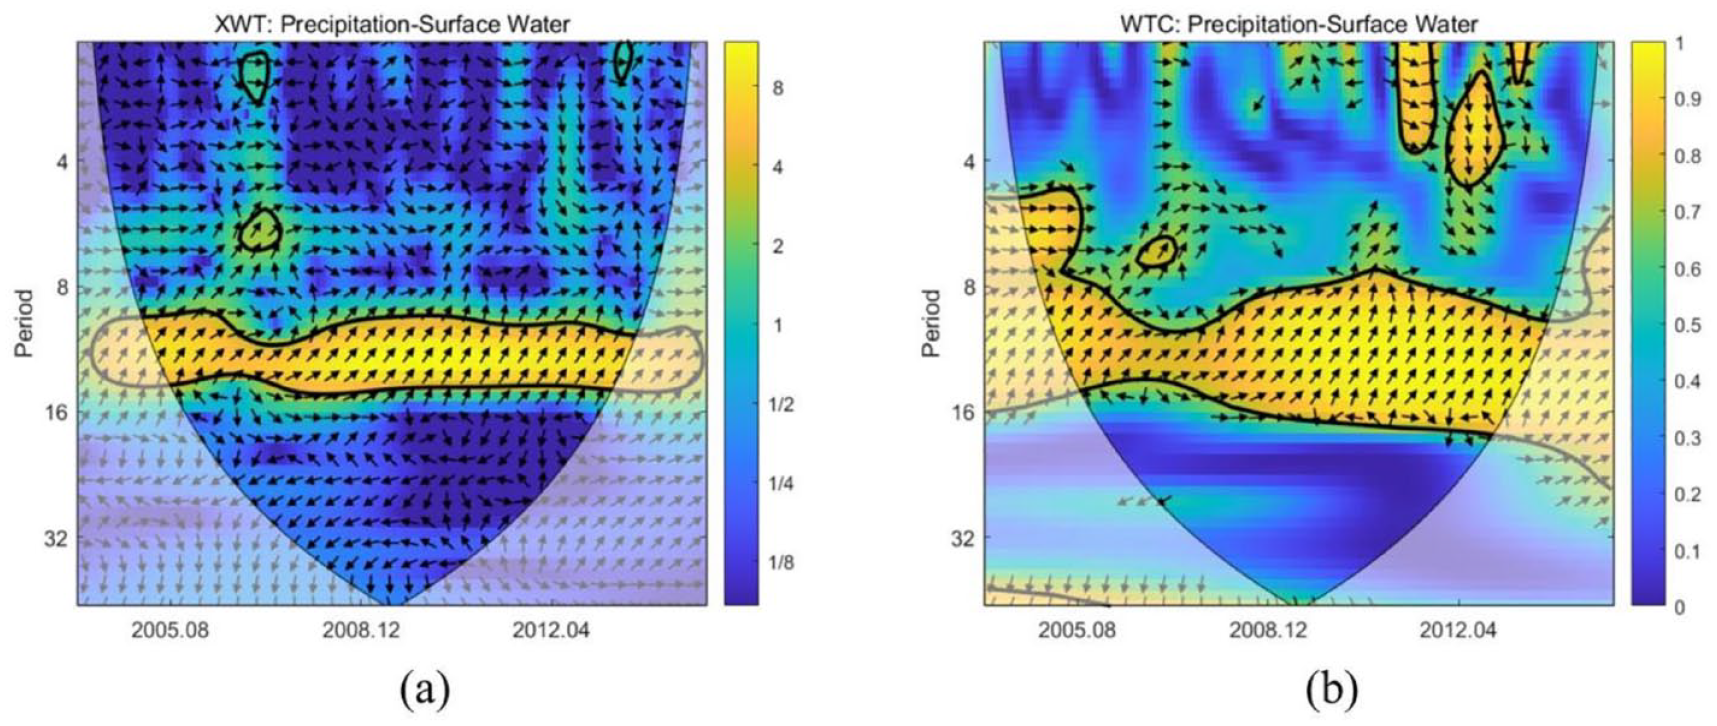
Cross power spectrum and wavelet coherence spectrum of surface water reserves in 2004–2014. (a) Cross power spectrum. (b) Wavelet coherence spectrum.
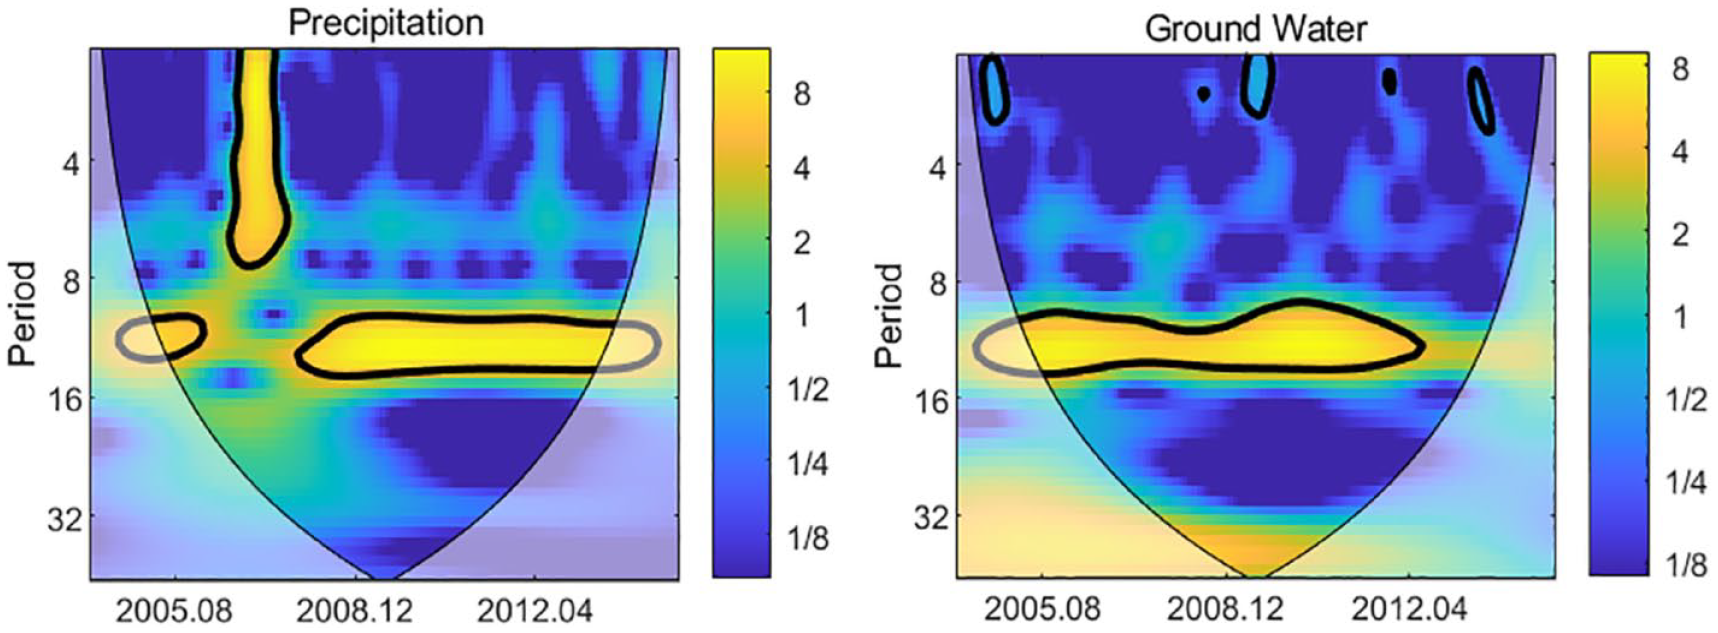
Wavelet transformation map of Yangtze River source from 2004–2014. (a) Precipitation. (b) Groundwater reserves.
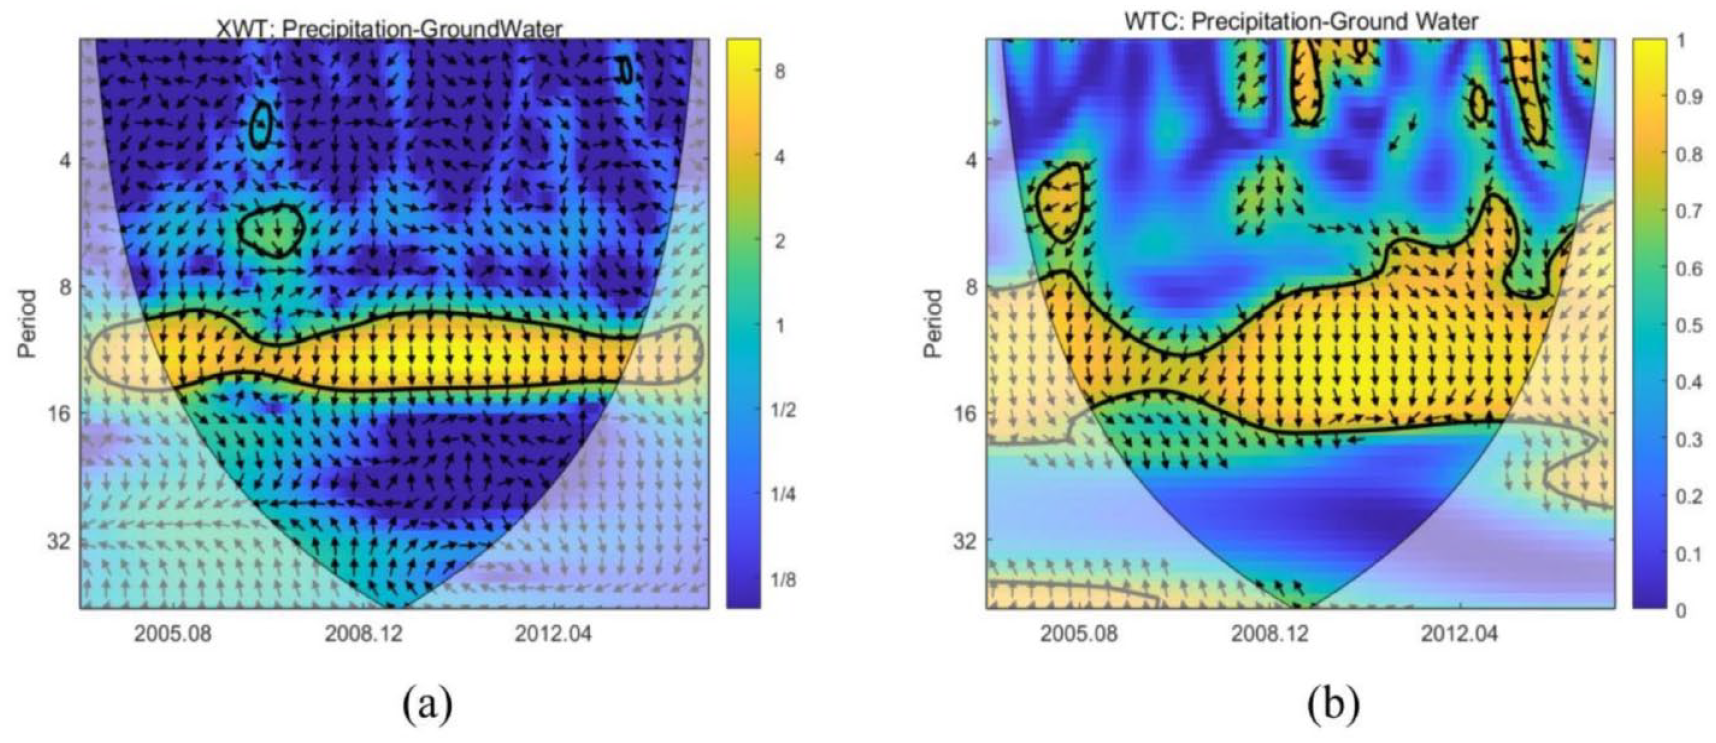
Cross power spectrum and wavelet coherence spectrum of Yangtze River source from 2004–2014. (a) Cross power spectrum (b) Wavelet coherence spectrum.
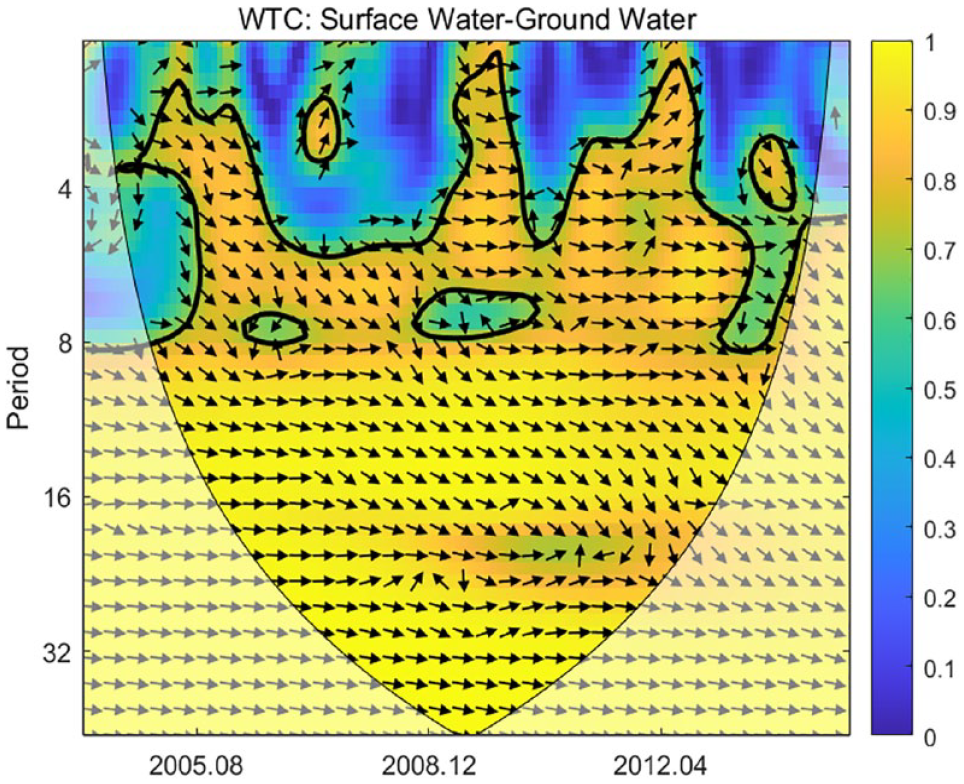
Cross power spectrum and wavelet coherence spectrum of Yangtze River source scale-2004–2014.
These findings indicate that the change in precipitation in the source area can cause a change in surface water reserves, may influence land water reserves, and can affect the source of groundwater reserves. Therefore, extreme precipitation can affect groundwater resources in the Yangtze River source region.
Discussion
The findings of this study align with the position that, according to the analysis of the extreme precipitation index, the intensity and frequency of precipitation events increase in the context of global warming (Cai et al., 2022; Hao et al., 2010) found in the increasing trend of precipitation in the source area of the Yangtze River. In the current study, through the fitting analysis of the point of meteorological station Rx1day index combined with space interpolation, it was found that in the study area, there was a declining trend of extreme precipitation events from the southwest to northeast. However, with the trend toward an even trend, changes in these patterns may eventually occur under future extreme precipitation events, with possible changes in precipitation, groundwater, and runoff in the southeast.
The Yangtze River source’s annual runoff and base flow show increasing trends, with a growth rate of 840.20349 m3/yr and 662.20 m3/yr, respectively. The BFI analysis results show that the contribution of groundwater base flow to runoff increases gradually, with an increasing rate of 0.0014 yr−1. This result aligns with Qi et al. (2015) and Li et al. (2013). Other studies have also postulated possible future increases (Cheng et al., 2010). As one of the main sources of runoff, groundwater base flow has also been increasing per year, and the composition of groundwater base flow in runoff is increasing, with the contribution of groundwater to regional runoff becoming increasingly important for river runoff.
The runoff-precipitation response mechanism and the base flow-precipitation response mechanism showed that precipitation events can significantly affect the production of runoff and base flow. Meng et al. (2020) also found an increasing trend of precipitation and runoff in the source area of the Yangtze River. Land water reserves-precipitation response mechanism, surface water reserves-precipitation response mechanism, and groundwater reserves-precipitation response mechanism showed that changes in groundwater reserves are controlled by changes in precipitation and precipitation events and extreme precipitation events can affect changes in groundwater reserves. However, the change in surface water is earlier than the change trend of precipitation, and it is believed that some supply sources of surface water are related to glacial meltwater (Qi et al., 2015).
There are still many different discussions about whether runoff is affected by precipitation. Wu et al. (2013) proved that the increase in annual runoff of the Tuotuo River, an important river within the source of the Yangtze River, is a result of increased glacier melt due to warmer temperatures, while Liang et al. (2013) proved that the recharge of runoff by ice and snowmelt in the source area of the Yangtze River (45%) is much higher than that by precipitation (15%), and the above mentioned studies concluded that the warmer temperatures as well as the meltwater from the glaciers are the main reasons for the change of runoff, which is inconsistent with our study. However, Wang and Qiu (2008) suggested that the main factor of runoff in the Yangtze River source area is rainfall change, which is consistent with our study. It can be seen that the discussion on the drivers of runoff changes in the source region of the Yangtze River is still inconclusive, and further research is needed. However, whether it is driven by glacier meltwater or precipitation, it does not conflict with our study. The main innovation of our study is to explore the impact of extreme precipitation on groundwater resources in the Yangtze River source region by using the coupling of ground monitoring and satellite monitoring data, and to provide a comprehensive analysis of extreme precipitation events in the region. The analyses of surface runoff changes are only appropriately extrapolated and discussed based on existing research results.
Conclusion
Possibly due to global warming events, precipitation intensity and extreme precipitation events have increased. In the Yangtze River source area, regional differences in precipitation runoff also showed an increasing trend. With increased runoff, groundwater base flow increases, and the contribution of runoff has also increased. The study of regional land water reserves, surface water reserves, and groundwater reserves combined with precipitation correlation analysis indicates that in the Yangtze River source area, land water and groundwater are affected by changes in precipitation. Still, the groundwater change lags behind the changes in land water. The change in precipitation does not control the change of surface water reserves. Still, it may change significantly earlier than the change in precipitation, possibly due to temperature change and glacier melt water effects.
Footnotes
Acknowledgements
We are grateful for the constructive suggestions all reviewers and editors provided.
Declaration of conflicting interests
The author(s) declared no potential conflicts of interest with respect to the research, authorship, and/or publication of this article.
Funding
The author(s) disclosed receipt of the following financial support for the research, authorship, and/or publication of this article: This work was supported by National Natural Science Foundation of China (Grant No. U23A2007), National Key R&D Program of China (2020YFA0608200), Major Science & Technology Special Projects of Tibet Autonomous Region (XZ202201ZD0005G05), Science and Technology Planning Project of Lhasa (LSKJ202316, LSKJ202320).