
Abstract
The comparative study on terrestrial net primary productivity in regions across climate gradients may help to better understand ecosystem response to climate change, yet is relatively understudied. Therefore, in this study, we compared the spatio-temporal patterns of net primary productivity during 2010-2019 and identify the different controls in three basins with typical climates in China: the Heihe River Basin with arid and semi-arid climate, Weihe River Basin with semi-arid and semi-humid climate, and Lower Yangtze River Basin with humid climate. Results indicated that the net primary productivity followed the order: Lower Yangtze River Basin (480.3 g C m−2 yr−1) > Weihe River Basin (346.7 g C m−2 yr−1) > Heihe River Basin (98.1 g C m−2 yr−1). The vegetation in the Heihe River Basin had severel hydrothermal limitation as the greatest importance of temperature and precipitation to the net primary productivity. In contrast, land cover type instead of climate became the most important variable on net primary productivity in the Weihe River Basin, and topography and land cover type were critical controls in the Lower Yangtze River Basin. In addition, the annual net primary productivity in all three areas exhibited an increasing trend during 2010-2019. However, the increase of net primary productivity in the Heihe River Basin was primarily driven by the increase of both temperature and precipitation due to the warming and humification in the northwestern of China. In contrast, the increase of temperature (especially spring warming) dominated the increase of net primary productivity in the Weihe River Basin and Lower Yangtze River Basin, due to the relatively sufficient precipitation. Furthermore, monthly net primary productivity exhibited a unimodal curve throughout the year. However, the increasing trend nearly stopped in June and July in the Lower Yangtze River Basin. This is possibly due to the light deficiency with abundant precipitation for plant photosynthesis in the natural ecosystem like forest and shrubland, and the rotation from wheat harvesting to rice planting in the cropland in these months.
Introduction
Net primary productivity (NPP) refers to the vegetation carbon increment after deducting the portion consumed by autotrophic respiration per unit time and space (Cramer et al., 1999; Liang et al., 2015; Lyu et al., 2023). It is a crucial component of the terrestrial ecosystem carbon cycle, determining the ecosystem carbon source or carbon sink (Piao et al., 2005; Yuan et al., 2014). Furthermore, it contributes to human welfare as it is a basic assessment of food, fiber, and wood production (Liang et al., 2015). Additionally, the change in NPP is highly interlaced with climate change (Piao et al., 2005; Wang et al., 2021). On the one hand, temperature, precipitation, and solar radiation are all key factors influencing vegetation physiology and phenology, the vegetation production capacity and NPP (Liu et al., 2023). On the other hand, increase of NPP in turn alters the local climate and is seen as an efficient way to mitigate climate warming (Piao et al., 2020; Yuan et al., 2018; Zhao and Running, 2010). Therefore, understanding the spatio-temporal patterns of NPP and its critical controls are vitally important for global climate change.
The spatio-temporal patterns of NPP and the corresponding critical drivers have been extensively investigated during the past decades (e.g., Cramer et al., 1999; Girardin et al., 2010; Liu et al., 2017; Lyu et al., 2023). However, previous studies generally focused on a single geographical region like the globe (e.g., Cramer et al., 1999; Sun et al., 2021), or a nation (e.g., Liang et al., 2015; Piao et al., 2005), or a specific geographical unit with specific climate, topography or soil type (e.g., watershed, plain, plateau, etc.) (e.g., Lyu et al., 2023; Zhang et al., 2023). For example, the Qinghai-Tibetan Plateau (Ma et al., 2021), Loess Plateau (Gang et al., 2018), Heihe River Basin (HRB) (Liu and Song, 2022) in China are popular study regions for the patterns of NPP and their associations with climate change. The comparative study between two or more study regions with obvious gradients in climate, biome, and topography is less seen. As the spatio-temporal patterns of NPP are deeply affected by the climate, land cover type, topography (Liang et al., 2015; Peng et al., 2023), the NPP in different regions across climate gradients may exhibit remarkably different spatial and temporal variability. Through this comparative study, we may achieve a more intuitional and comprehensive recognition on the core controls of the spatio-temporal patterns of NPP in different regions, as well as the response pattern of ecosystem to climate change.
Therefore, we selected three study basins in China: the HRB, Weihe River Basin (WRB), and the Lower Yangtze River Basin (LYRB). They are characterized with typical continental arid and semi-arid climate, continental semi-arid and semi-humid climate, and subtropical humid climate, respectively. The NPP data in the HRB, WRB and LYRB were derived from a simulation with the widely used and reliable Carnegie-Ames-Stanford Approach (CASA) model, a process model based on the principle of light energy utilization (Field et al., 1995; Piao et al., 2005; Potter et al., 1993; Yang et al., 2021). The objectives of this study were to investigate the difference of the spatio-temporal patterns of NPP in the HRB, WRB and LYRB, and further reveal their critical controls associated with distinct climate gradients. We considered a relatively recent period of 10 years (from 2010 to 2019), with the aim of assessing the recent changes and drivers of NPP in these basins.
Materials and methods
Three study basins
We selected the HRB, WRB and LYRB as the study basins in this study because they belong to different typical climatic regions along the climate gradient from east to west of China. In addition, numerous studies on the NPP in these basins can be retrieved (e.g., Jia et al., 2023; Liu et al., 2023; Wang et al., 2020a; Yang et al., 2021), which may contribute to a better understanding of the results found in this study.
The HRB (37°41'~42°42'N, 96°42'~102°00'E) is the second largest endorheic river basin in Northwest China (Figure 1a). The area is about 142,900 km2, and the elevation ranges from 800 to 5000 m. The climate is a typical temperate continental climate, with a rare and uneven spatio-temporal distribution of precipitation. The HRB is generally divided into three parts from south to north: the upper reaches Qilian Mountains, the middle reaches Hexi Corridor, and the lower reaches Alax Plateau, with different climates and biomes. The southern upper reaches contain the water source region for the entire river basin (Wang et al., 2018). Mean annual precipitation is above 350 mm in the upper reaches and below 50 mm in the lower reaches, and mean annual temperature for the HRB is 6-8°C. The main land cover type is the alpine meadow, Qinghai spruce, glaciers, snow and permafrost in the upper reaches, irrigated cropland in the oasis and the desert in the middle reaches, and the Gobi, bare land, deserts, and grasslands in the lower reaches.
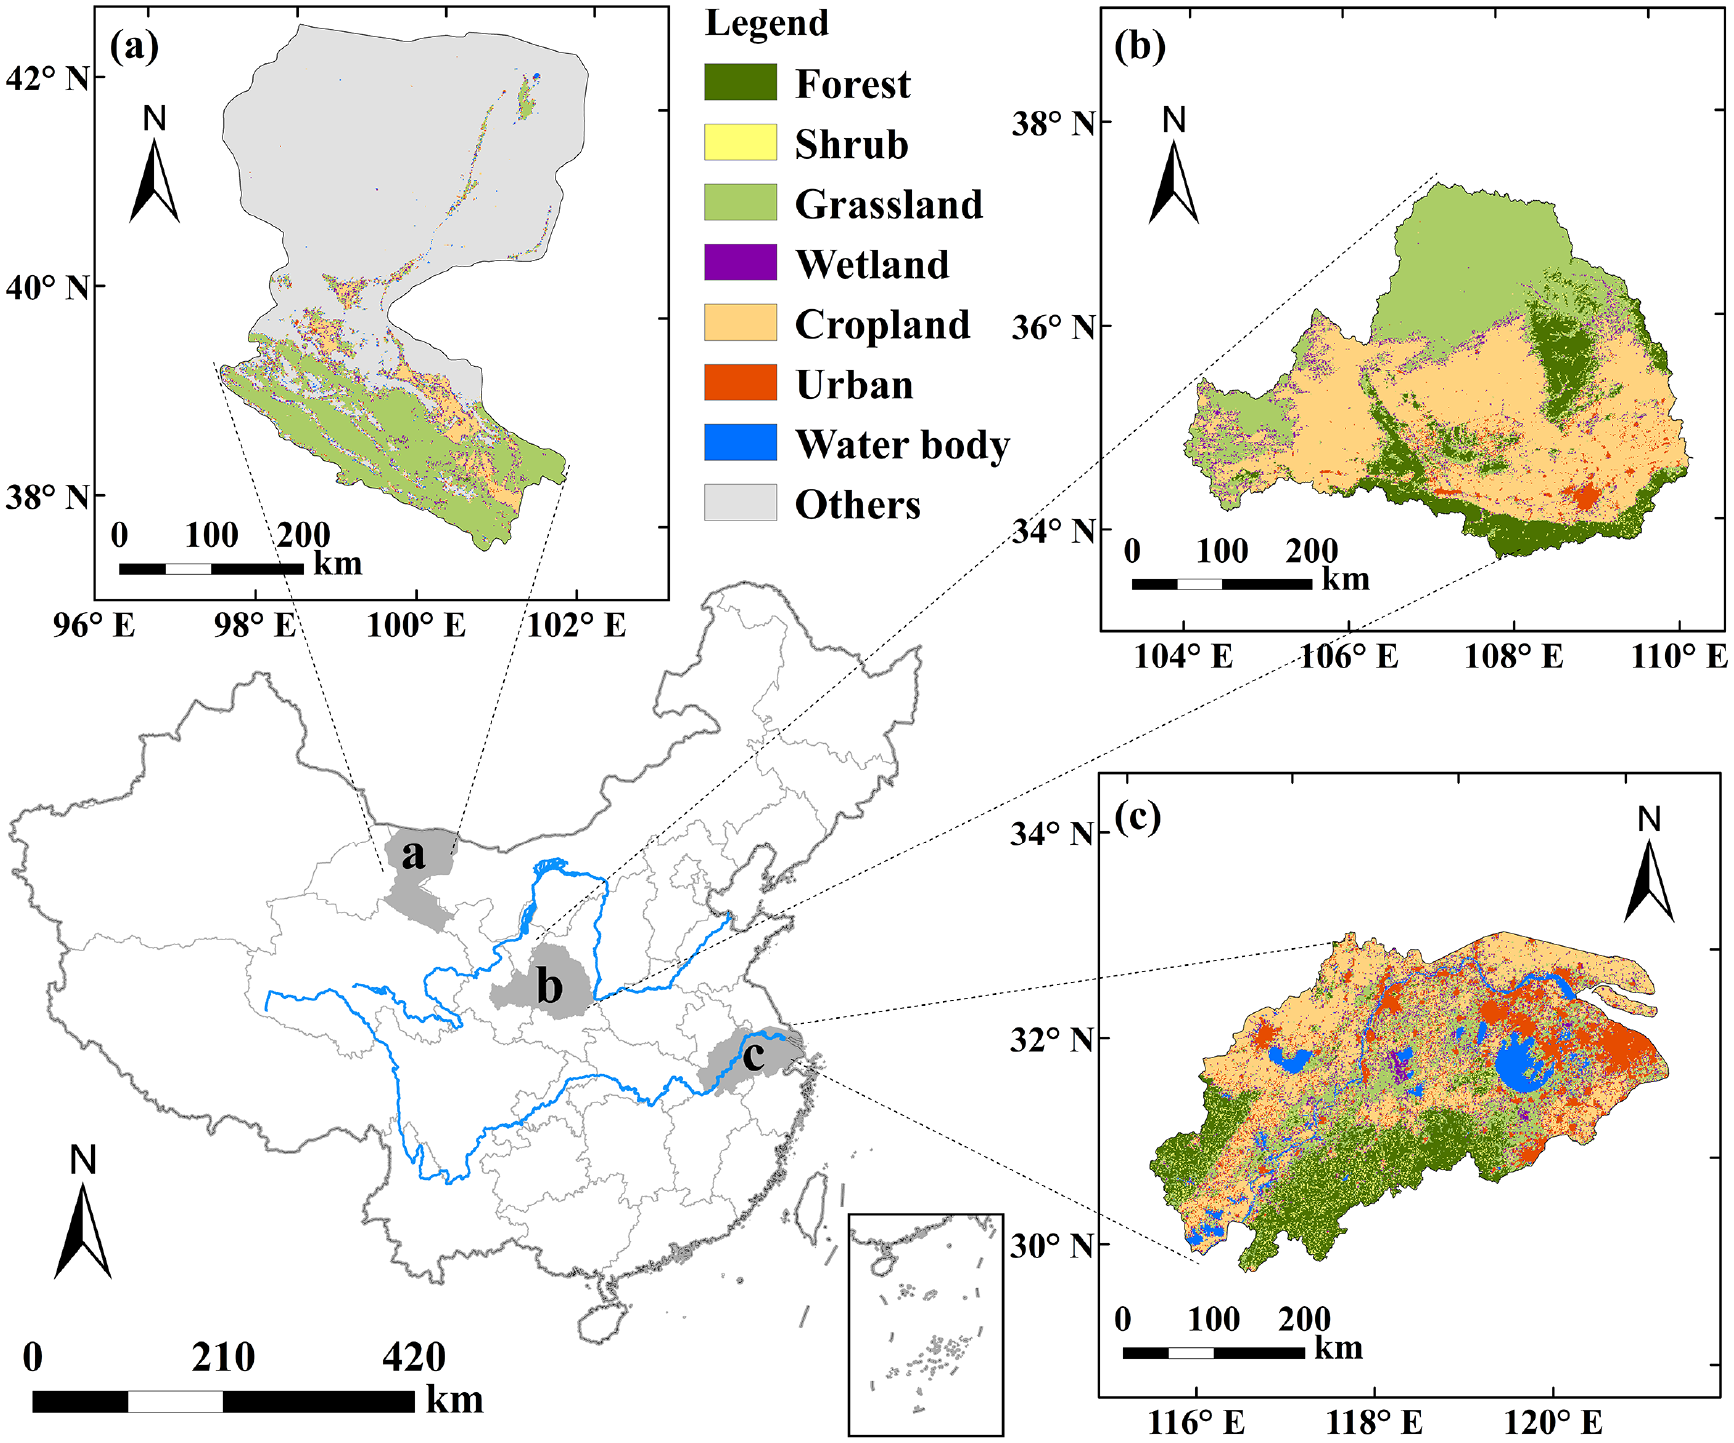
Geographical locations of the (a) HRB, (b) WRB, and (c) LYRB in China, and the spatial distributions of land cover types in the corresponding basins.
The WRB (33.5°~37.5°N, 103.5°~110.5°E) is located in the lower midstream of the Yellow River (Figure 1b). The northern part of the WRB is the Loess Plateau, the southeastern part is the Guanzhong Plain, and the southern marginal region is the Qinling Mountains. It is the largest sub-basin of the Yellow River Basin, covering an area of approximately 134,800 km2. The elevation in this basin decreases from 3767 m in the northwest to 325 m in the southeast. The WRB has a temperate continental monsoon climate, characterized by wet, hot summers and dry, cold winters. Mean annual temperature in the WRB ranges from 7.8 to 13.5°C, and mean annual precipitation ranges from 360 mm to 900 mm. The dominant land cover types in the WRB are cropland, forest, and grassland.
The LYRB (29°34'~32°43'N, 115°45'~121°53'E) covers part regions of the provinces of Anhui, Jiangsu, Zhejiang, and the whole of Shanghai Municipality, with an area of about 122,600 km2 (Figure 1c). This basin is warm and humid, with a typical subtropical monsoon climate. The mean annual temperature ranges from 16.0 to 18.4°C, and the mean annual precipitation ranges from 860 to 2400 mm. The topography in the LYRB is low and flat, and the network of rivers is dense and crisscrossed. It benefits from the concurrence of higher temperatures and greater precipitation during growing season, vegetation is lush and agriculture is flourishing in this basin. The main vegetation types are evergreen coniferous forests and evergreen broad-leaved forests, and the main crop types are rice, wheat and corn. In addition, this basin is one of the most developed and densely populated areas in China, with great proportion of urban construction land and complex land cover type.
Data source and preprocessing
The normalized difference vegetation index (NDVI) for 2010-2019 was obtained from the MOD13Q1 product from the Moderate Resolution Imaging Spectroradiometer (MODIS) sensor (https://earth-data.nasa.gov/), which provides data every 16 days to biweekly with a spatial resolution of 250 m, and the maximum value composite method was used to generate the monthly value. Elevation with a spatial resolution of 90 m was derived from the Shuttle Radar Topography Mission Digital Elevation Model (SRTM DEM) dataset, which was downloaded from the Geospatial Data Cloud site (http://www.gscloud.cn/). Slope was calculated according to the elevation in ArcGIS 10.4 (ESRI, Redlands, CA, USA). Land cover type was derived from the MCD12Q1 Version 6 data product (https://lpdaac.usgs.gov/products/mcd12q1v006/) at a spatial resolution of 500 m. According to the classification scheme of the International Geosphere-Biosphere Programme (IGBP), we reclassified the land cover types as forest, shrubland, grassland, wetland, cropland, urban, water body and other types including bare land, desert and snow/ice. Climate data including daily mean temperature, precipitation, and sunshine duration from the meteorological stations in and around the study basins were downloaded from the China Meteorological Data Service Center (http://data.cma.cn/). The daily sunshine duration data was used to calculate the solar radiation following the method from Allen et al. (1998) and Li (2004). Monthly mean temperature, monthly accumulated precipitation and solar radiation were then obtained. In addition, these site-specific climate data were spatially interpolated into the gridded data by thin plate smoothing spines method in the ANUSPLIN package. All the above data were re-projected to Albers projection and resampled to a spatial resolution of 1 km, and thus clipped to the scopes of the HRB, WRB and LYRB.
Methods
CASA model
We used the CASA model to estimate the monthly vegetation NPP during 2010-2019 in different study basins, with a spatial resolution of 1 km. The CASA model is a light use efficiency model that uses remote sensing data, meteorological data, and vegetation type data (Potter et al., 1993). The NPP is calculated by the following equations:

where NPP(x, t) represents the NPP at pixel x and in month t (gC·m−2); APAR(x, t) refers to absorbed photosynthetically active radiation (MJ m−2); and ε(x, t) indicates the actual light use efficiency (g C MJ−1).
APAR is calculated by the total solar radiation (SOL) (M J m−2), the fraction of photosynthetically active radiation (FPAR), and a ratio of solar radiation available for vegetation photosynthesis (generally as a constant value of 0.5):

The FPAR is calculated by the measured NDVI and the minimum and maximum NDVI of each vegetation type:

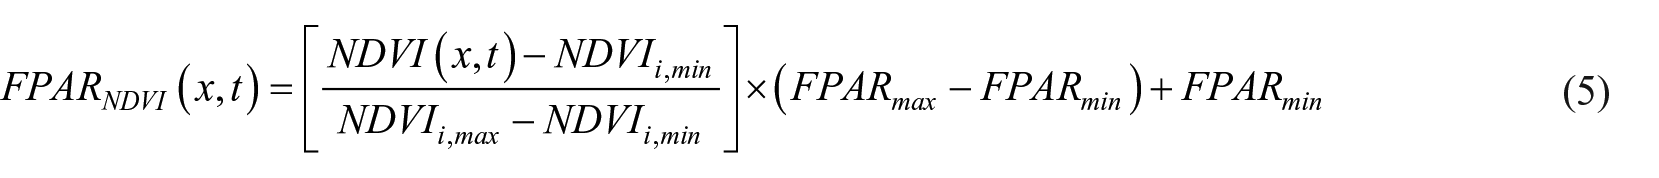
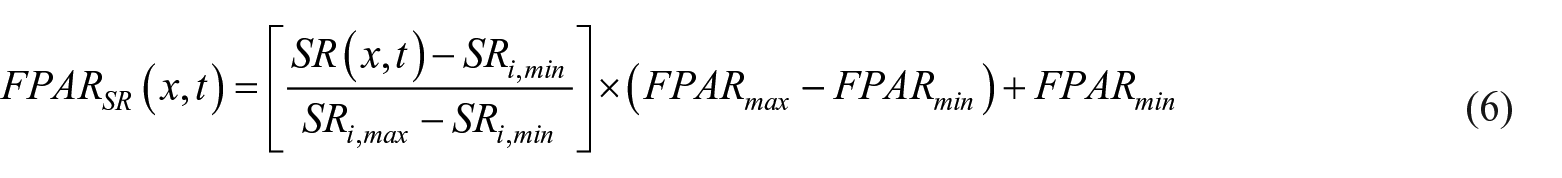
where NDVIi, min and NDVIi, max refer to the minimum and maximum NDVI of vegetation type i, respectively, and are correspondingly determined by 5% and 95% of the NDVI population. SR(x,t) refers to the simple ratio at pixel x and in month t, which can be expressed as a transformation of NDVI; SRi, min and SRi, max indicate the minimum and maximum SR of vegetation type i, respectively, and respectively correspond to the NDVIi, min and NDVIi, max ; FPARmin and FPARmax are independent of vegetation type, and set to 0.001 and 0.95, respectively.
The ε is calculated by εmax (g C MJ−1) and the scales representing the availability of water (Wε) and the suitability of temperature (T ε 1, Tε2):


where εmax refers to the maximum light use efficiency of vegetation under ideal conditions. The εmax varies by different vegetation types, and in this study we adopted the εmax for nine vegetation types in China provided by Zhu et al. (2006). Tε1(x, t) and Tε2(x, t) represent the stress effects of low and high temperature on light use efficiency, respectively; Wε(x, t) represents the stress effect of low soil water content on light use efficiency. Topt(x) is the vegetation optimal temperature, defined as the monthly average temperature when the maximum NDVI value reaches one year, and Tε1(x,t) is set to zero when the average temperature ⩽−10°C; E(x,t) is the actual evapotranspiration (mm), which can be obtained by the regional actual evapotranspiration model (Zhou and Zhang, 1996); and P(x,t) is the potential evapotranspiration, which is calculated by the Penman formula (Pereira et al., 2015).
Variable importance
We used a machine-learning algorithm of random forests (RF) (Breiman, 2001) to estimate the variable importance on the spatial patterns of NPP in the HRB, WRB and LYRB. We selected this algorithm because of its excellent performance in dealing with the issues of nonlinearity and overfitting, and its ability in simultaneously handling numerical data and categorical data. The best hyperparameters of RF, mtry (split size of the variable subset) and ntree (numerous trees of RF regression) were determined by the 10-fold cross validation. We examined the variable importance using the percentage increase in the mean squared error (IncMSE%) of each variable in RF regression: higher IncMSE% values imply more important variables. The simulated spatial NPP value in the HRB, WRB and LYRB for each year during 2010-2019 was used as the dependent variable, and the corresponding yearly climate (temperature, precipitation and solar radiation) and land cover type, as well as the spatial topographical attributes (elevation and slope) were considered as the independent variables. Therefore, the importance of these independent variables on the NPP for each year during 2010-2019 were obtained based on the IncMSE%. The RF algorithm was implemented by the “randomForest” package in the R environment (v4.2.3; http://www.r-project.org/).
Trend analysis
We used the Mann-Kendall test (Kendall, 1975; Mann, 1945) to detect the interannual change trend of NPP during 2010-2019 in the HRB, WRB and LYRB. The Mann-Kendall test is a non-parametric test method to detect the time series trend, and is not disturbed by outliers in the time series. This method has been successfully applied in meteorological, hydrological, and ecological-related studies (e.g., Wang et al., 2020b; Wei et al., 2022; Zhu et al., 2022). Definable statistic S:
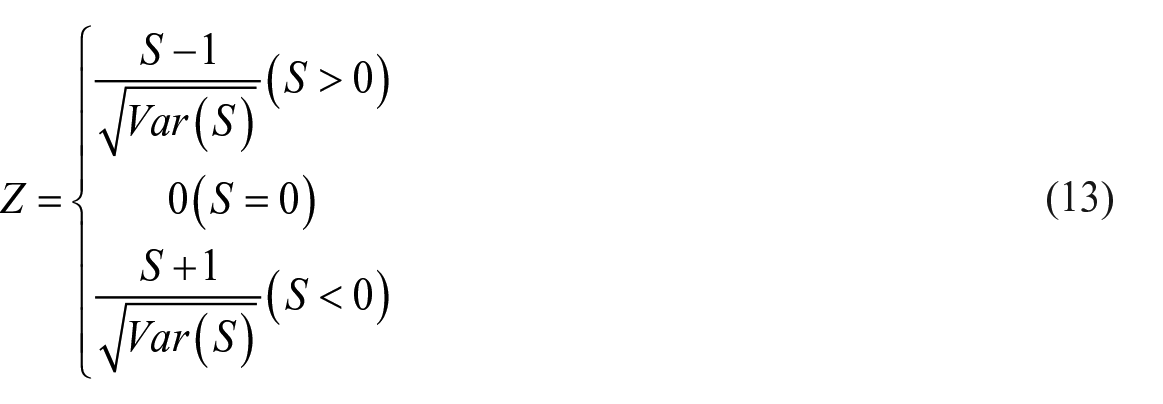
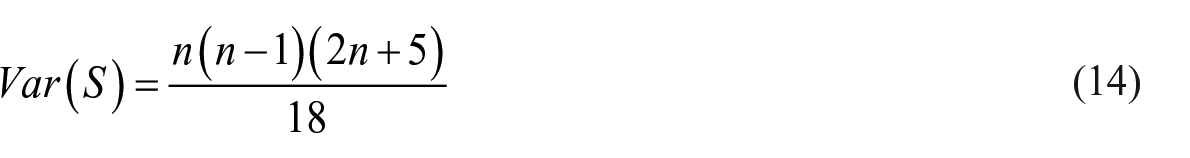
where xi and xj are the values of the sequence x at time i and j respectively (i < j), sgn() represents the sign function, S is the sign of the trend, Z refers to standardized test statistics, n is the number of the time series (n > 10), Var refers to the variance. When Z > 0 represents an increasing trend of the sequence, and vice versa represents a decreasing trend. For a given significance level p, if |Z| ⩾ Z1-p/2, then the change trend in time series is significant. Therefore, when the p is set as 0.05, then the |Z| = 1.96. That means, Z ⩾ 1.96 (or Z ⩽ −1.96) represents the trend of the time series that passes the p = 0.05 confidence levels. We classified the trend of the time series as: significant increase (Z ⩾ 1.96), increase (0 < Z < 1.96), no change (Z = 0), decrease (−1.96 < Z < 0) and significant decrease (Z ⩽ −1.96).
Pearson and partial correlation analysis
Pearson correlation analysis is usually used to express the linear association between two consecutive variables, and partial correlation analysis is used to analyze the linear association by excluding the linear influence of other relevant variables (Chen et al., 2022). We first calculated the Pearson correlation coefficient between the NPP (x) and impact factor y in each pixel:
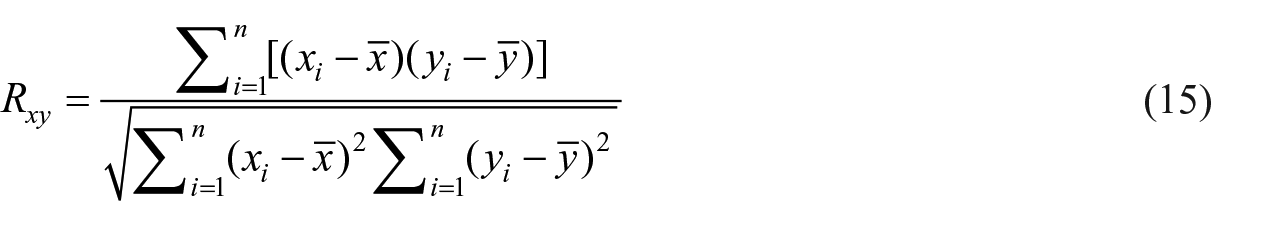
where Rxy is the correlation coefficient between NPP (x) and impact factor y; xi and yi refer to the values of NPP and impact factor in time i,
Then we eliminated the influence of the relevant indicator z to obtain the partial correlation coefficient between NPP (x) and impact factor y:
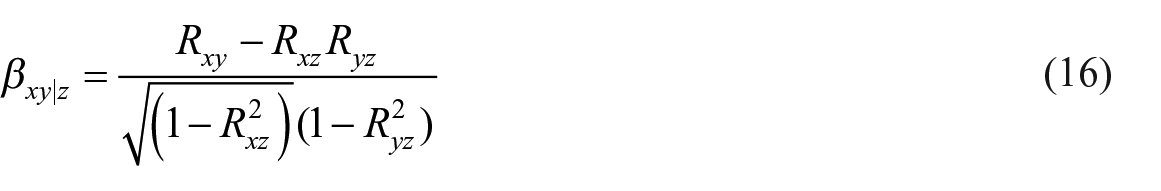
where Rxy is the correlation coefficient between NPP (x) and impact factor y; Rxz refers to the correlation coefficient between NPP and impact factor z; Ryz refers to the correlation coefficient between impact factors y and z; βxy|z is the partial correlation coefficient between NPP and impact factor y after excluding the influence of impact factor z.
Multivariate linear regression analysis
We quantified the relative contributions of three climatic factors (temperature, precipitation and solar radiation) to NPP on an annual time scale in each pixel by the multivariate linear regression analysis. Before implementing the linear regression analysis, we performed max-min normalization on NPP, temperature, precipitation and solar radiation to eliminate the dimensional influence among different data products. The multivariate linear regression analysis is as follows:

where YNPP is the normalized NPP value; X1, X2, X3 are the normalized temperature, precipitation and solar radiation, respectively; A0 is the constant of the regression equation, and A1, A2 and A3 are the regression coefficients of temperature, precipitation and solar radiation, respectively. Here, the values of A1, A2 and A3 were respectively served as the relative contributions of temperature, precipitation and solar radiation to NPP.
Results
Spatial pattern of vegetation NPP
Substantial spatial heterogeneity of the mean annual NPP was observed in the HRB, WRB and LYRB (Figure 2). Spatial mean NPP in the HRB was 98.1 g C m−2 yr−1, with range from 0 to 407.5 g C m−2 yr−1. Greater NPP (>200 g C m−2 yr−1) was found in the southern regions like the Qilian Mountains (mainly distributed by grassland) and the Hexi Corridor (mainly distributed by oasis) (Figure 1). A large area of bara land with no NPP data was found extensively in the lower reaches. Spatial mean NPP in the WRB was 346.7 g C m−2 yr−1, with range from 59.1 to 1032.7 g C m−2 yr−1. Greater NPP (>500 g C m−2 yr−1) was found along the southern edge and in the eastern and western regions, where distributed by mountains (Qinling Mountains, Ziwuling Mountains and Liupan Mountains, respectively). Lower NPP (<200 g C m−2 yr−1) was found in the western region of the WRB, the northern region as the Loess Plateau, and the southeastern region as the Guanzhong Plain. Spatial mean NPP in the LYRB was 480.3 g C m−2 yr−1, with range from 0 to 1760.2 g C m−2 yr−1. The NPP in the southwest was generally >500 g C m−2 yr−1, and in the east was generally <400 g C m−2 yr−1. In addition, relatively lower NPP (<500 g C m−2 yr−1) was also found along the Yangtze River sides.
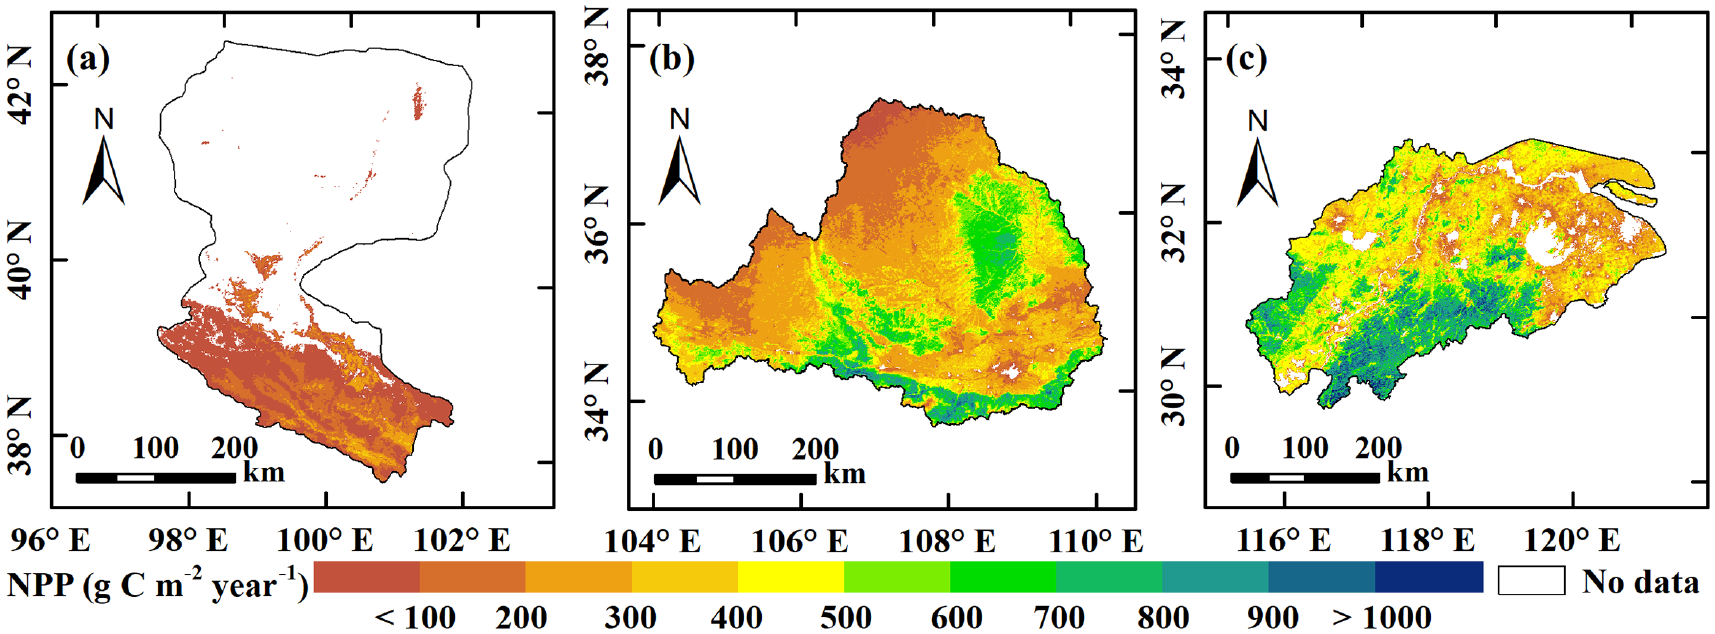
Spatial distribution of mean annual NPP in the (a) HRB, (b) WRB, and (c) LYRB.
Variable importance to the spatial pattern of vegetation NPP
Mean relative importance of the variables explaining the spatial patterns of NPP in the HRB, WRB and LYRB during 2010-2019, as well as the corresponding standard deviations or SD (error bar) are shown in Figure 3. In the HRB, temperature had the greatest importance to the NPP, with the mean IncMSE% of 22.8%, followed by the precipitation (19.4%), elevation (18.1%), land cover type (15.9%) and solar radiation (14.9%), and slope had the smallest importance (8.8%). In the WRB, however, land cover type had the remarkably greatest relative importance to NPP (44.8%), followed by precipitation and solar radiation (17.8% and 16.3%, respectively), and then temperature and elevation (both about 8.0%), slope still had the smallest importance (5.1%). In addition, in the LYRB, elevation and land cover type were two variables with an obviously greater importance (29.2% and 25.0%, respectively), followed by slope and precipitation (16.7% and 14.3%, respectively), while solar radiation and temperature had similarly smaller importance (7.9% and 6.8%, respectively).
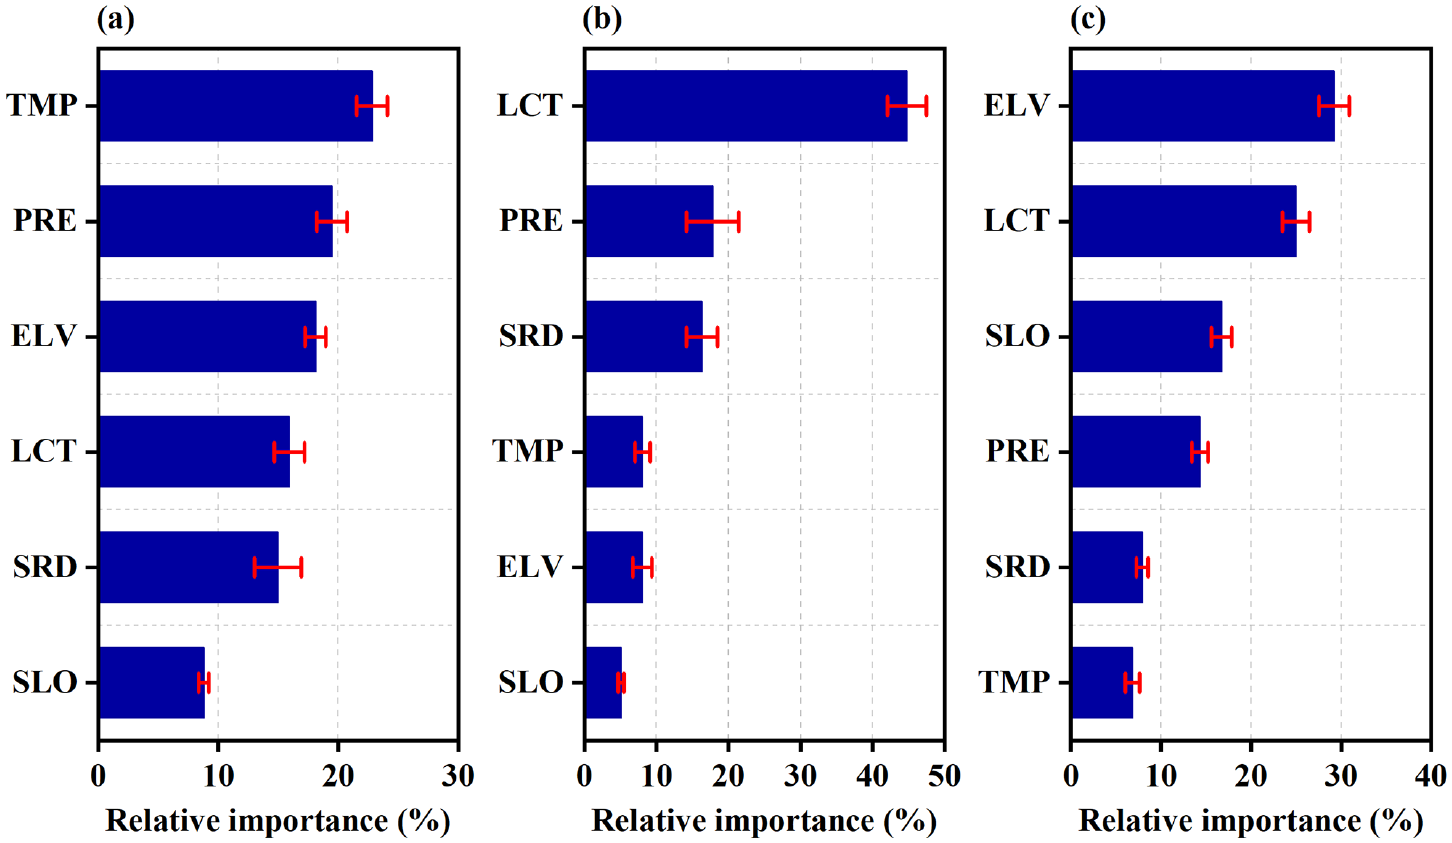
Mean relative importance and the corresponding standard deviation (error bar) of the independent variables to the spatial patterns of annual NPP during 2010-2019 in the (a) HRB, (b) WRB and (c) LYRB. These independent variables include temperature (TMP), precipitation (PRE), solar radiation (SRD) land cover type (LCT), elevation (ELV), and slope (SLO). The relative importance is assessed by the IncMSE% in random forest algorithm.
Interannual change of vegetation NPP
Spatial mean NPP in the HRB, WRB and LYRB all exhibited a substantial interannual variability during 2010-2019 (Figure 4). The NPP in the HRB ranged from 86.8 to 110.9 g C m−2 yr−1, and the absolute interannual variability (measured by SD, Yuan et al., 2009) was 8.46 g C m−2 yr−1, relative interannual variability (measured by coefficient of variation, Yuan et al., 2009) was 0.086. The NPP in the WRB ranged from 283.6 to 408.7 g C m−2 yr−1, with the absolute interannual variability of 35.7 g C m−2 yr−1, and the relative interannual variability of 0.103. In addition, the NPP in the LYRB ranged from 424.1 to 554.1 g C m−2 yr−1, with the absolute interannual variability of 39.7 g C m−2 yr−1, and the relative interannual variability of 0.083.
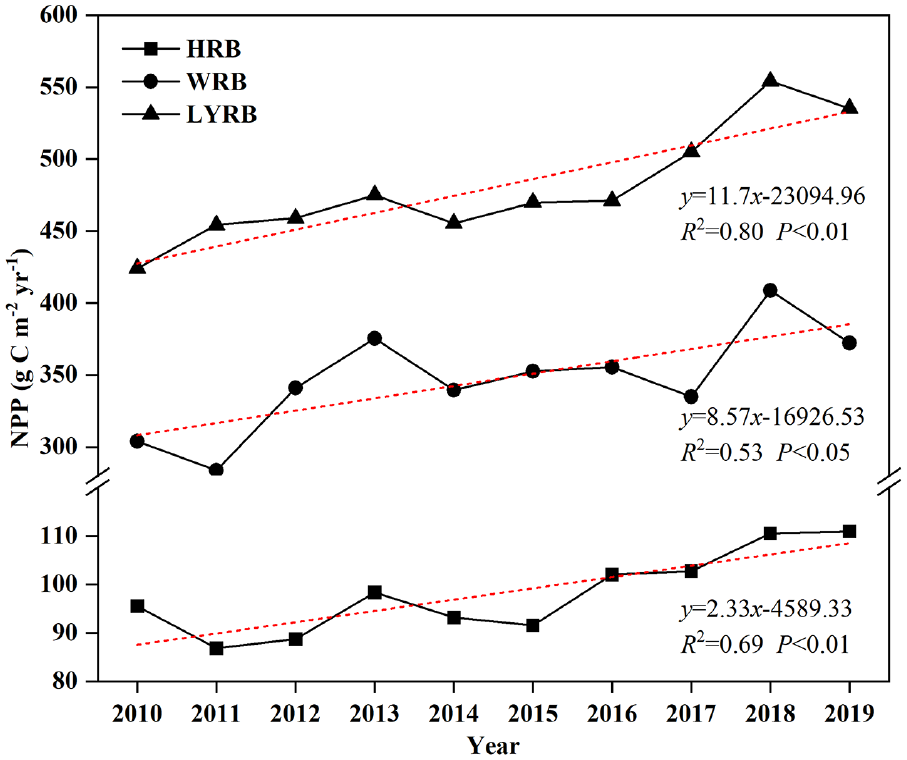
Interannual changes of the NPP during 2010-2019 in the HRB, WRB, and LYRB, and the fitted linear trends (red dashed lines).
Even so, a significant (P < 0.05) increasing trend of the interannual NPP during 2010-2019 was found in the HRB, WRB and LYRB (Figure 4). The increasing rate in the HRB, WRB and LYRB was 2.33, 8.57 and 11.7 g C m−2 yr−1, respectively. However, this increasing trend was not always observed in any regions of the HRB, WRB and LYRB (Figure 5). The significant (P < 0.05) increasing trend of NPP in the HRB was mainly found in the northeastern region in the Qilian Mountains and the artificial oases, comprising about 10% of the basin area (Figure 5a). A region with a significant (P < 0.05) increasing trend of NPP in the WRB accounted for about 25.22% of the basin area, and was mainly located in the center to western region and northern region as the Loess Plateau (Figure 5b). In addition, a significant (P < 0.05) decreasing trend was found in the northeastern region, located by the urban region of Guanzhong Plain (Figure 5b). A significant (P < 0.05) increasing trend of the NPP in the LYRB was mainly found in the mountainous area in the southwest, and a significant (P < 0.05) decreasing trend was mainly found in the southeastern and center regions, and along the Yangtze River sides (Figure 5c).
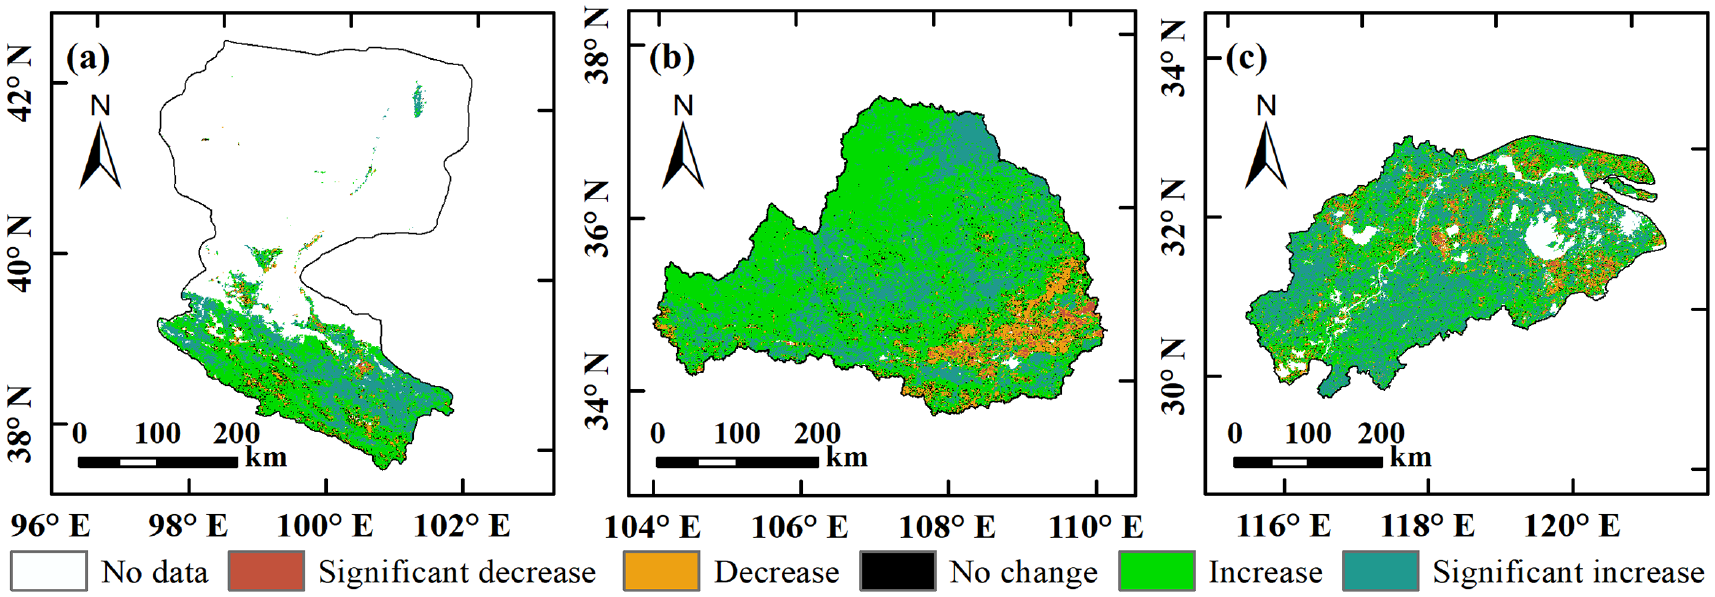
Spatial distribution of annual NPP trends during 2010-2019 in the (a) HRB, (b) WRB, and (c) LYRB. The trend is classified by the Z values in the Mann-Kendall test, as the significant increase (Z ⩾ 1.96), increase (0 < Z < 1.96), no change (Z = 0), decrease (−1.96 < Z < 0), and significant decrease (Z ⩽ −1.96).
Impact factors explaining the interannual change of NPP
Figure 6 shows the different roles of temperature, precipitation and solar radiation on NPP in the HRB, WRB and LYRB. Generally, the annual NPP was positively correlated with temperature and precipitation in the HRB, while the correlation with solar radiation was very complicated in space. Mean β between NPP and temperature, precipitation was respectively 0.26 (ranging from −0.90 to 0.97) and 0.38 (ranging from −0.93 to 0.97), and that of solar radiation was −0.04 (ranging from −0.91 to 0.93). Similarly, the correlation between annual NPP and temperature was generally positive in both the WRB and LYRB. The mean β was 0.23 (ranging from −0.97 to 0.97) and 0.39 (ranging from −0.99 to 0.99) respectively. However, both the correlations between annual NPP and precipitation, solar radiation in the WRB and LYRB were spatially heterogenous, with great ranges (generally from −0.96 to 0.96) but near to zero mean β (absolute mean β < 0.1).
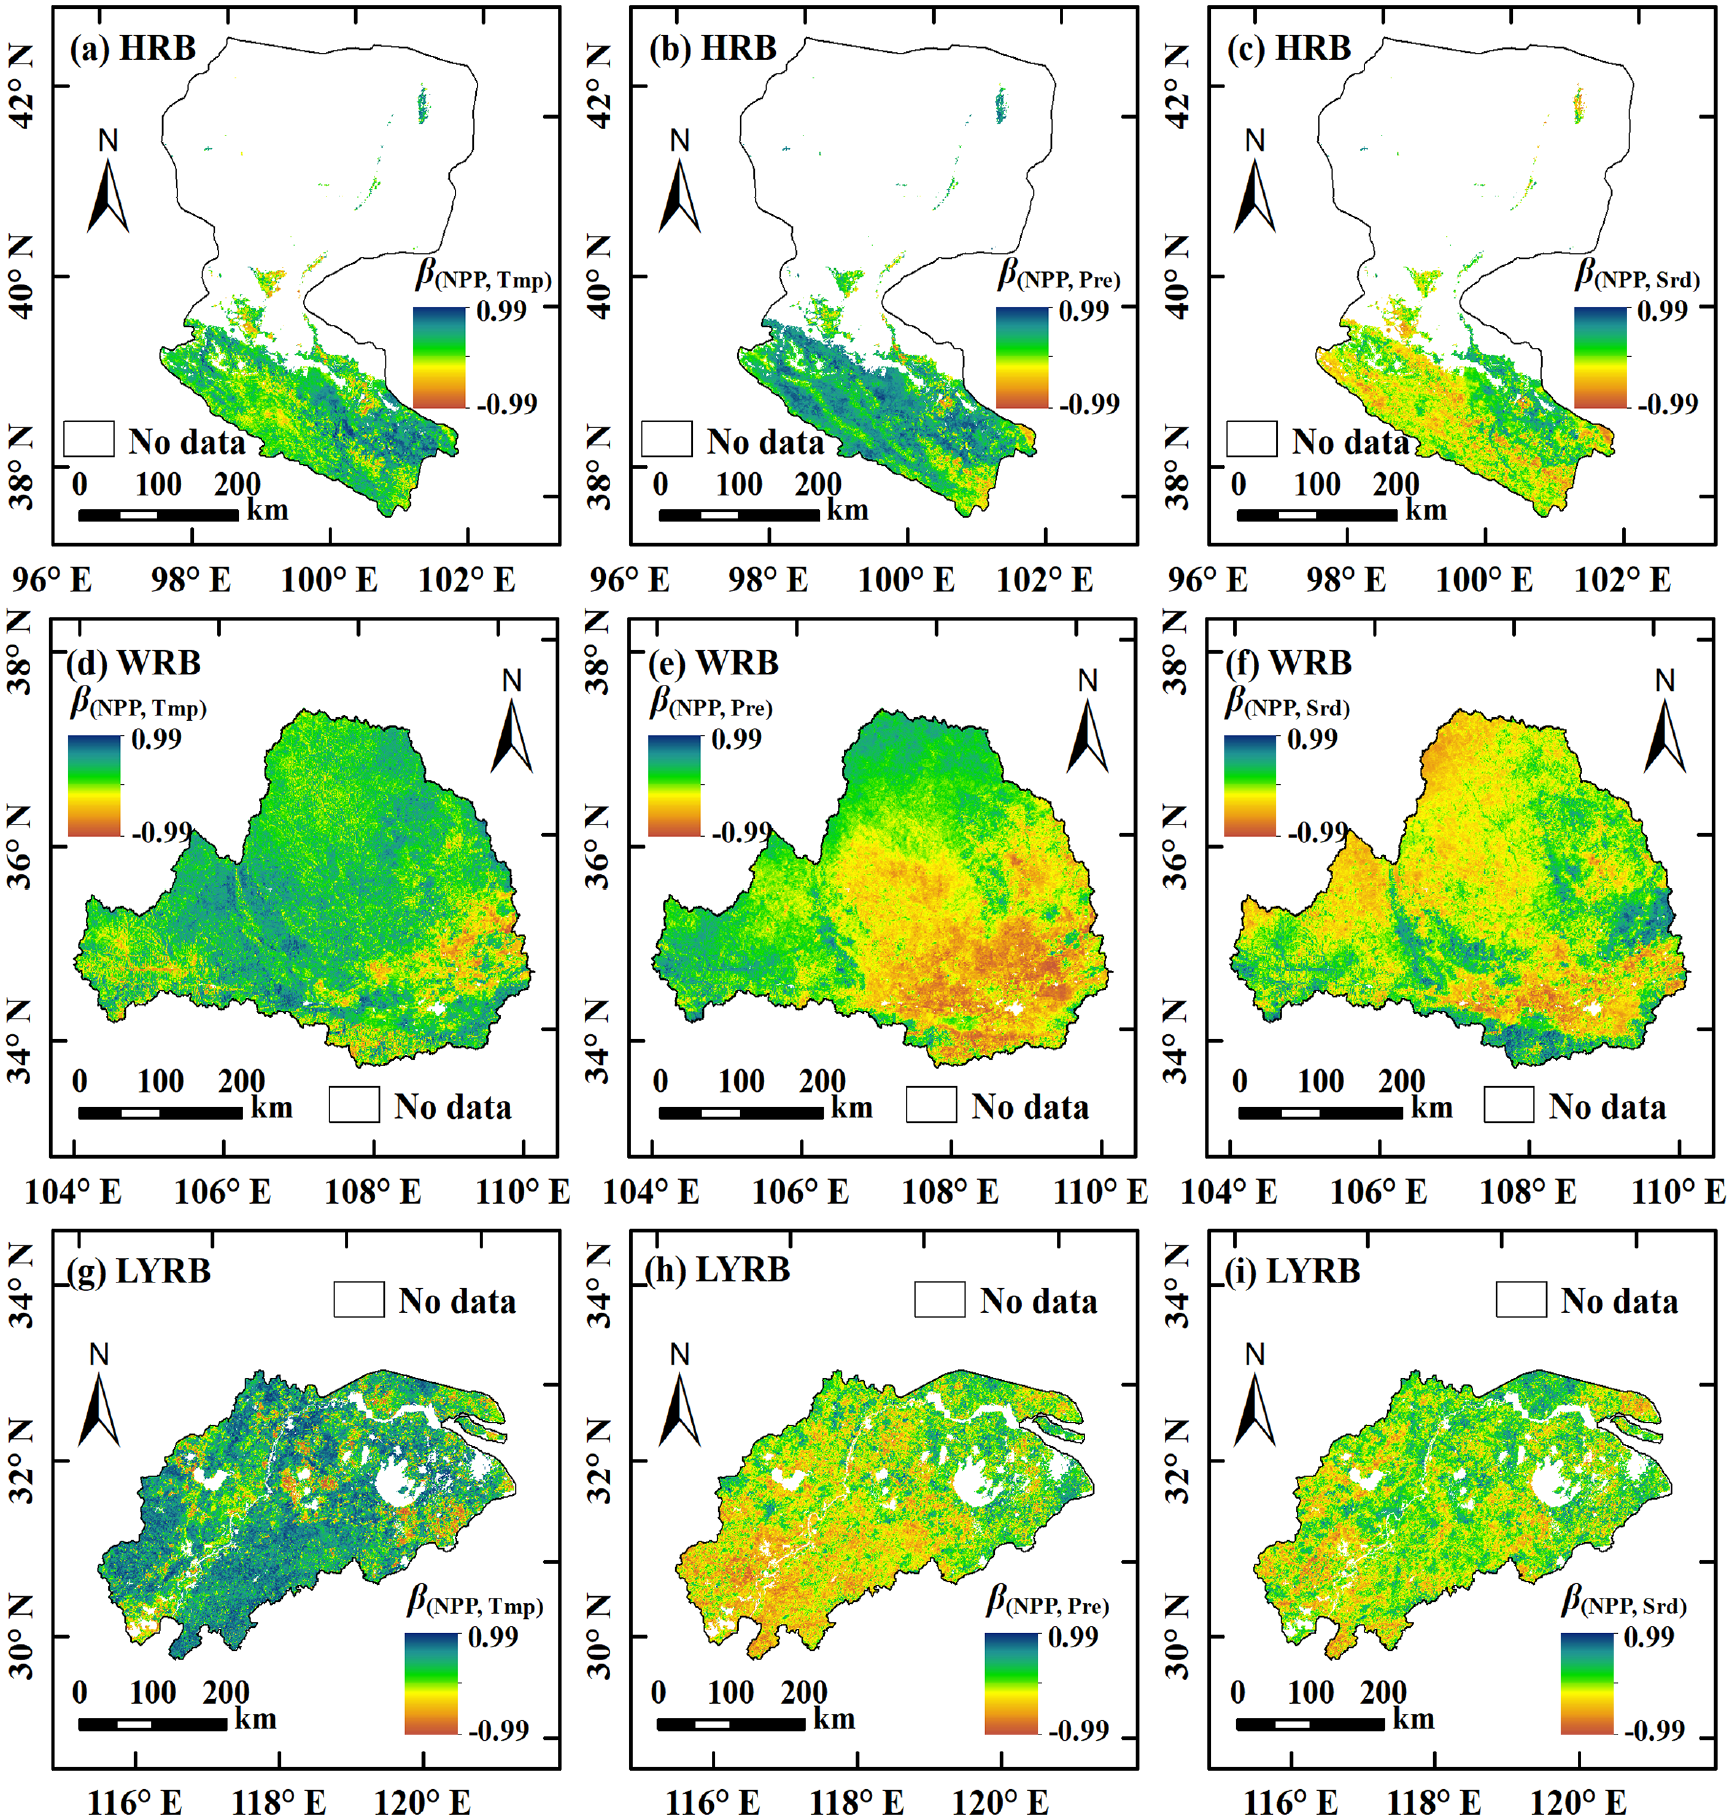
Spatial distributions of the partial correlation coefficients between annual NPP and temperature, precipitation and solar radiation during 2010-2019 in the (a-c) HRB, (d-f) WRB and (g-i) LYRB. The β(NPP, Tmp), β(NPP, Pre) and β(NPP, Srd) respectively present the partial correlation coefficients between annual NPP and temperature, precipitation and solar radiation.
We further mapped the spatial distribution of the relative contributions of the temperature, precipitation and solar radiation to annual NPP by the RGB composites (Figure 7). In the HRB, temperature, precipitation and solar radiation exhibited almost similar and relatively small contributions to NPP in most regions, due to the low NPP all the year round. Even so, in the southwestern region, precipitation had the greater contribution to NPP (Figure 7a). In the southeastern region, temperature had the greater contribution to NPP (Figure 7a). Temperature had a greater contribution to NPP in most regions of the WRB, especially in the center and southern regions (Figure 7b). However, precipitation had a greater contribution in the western and northern regions, and solar radiation had a greater contribution mainly along the northern marginal region (i.e. Qinling Mountains) (Figure 7b). In the LYRB, temperature also had a greater contribution to NPP in most regions but especially the western mountainous areas, and precipitation had a greater contribution to NPP primarily in the eastern plain region (Figure 7c). Overall, temperature and precipitation both had more obvious influences on the interannual change of NPP in the HRB, while in the WRB and LYRB, temperature exhibited predominant influence in most regions, which is consistent with the results from partial correlation analysis.
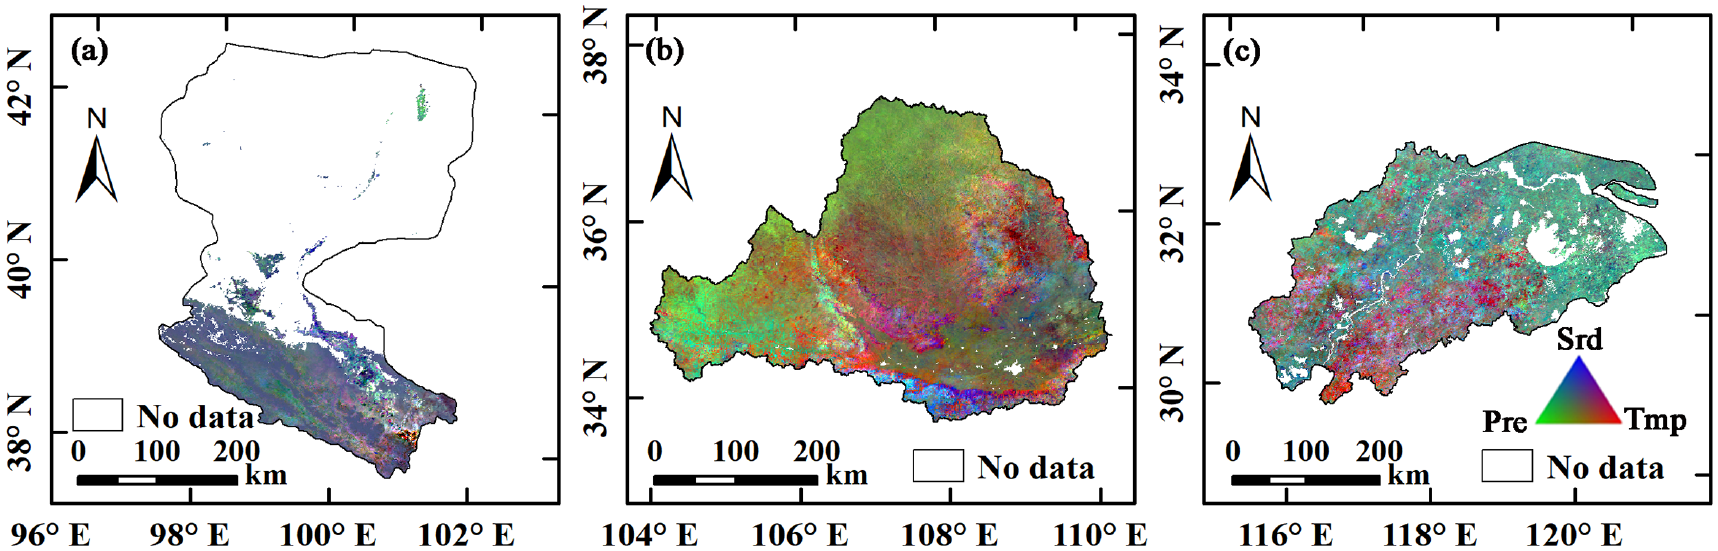
Color composite of the relative contributions of temperature (Tmp), precipitation (Pre), and solar radiation (Srd) to the interannual change of NPP during 2010-2019 in the (a) HRB, (b) WRB and (c) LYRB. Red represents the relative contribution of temperature; green represents the relative contribution of precipitation; and blue represents the relative contribution of solar radiation. Value for the relative contribution ranges from 0 to 1.
Intra-annual change of vegetation NPP
Vegetation NPP in the HRB, WRB and LYRB all exhibited a remarkable seasonality (Figure 8). The NPP in summer was the greatest, which accounted for 62.83%, 57.77% and 44.55% of the annual NPP respectively in the HRB, WRB and LYRB. The NPP in autumn was the second largest, and accounted for 33.10%, 33.68% and 39.39% of the annual NPP respectively in the HRB, WRB and LYRB. The NPP in winter was the lowest, just accounting for about 0.26%, 0.95% and 3.28% of the annual NPP respectively in the HRB, WRB and LYRB.
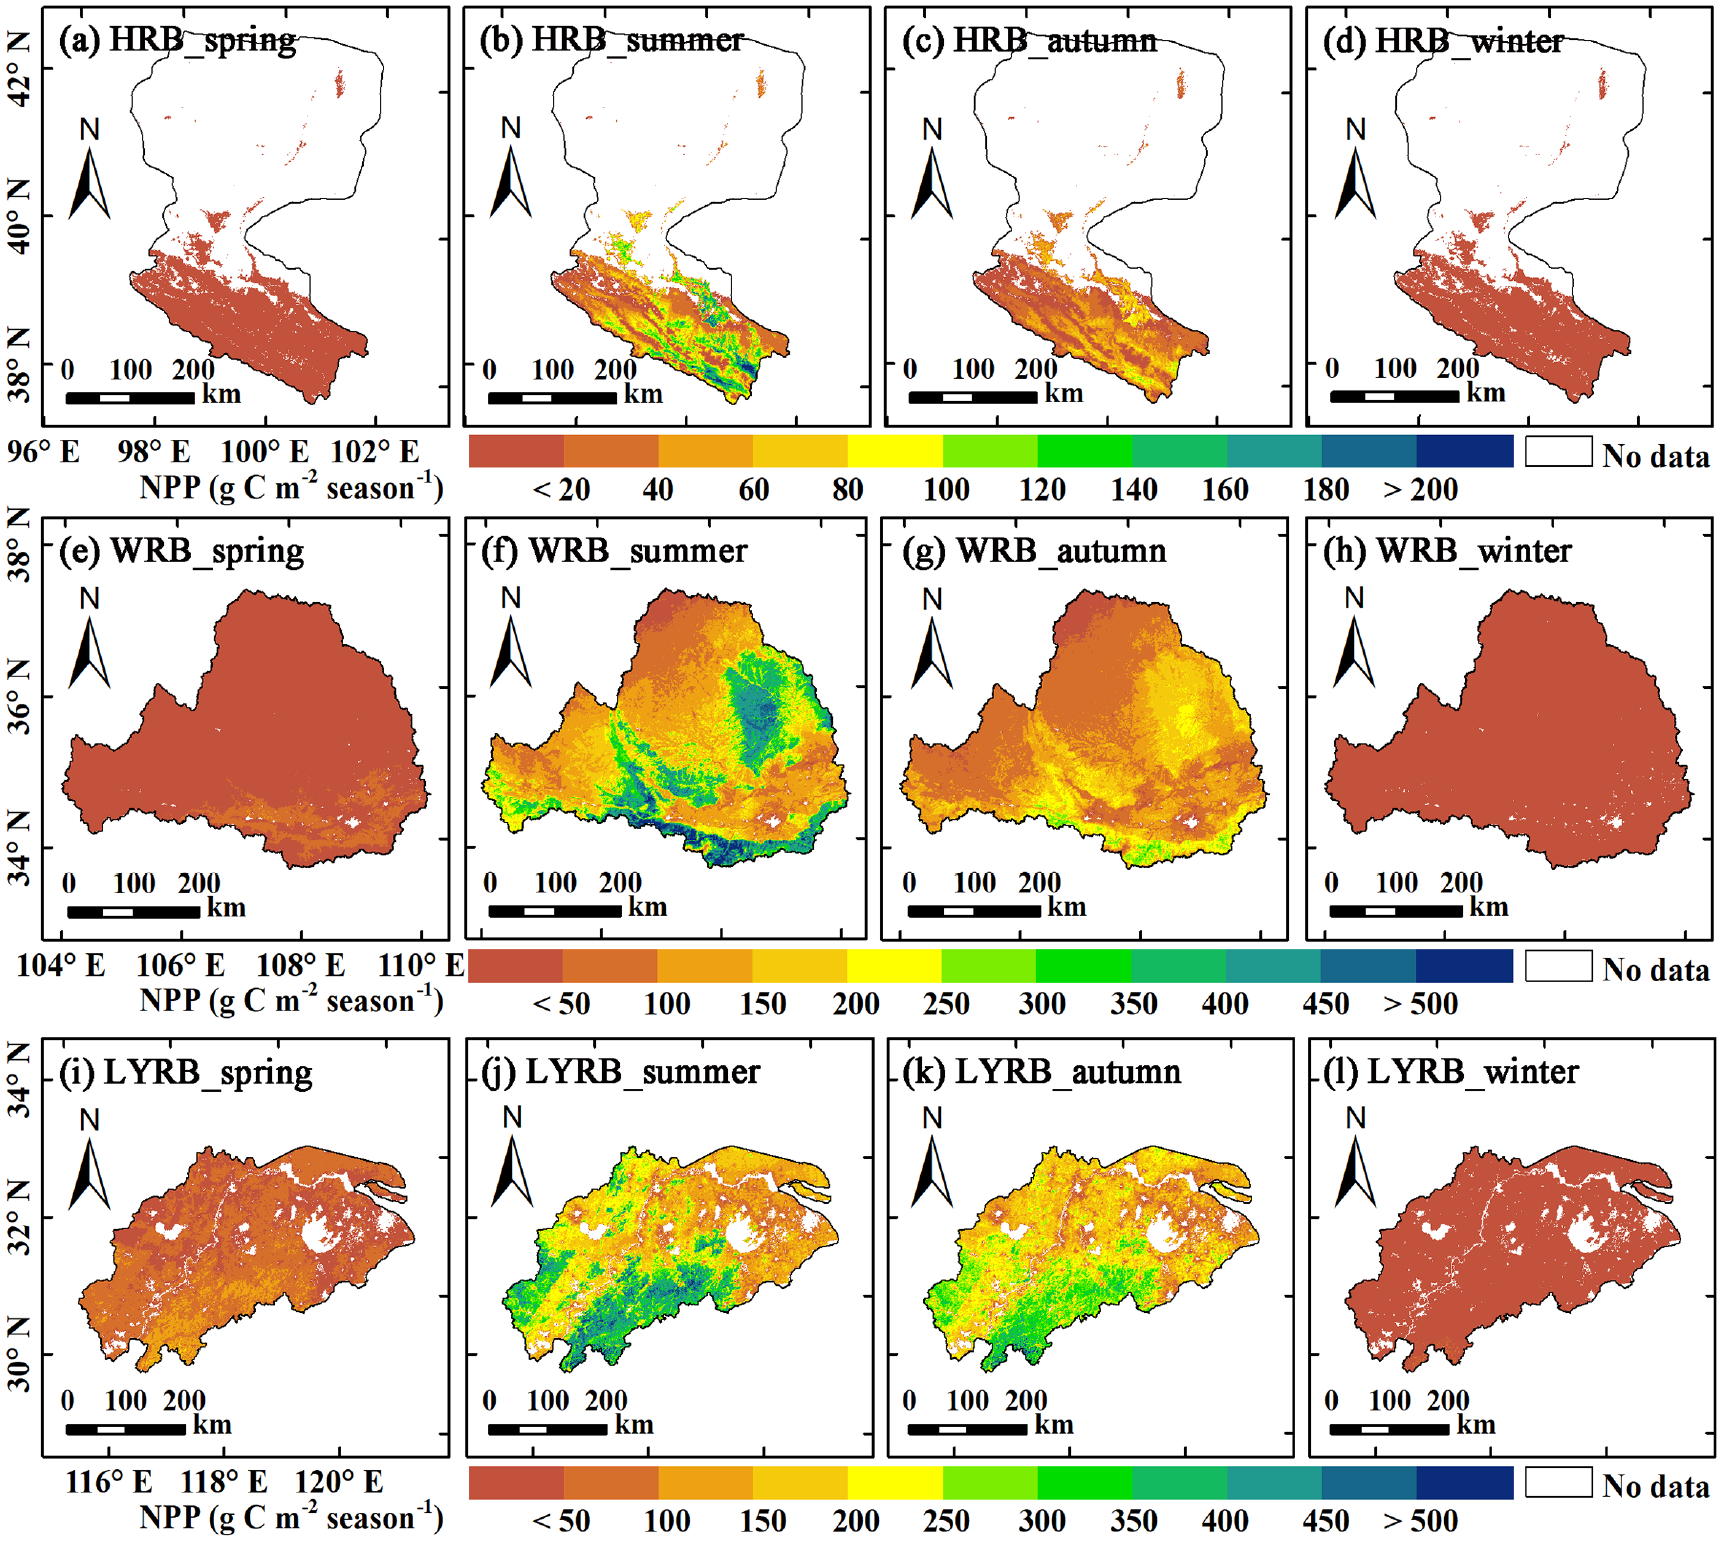
Spatial distributions of NPP in different seasons during 2010-2019 in the (a-d) HRB, (e-h) WRB, and (i-l) LYRB.
Meanwhile, vegetation NPP in different seasons all exhibited an increasing trend during 2010-2019 in the HRB, WRB and LYRB (Figure 9). The greatest increasing rate was found in summer, which was 1.29, 4.81 and 4.13 g C m−2 season−1 respectively in the HRB, WRB and LYRB. What’s more, the NPP in summer had the greatest absolute interannual variability during 2010-2019, which was 5.02, 20.80 and 21.70 g C m−2 season−1 respectively in the HRB, WRB and LYRB. The second largest increasing rate was in autumn in the HRB and WRB (1.07 and 2.03 g C m−2 season−1, respectively), while that was found in spring in the LYRB (3.35 g C m−2 season−1). In addition, the increasing trend in spring was the most obvious in the WRB and LYRB (R2 = 0.67 and 0.76, respectively), yet the most obvious increasing trend in the HRB was found in summer (R2 = 0.61). The increasing trend in winter was all non-significant (P > 0.05) and the increasing rate was the lowest.
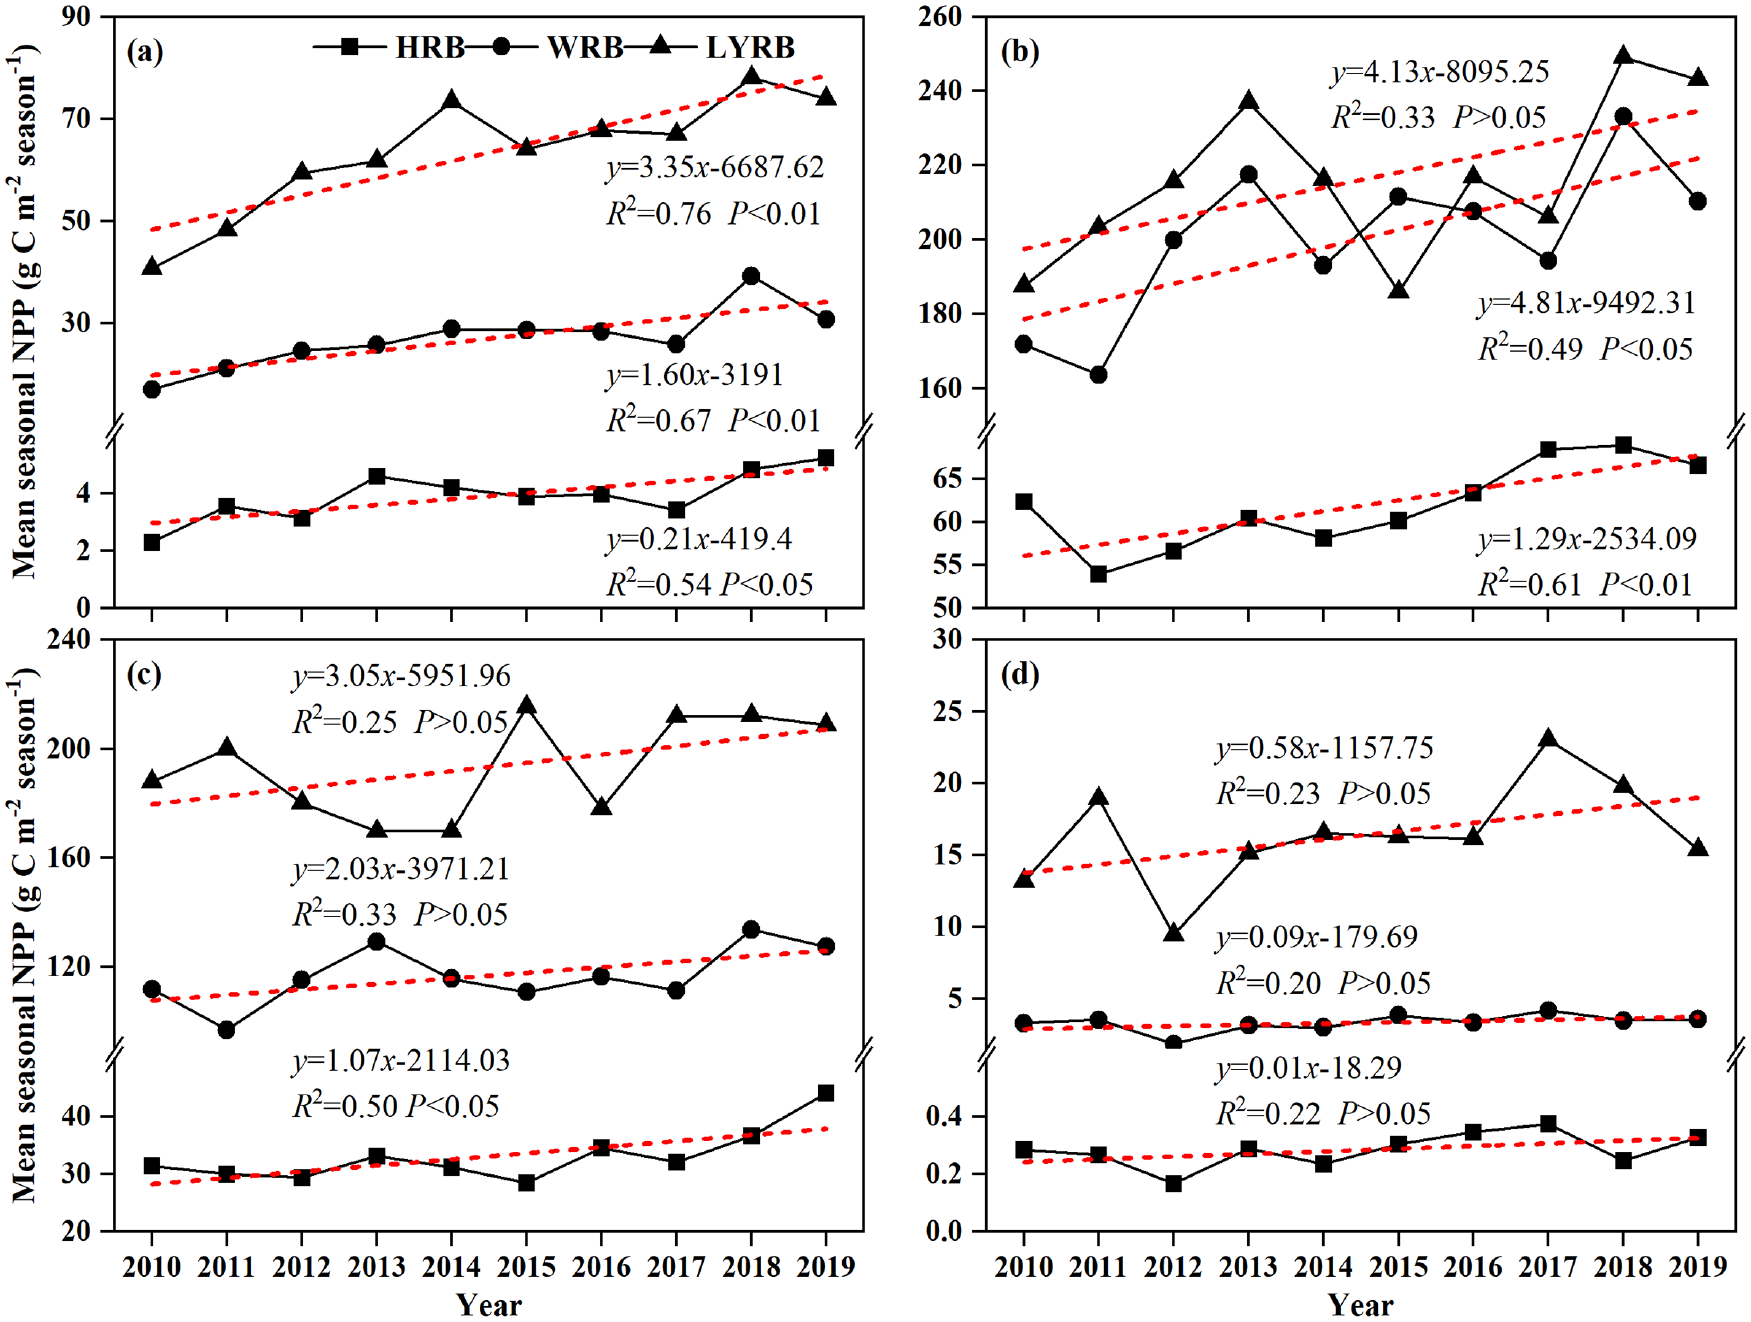
Annual changes of NPP in (a) spring, (b) summer, (c) autumn, and (d) winter 2010-2019 in the HRB, WRB and LYRB, and the fitted linear trends (red dashed lines).
Vegetation NPP in the HRB, WRB and LYRB all exhibited a unimodal curve with months in a year (Figure 10a). The increase of NPP generally started from February or March, and the peak of NPP was reached in August or September. After that, the NPP began to decrease, and the decrease generally ended in November or December. This unimodal curve was also found for the NPP in different land cover types (Figure 10b–d). However, the NPP in the water body and “other” land cover types was generally low, and performed a low-rise unimodal change with months. Comparatively, the NPP in the forest and shrubland was generally great and performed a sharp-rise unimodal change with months.
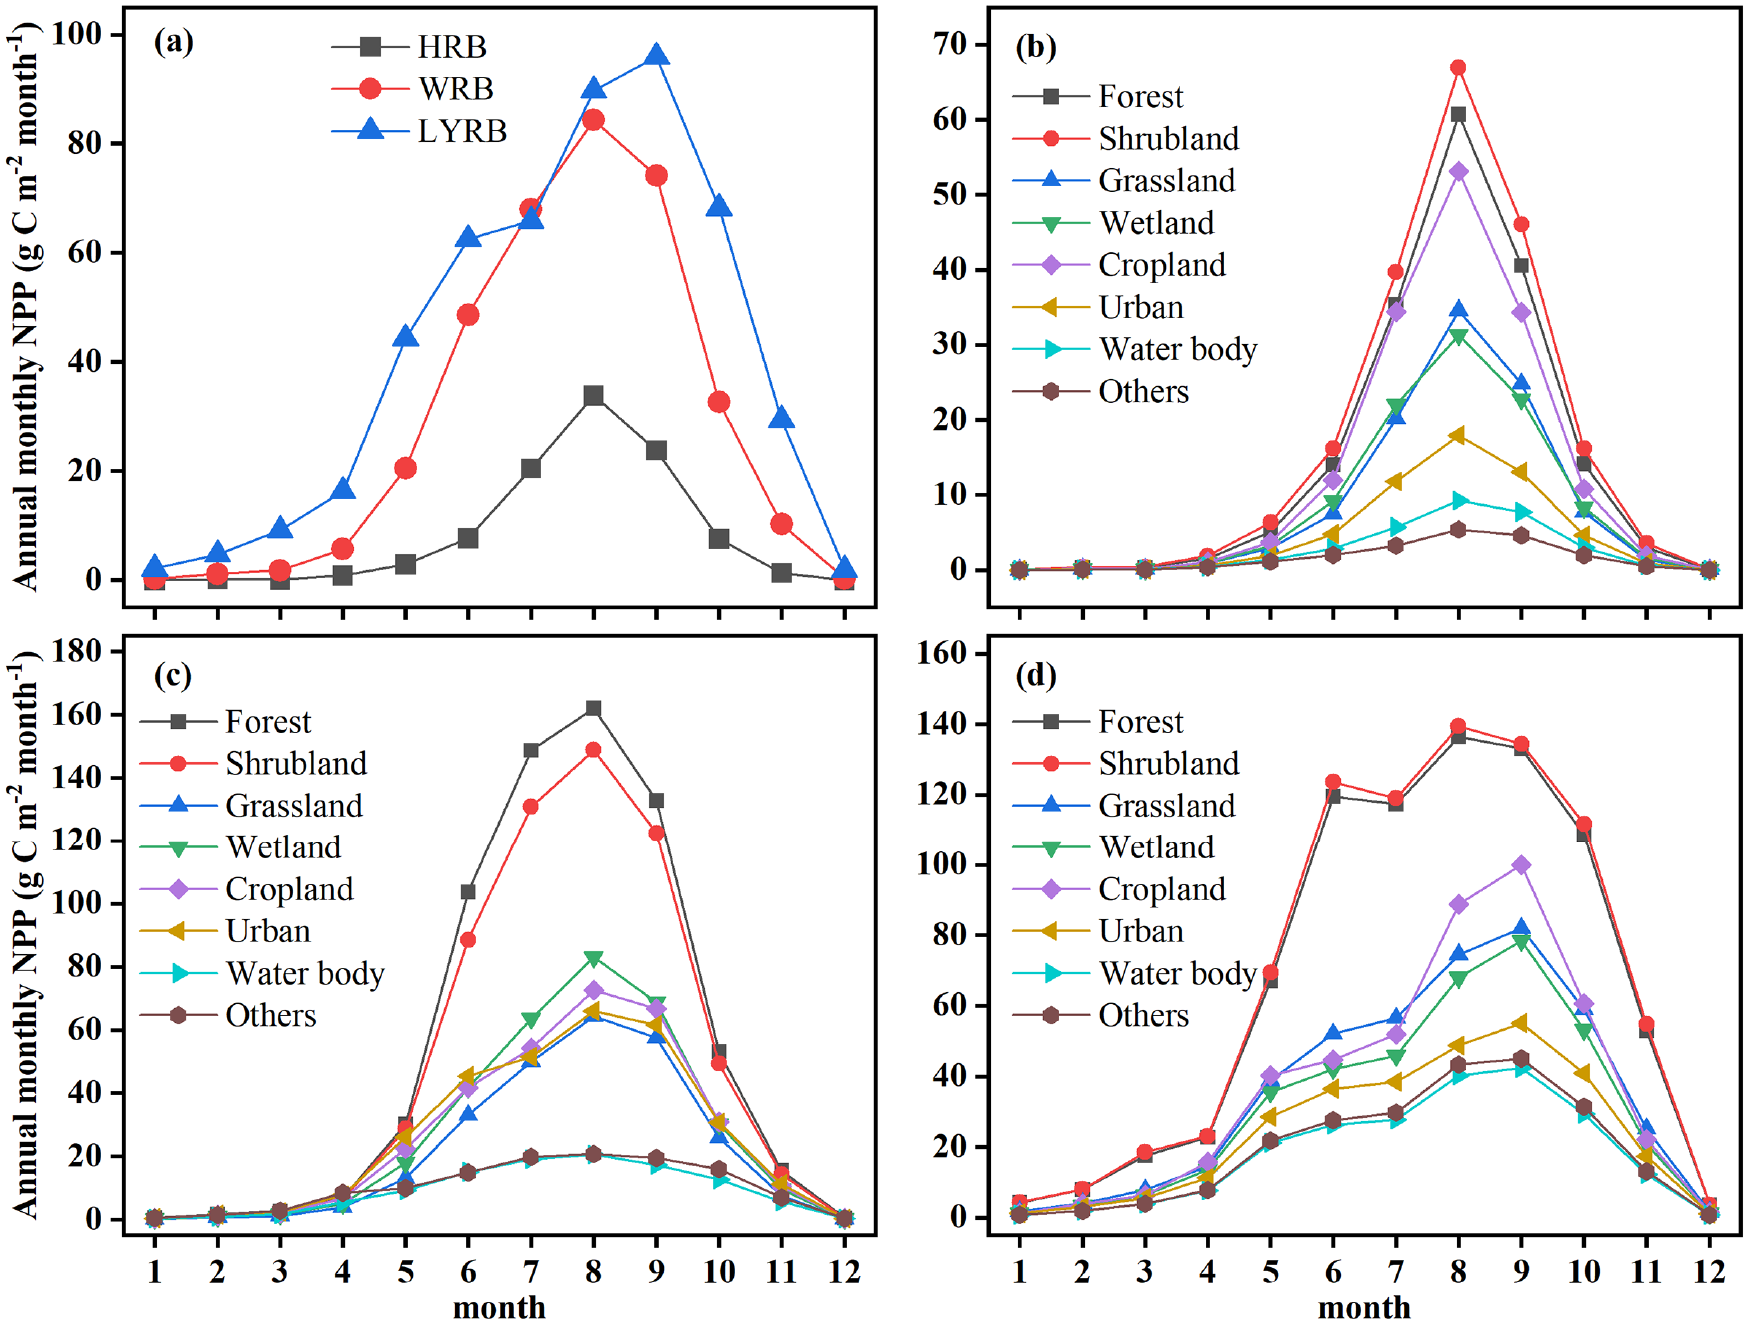
Multi-year mean monthly changes of NPP during 2010-2019 (a) in the whole HRB, WRB, and LYRB, and in the regions with different land cover types of the (b) HRB, (c) WRB, and (d) LYRB.
Discussions
Different controls of the spatial patterns of NPP in three basins
The estimated mean annual NPP by CASA model in the HRB (98.1 g C m−2 yr−1), WRB (346.7 g C m−2 yr−1) and LYRB (480.3 g C m−2 yr−1) was approximate to those estimated in previous studies (e.g., Jia et al., 2023; Liu et al., 2023; Lyu et al., 2023; Zhang et al., 2023), indicating that the estimations are reliable. For example, Xu et al. (2012) estimated a spatial mean NPP of 108 g C m−2 yr−1 in the HRB in 2002 with the Boreal Ecosystem Productivity Simulator. Wang et al. (2020a) calculated a mean annual NPP of 366.4 g C m−2 yr−1 for 2001-2018 in the WRB with the CASA model. Feng and Xie (2022) concluded that the spatial mean NPP in the Yangtze River Basin ranged from 478.5 to 547.4 g C m−2 yr−1 during the period of 2000-2015, and the mean annual value was 516.5 g C m−2 yr−1 from the MODIS NPP product.
In addition, the elevations of NPP from the HRB to the WRB, and then the LYRB (Figures 2, 4, 8–10) imply a decrease of hydrothermal limitation of vegetation along the climate gradients. Previous studies also concluded an increasing trend of vegetation productivity from northwest to southeast of China, along with the increase of temperature and precipitation (e.g., Peng et al., 2023; Piao et al., 2005). Lower NPP in the HRB is primarily due to that the widespread insufficiency of hydrothermal condition for vegetation growth (Gao et al., 2016; Liu et al., 2017), which is confirmed by the greater importance of temperature and precipitation to the spatial pattern of NPP in the HRB (Figure 3a). In contrast, the hydrothermal limitation has been effectively mitigated in the WRB, and land cover type instead of climate became the most important variable (Figure 3b). This can be explained by the diverse land cover type in the WRB, which results in great spatial variability of vegetation production capacity by determining the NDVIi,min, NDVIi,max and εmax in equations 3-7. Furthermore, we deduce that the hydrothermal limitation of vegetation in the LYRB has been almost eliminated (Wang et al., 2021). This is verified by that the topography and land cover type becoming the important variables controlling the spatial pattern of NPP in the LYRB, while the relative importance of climate was marginal (Figure 3c). Topography is a critical factor regulating the spatial patterns of temperature and precipitation, as well as the vegetation types (Hong et al., 2005; Wang and Cheng, 2023), and thus exerts influence on NPP through equations 3-10.
Different drivers of the interannual change of NPP in three basins
As a benefit of global warming and implementation of a series of ecological programmes in China (Bryan et al., 2018), vegetation coverage has been gradually improving during recent decades (Peng et al., 2011; Piao et al., 2015). Therefore, an overall increasing trend of annual NPP was observed during 2010-2019 in the HRB, WRB and LYRB (Figures 4, 5 and 9). The increasing trend of NPP in these basins has also been reported in previous studies (Wang et al., 2021; Zhang et al., 2023; e.g., Liu et al., 2017; Lyu et al., 2023). On the whole, the increasing trend of NPP in the HRB was primarily driven by the increase of both temperature and precipitation due to the warming and humidification of the northwestern China (Chen et al., 2023). This is inferred from the overall positive β between NPP and temperature, precipitation (Figure 6), and the similar relative contributions of temperature and precipitation in the HRB (Figure 7). By contrast, in the WRB and LYRB, increase of temperature with global warming primarily contributed to the increasing trend of NPP, because of the relatively more abundant precipitation. Therefore, we observed an overall positive β between the NPP and temperature, while the β was near to zero between the NPP and precipitation or solar radiation (Figure 6). Similarly, the relative contribution of temperature surpassed that of precipitation and solar radiation in most regions of WRB and LYRB (Figure 7).
In addition, the increasing rate of NPP was in the order: LYRB > WRB > HRB (Figure 4). The greatest increasing rate of NPP in the LYRB may be primarily ascribed to the smaller hydrothermal limitation (especially the water limitation) than those in the HRB and WRB due to the warmer and moister climate (Peng et al., 2011). Thus, the global warming and implementation of ecological programmes in the LYRB yielded more remarkable revegetation during recent decades (Yang et al., 2021). The increasing rate of NPP in the WRB was also high, which indicates a not so conspicuous hydrothermal limitation on vegetation. In contrast, vegetation in the HRB overall undergoes the severest hydrothermal limitation. Therefore, we found that although the increasing trend was generally significant (P < 0.05) in different seasons, the increasing rate was the lowest in the HRB (Figures 4 and 9).
Critical drivers for the interannual NPP trend during 2010-2019 may be spatially heterogenous in the HRB, WRB and LYRB (Figure 3). The significant (P < 0.05) increasing trend of NPP in mountainous areas of the HRB and WRB is primarily due to the warming and humidification of the northwestern China (Bai et al., 2023; Chen et al., 2023). The greater β between annual NPP and the temperature and the greater relative contributions of temperature to NPP in these regions (Figures 6 and 7) support this opinion. The significant (P < 0.05) increasing trend of NPP in the artificial oases of the middle reaches and riversides of the lower reaches of the HRB may be attributed to the construction of water conservancy project to achieve an expansion of the oasis and a high yield of oasis crops (Song and Zhang, 2015). The implementation of ecological restoration programmes (e.g. “Grain for Green” and Nature Reserves) contributes greatly to the increasing trend of NPP in the northern WRB (i.e. Loess Plateau) and southwestern LYRB (Fu et al., 2017; Yang et al., 2021; Zhang et al., 2014). In addition, the significant (P < 0.05) decreasing trend of NPP in the WRB and LYRB may be primarily due to the urban expansion at the cost of forest and cropland in the Guanzhong Plain and the Yangtze River Delta (Lyu et al., 2023; Wang et al., 2021).
Different drivers of the intra-annual change of NPP in three basins
Critical mechanisms explaining the temporal trends of NPP at both seasonal and monthly scales may be different in different basins (Figures 8–10). Firstly, spring warming results in a significant (P < 0.05) increasing trend of NPP in spring in the HRB, WRB and LYRB (Figure 9a), which has also been documented in other studies (Piao et al., 2005; Wu et al., 2021; Xue et al., 2023). Here we deduce that the increase of NPP in the LYRB (Figure 4) is mainly contributed to the increased NPP in spring (greater R2 and increasing rate) induced by spring warming, due to a degree of temperature limitation but not water limitation at this time of year (Liang et al., 2015). In contrast, the increase of NPP in the WRB is determined by the increase in spring and summer (greater R2 and increasing rate), reflecting the increase of water limitation. The increase of NPP in the HRB is derived from the increase in spring, summer and autumn (greater R2 and increasing rate) with increase of temperature and precipitation, reflecting a general severe hydrothermal limitation. Secondly, an earlier beginning and later end of the growing season was found in the LYRB due to the higher temperature and great precipitation, which results in a longer growing season than that in the HRB and WRB (Figure 10a). Thirdly, the increasing of NPP slowed down and even stopped in June and July in the LYRB (Figure 10a). This is possibly due to fact that light deficiency in the rainy season limits the plant photosynthesis and results in the decrease of NPP (more obvious in natural ecosystems like forest and shrubland) (Figure 10d) (Liang et al., 2015). Another reason is that the cropland is also under rotation period from wheat harvesting to rice planting in June and July in the LYRB (Figure 10d) (Duan et al., 2021).
Limitations and prospects
In this study, we investigated the differences of critical controls on spatio-temporal patterns of NPP in the HRB, WRB and LYRB. Although important fundamental results have been obtained, this study also has some limitations. Firstly, our study simply concluded the increase of hydrothermal limitation on NPP from LYRB to WRB and then HRB. More systematic and comprehensive quantitative analyses are needed for the hydrothermal limitation as well as its spatio-temporal patterns during recent decades. Secondly, human activities also have critical influences on the spatio-temporal patterns of NPP (Gang et al., 2018; Peng et al., 2023; Yang et al., 2021), but these lack indepth analysis in our study. Thirdly, we only used the mean annual NPP from previous studies to validate the simulations in this study. The simulation accuracy of spatio-temporal NPP still needs to be evaluated by the contemporaneous measured data from different sites, if possible. Finally, a longer-term investigation (e.g. advancing the start year from 2001) may receive more novel and solid findings, though using the recent 10-year period to investigate the NPP is also found in other studies (e.g., Liu et al., 2017; Zhang et al., 2014).
Conclusion
Based on the estimation by the CASA model, different spatio-temporal patterns of NPP during 2010-2019 were observed in the HRB, WRB and LYRB with different climate types. From the spatial perspective, the NPP was in the order: LYRB (480.3 g C m−2 yr−1) > WRB (346.7 g C m−2 yr−1) > HRB (98.1 g C m−2 yr−1). This reflects an increase of hydrothermal limitation on vegetation across the climate gradients. In the HRB, temperature and precipitation were the most important variables regulating the spatial pattern of NPP, while land cover type became the most important variable in the WRB, and topography (elevation and slope) and land cover type were the most important variables in the LYRB. From the perspective of interannual change, the NPP in the HRB, WRB and LYRB all exhibited an overall upward trend during 2010-2019. However, as a whole, this increase was more regulated by the increase of both temperature and precipitation in the HRB, while it was just driven by the increase of temperature in the WRB and LYRB due to the relatively more abundant precipitation. From the perspective of intra-annual change, vegetation NPP in the HRB, WRB and LYRB all exhibited a unimodal curve with months. However, the increasing of NPP slowed down in June and July in the LYRB, mainly due to the light deficiency with abundant precipitation for plant photosynthesis in the forest and shrubland, and the rotation from wheat harvesting to rice planting in the cropland. These results may supplement our knowledge on the response of terrestrial ecosystem to climate gradient.
Footnotes
Declaration of conflicting interests
The author(s) declared no potential conflicts of interest with respect to the research, authorship, and/or publication of this article.
Funding
The author(s) disclosed receipt of the following financial support for the research, authorship, and/or publication of this article: This study is financially supported by the National Natural Science Foundation of China (42125103 and 42271061), the Provincial Natural Science Foundation of Jiangsu (BK20230109), and the Science and Technology Planning Project of NIGLAS (2022NIGLASTJ15).