
Abstract
China’s karst areas play an important role in regulating the global carbon dynamic and mitigating atmospheric CO2 concentration. Yet, extreme drought events have occurred frequently in recent years over China’s karst areas, which have a negative effect on the gross primary productivity (GPP) in the region. It is unclear whether gross primary productivity gains in the wet years can compensate for its losses in the dry years over the karst areas. In this study, we selected the asymmetry indices to assess the potential asymmetric response of gross primary productivity to the change in precipitation over China’s karst areas during the 2003 to 2018 period, using the gross primary productivity and precipitation dataset. Our results show that the gross primary productivity exhibits a positive asymmetry in response to precipitation changes, namely, the gains caused by increased precipitation in the wet years overcompensate the losses caused by decreased precipitation in the dry years. In addition, the gross primary productivity asymmetry shows an increasing trend over the study period despite extreme drought events occurring frequently, which is due to the response of gross primary productivity to drought has significantly decreased over the study period. For each biome, grasslands show the highest positive gross primary productivity asymmetry, indicating that the grassland biomes have a stronger capacity to utilize the increased precipitation during the wet years to increase gross primary productivity compared to other biomes. Furthermore, the gross primary productivity asymmetry over China’s karst areas can be effected by the precipitation asymmetry as well as mean annual precipitation. Our results will contribute to our knowledge of the response of gross primary productivity to precipitation changes in the karst areas of China.
Introduction
Over the past two decades, a greening trend has been observed in China using satellite observations (Piao et al., 2019), which contributes to approximately 25% of the global leaf-area net increase during 2000 to 2017 (Chen et al., 2019). The vegetation greening trend in China could be attributed to the joint effect of positive land-use management, climate change, and increased atmospheric CO2 concentration (Piao et al., 2015). Precipitation, especially, is considered as a major determinant of vegetation growth (Knapp and Smith, 2001; Sala et al., 2012), and small changes in precipitation can alter vegetation growth and productivity, therefore affecting the vegetation carbon sink in China. Furthermore, China has one of the largest contiguous karst regions, characterized by buried carbonate rocks, in the world (Wang et al., 2019; Wu et al., 2020). Given the wide distribution of karst landscapes in China, their ecosystems play a pivotal role in regulating the terrestrial carbon cycle and mitigating climate changes. However, the presence of soluble carbonate rocks over China’s karst areas results in shallow and sporadic soil layers, accelerated hydrological processes, and rapid biogeochemical cycles (Yue et al., 2022). These attributes make the karst area one of the most fragile and susceptible areas in China. As a result, exploring China’s karst ecosystem processes in relation to climate changes is essential to better understand the capacity of karst ecosystem’s carbon sequestration and the resilience or resistance of karst ecosystems.
In order to combat the rocky desertification as well as to enhance the geo-ecological conditions over China’s karst areas, the Chinese government has implemented a wide range of long-term ecological restoration and conversation projects since 2000, like the Green for Grain Project, Natural Protection Project, and the Karst Rocky Desertification Comprehensive Control and Restoration Project (Hua et al., 2016; Lu et al., 2018; Ouyang et al., 2016). As a result, the active implementation of ecological engineers has significantly improved the vegetation cover rate (Tong et al., 2020) as well as China’s karst ecosystem’s carbon sequestration (Tang et al., 2022; Tong et al., 2018; Xu et al., 2017) over these areas through afforestation and reforestation activities. However, the vegetation in the karst areas is still vulnerable to drought stress compared to the non-karst areas (Qiao et al., 2021; Tang et al., 2022), especially in the Southwest China karst areas where extreme drought events occur frequently (Li et al., 2019; Song et al., 2019). The severe drought may have a negative impact on the karst ecosystem productivity. Whether the gain of karst ecosystem productivity in the wet years can offset the loss of karst ecosystem productivity in the dry years over China’s karst areas is still unclear.
It has been acknowledged that the response of gross primary productivity (GPP) to changes in the global hydrological cycle (e.g., precipitation) are nonlinear (Knapp et al., 2017; Zhou et al., 2008). Precipitation changes could have an asymmetric effect on GPP (Felton et al., 2021; Haverd et al., 2017; Wilcox et al., 2017; Wu et al., 2018), namely, the increase in GPP during wet years is not equivalent to the decrease observed during dry years. Previous studies have investigated the asymmetric effect of precipitation on GPP over China. For example, a positive asymmetry was observed in China over the 2001 to 2020 period, which is more pronounced in Northwest China (Chang et al., 2023). In contrast, a negative asymmetry was found in Southwest China, owing to the negative impact of frequent extreme drought on GPP in this region (Dong et al., 2023). Yet, China’s karst areas have a unique geologic structure, and the environment for vegetation growth has improved in recent decades. Specifically, most karst landscapes are concentrated in Southwest China, which is characterized by humid areas with abundant precipitation and high vegetation productivity. On the other hand, the extreme drought events occurring frequently in the Southwest China karst areas pose a threat to the GPP dynamics in this region. Thus, the asymmetric response of GPP to precipitation changes over China’s karst areas should be further assessed, as it is essential for improving the knowledge of karst ecosystems’ carbon dynamics in these areas and the resilience of karst ecosystems.
In the present study, we explore the GPP asymmetry over China’s karst areas during the period from 2003 to 2018 using asymmetry indices (AI). The major objectives are: (1) to evaluate the asymmetric response of GPP to precipitation changes over China’s karst areas; (2) investigate the temporal variations of GPP asymmetry; and (3) analyze the GPP asymmetry for each biome.
Dataset and method
Study area
China’s karst landscapes, characterized by buried, covered, and exposed carbonate rocks, covers a 3.44 × 10⁶ km2 region in China (Jiang et al., 2014). Furthermore, the exposed karst landscape covers about 1.88 × 10⁵ km2 (Figure 1a), accounting for 19.58% of the China’s terrestrial region. China’s karst areas are mainly distributed in Yunnan, Guizhou, Guangxi, Guangdong, Sichuan, Chongqing, Hunan, and Hubei provinces of South China, which are considered as the largest global continuous karst areas (Yue et al., 2020).
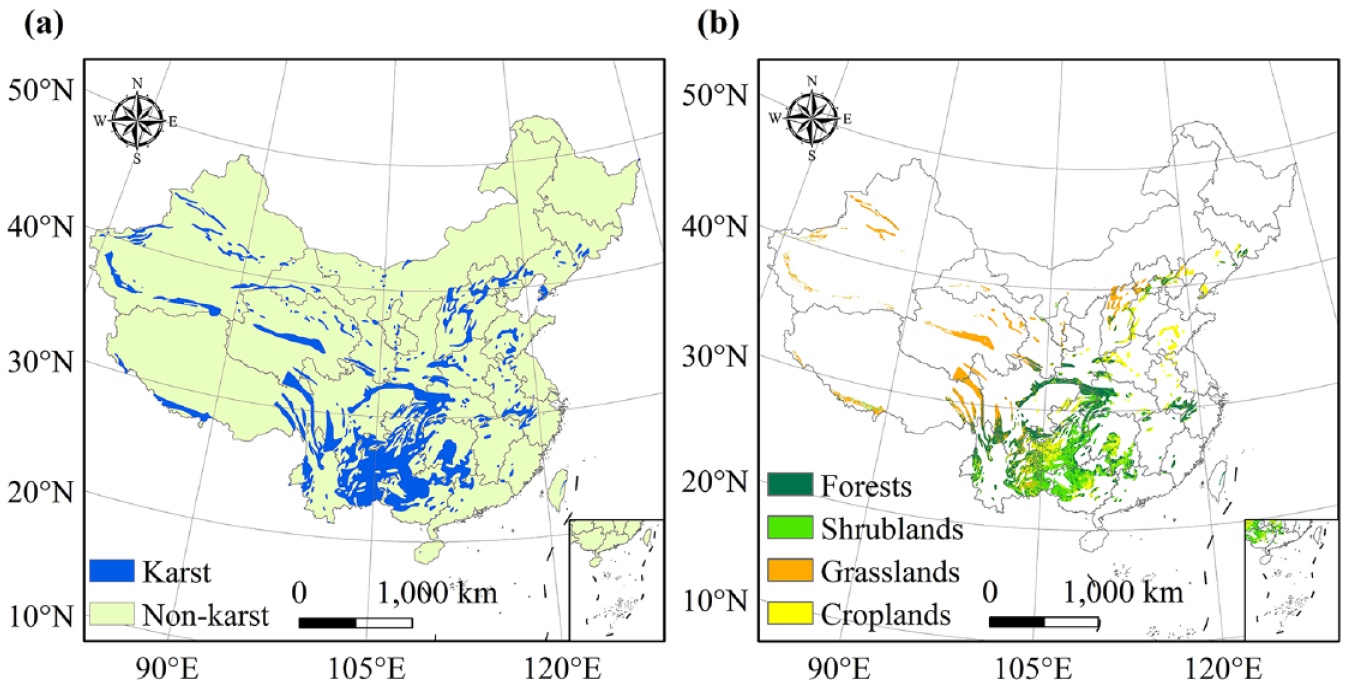
The spatial distribution and vegetation types over China’s karst areas. (a) Spatial distribution of karst landscape in China. (b) Vegetation types of China’s karst areas based on 10-year MODIS MCD12Q1 land cover map.
In the present study, the 500-m MODIS MCD12Q1 land cover map from the period 2001 to 2010 was selected (Broxton et al., 2014) to get information about the vegetation types over China’s karst areas. The International Geosphere-Biosphere Programme (IGBP) scheme of vegetation classification was adopted. The MCD12Q1 land cover map was aggregated to the spatial resolution of 0.05° by the dominant class. Moreover, the IGBP vegetation classes were merged into four biomes (Figure 1b), namely, forests (covering 29.48 % of China’s karst areas), shrublands (covering 19.44 %), grasslands (covering 20.59 %), and croplands (covering 18.36 %) (other pixels with 12.13 % areas were filtered out). Forests include evergreen needleleaf forests, evergreen broadleaf forests, deciduous needleleaf forests, and mixed forests; shrublands include closed and open shrublands, woody savannas, and savannas; croplands include cropland/natural vegetation mosaics and croplands. Furthermore, pixels dominated by non-vegetation types (including permanent wetlands, urban and built-up lands, permanent snow and ice, barren, and water bodies) were filtered out.
GPP dataset
The GPP dataset was derived from the vegetation photosynthesis model (VPM) (Zhang et al., 2017). The VPM GPP was calculated using a light use efficiency (LUE) algorithms driving MODIS MYD11A2 land surface temperature, MCD12Q1 land cover map, MOD09A1 surface reflectance, and National Centers for Environmental Predication climate variables (Zhang et al., 2017). Yearly VPM GPP datasets from 2003 to 2018 at the 0.05° spatial resolution were used to explore the asymmetric response of GPP to the change in precipitation over China’s karst areas.
Precipitation dataset
The precipitation dataset was obtained from Climate Hazards Group InfraRed Precipitation with Station Data (CHIRPS) (Funk et al., 2015), which has shown good performance in drought monitoring. The CHIRPS V2.0 dataset offers daily and pentad precipitation at 0.05° resolution. Here, daily CHIRPS precipitation data were used and aggregated to yearly composites.
Asymmetry indices (AI)
The asymmetry indices were used to quantify the GPP asymmetry over China’s karst areas. AI was calculated as below (Bai et al., 2008):


where Var is the yearly GPP and precipitation value; max, min and AI represent the maximum, minimum, and average yearly values of these variables (i.e., GPP and precipitation), respectively; Relative pulse and Relative decline represent, respectively. the relative increase of GPP and precipitation in the wet years and the relative decrease of GPP and precipitation in the dry years.
AI is defined as the difference between the Relative pulse and Relative decline. AI > 0 represents positive asymmetry, indicating that the GPP or precipitation gains in the wet years overcompensates the GPP or precipitation losses in the dry years. AI < 0 represents negative asymmetry, indicating that GPP or precipitation gains cannot be compensated by the GPP or precipitation losses in the dry years. The 5-year running window and a linear regression method were selected to investigated the trends of the GPP asymmetry in China’s karst areas (Dong et al., 2023). Trends of GPP asymmetry with P < 0.05 were considered as a statistically significant (Chang et al., 2023).
Results
Spatial distributions of the GPP asymmetry over China’s karst areas
During the 2003 to 2018 period, the GPP showed a positive asymmetric response to precipitation changes over the China’s karst areas (Figure 2), indicating that the GPP gains in the wet years overcompensate the GPP losses in the dry years. In addition, the GPP asymmetry in China’s karst areas exhibited a strong spatial heterogeneity (Figure 2). Specifically, the positive GPP asymmetry (accounting for 51.34% of China’s karst areas) were mainly observed in Qinghai-Tibetan Plateau, Chongqing and Hubei provinces (Figure 2a). Negative GPP asymmetry (accounting for 48.66% of China’s karst areas) were mainly distributed in Yunnan, Guizhou, Guangxi, and Hunan provinces of Southwest China (Figure 2a). Moreover, the GPP asymmetry varies between Southern and Northern China (Figure 2b), with the AI values of GPP shifting from positive to negative at latitudes <30° N. More positive GPP asymmetries were found at latitudes >35° over Northern China.
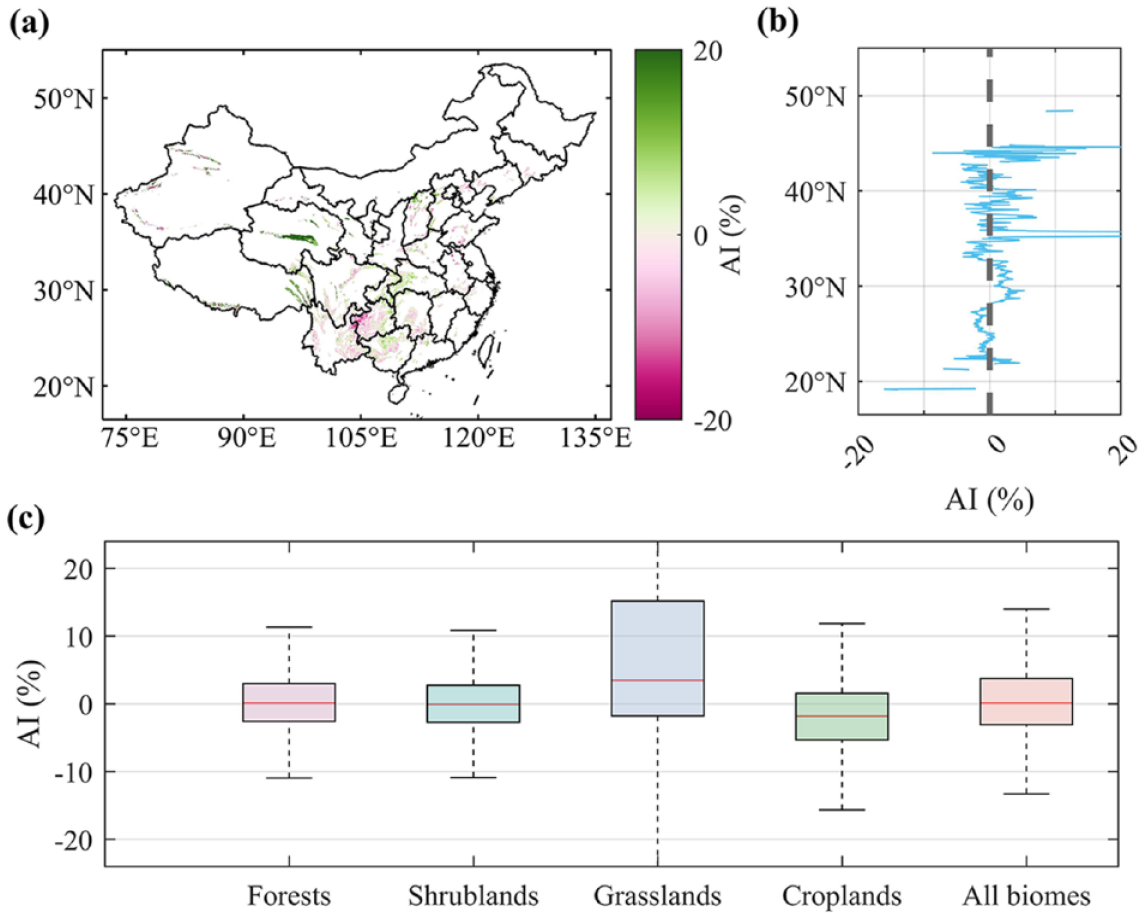
Asymmetric response of GPP to the change in precipitation over China’s karst areas during the 2003 to 2018 period. (a) Spatial patterns of GPP asymmetry over China’s karst areas. (b) Median values of GPP asymmetry along latitudes over China’s karst areas. (c) Box plot of the AI values for each biome. The error bar represents the standard deviation.
The GPP asymmetry varied among the four biomes (i.e., forests, shrublands, grasslands, and croplands), with positive GPP asymmetry observed in grasslands (3.50%) and forests (0.16%), while negative GPP asymmetry could be found over shrublands (−0.05%) as well as croplands (−1.81%) (Figure 2c). These results suggest that the decrease of GPP in grasslands and forests caused by drought are able to be overcompensated for by the increased precipitation during the wet years over China’s karst areas.
Temporal variations of the GPP asymmetry over China’s karst areas
The temporal variations of the vegetation productivity asymmetry during 2003 to 2018 were investigated (Figure 3), based on a five-year moving window. Spatially, 56.38% of the areas represented an upward trend (P < 0.05) for the GPP asymmetry over China’s karst areas, mainly distributed in Chongqing, Hubei, and Yunnan provinces (Figure 3a). Areas with decreasing trends, accounting for 43.62% of China’s karst areas, were mainly observed in Guizhou and Guangxi provinces (Figure 3a). These results suggest that the extent of increasing GPP asymmetry is larger than the extent of decreasing GPP asymmetry over the China’s karst areas.
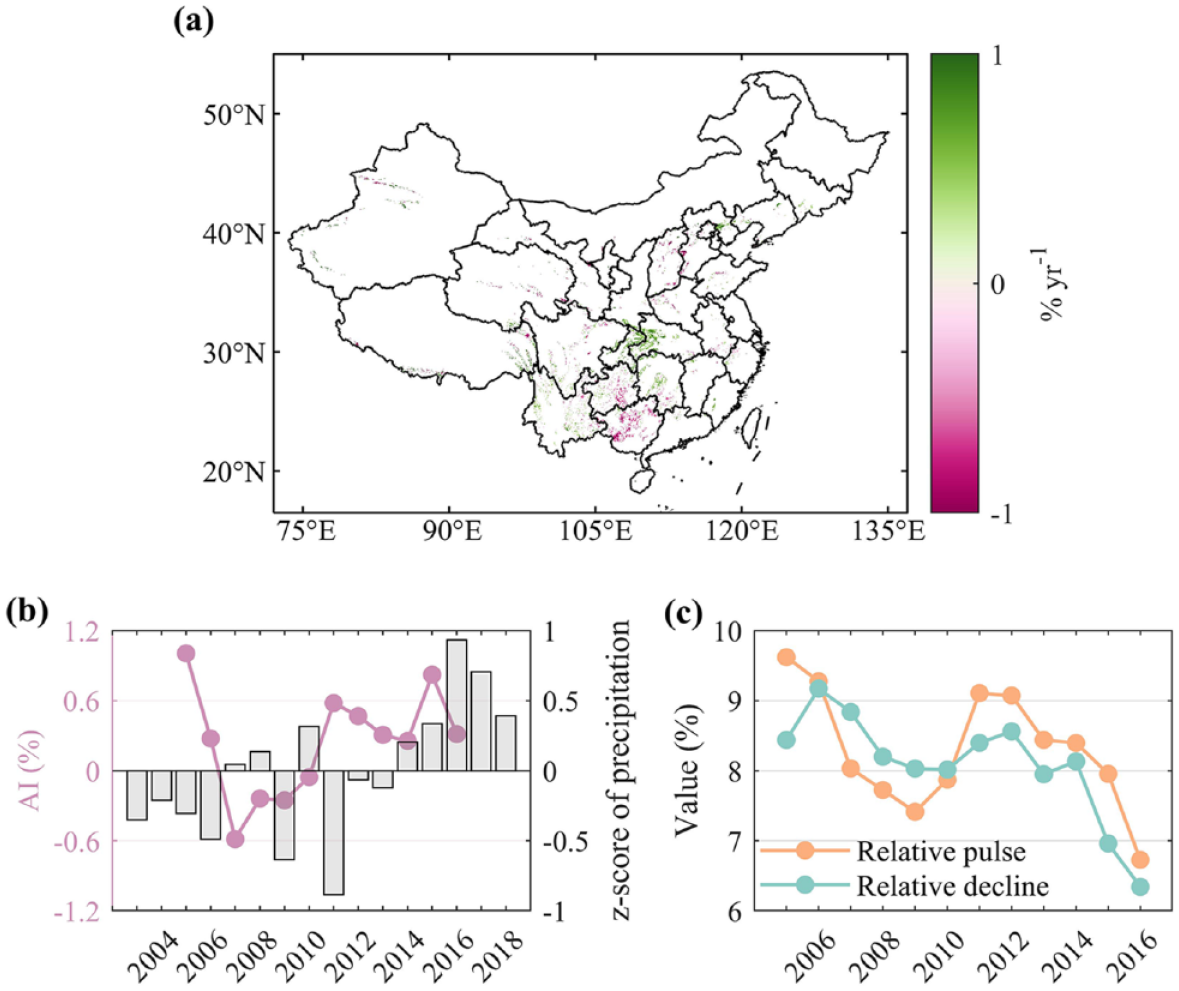
Trends of the GPP asymmetry over China’s karst areas during the 2003 to 2018 period. (a) Spatial pattern of GPP asymmetry trends over China’s karst areas, indicated by significantly positive (green) and negative (purple) trends (linear trend; P < 0.05). (b) Temporal variations of the GPP asymmetry over China’s karst areas. (c) Temporal variations of the relative GPP pulse and relative GPP decline over China’s karst areas.
Temporally, the GPP asymmetry showed an increasing trend (Slope = 0.03% yr−1, P > 0.05, Figure 3b) during the 2003 to 2018 over the karst areas. Negative precipitation anomalies prevailed during the 2003 to 2014 period, resulting in the GPP asymmetry shift from positive to negative in 2007 (Figure 3b). Subsequently, the AI values of GPP began to increase and shifted from negative to positive in 2011, despite the extreme drought events that occurred in 2009 and 2011 (Figure 3b). For a better understanding of the dynamics of GPP asymmetry over China’s karst areas, the temporal variations of relative GPP pulse/decline were investigated (Figure 3c). Generally, the relative GPP pulse and decline values showed a decreasing trend during 2003 to 2018, indicating that the effect of precipitation changes to GPP has decreased. The relative GPP pulse value was lower than the relative decline value during 2007 to 2010, resulting in a negative AI value of GPP during this period. As there was an improvement of climatic conditions, the relative GPP pulse values were constantly higher than the relative GPP decline values after 2010, despite them both showing a downward trend. The decreasing trend of relative GPP pulse (Slope = −0.11% yr-1, P > 0.05) was lower than the decreasing trend of relative GPP decline (Slope = 0.16% yr−1, P < 0.05). Consequently, the response of GPP to drought during the dry years has significantly decreased, leading to an increase in GPP asymmetry. The increasing trend of GPP asymmetry could be beneficial to the vegetation carbon sink over China’s karst areas.
For each biome (i.e., forests, shrublands, grasslands, and croplands), an upward trend of GPP asymmetry could be observed over forests biomes (Slope = 0.09% yr−1, P < 0.05, Figure 4a), grasslands biomes (Slope = 0.07% yr−1, P > 0.05, Figure 4c), as well as croplands biomes (Slope = 0.01% yr−1, P > 0.05, Figure 4d). Especially, the GPP asymmetry in forests biomes exhibited significant increasing trends over the study period (Figure 4a), owing to the increased relative GPP pulse value (Slope = 0.02% yr−1, P > 0.05, Figure 5a) and decreased relative GPP decline value (Slope = 0.11% yr−1, P > 0.05, Figure 5a). On the contrary, a decreasing trend of GPP asymmetry was found in shrublands (Slope = −0.08% yr−1, P > 0.05, Figure 4b). Note that the grasslands exhibited the earliest year to shift from negative GPP asymmetry to positive GPP asymmetry across the four biomes (i.e., forests in 2011, shrublands and croplands in 2010, grasslands in 2008), which is because the response of GPP to decreased precipitation in grasslands during the dry years has decreased during 2008 to 2014 (Figure 5c).
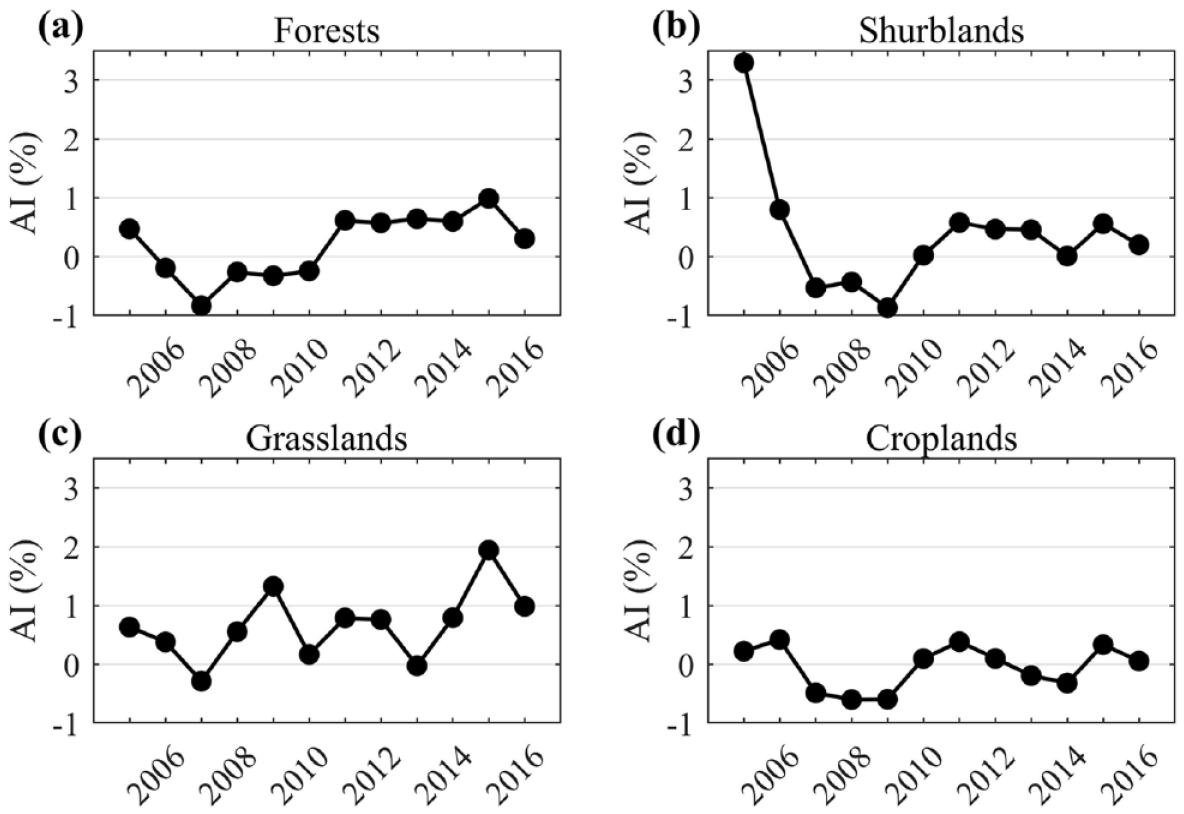
Temporal variations of the GPP asymmetry for each biome over China’s karst areas during the 2003 to 2018 period. (a) Forests. (b) Shrublands. (c) Grasslands. (d) Croplands.
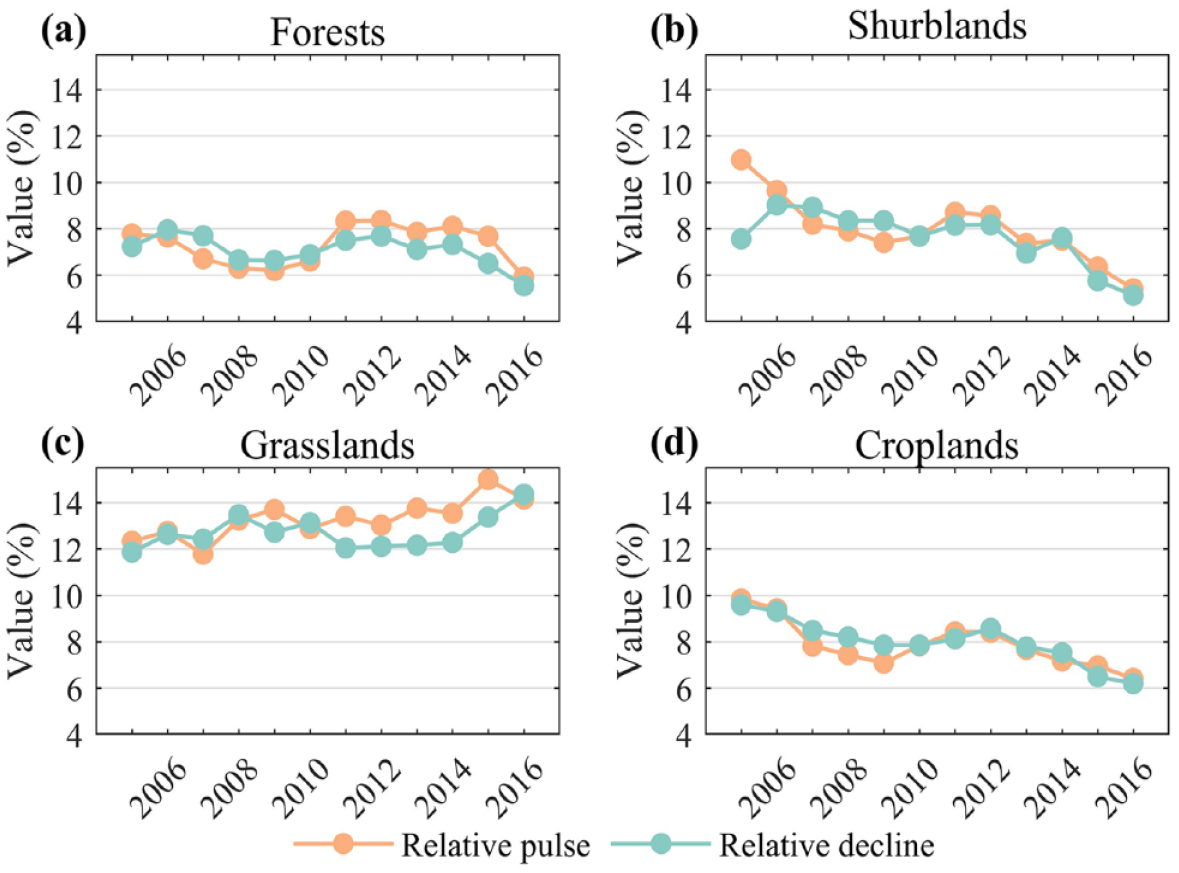
Temporal variations of the relative GPP pulse and relative GPP decline for each biome over the China’s karst areas during the 2003 to 2018 period. (a) Forests. (b) Shrublands. (c) Grasslands. (d) Croplands.
Sensitivity of GPP to precipitation changes over China’s karst areas
In order to better understand the asymmetric response of GPP to the change in precipitation, the relative precipitation pulse and relative precipitation decline values were calculated. In addition, the average pulse and decline of GPP and the average pulse and decline of precipitation were grouped within four biomes (i.e., forests, shrublands, grasslands, and croplands) (Figure 6). The relative GPP pulse/decline values decreased with the relative precipitation pulse/decline values (Figure 6). Grasslands were the most responsive to the change in precipitation, indicated by the highest relative GPP pulse (31.27%, Figure 6a) and decline value (27.34%, Figure 6b), while forests exhibited the lowest relative GPP pulse (12.51%, Figure 6a) and decline value (12.04%, Figure 6b). These results indicate that the grasslands have a higher sensitivity to precipitation changes relative to other biomes (i.e., shrublands, grasslands, and forests).
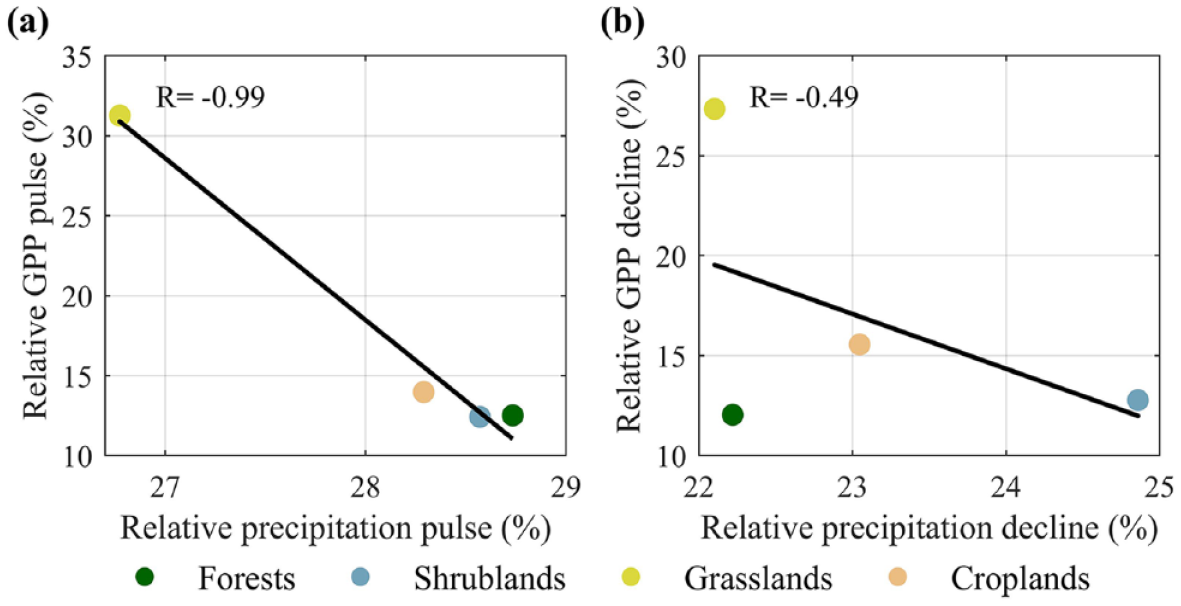
Sensitivity of the GPP to precipitation changes for each biome over China’s karst areas. (a) The relationship between relative GPP pulse and relative precipitation pulse. (b) The relationship between relative GPP decline and relative precipitation decline.
Influencing factors for the GPP asymmetry over China’s karst areas
To explore the influencing factors of the GPP asymmetry, the precipitation asymmetry and its trends were investigated (Figure 7). Wetter conditions during 2003 to 2018, indicated by the positive AI value of precipitation, was found in Northern Guangxi, Hubei, Guizhou, and most parts of North China (Figure 7a). By contrast, dryer conditions during 2003 to 2018, indicated by the negative AI value of precipitation, could be found in Sichuan, Chongqing, and Yunnan provinces of Southwest China (Figure 7a). The spatial pattern of precipitation asymmetry was generally consistent with that of GPP asymmetry, except in the Chongqing, Sichuan, Guizhou, and Yunan provinces. The trends of precipitation asymmetry were also similar to the trends of GPP asymmetry (Figure 7b), suggesting that the precipitation asymmetry is a key influencing factor for the patterns of GPP asymmetry.
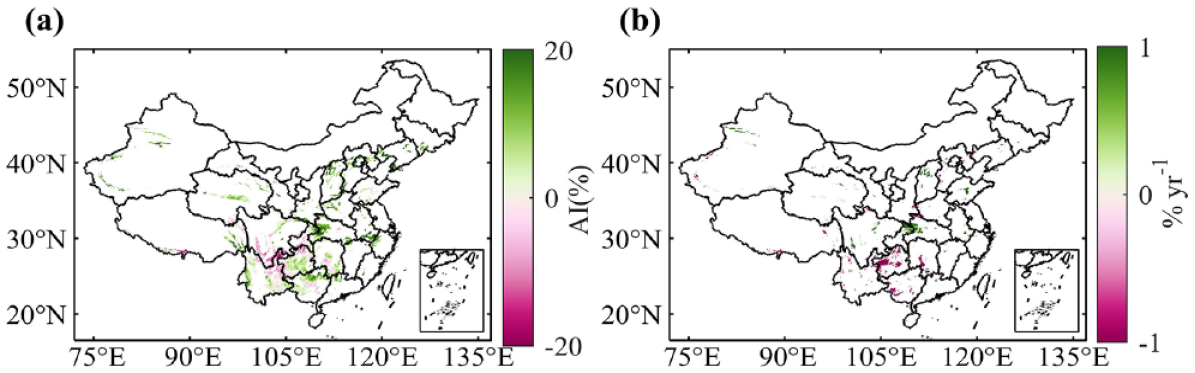
Precipitation asymmetry and its trends over China’s karst areas during the 2003 to 2018 period. (a) Spatial patterns of precipitation asymmetry over the karst areas. (b) Spatial pattern of precipitation asymmetry trends over the karst areas, indicated by significantly positive (green) and negative (purple) trends (linear trend; P < 0.05).
The relationship between GPP asymmetry and mean annual precipitation was investigated (Figure 8a–b). The GPP asymmetry decreased with increasing mean annual precipitation, and approached symmetry (i.e., AI values closed to zero) in areas with mean annual precipitation > 600 mm (Figure 8a). Similarly, the relative GPP pulses and declines showed a decreasing trend with increasing mean annual precipitation (Figure 8b), indicating that GPP asymmetry is the function of mean annual precipitation: positive AI is found in water-limited areas (i.e., mean annual precipitation < 600 mm), whereas neutral AI is found in relatively humid areas (i.e., mean annual precipitation > 600 mm).
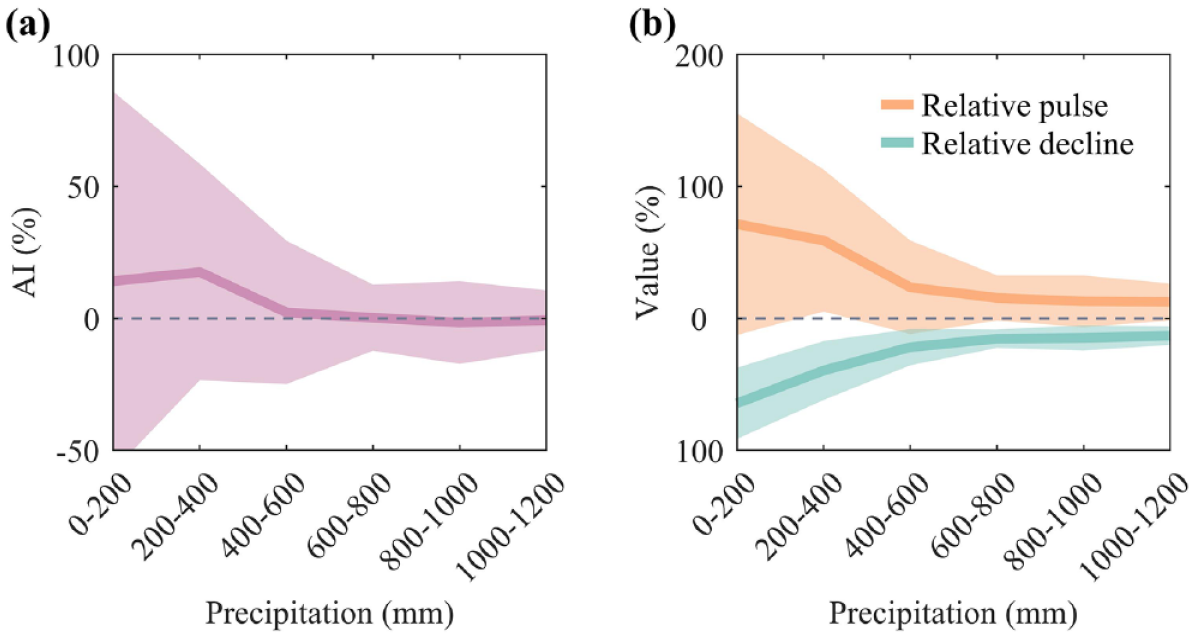
Influencing factors for the GPP asymmetry over China’s karst areas. (a–b) Showing the influence of mean annual precipitation on GPP asymmetry and relative GPP pulse/decline, respectively.
Discussion
Our results showed a positive GPP asymmetry over China’s karst areas during the 2003 to 2018 period, indicating that the GPP gains caused by increased precipitation in the wet years overcompensates for the reduction of GPP caused by decreased precipitation in the dry years. Our estimated positive GPP asymmetry is consistent with the positive asymmetry observed in the whole of China (Chang et al., 2023). In addition, the GPP asymmetry of croplands in China’s karst areas are lower than that in the whole of China, which is because the ecological restoration project transformed a large amount of croplands into forests and shrublands (Yue et al., 2020), leading to a decrease in cropland GPP. Furthermore, a negative GPP asymmetry was found over Southwest China (Dong et al., 2023), which is different from our results. This is because the negative asymmetry found by Dong et al. (2023) also considered the non-karst areas of Southwest China. Therefore, the positive GPP asymmetry over the karst areas suggests that the karst ecosystem has a strong capacity for carbon sequestration.
Our results showed that the grasslands represent the highest positive AI, indicating that the grassland areas dominate the positive asymmetry over China’s karst areas during the 2003 to 2018 period. These findings support the positive asymmetry observed in grasslands of China, using satellite observations (Chang et al., 2023; John et al., 2013; Zhao et al., 2022), as well as long-term multiple grassland sites (Bai et al., 2008; Yang et al., 2008). Grasslands have high growth potential without under water stress (Al-Yaari et al., 2020; Chang et al., 2023), leading to a disproportionate GPP increase during the wet years. Although grasslands with low resistance may wither or die during the dry years (Luo et al., 2023), they tend to re-emerge quickly and recovery their productivity after a drought (Stampfli et al., 2018). Similar positive GPP asymmetry was found in forest biomes, owing to their high resistance to droughts (Esteban et al., 2021; Li et al., 2019; Stuart-Haentjens et al., 2018).
However, when the magnitude of precipitation changes extends from nominal to extreme, positive GPP asymmetry may decrease or even shift to negative GPP asymmetry (Knapp et al., 2017; Wang et al., 2022) over the karst areas. Extreme drought events occur frequently in China’s karst areas, especially in the Southwest. Recent studies have shown that the extreme drought events in 2009 and 2011 in Southwest China led to vegetation mortality (Li et al., 2019) and the decrease of vegetation productivity (Zhang et al., 2012). These extreme drought events make GPP asymmetry switch from positive to negative over the study period. Interestingly, the long-term trends of GPP asymmetry in China’s karst areas were positive over the study period, which is beneficial to the karst ecosystem carbon sink. This may be due to the implementation of the ecological projects in the karst areas, which improved the conditions of vegetation growth and decreased the effect of drought on GPP during the dry years in this region (Yue et al., 2022). In particular, the expansion of forest areas in recent decades, caused by afforestation activities (Lu et al., 2018), could have contributed to an increase of GPP asymmetry in forest biomes.
The results found that precipitation asymmetry was an important factor in influencing the spatial-temporal patterns of GPP asymmetry. However, the opposite spatial pattern was found in parts of Southwest China’s karst areas, namely, a positive precipitation asymmetry and a negative GPP asymmetry could be found in these regions. This is because the Southwest China karst areas are humid regions (Dong et al., 2023), vegetation in these regions is usually more limited by solar radiation and growing season temperature than by precipitation (Zhao et al., 2022). During the wet years, the lower solar radiation and growing season temperature linked to the prolonged rainy season can constrain the vegetation photosynthesis and productivity over the humid regions (Walther et al., 2019). As a result, in areas that exhibit a wetter condition (i.e., positive precipitation asymmetry), decreased radiation and temperatures caused by less sunny days will reduce the GPP (Knapp et al., 2015), leading to a negative asymmetric response of GPP to precipitation changes. Similarly, relatively drier conditions will promote an increase in GPP over Southwest China (e.g., Chongqing and Sichuan provinces, characterized by a negative precipitation asymmetry), showing positive GPP asymmetry. Similar results could be found in the humid regions of Northeast China Transect (Zhao et al., 2022).
Our study has some limitations and uncertainties. For example, a series of ecological projects (such as afforestation) have been implemented over China’s karst areas, which could increase the GPP and the GPP asymmetry. However, our study did not analyze the effect of afforestation on GPP asymmetry. Further study should use afforestation data and ground survey data to analyze its effect on GPP asymmetry. In addition, several agricultural management techniques in croplands, like irrigation measures, can alleviate the negative effect of drought in dry years to some extent (Li et al., 2019). Also, advances in biotechnology and breeding have continuously improved the drought resistance of crop species (Gupta et al., 2020), resulting in cropland productivity being less sensitive to negative precipitation anomalies. These issues may lead to an inaccurate calculation of GPP asymmetry in croplands.
Although severe drought may pose a threat to the GPP asymmetry in China’s karst areas, our study did not consider how the intensity of the drought might impact on the GPP asymmetry. For example, Wang et al. (2022) reported that the GPP asymmetry could decrease at a global scale, and shift from positive GPP asymmetry to negative GPP asymmetry as the magnitude of precipitation changes from nominal to extreme. Negative GPP asymmetry could be more obvious in areas with higher intensity of extreme drought events. In addition, the effect of rising CO2 concentration (Piao et al., 2019), nitrogen deposition (Piao et al., 2015), and species diversity (Liu et al., 2022) on the GPP asymmetry were not assessed, due to the limited study period. Further study should be use multiple factors and dynamic vegetation models to explore the drivers of GPP asymmetry. Furthermore, the karst areas are mainly distributed in Southwest China, characterized by frequent rainy days and cloudy conditions, which may have an impact on the accuracy of optical remote sensing datasets (e.g., VPM GPP and CHIRPS precipitation dataset) in this region. Simultaneously, the VPM GPP may underestimate the GPP values in some forest biomes, such as evergreen broadleaf forests and evergreen needle leaf forests. These may introduce uncertainties in the assessment of vegetation productivity asymmetry over the karst areas. More accurate vegetation dataset or passive microwave remote sensing dataset (e.g. L-band vegetation optical depth) should be used for further study in this direction.
Conclusion
Here, we assessed the asymmetry of GPP in response to the change in precipitation over China’s karst areas during the 2003 to 2018 period. Overall, a positive asymmetry was found over the karst areas during this time, indicating that the GPP gains caused by increased precipitation during the wet years overcompensates for the GPP losses caused by decreased precipitation during the dry years. In addition, the GPP asymmetry exhibited an increasing trend over the study period, despite the extreme drought events that occurred frequently. This is partly due to a series of ecological restoration and conversation projects conducted over China’s karst areas, significantly improving the local environment of vegetation growth and decreasing the effect of drought on GPP during the dry years. The GPP asymmetry differs among the four biomes (i.e., forests, shrublands, grasslands, and croplands), with grasslands showing the highest positive GPP asymmetry and relative GPP pulse/decline values, indicating that the grasslands are more sensitive to the increased precipitation than other biomes. The spatial patterns of precipitation asymmetry were consistent with that of GPP asymmetry, suggesting that precipitation asymmetry can be considered as a key influencing factor of the GPP asymmetry over China’s karst areas. Furthermore, biomes in areas with mean annual precipitation < 600 mm are more likely to exhibit a positive GPP asymmetry in response to precipitation changes. Future studies should be extended to other karst regions to comprehensively assess the asymmetry of karst ecosystem productivity to precipitation changes.
Footnotes
Declaration of conflicting interests
The author(s) declared no potential conflicts of interest with respect to the research, authorship, and/or publication of this article.
Funding
The author(s) disclosed receipt of the following financial support for the research, authorship, and/or publication of this article: This study is supported in part by research grants from the National Natural Science Foundation of China (Grant No. 42171339,41830648), the Fundamental Research Funds for the Central Universities (SWU020016), and the Graduate Scientific Research and Innovation Foundation of Southwest University (SWUS23068).