
Abstract
Urban problems such as environmental pollution and extreme weather events caused by accelerated urbanization have further caused public health crises, so the healthy city becomes an inevitable goal for sustainable development. Studies have confirmed that health performance at block scale greatly affects the health quality of urban settlements, and human factors data is more intuitive and accurate at detecting it. Current studies mostly focus on cities with hot or mild climates, while winter cities suffer greater health impact because of the larger proportion of cold climate they deal with throughout the year, so the need to improve their health performance is more urgent. Accordingly, this study takes Harbin, a typical winter city, as an example, to track sample block experiencers’ physiological stress response in cold climate with an E4 wristband to quantify health performance, then construct an “urban block space–health performance” assessment frame through the MOS and propose a suitable optimization strategy. The research shows that the block sample health performance in cold climate is related to spatial type and crowd structure and highlights people’s concern for walking safety, thermal comfort, and transportation convenience in urban blocks. Meanwhile, an optimization strategy based on the assessment frame can enrich optimization perspectives and provide a scientific basis for the practice of health performance.
Introduction
While the high-speed industrialization development mode has greatly improved the operational efficiency of regions and cities, it has also caused frequent environmental pollution, extreme climate, public health and safety incidents. Therefore, health problems of human habitation have attracted more and more attention (Zhang, 2015). With the World Health Organization defining the concept of “healthy city” and its global action strategic positioning, public health has become a vital guideline for urban construction (Croucher et al., 2007). As the main physical space of human activities, the urban built-up environment deeply affects public health. However, due to its rich historical and cultural background and constituent elements, and diverse types of urban life, its specific impact mechanism on public health is difficult to quantify and has strong regionality (Handy et al., 2002). Since 1980s, the threat of “space-related diseases” to people’s health has been increasing day by day, and the spatial causes of chronic diseases such as respiratory diseases, obesity, heart disease and mental health have attracted much academic attention (Lathey et al., 2009). Although their direct causal relationship with the urban built-up environment has not been clearly confirmed, the latter has been recognized as a collection of important external integrated elements affecting human health (Wang et al., 2016).
Urban block is a vital level in urban built-up environment and the basic environmental support of urban architectural design (Han et al., 2020). Existing research and practice show that the refined and friendly construction of block scale space can accelerate the improvement of public health quality and efficiency including controlling block microclimate to improve residents’ ability to prevent and control sudden fatal risks, chronic non-communicable diseases, infectious diseases and mental diseases (Liu et al., 2023); optimizing the practicality of public spaces in blocks especially pedestrian spaces, which strengthens physical and psychological resilience (Fu Yushu, 2021); enhancing the openness, communication and interactivity of green space in blocks to optimize the overall level and resilience of public health by safeguarding the space use power of vulnerable groups (Yang and Qi, 2020).
Since the middle and late 20th century, urban research worldwide has paid more attention to users’ physical and mental needs for the environment (Zhang, 2020), and environmental perception evaluation is the main index to measure the vitality of public space (Zhang et al., 2025). In the early stage, aesthetic pleasure is the core, and it is obtained through subjective description methods such as questionnaire and visual evaluation (Shafer and Brush, 1977) as well as data analysis methods such as analysis of variance and linear regression analysis (Burton, 1968; Chen et al., 2017). Furthermore, urban landscape image design regards people themselves as environmental sensors, and captures the temporal and spatial behavior characteristics of people and specific individuals through photos and other data to explore social emotional cognition, so as to realize the internal relationship mining and refined measurement of individual activity laws and urban space vitality (Lan et al., 2021; Shen et al., 2022). With the development of wearable sensing technology and biological signal data analysis technology, the physiological signal quantification technology of wearable sensors can avoid the possible “sensory threshold” error of subjective evaluation data (Zhu et al., 2023), which improves the discriminative validity and convergence validity of the built environmental emotional experience observation index system, makes dynamic environmental assessment possible, and provides new ideas and methods for human factors and environment research, promoting urban environment design that is better in line with people’s cognitive and emotional needs. However, the current research often aims at improving urban economic performance (Li et al., 2023) and urban green space optimization (Bauman et al., 2012). The selected urban samples are mainly economically developed cities and southern cities at home and abroad, which are dominated by hot (Yunitsyna and Shtepani, 2023) and mild climates (Chen, 2018). Therefore, the corresponding performance mechanism analysis and spatial optimal utilization model may not have the universality of seasonal characteristics, and the related research on cold climate in cold regions needs to be carried out urgently.
Based on the above background, this study takes Harbin, a typical winter city, as an example, and measures and optimizes the environmental health performance of blocks in cold climate in a winter city based on multi-modal human factors data. It expands the previous research in two aspects. (1) From the perspective of research methods, by quantifying the impact of different urban block environmental spaces on users’ health performance, it identifies the important nodes that cause health performance impacts in the urban block environment, and provides various feasible paths and reliable technical support for the study of the impact mechanism of urban block environmental performance. (2) From the perspective of research content, it provides objective basis for constructing the built environment optimization model of cold blocks and optimization of unbuilt environments, and realizing the environmental optimization design of urban blocks, and enriching the optimization perspective and providing a practical basis for the optimization practice of cold urban blocks such as Harbin.
Data and methods
Research framework
Based on the characteristics of urban blocks in cold climates and the experimental needs of human factors data, this study proposes a research framework covering a series of processes including “analysis of environmental characteristics of cold urban blocks-tracking of physiological stress response-construction of ‘urban block space–health performance’ evaluation frame-optimization analysis of block space in cold climate of winter cities” (Figure 1). Firstly, analyze the environmental characteristics of urban blocks in cold climates, divide the environmental types of Harbin urban blocks, and select the sample blocks. Secondly, track the physiological stress response of sample block users, quantify the health performance of cold climate block space, and construct the evaluation frame of “urban block space–health performance”. Finally, this study proposes the optimization strategy of urban blocks in cold climate.
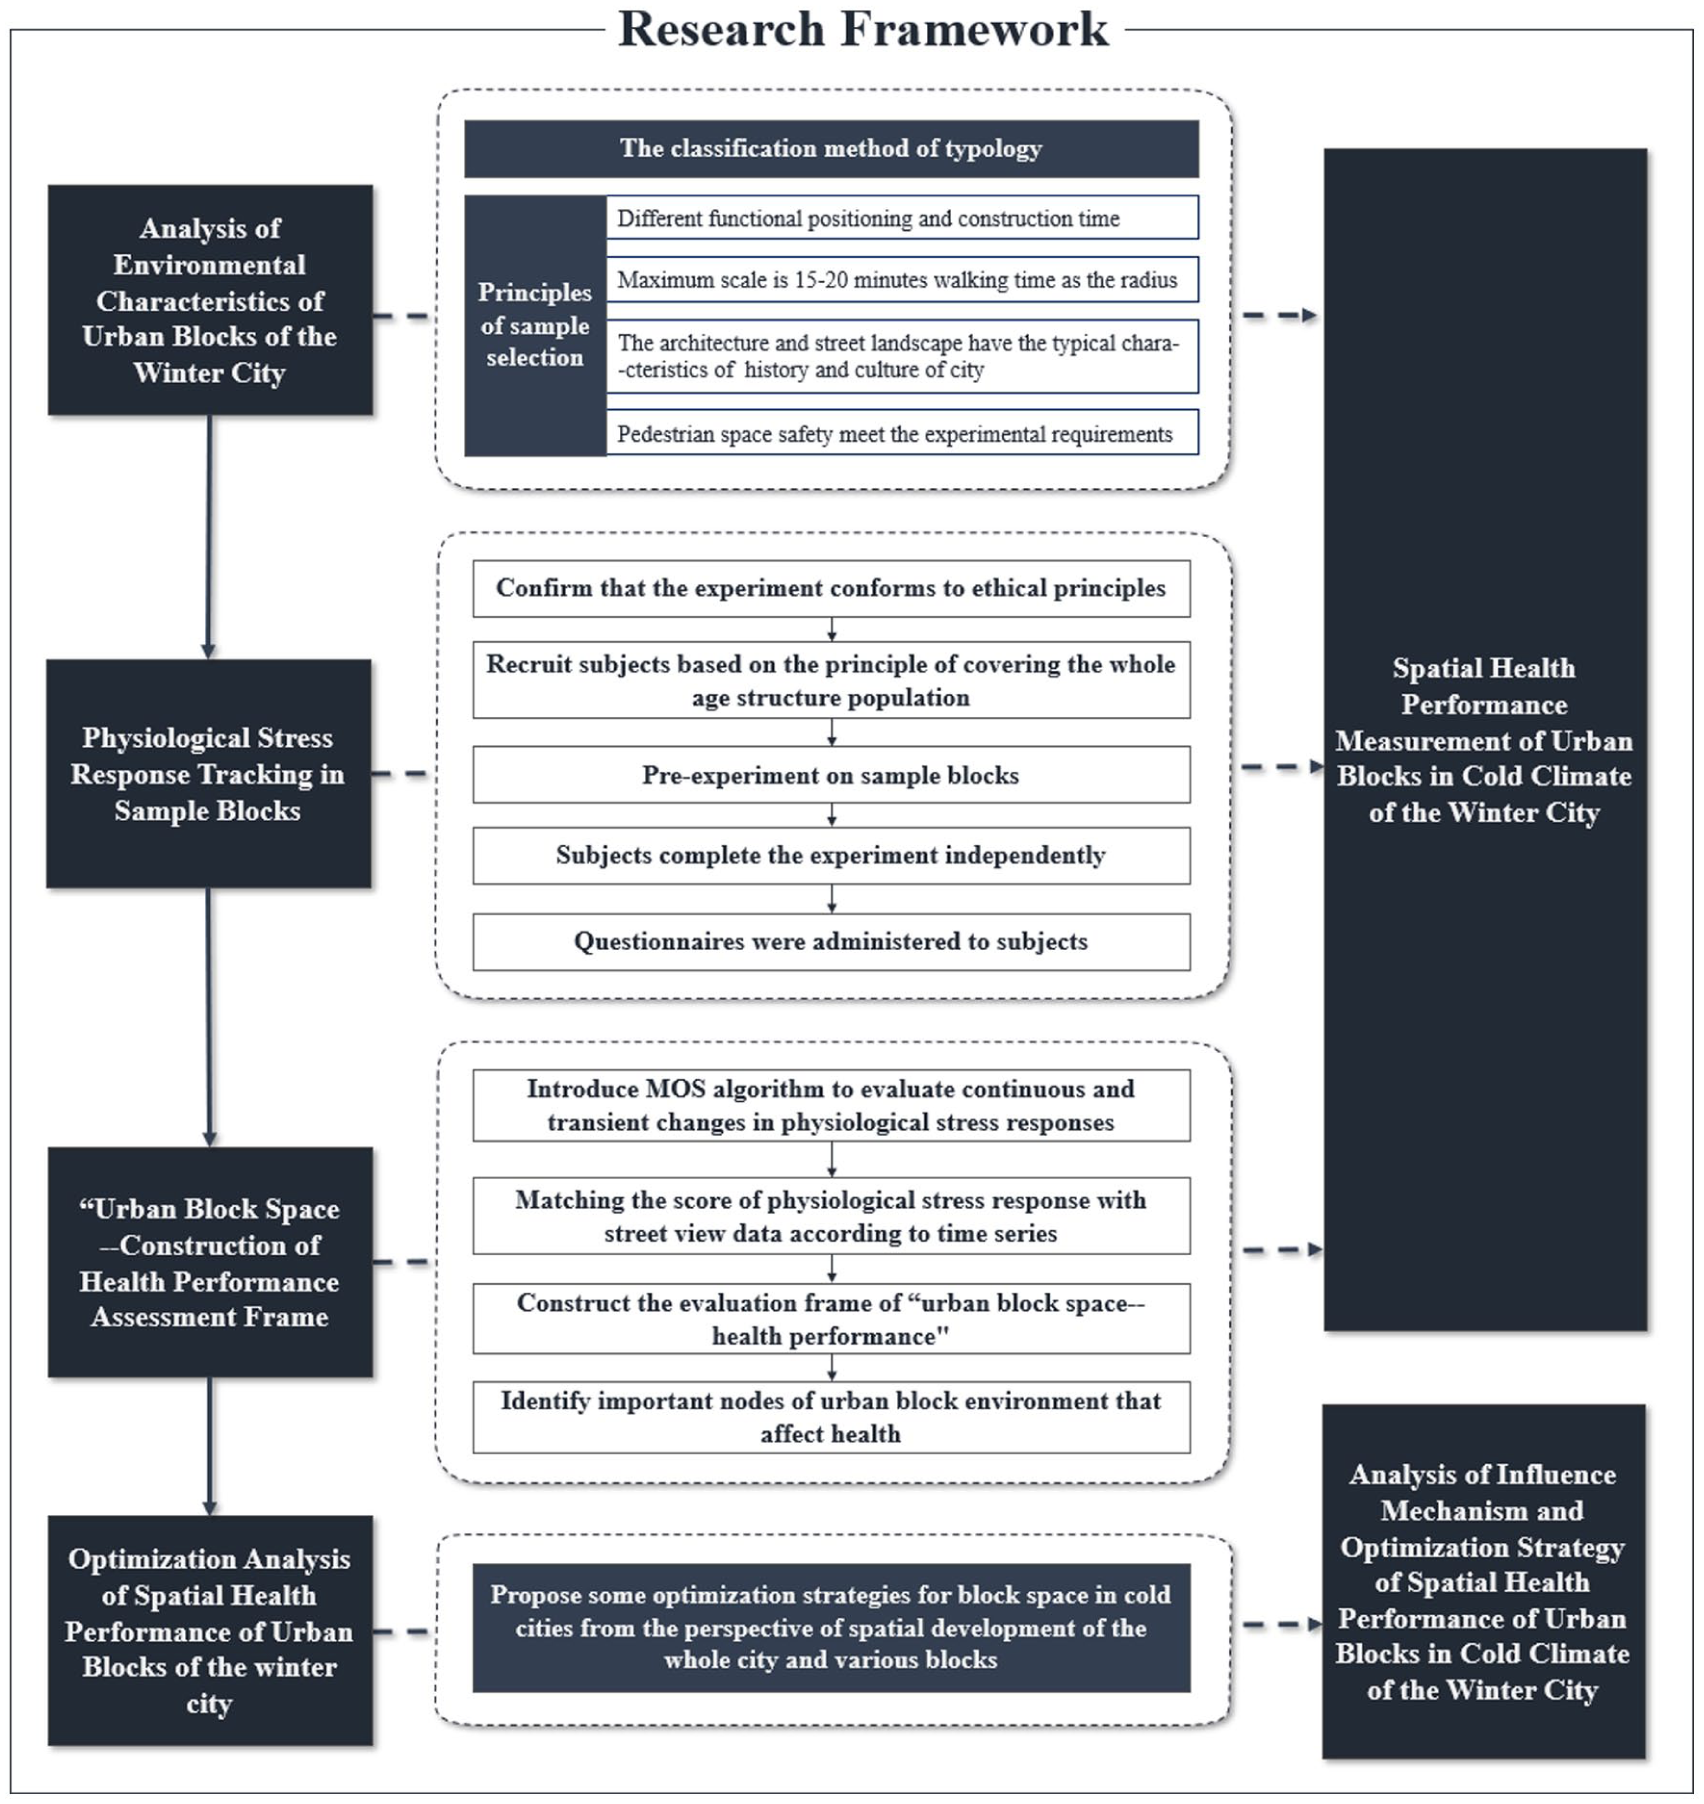
Research framework.
Study area
Basic overview of the study area
This study selects the urban blocks of Harbin, Heilongjiang Province, China (125°42′~130°10′ E, 44°04′~46°40′ N) as the study area. Harbin is the political, economic, and cultural center of northern northeast China, with short summers and cool climate, and long winters and cold climate. The highest and lowest temperatures in 2023 were 33.10 °C and −29.90 °C respectively (Figure 2). No matter what the latitude of geographical location or the annual temperature, Harbin is a typical winter city. In this study, the study period is selected as the cold climate day in this city (the daily average temperature is lower than 10 °C for five consecutive days as the definition standard), and the research samples are selected as different types of blocks in the city, which provides a reference for the study of spatial health performance of urban blocks of winter cities.
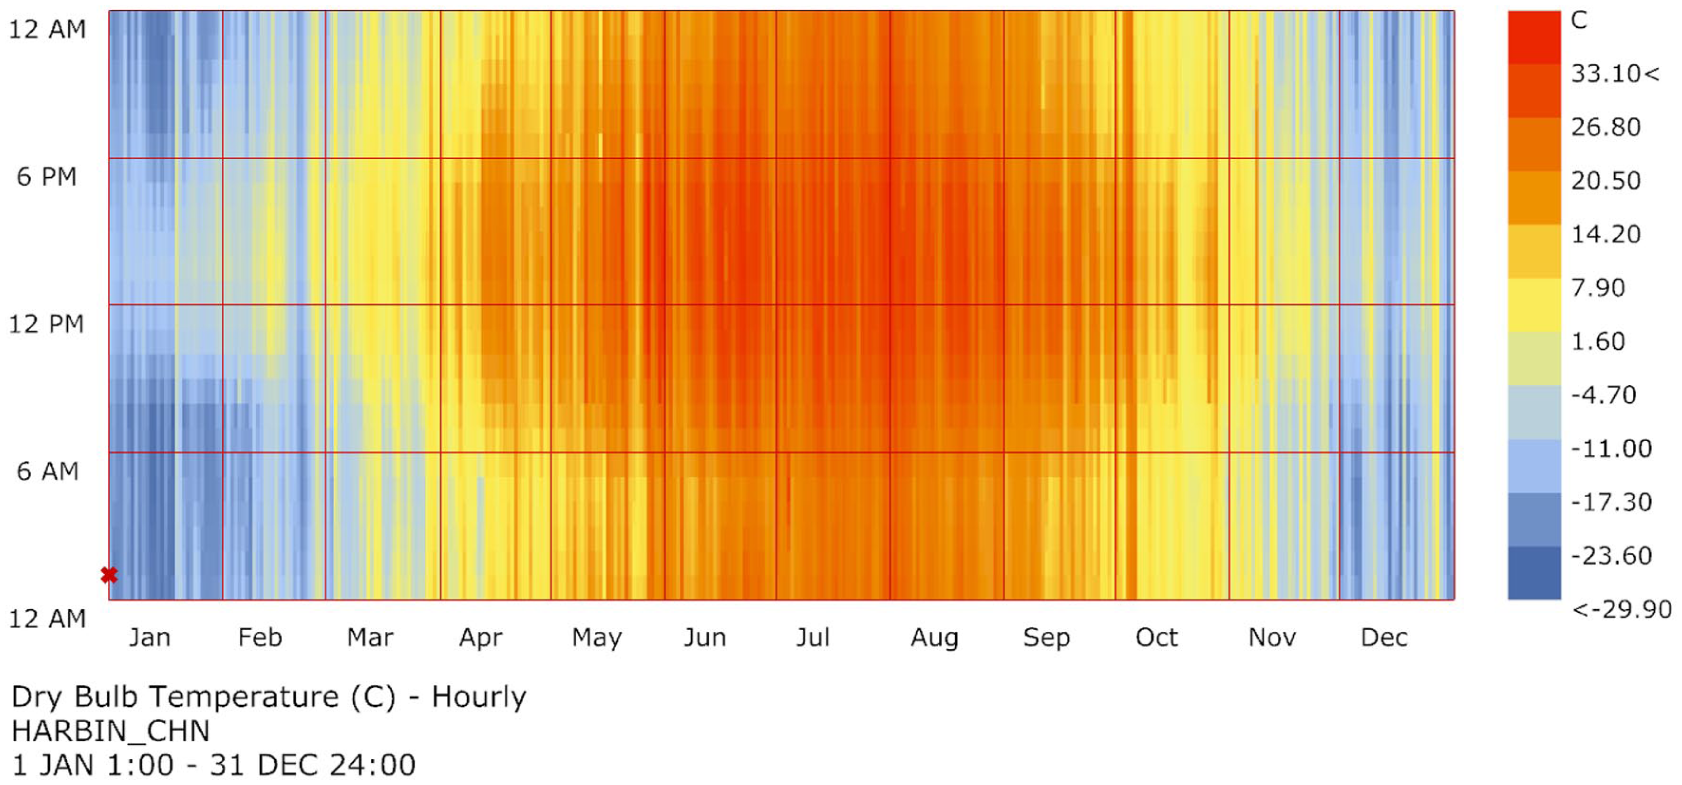
Annual hourly average temperature in Harbin in 2023.
Selection of sample urban blocks
As a city rich in natural geographical characteristics and historical and cultural characteristics, Harbin’s urban block development mainly has the following two characteristics. (1) From the vertical perspective of urban block organization structure, natural and historical environment jointly affect the spatial development of urban blocks, which is mainly manifested in the fact that natural terrain, especially the water system, has a great influence on the direction of urban development, and the cross-shaped road connecting the Middle East railway line station is the main artery of Harbin’s urban development. (2) From the horizontal perspective of the morphological characteristics of urban blocks, the urban block has the characteristics of diversified style and historical development, and has high historical and cultural value, artistic aesthetic value, economic value, and space use value. Therefore, the study adopts the classification method of typology, classifies Harbin urban blocks according to their functions, constituent elements, and location factors, classifies Harbin blocks into types, selects typical samples from each urban block type, and extracts the corresponding typical characteristics of block environmental space.
Principles of sample selection of urban blocks in cold climate
The following principles were adopted for urban block sample selection to improve the typicality and coverage of the study:
(1) The functional positioning and construction time of the block samples should be different;
(2) The maximum scale of the block samples is 15–20 minutes’ walking time as the radius;
(3) The architecture and street landscape of the block samples should have the typical characteristics of Harbin’s history and culture, reflecting different urban features;
(4) The safety of pedestrian space in the block samples should meet the experimental requirements.
The block samples of urban blocks in cold climate
In order to cover the needs of different types of blocks in Harbin as much as possible, and provide planning and construction reference for the planning and construction of various blocks in winter cities, this study plans to select the communities around Harbin Cigarette Factory (old block), Jianshe Street blocks (commercial block), the streets around Central Street subway station (traffic station block), Stalin Park (park block), and Jiangbei University Town (newly built block) as typical samples.
(1) Old blocks: communities around Harbin Cigarette Factory: The communities around of Harbin Cigarette Factory are located near Dongdazhi Street, Nangang district, Harbin (Figure 3). The residential building was built earlier, the internal environment of the community is dirty, the public facilities are old, the living service facilities are lacking, and the demand for heating, parking space and management, activity places (including outdoor activity venues and concentrated activity rooms), community medical, and property management are difficult to meet. It is a typical old community in Harbin. The outdoor safety hazards of this community are particularly obvious in winter, but the density of residents is high. Therefore, this block is selected as research sample 1.
(2) Commercial block: Jianshe Street: Jianshe Street is located between Gogol Street and Museum Square, starting from the Railway Hospital (the Fourth Hospital of Medical University) in the north and reaching Majiagou River in the south (Figure 4). The street was formed at the end of 1899 and is one of the earliest streets in Harbin. After years of changes, it has become one of the central business districts of Nangang district. Jianshe Street is an important transportation hub, with developed traffic. There are many shopping centers nearby, which means it is not only a working area, but also a main visiting area for pedestrians. The daily flow of people is large, and it is a typical commercial block. Therefore, this block is selected as research sample 2.
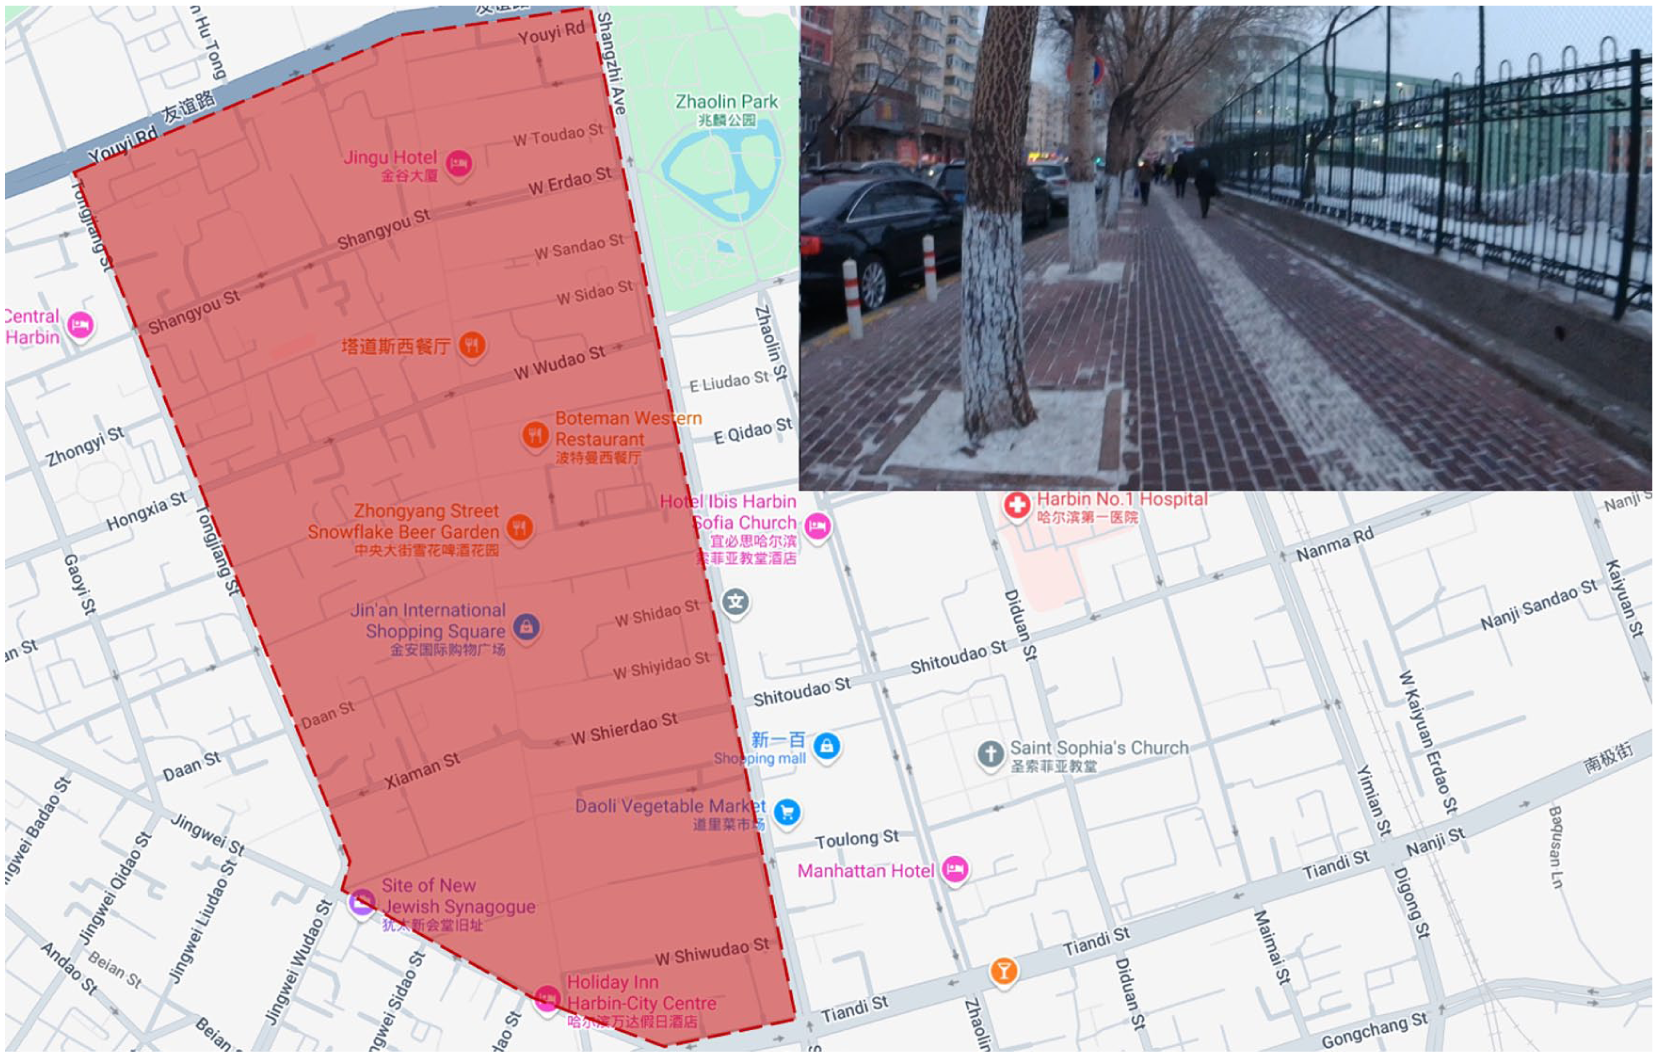
(3) Traffic station block: the streets around Central Street subway station: Central Street is located in Daoli District, Harbin (Figure 5). It was founded in 1898, with a total length of 1,450 meters and an area of about 1 square kilometer. The area is bounded by Tongjiang Street in the west, Shangzhi Street in the east, Songhua River in the north, and Jingwei Street in the south. The urban block brings together 65 historic buildings (all historically preserved buildings) in Western architectural styles such as Renaissance, Baroque, Eclecticism, Art Nouveau, and Classicism. As a characteristic street in Harbin, Central Street has a long history, unique characteristics, convenient transportation, numerous shops, and large tourist flow. Therefore, this block is selected as research sample 3.
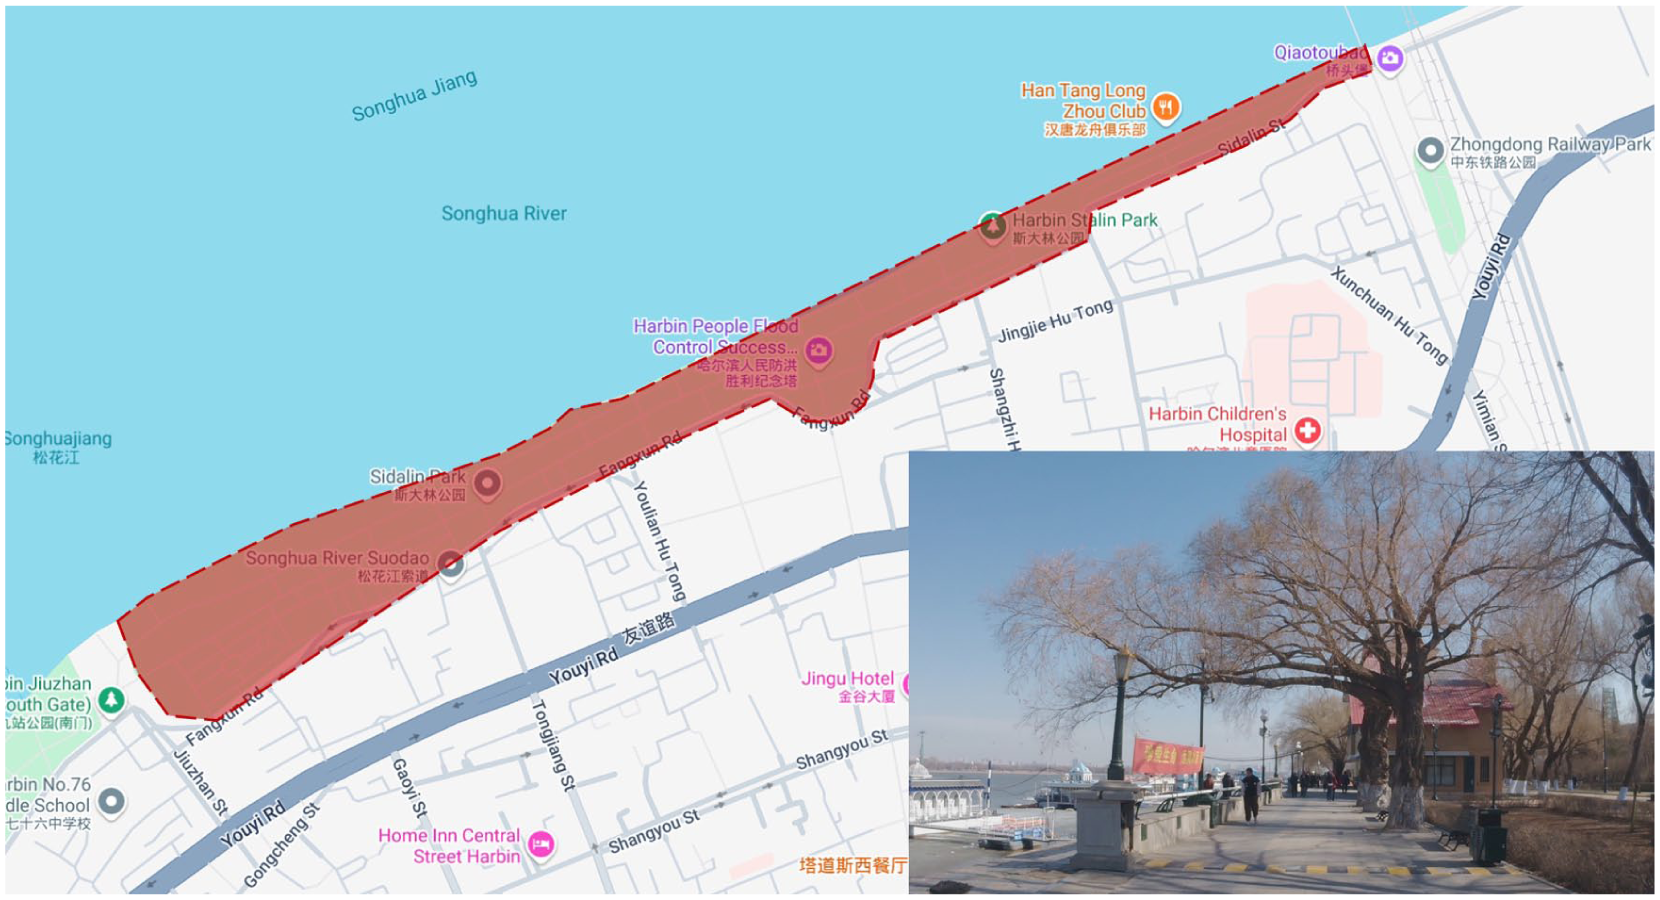
(4) Park Block: Stalin Park: Stalin Park is one of the summer tourist destinations along the Songhua River. It is located in Daoli District, Harbin City, Heilongjiang Province, across the river from Sun Island (Figure 6). Built in 1953, formerly known as “Riverside Park”, it was established to commemorate the victory of Harbin people over two catastrophic floods. With a total length of 1,750 meters, it is a belt-shaped open park built along the embankment and near the water, covering an area of 105,000 square meters. The park is centered on the flood control memorial tower, tree-lined, beautiful environment, spacious roads, dense crowds, and standing near the water. It is a typical waterfront park block in Harbin, which is selected as research sample 4.
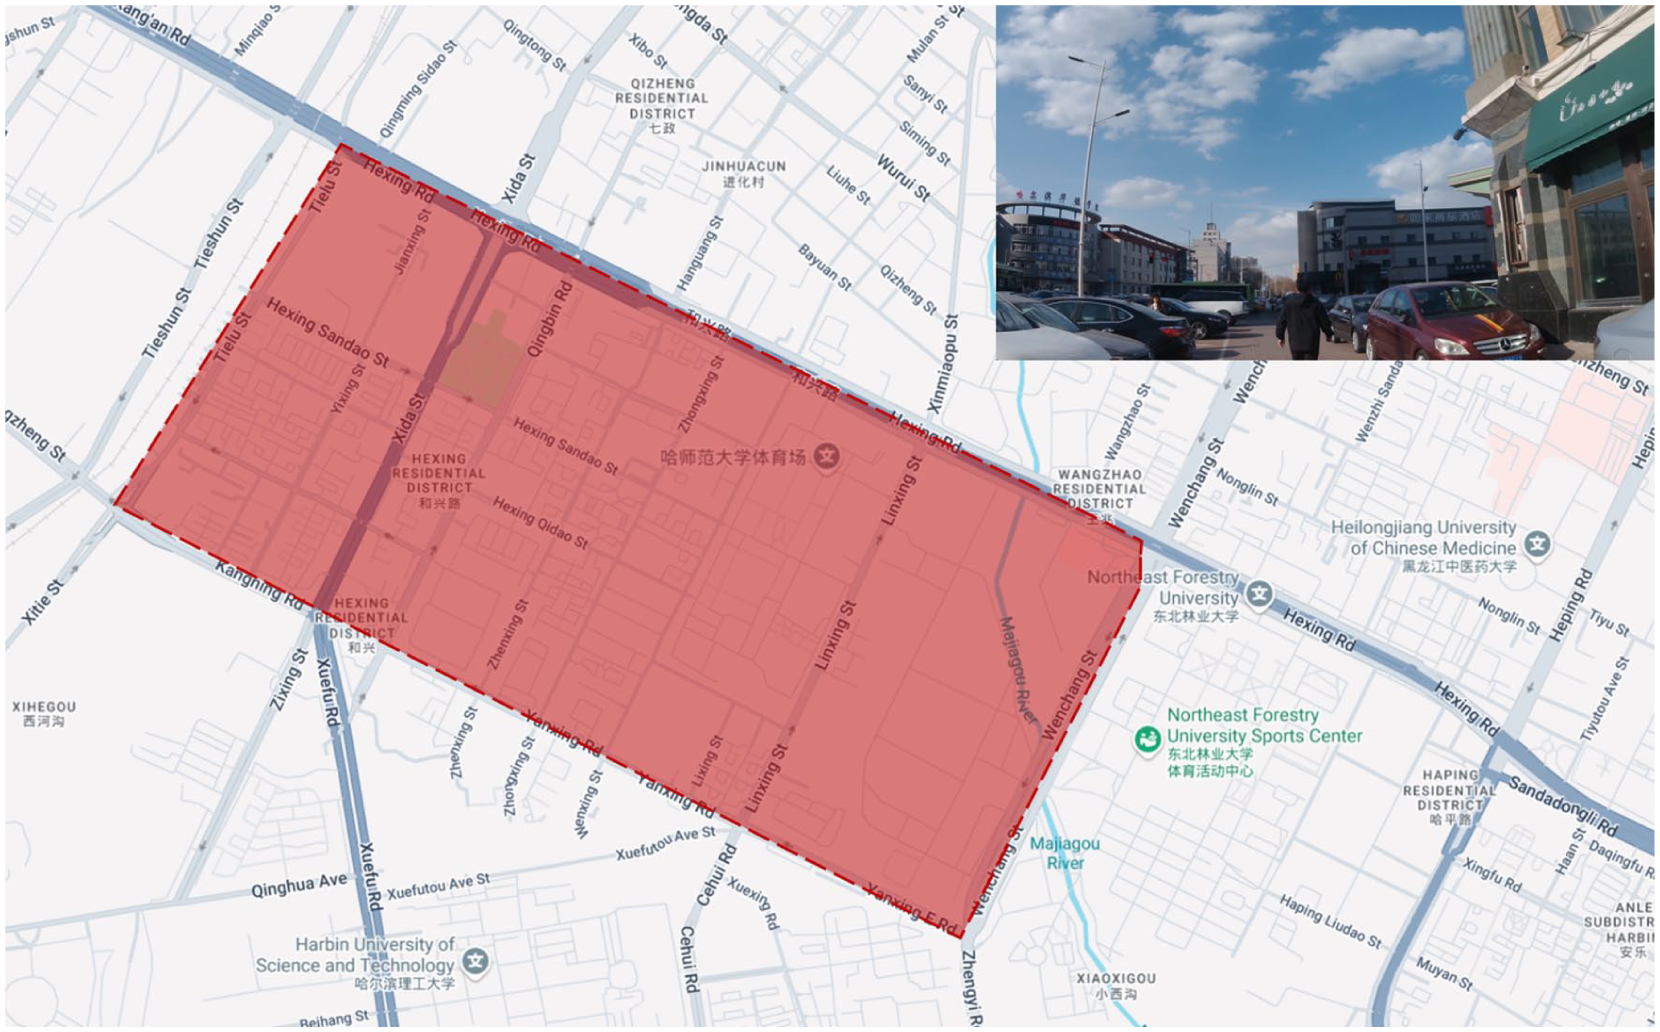
(5) Newly built block: Jiangbei University Town: Jiangbei University Town is located in the southeast of Harbin Limin Development Zone, bordering Limin Avenue in the south, and close to the northern exit of Harbin Fourth Ring Expressway (Figure 7). On a college road with a planned length of 4,700 meters, there are now more than 10 universities such as Harbin Normal University and Heilongjiang Foreign Studies University, with more than 100,000 students and a total population of more than 200,000 university towns. Jiangbei University Town is located on the north bank of Songhua River, which is a newly planned urban area of Harbin in recent years. The local buildings are relatively new and the degree of damage is not great, but due to the short development time, the business district and facilities are not perfect. There are few residents, and the main resident population is students in the university town. Based on the above characteristics, this block is selected as research sample 5.
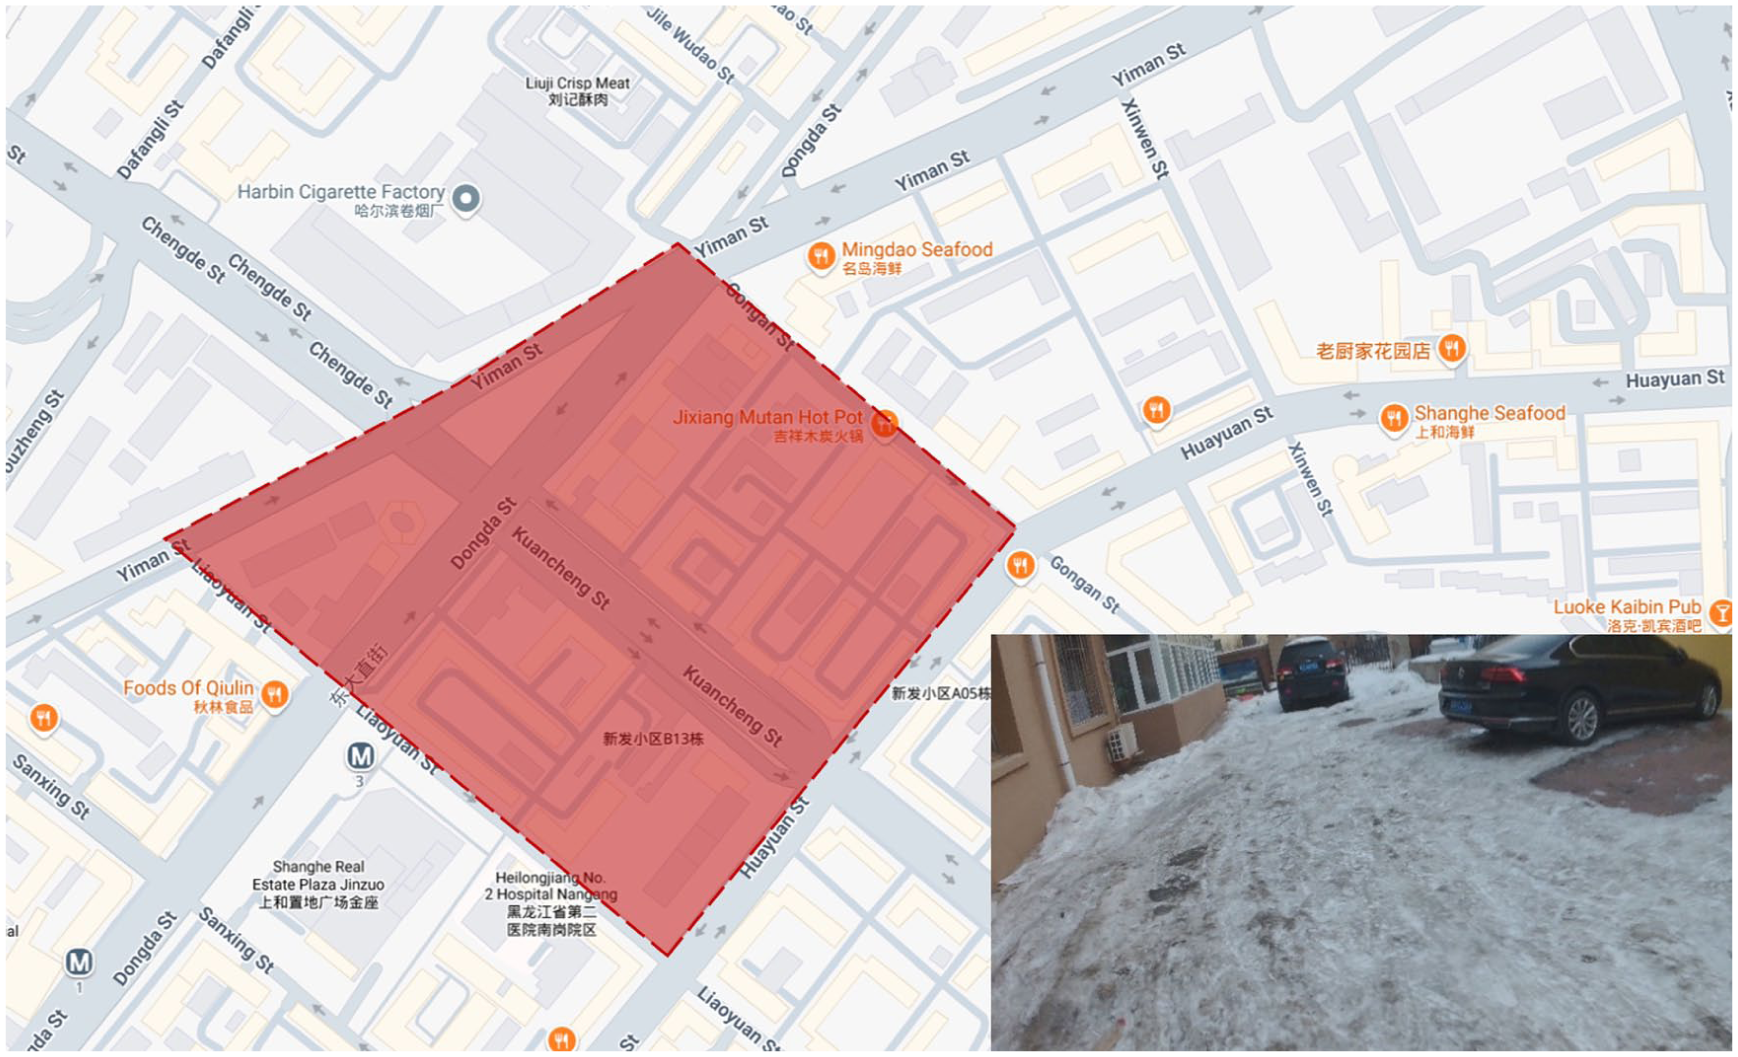
Geographical location and cold climate status of urban block sample 1.
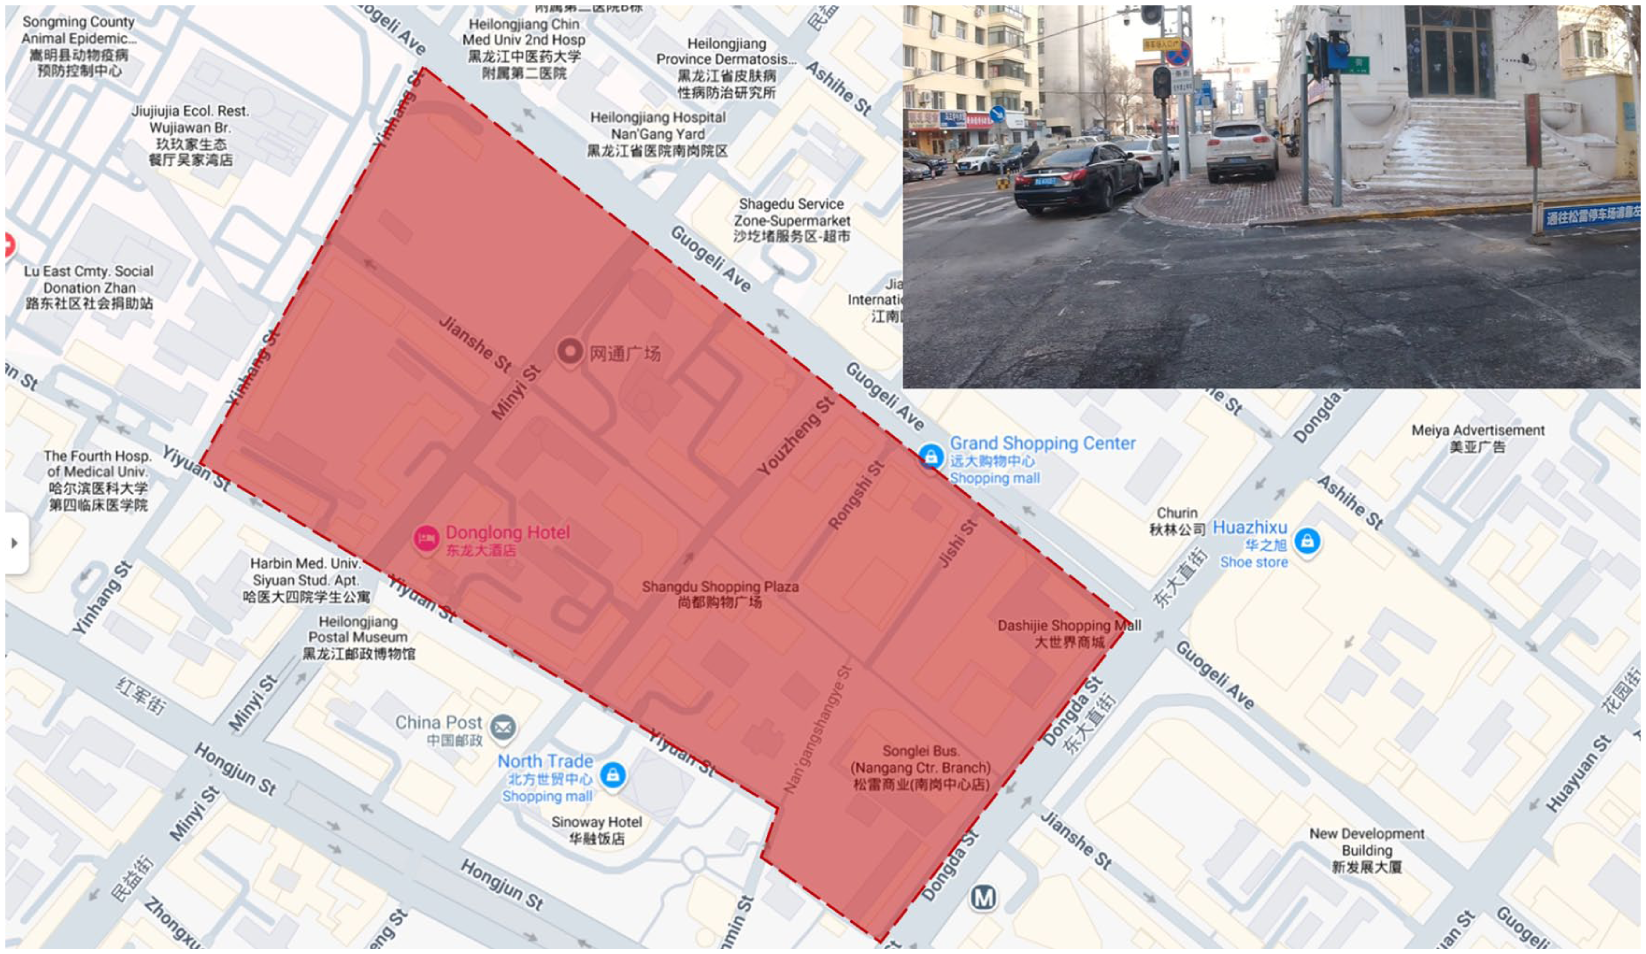
Geographical location and cold climate status of urban block sample 2.
Geographical location and cold climate status of urban block sample 3.
Geographical location and cold climate status of urban block sample 4.
Geographical location and cold climate status of urban block sample 5.
Methods
Commonly used health performance indicators
People’s attention and quantification of space environmental health are first reflected in the physical environment of residential buildings. Environmental problems such as building ventilation and lighting, temperature and humidity, noise, and smell may cause residents’ physical and mental problems such as allergies, fatigue, increased mental stress, etc (Neubauer et al., 2018). Buildings that do not meet the needs of human settlements often consume more energy, have high operating costs, and have a short life cycle (Lockwood et al., 2022). With the continuous advancement of urbanization, people’s daily activity space has been further expanded, and the health-friendly orientation from architecture to urban space has gradually become the development consensus of functionalism and humanism theories. Evaluating the health performance of space, quantifying the health potential of space, and optimizing the health performance of space have become important considerations in the research of spatial sustainable development.
Although the importance of quantitative research on spatial health has received considerable attention (Dili et al., 2011), due to the complexity of urban spatial development at the regional and cultural levels, and the differences in the focus of research fields, it is always difficult to unify the quantitative evaluation system of spatial health. It is worth mentioning that, whether from the perspective of economics, sociology, or architecture, everyone has put forward the concept of “health performance” or similar concepts, though the definitions given by different disciplines are different. These definitions are mainly divided into three categories: subjective health performance, objective health performance, and subjective and objective health performance. Subjective health performance research represented by sociology and psychology is often based on the subjective experience and aesthetics of people or professionals (Akpınar, 2021), while objective health performance research represented by economics and architecture takes urban geographical environment and economic activity data as spatial health performance evaluation standards, so as to evaluate the cost management and optimization frame of specific spaces (Lee et al., 2012). With the introduction of geographic information systems (Liu et al., 2024; Zhi et al., 2024), virtual reality (Chen et al., 2024; Gao, 2024), parametric design (Deng et al., 2023), computer vision (Florio et al., 2024; Wang et al., 2024), human-computer interaction (Fang et al., 2022; Gan et al., 2023), and other technologies, urban spatial data can be efficiently processed, analyzed, simulated, and presented. Urban spatial perception has become an important direction of urban design research, and health performance has gradually moved towards the development mode of subjective and objective combination, that is, physiological sensors record the specific response of urban residents to the spatial environment, and explore the response degree of urban space to residents’ physical and mental needs from a dynamic perspective (Osborne, 2022).
In order to explore the coupling relationship between neighborhood environment and spatial health, this paper mainly discusses the health performance of subjective and objective combination, and obtains human factors data through sensors. These human factors data can map the real-time physiological signals of spatial users in space, and quantify them as cognitive, emotional, and physical state feedback, so as to explore the optimization solution of block space in line with public health orientation.
Stress is a state of tension at the physical and psychological levels in the face of stimuli (Lee et al., 2004), which reflects the body’s immediate response to stressors. Early studies mainly started from case studies of various diseases caused by stress, and believed that whether it was acute stress or chronic stress, stress would have a negative impact on physical and mental health, and explored physiological treatment options to relieve stress (Frodl and O’Keane, 2013; Murphy, 1996; Sengupta, 2012). With the increasing popularity of high-performance and mobile physiological sensor devices in various fields, people gradually think that although stress may be unpleasant, it cannot be directly regarded as a bad state. On the contrary, when the stress caused by stressors such as special events or spatial elements does not exceed the disease-causing threshold, moderate stress can stimulate human vitality, or increase heart rate and adrenaline in dangerous situations, and maintain alertness and attention (Bell and Ross, 2014). Stress can even be an opportunity for health optimization. In the process of coping with stress, the nervous system often regulates the physiological state through hormones to restore the physical state to homeostasis (Boucsein, 2012; Chrousos et al., 2013). Therefore, we can use sensors to detect the fluctuation of physiological signals, so as to evaluate the stress level of people in a specific time and space and quantify the spatial health performance.
Wearable physiological sensors were first used in the fields of precision medicine and on-site nursing (Baig et al., 2017). As a key multi-modal physiological signal sensing and conversion device in the refined diagnosis system, they can track the physiological state of the human body in real time and provide continuous and accurate health detection data reference for customized diagnosis and treatment (Jameson and Longo, 2015; Lyu et al., 2021; Tang et al., 2023). And because of its high sensitivity, flexibility and relative economy, it stands out from physiological sensors such as implantable sensors and edible sensors. After many updates and iterations, it is widely used in health monitoring-related research. Early health monitoring using wearable sensors mainly started from the prevention and treatment of physiological diseases. Initially, it was only used as an auxiliary tool to monitor a single physiological indicator, such as blood glucose monitoring (Kwon et al., 2021; Luo et al., 2022), urea monitoring (Yue et al., 2022), nicotine content monitoring (Iitani et al., 2020; Tai et al., 2020), etc. With the further expansion of the demand for refined diagnosis and treatment, the use goal of wearable sensors has gradually shifted to monitoring pathology and diagnosis and treatment effects, such as patients’ walking ability (Mellema and Gjøvaag, 2022), perspiration (Nyein et al., 2019), etc. In order to distinguish the differences of human physiological indicators between daily activities and abnormal conditions, wearable sensors have begun to be used in the measurement of behavioral environment, and people’s discussion on the causes of specific physiological states has gradually extended to environmental influences, psychological states and emotional changes (Granat et al., 2023; Subramanian et al., 2024).
Because wearable sensors can quantify complex physiological indicators, stress detection research is one of the earliest studies to use wearable sensors to evaluate psychological state. The definition of stressors has gradually refined from general stressful events (Betti et al., 2017) to specific physical environment indicators such as PM2.5, NO2, noise, and congestion in urban environments (Helbig et al., 2021; Morawska et al., 2018; Zhang et al., 2021a, 2023). This also means that it is feasible to observe the physiological and psychological experience in the built environment with the help of wearable sensors, so as to realize the dynamic evaluation of the health performance of the physical environment.
Although there have been studies that obtain human factors data through wearable sensors to assess spatial health, and physiological indicators such as skin temperature have become important indicators reflecting spatial perception, most related studies have not considered the impact of urban climate specificity on environmental assessment, and default to experimental research in mild climates, while research on thermal comfort in cold areas has shown that studying urban seasonal characteristics is of great significance to enhance residents’ immunity (Jiang et al., 2024; Luyao et al., 2025) and optimize urban environment (Järvi et al., 2017; Popick et al., 2022). In this regard, we use wearable physiological sensors to measure and optimize the spatial health performance of cold cities in cold climates.
Under normal circumstances, physiological signals commonly used to detect health performance mainly include electrical skin response (GSR), skin temperature (ST), heart rate variability (HRV), electrocardiogram (ECG), etc.
Galvanic skin response
Galvanic skin response (GSR), also known as skin conductance (SC) or electrodermal activity (EDA), is a biomarker of sympathetic nervous system activation (Christopoulos et al., 2019), which is considered one of the most sensitive and effective markers of emotional arousal due to the strong activation of sweat secretion during high levels of emotional arousal and the linear relationship between emotional arousal and GSR (Li et al., 2022). There are two types of GSR: skin conductivity level (SCL) and skin conductivity response (SCR). Skin conductivity level, also known as tonic skin conductivity, is the baseline level of skin conductivity data recorded in experiments without any environmental events; skin conductivity response, also known as phased skin conductivity, represents the influence of stress and other stimuli on human body (Nepal et al., 2016; Wolfensberger and O’Connor, 1967).
The characteristic parameters of high GSR utilization rate mainly include:
(1)
(2)
(3)
(4)
(5)
Skin temperature
Human skin temperature (ST) usually fluctuates in the 32~35 °C interval (Quazi et al., 2012), but abnormal values can occur in abnormal situations such as extreme ambient temperature, fever, malnutrition, physical exertion, and physiological changes such as vasospasm (Vinkers et al., 2013). At present, there have been studies on measuring ST in real time through temperature sensors in direct contact with the skin and using it as the research basis for emotion detection (Alberdi et al., 2016), but at present, the experimental results of stress causing ST increase and decrease exist (Hui and Sherratt, 2018; Kaklauskas et al., 2011), and the specific effect of stress on skin temperature is inconclusive.
Heart rate variability
Heart rate variability (HRV) reflects sympathetic and parasympathetic activity, quantifying temporal differences between successive heartbeats. The time between heartbeats is measured in milliseconds and is called the R-R interval or inter heartbeat interval (IBI). HRV is an index with high accuracy and sensitivity of human emotion detection (Sriramprakash et al., 2017), and its mean value, standard deviation of RR interval, root mean square, and other parameters are often used in the time domain. Its low frequency (LF), high frequency (HF), low frequency/high frequency ratio, and other parameters are often used in the frequency domain (Shaffer and Ginsberg, 2017).
Other physiological signals
Many other physiological signals can be used for stress detection of emotions: an electrocardiogram (ECG) records the electrical activity of the heart on the skin surface; electromyography (EMG) can measure muscle activity status (Westerink et al., 2008); and although some muscle contractions can be controlled voluntarily, muscle contractions such as facial contractions of stressors are mostly activated involuntarily, so they have reference significance; Blood volume pulse (BVP) is the blood flow in a blood vessel at a specific time interval, which decreases due to vasoconstriction under pressure and increases again in a quiet state (Zhang, et al., 2021b).
Combined with the existing research on the application of physiological sensors and the specific rules of MOS algorithm, we mainly use GSR and ST physiological signals to measure the health performance of sample blocks in winter cities in cold climate.
Physiological stress response tracking
Multi-level quantification of block spatial characteristics without subjective value orientation can further reveal the influencing factors and paths of public health, and then improve health performance. This argument has reached a consensus in research (Jiang et al., 2020). This study characterized the health performance of neighborhood spaces by testing the physiological stress responses of sample neighborhood users (Figure 8). Considering the individual cold tolerance of subjects is related to factors such as age, sex, body fat rate, daily lifestyle, cold tolerance gene expression, etc., and this multi-factor nonlinear relationship is difficult to quantify (Castellani and Tipton, 2016; Maeda et al., 2005; Young, 1991), The subjects planned to be recruited need to cover a wide age structure from childhood (over 9 years old) to old age, so as to ensure the ability to think independently and complete walking activities independently, and can complete outdoor experiments on cold climate days in Harbin. The sex ratio of subjects should be maintained at 1: 1. Subjects were not required to provide personal information other than gender, age, mobility, physiological data required for project study and corresponding questionnaire feedback data.
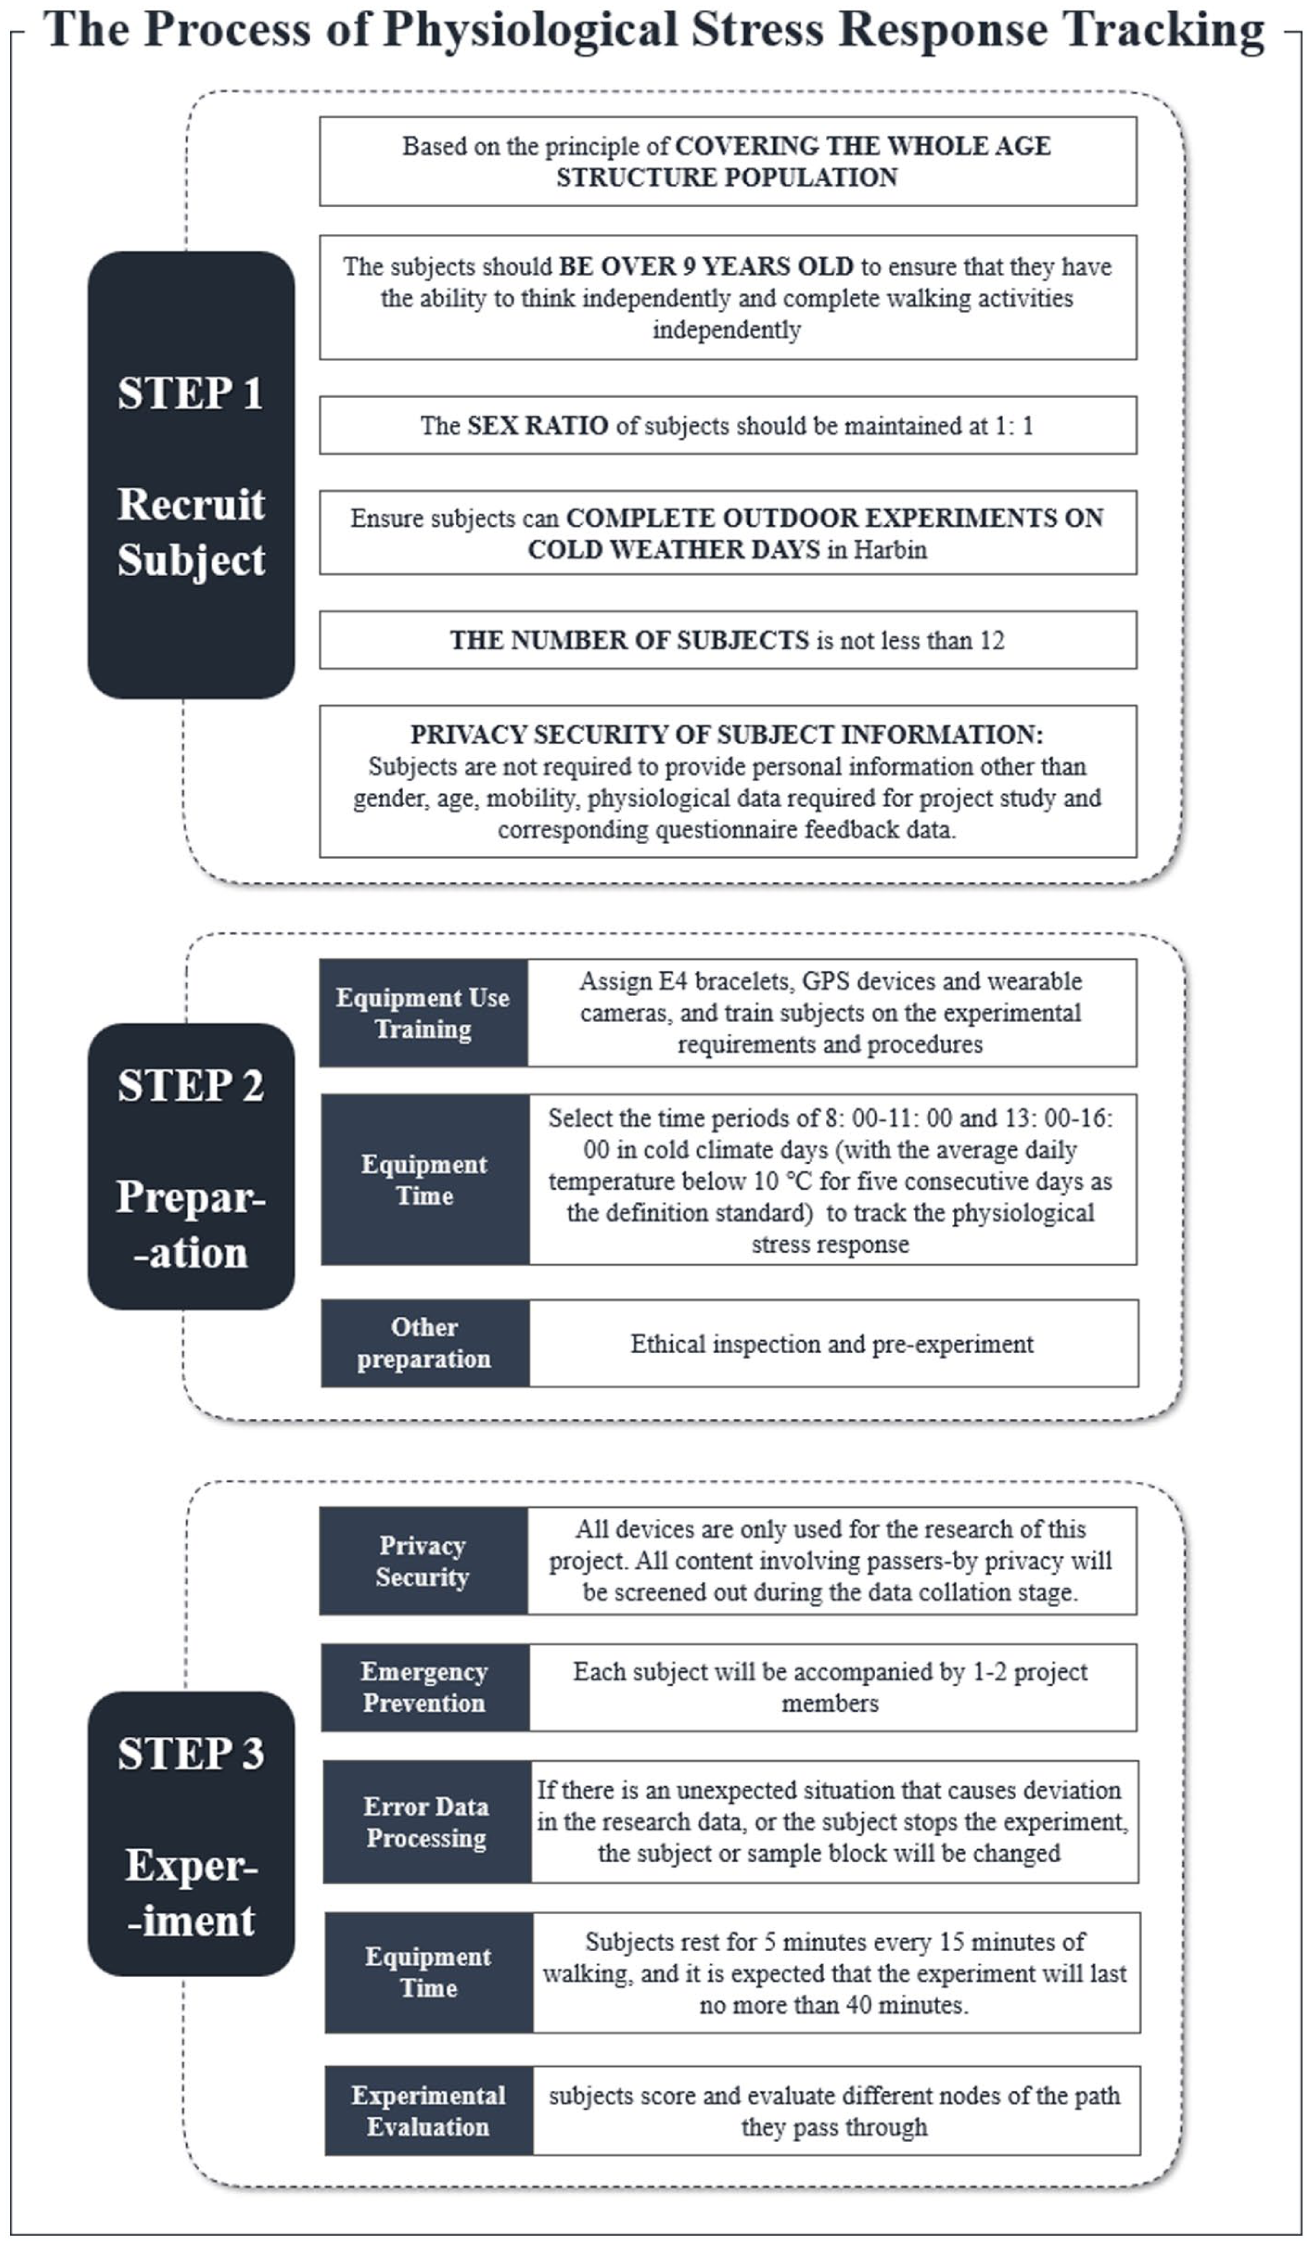
Physiological stress response tracking process.
In the existing related studies involving the detection of physiological signals of subjects, the number of subjects was concentrated in the range of 6~12, and the research conclusions were scientific and referential (Bergner et al., 2013; Birenboim et al., 2019; Can et al., 2019; Swan, 2013). Since most of the study areas are often temperate cities, and the climate environment has a smaller perception of subjects’ space use than that of cold cities, this study recruited 16 subjects to complete the experiment in five sample blocks in the physiological stress response tracking experiment. The failure rate of human data obtained in the experiment was 1/4, so there were 12 valid subject data in each sample block, and the sex ratio was 1: 1.
Before the experiment, the subjects would be assigned E4 bracelets, GPS devices, and wearable cameras, and they will be trained on the experimental requirements and procedures. The E4 bracelet can measure the changes of human physiological indexes such as heart rate, blood oxygen, and skin electricity of the subject. The GPS device can record the geographic information of the subject’s path, and the wearable camera will take real-time pictures of the surrounding scenery of the path traveled by the subject’s activity.
In order to ensure the scientific nature of the experiment and the personal and information security of the experimenters, the time periods of 8: 00~11: 00 and 13: 00~16: 00 in cold weather days (with the average daily temperature below 10 °C for five consecutive days as the definition standard) were selected to track the physiological stress response, and the possible peak commuting period and the rest time of urban residents were staggered to reduce the disturbance to the lives of surrounding residents, and the experiment was carried out during the day to ensure the safety of the subjects.
Through the coordination of the screening of cold climate days and the experimental arrangement of subjects, this study determined the experimental time to be the non-commuting time from January 3 to January 5, 2024, to exclude the influence of holidays and peak periods on the experiment. The cold climate temperature and ice and snow coverage of cold cities are closely correlated with sunshine. The winter solstice of 2023 was the shortest sunshine day in the whole year, and the average minimum temperature in the city is −29 °C, which can be used as a reference for the minimum temperature range of experimental days. The average maximum temperature from November to December 2023 was −11 °C, which could be used as a reference for the maximum temperature range of the experimental day. The average maximum temperature on the experimental day was −9 °C , the minimum temperature was −21 °C, and the urban wind environment was southwest wind speed II. In addition, there would be 1–2 hours of light snow on the night from January 2 to January 5, 2024, which better reflected the cold climate characteristics of the city.
During the experiment, the subjects wore E4 bracelets, GPS devices, wearable cameras, and other devices to complete the physiological stress response tracking content. In order to ensure the privacy of subjects and passers-by, the data recorded by E4 bracelet and GPS device was only used for the research of this project. The wearable camera only obtains information such as buildings and structures around the street, surrounding greening facilities, road quality, etc. All content involving the privacy of passers-by was screened out during the data collation stage. Each subject was accompanied by 1–2 project members to respond to possible emergencies during the project in a timely manner, so as to ensure the safety of the subject’s walking and control the error of the study data. If there was an unexpected situation that caused deviation in the research data, or the subject stopped the experiment, the subject or sample block would be changed to ensure that the subject’s human physiological index data had research value.
If a subject walked independently in an urban block sample, and the path covered all sidewalks in the block, it would be judged that a round of experiments has been successfully completed. Subjects rest for 5 minutes every 15 minutes of walking, and it was expected that the experiment would last no more than 40 minutes.
After the subjects completed the physiological stress response tracking experiment, the subjects would be asked to score and evaluate different nodes of the path they pass through, and the questionnaire results were used as a reference for the analysis of physiological index data of the subjects to ensure the objectivity of the experimental data.
Space analysis algorithm of Moments of Stress (MOS)
The richness, completeness, immediacy, and accuracy of human factors data obtained by physiological sensors have been widely recognized in related research. However, how to determine whether people are in a state of stress through various physiological signals, judge the positivity and negativity of this stress, and identify possible stressors is still a major research difficulty. In addition, considering that the physiological state of the human body is always in a fluctuating state, and even in the steady-state period, the physiological signals oscillate slightly, most studies often set the experimental site as a laboratory, and build a scene-oriented experimental environment through a virtual reality platform, so as to obtain the physiological signal feedback of the subjects and ensure that the use state of physiological sensors is affected as little as possible. Although the method of setting an ideal experimental environment avoids the problem of large-scale errors caused by human data, there may be abnormal stressors that are difficult to mine because there is still a certain gap between the experimental environment and the real environment. In this regard, some studies have proposed a space analysis algorithm of Moments of Stress (MOS) suitable for real scene research, which enables human factors data to represent stressors and stress situations in urban space (Kyriakou et al., 2019), and makes it possible to quantify spatial health performance by combining subjective and objective. Studies have confirmed that this method can evaluate the continuous and instantaneous changes of users’ physiological stress response in neighborhoods, and the accuracy rate in urban environments can reach 84%.
MOS is a physiological signal rule system developed using biogeographic databases and laboratory experimental data, mainly based on GPS data to construct scene stress maps (Huang and Gartner, 2016) through the relevant features of GSR and ST data, thus mapping spatial health performance. In order to further reduce the physiological signal deviation that may be caused by the subject’s activity habits, the Empatica E4 bracelet with three-axis accelerometer capturing the subject’s movement state was selected as the physiological sensor in this study, so as to reduce the stressor identification error caused by the subject’s moving speed deviation as much as possible.
The rule logic of MOS is determined according to the operating characteristics of each characteristic parameter of GSR reflected in the existing research, and the realization degree of the rules is evaluated by a ternary scoring system. There are five rules in total. It is assumed that each rule can get 1 point if it is completed, 0.5 points if it is partially completed, and 0 points if it is not completed.
(1)
(2)
(3)
(4)
(5)
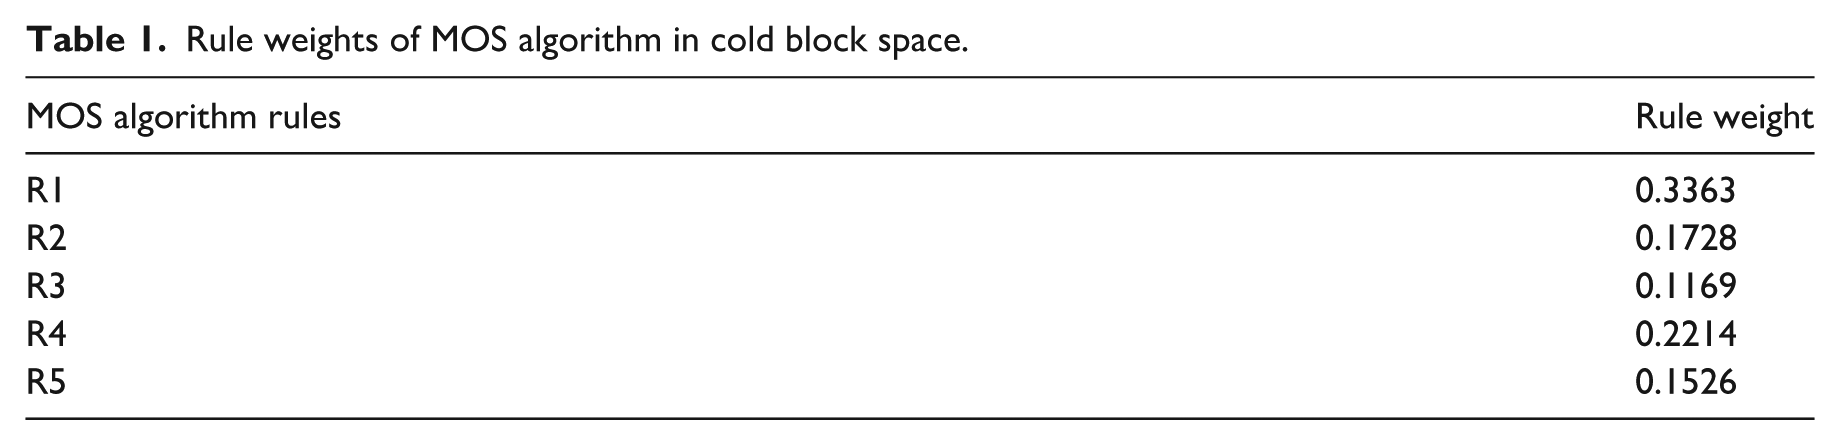
In order to determine the relative importance of the five rules, this study uses AHP method to construct the rule structure frame of cold block space MOS algorithm, constructs judgment matrix for different rule indicators, and standardizes the five rules as a whole. In this study, 20 experts in related fields are invited to evaluate the weight of rules, including experts and scholars from universities, planning and design practitioners, administrators of government and related departments, etc. Their research fields cover architecture, urban and rural planning, human factors engineering and computer fields, and they have certain research and practice on urban space design in cold regions. The relative importance of each index in the same layer is compared pairwise by using the 1~9 ratio scale method. On the basis of consistency test, the weights of each rule of spatial MOS algorithm in cold blocks are obtained (Table 1).
Rule weights of MOS algorithm in cold block space.
Results
“Block space–health performance” evaluation frame
Research result 1
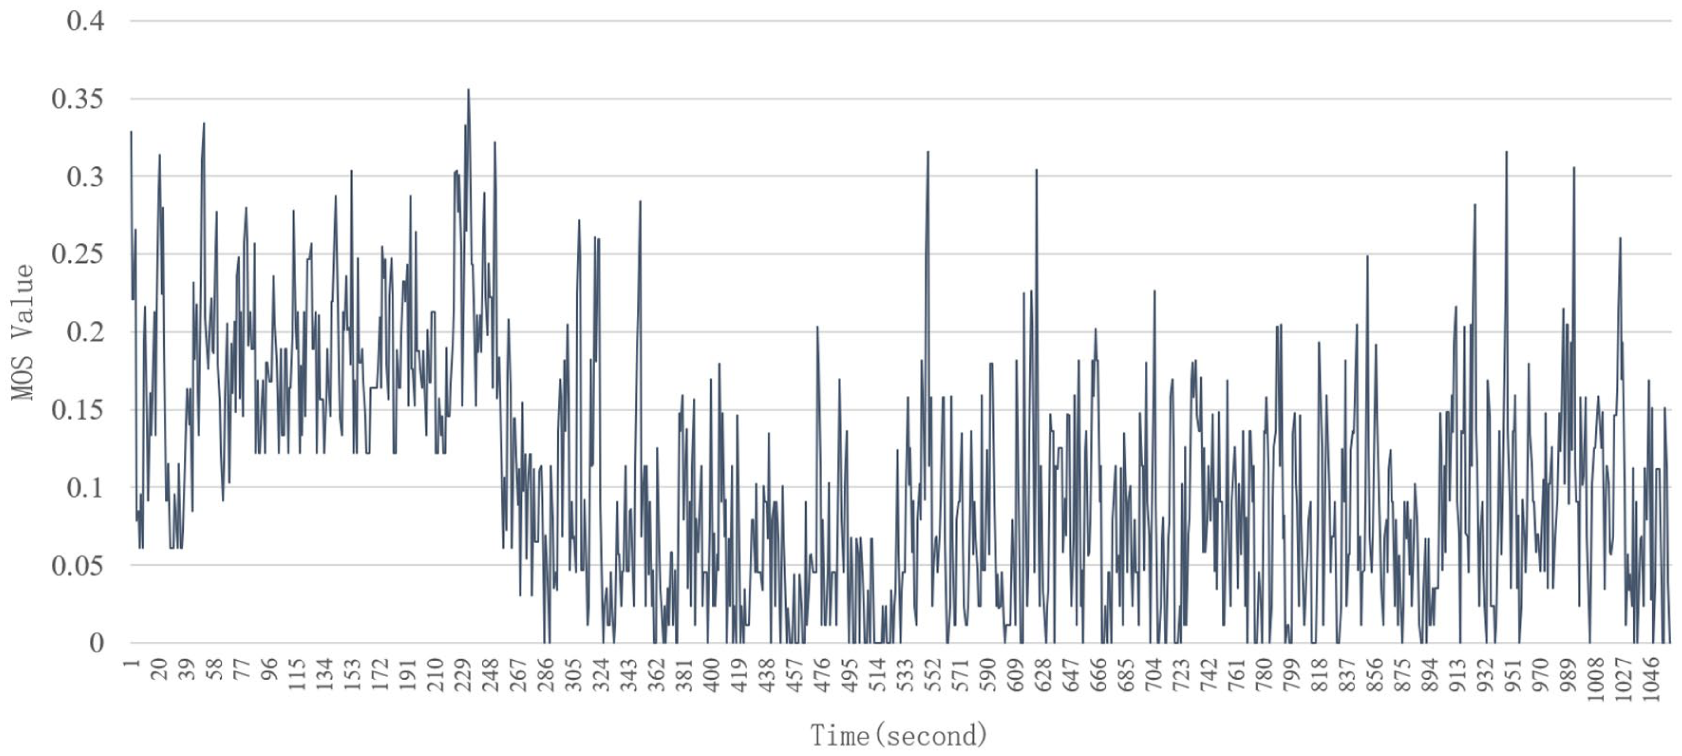
In the health measurement experiment of cold climate study sample 1, there are mainly nine peaks and three valleys in the average MOS (Figure 9). Among them, the number of peaks in the average MOS of women is significantly higher than that of men. Although the number of valleys in the average MOS of men is higher than that of women, the peak value can reach 0.883, which is significantly higher than that of women (Figure 10).
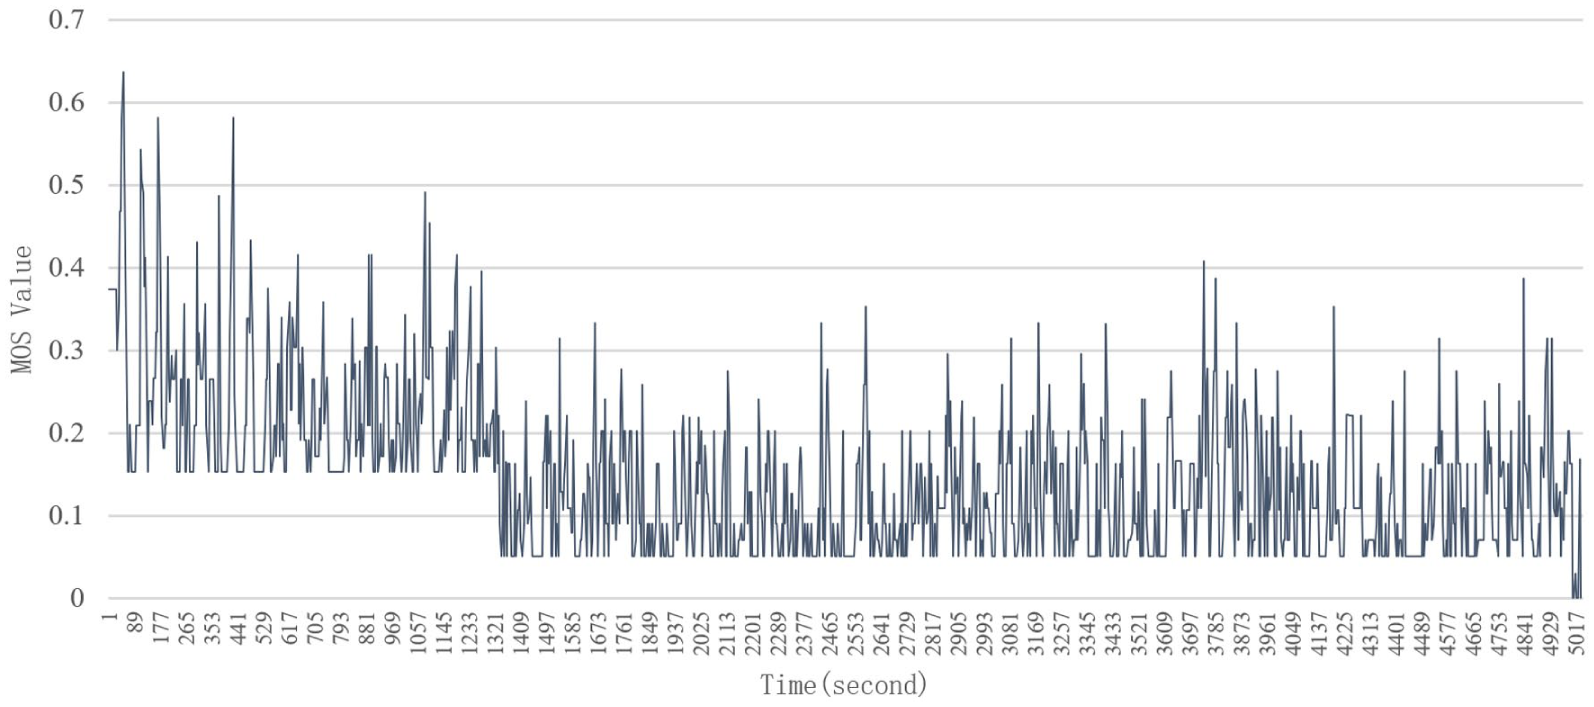
MOS mean value of urban block sample 1 in cold climate.
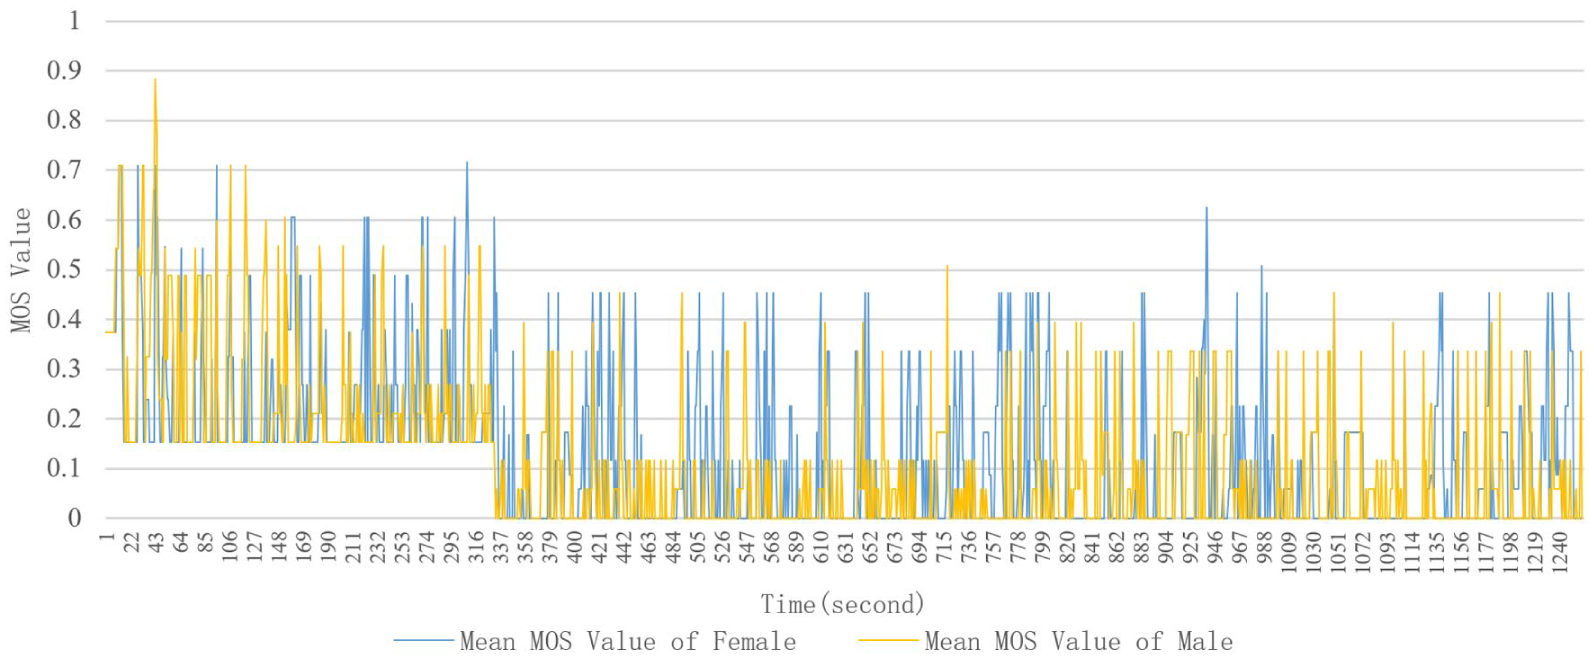
Comparison of male and female mean MOS values in cold climate of urban block sample 1.
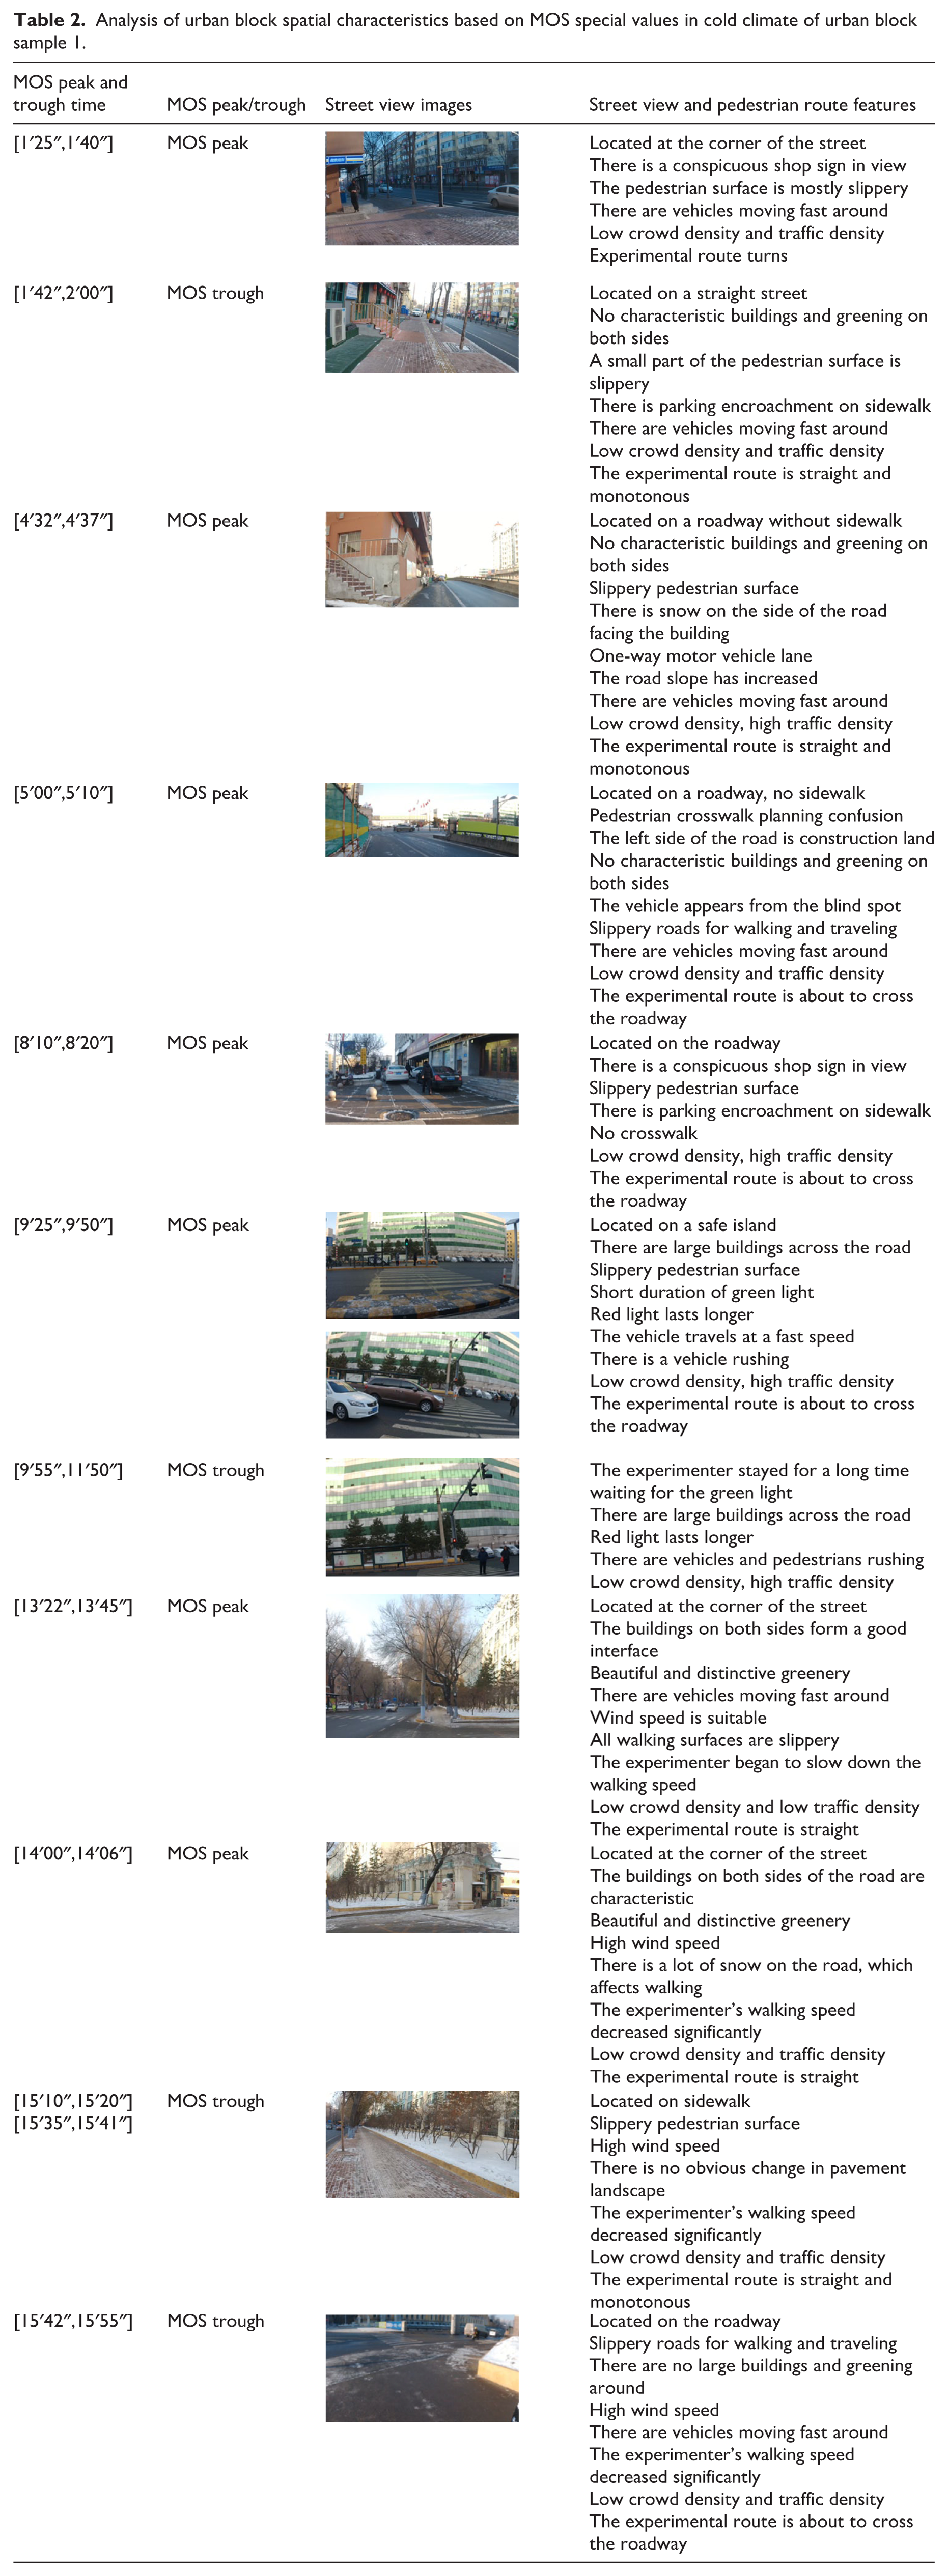
The peak value of MOS average is mainly produced in the following two block environments. One is the positive block environment, which has the characteristics of distinctive buildings on both sides of the road, conspicuous shop signs in the field of vision, appropriate ratio of street width to building height, good natural landscape formed by street greening, pleasant wind speed caused by building blocking, etc. The second is the negative block environment, which is characterized by vehicles passing by quickly, parking encroaching on pedestrian space, slippery road surface or snow, monotonous street landscape or featureless buildings, high wind speed, road slope change, etc. However, if the negative block characteristics such as straight and monotonous experimental route, unfriendly traffic light duration setting to pedestrians, and monotonous street landscape persist for more than 27 seconds of walking time, the MOS value of the experimenter will gradually enter a trough. It can be guessed that the sensitivity of receiving environmental stimuli may decrease if you continue to move in the negative block environment. Among them, when the road surface is slippery, the patience of pedestrians and non-motor vehicles waiting for traffic lights seems to decrease. If the traffic light duration is unfriendly to people crossing the road, pedestrians and non-motor vehicles may tend to rush, which is not conducive to the observation and decision-making of vehicles with blind spots and people with mobility problems in winter. In addition, the change of road slope, as an environmental characteristic of neutral blocks, can also stimulate the increase of MOS value; The MOS values of the experimenters were higher when crossing the road or at the corner of the street; When the surrounding traffic density is high, the average MOS of the experimenter also remains relatively high (Table 2).
Analysis of urban block spatial characteristics based on MOS special values in cold climate of urban block sample 1.
Generally speaking, the original outdoor environmental problems such as the obvious lack of pedestrian-friendly public space, chaotic planning of pedestrian space, and single greening in the research sample 1 of this period were amplified by the cold climate, and the problems of snow and wind speed in the cold climate had a great impact on the health performance of old blocks such as tobacco factory community, which affected the outdoor walking experience of residents.
Research result 2
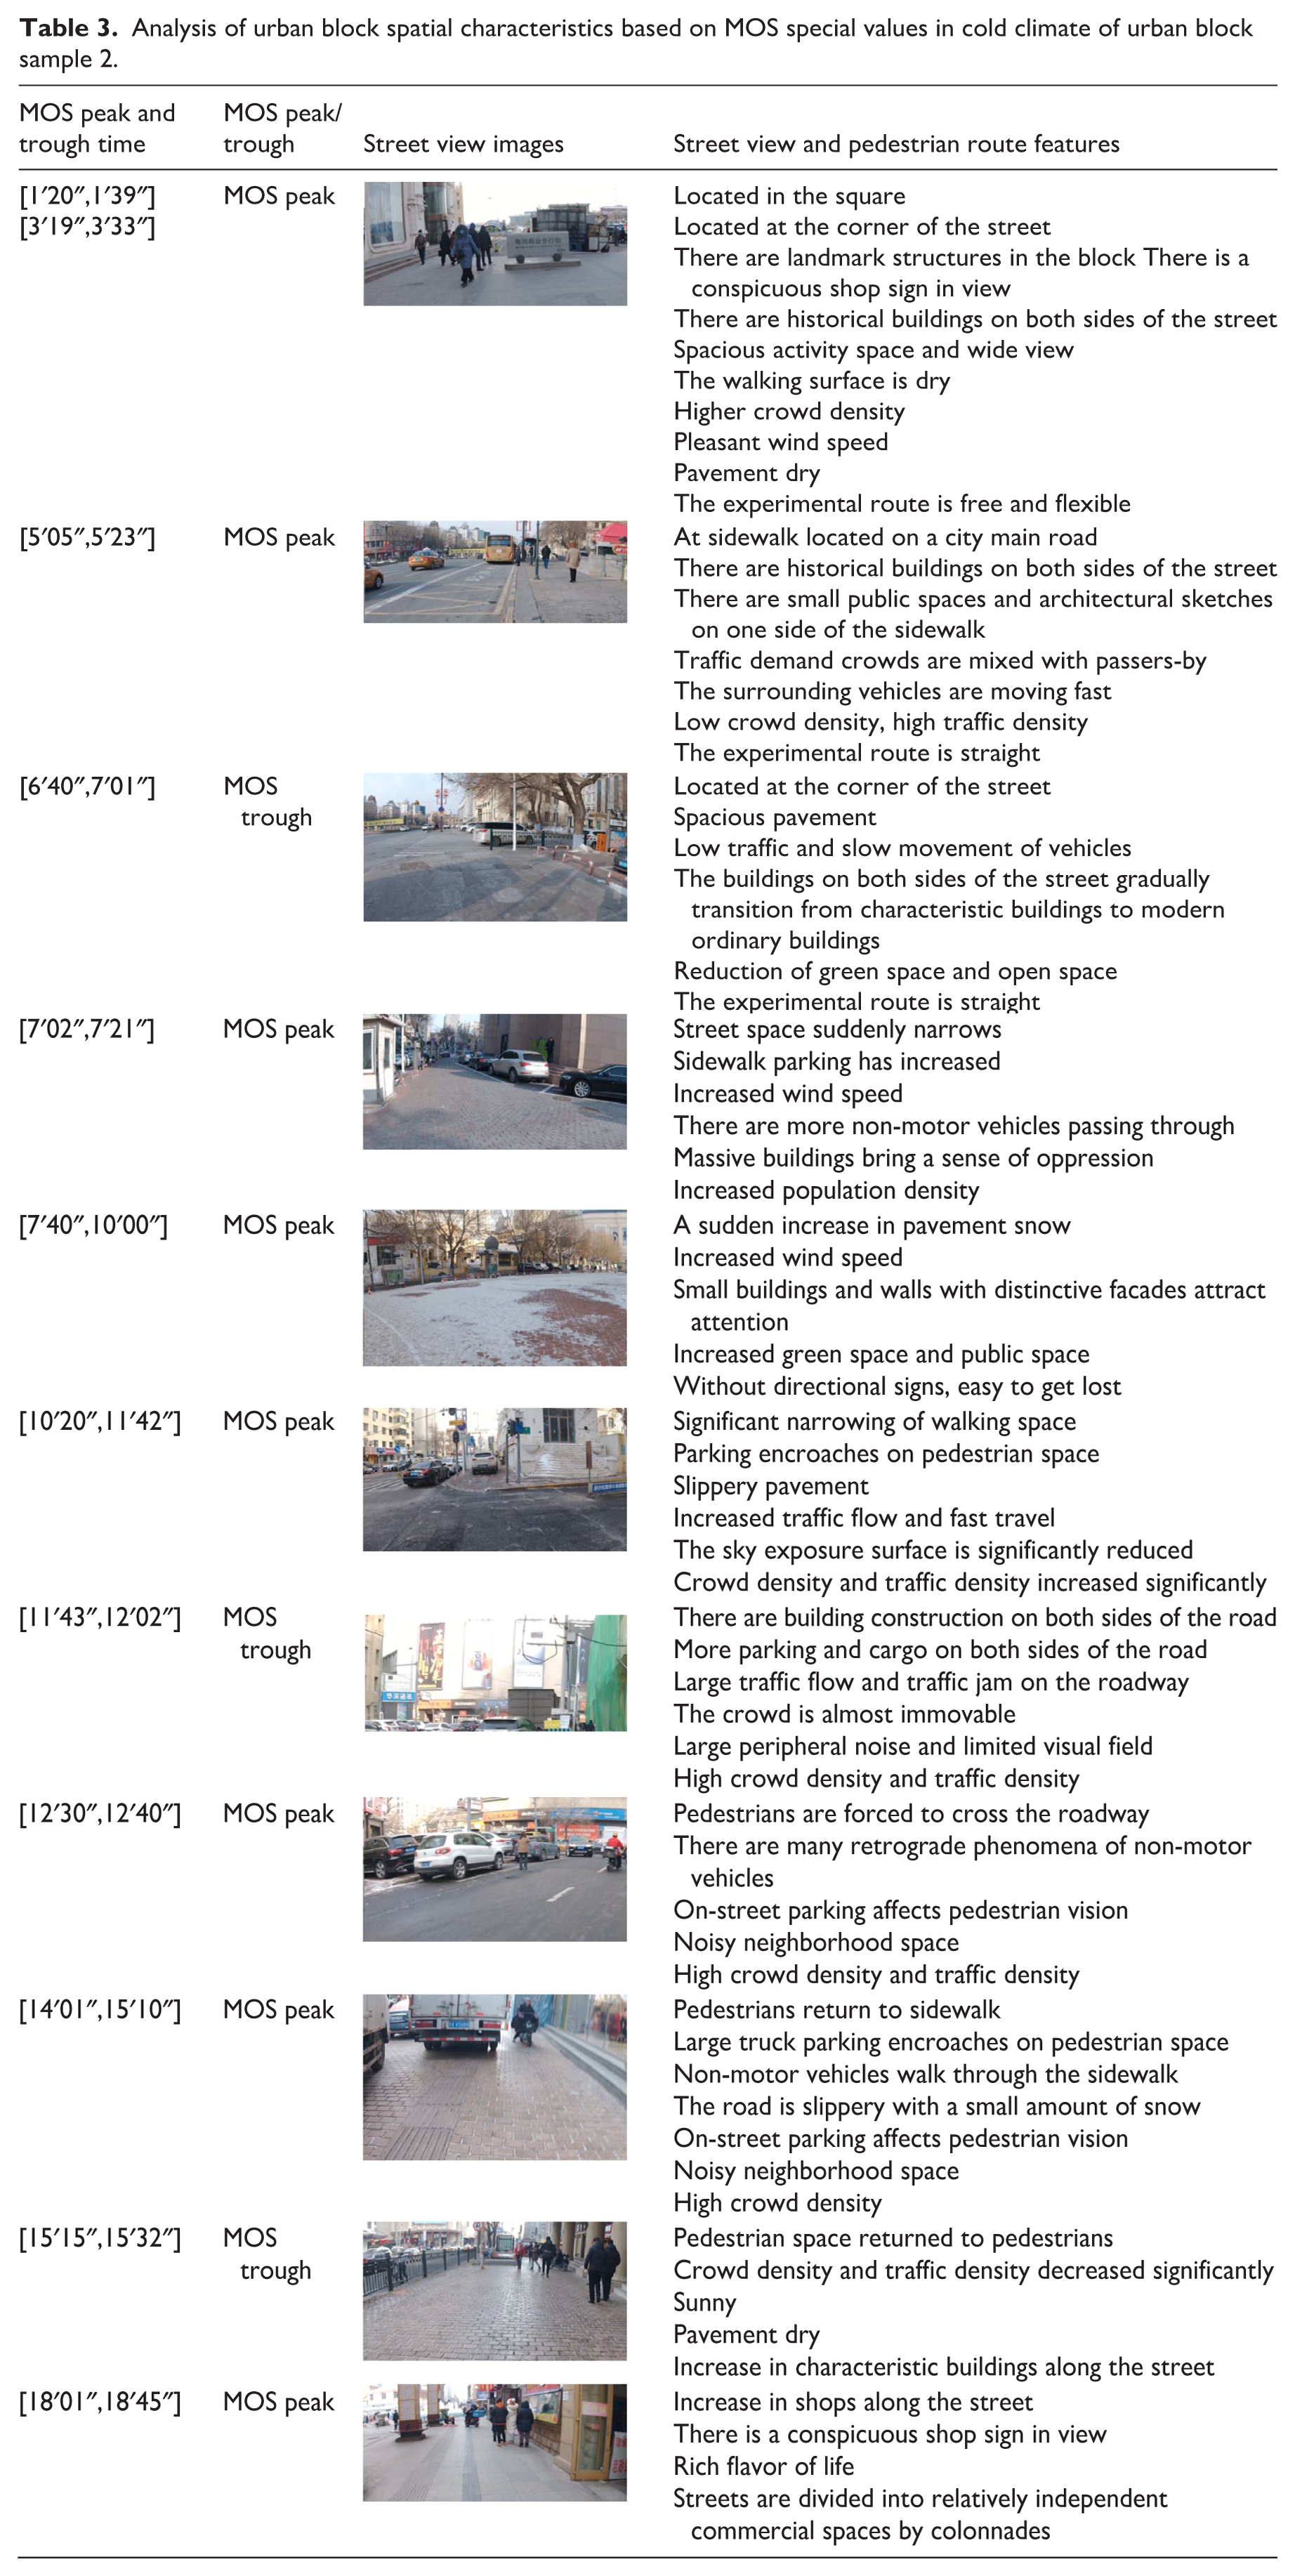
In the health measurement experiment of cold climate study sample 2, there are mainly nine peaks and three troughs in the mean MOS value (Figure 11). Among them, the number of peaks of female MOS average is significantly higher than that of male, and the number of valleys is significantly lower than that of male, but the peak values of female and male MOS average are the same, both of which are 0.658, which is relatively smaller than that of other blocks (Figure 12). Combining the peak and trough values of MOS average, it can be seen that there are two completely different pedestrian environments in the landscape of Jianshe Street Block (Table 6): the first pedestrian environment, as a typical public space to display the good image of the city, distinguishes square space, street pedestrian space, and car space through pavement materials and colors, colonnades, and street greening. Another kind of pedestrian environment has the characteristics of the transitional space between the old block and the park block. It is located in the rigid travel road section, which is the area with the most concentrated flow of people and vehicles. However, people and vehicles in this section are not diverted, the road conditions of the roadway, especially the intersection, are chaotic, the traffic order is chaotic and traffic congestion is prone to occur, and the snow in the pedestrian space has not been treated, so its potential safety hazards deserve attention (Table 3).
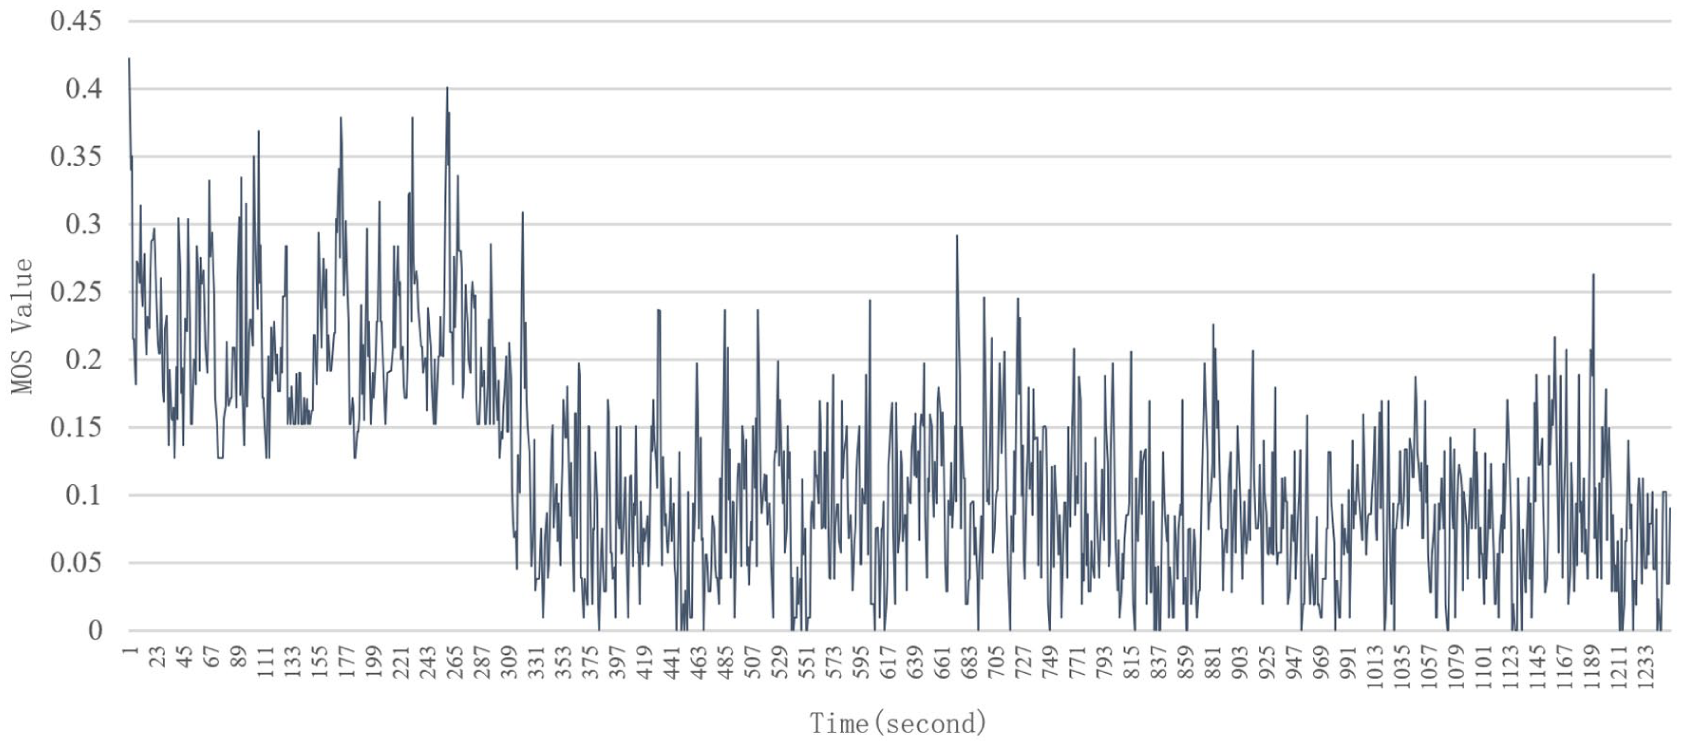
MOS mean value of urban block sample 2 in cold climate.
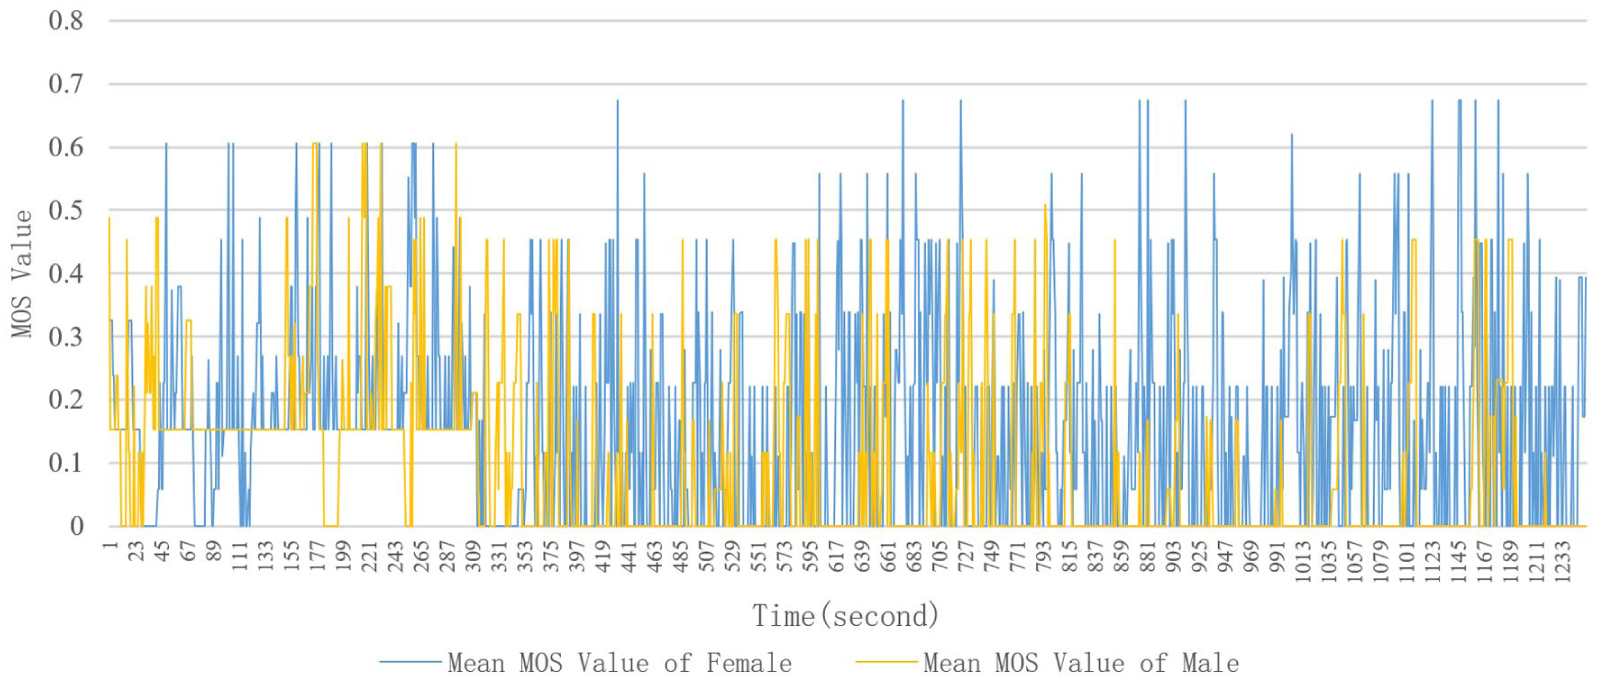
Comparison of male and female mean MOS values in cold climate of urban sample 2.
Analysis of urban block spatial characteristics based on MOS special values in cold climate of urban block sample 2.
In addition, the change of the mean MOS value of this block also points out a special stress phenomenon of physiological signals: when a person has continuously received negative stress stimuli before, such as pedestrians going retrograde in traffic flow, passively acquiring traffic noise and blocked vision, even if he starts to receive positive stress stimuli in the later period, such as entering a quiet and secure public space, his MOS value will no longer increase in a short time, and may even decrease rapidly. This indicates that the sensitivity of human physiological signals may decrease after receiving negative stress stimuli for a long time, and the response to positive stress stimuli lags behind. Therefore, it is far more efficient to optimize the block space and improve the negative block environment from the perspective of improving health performance than to further improve the positive block environment.
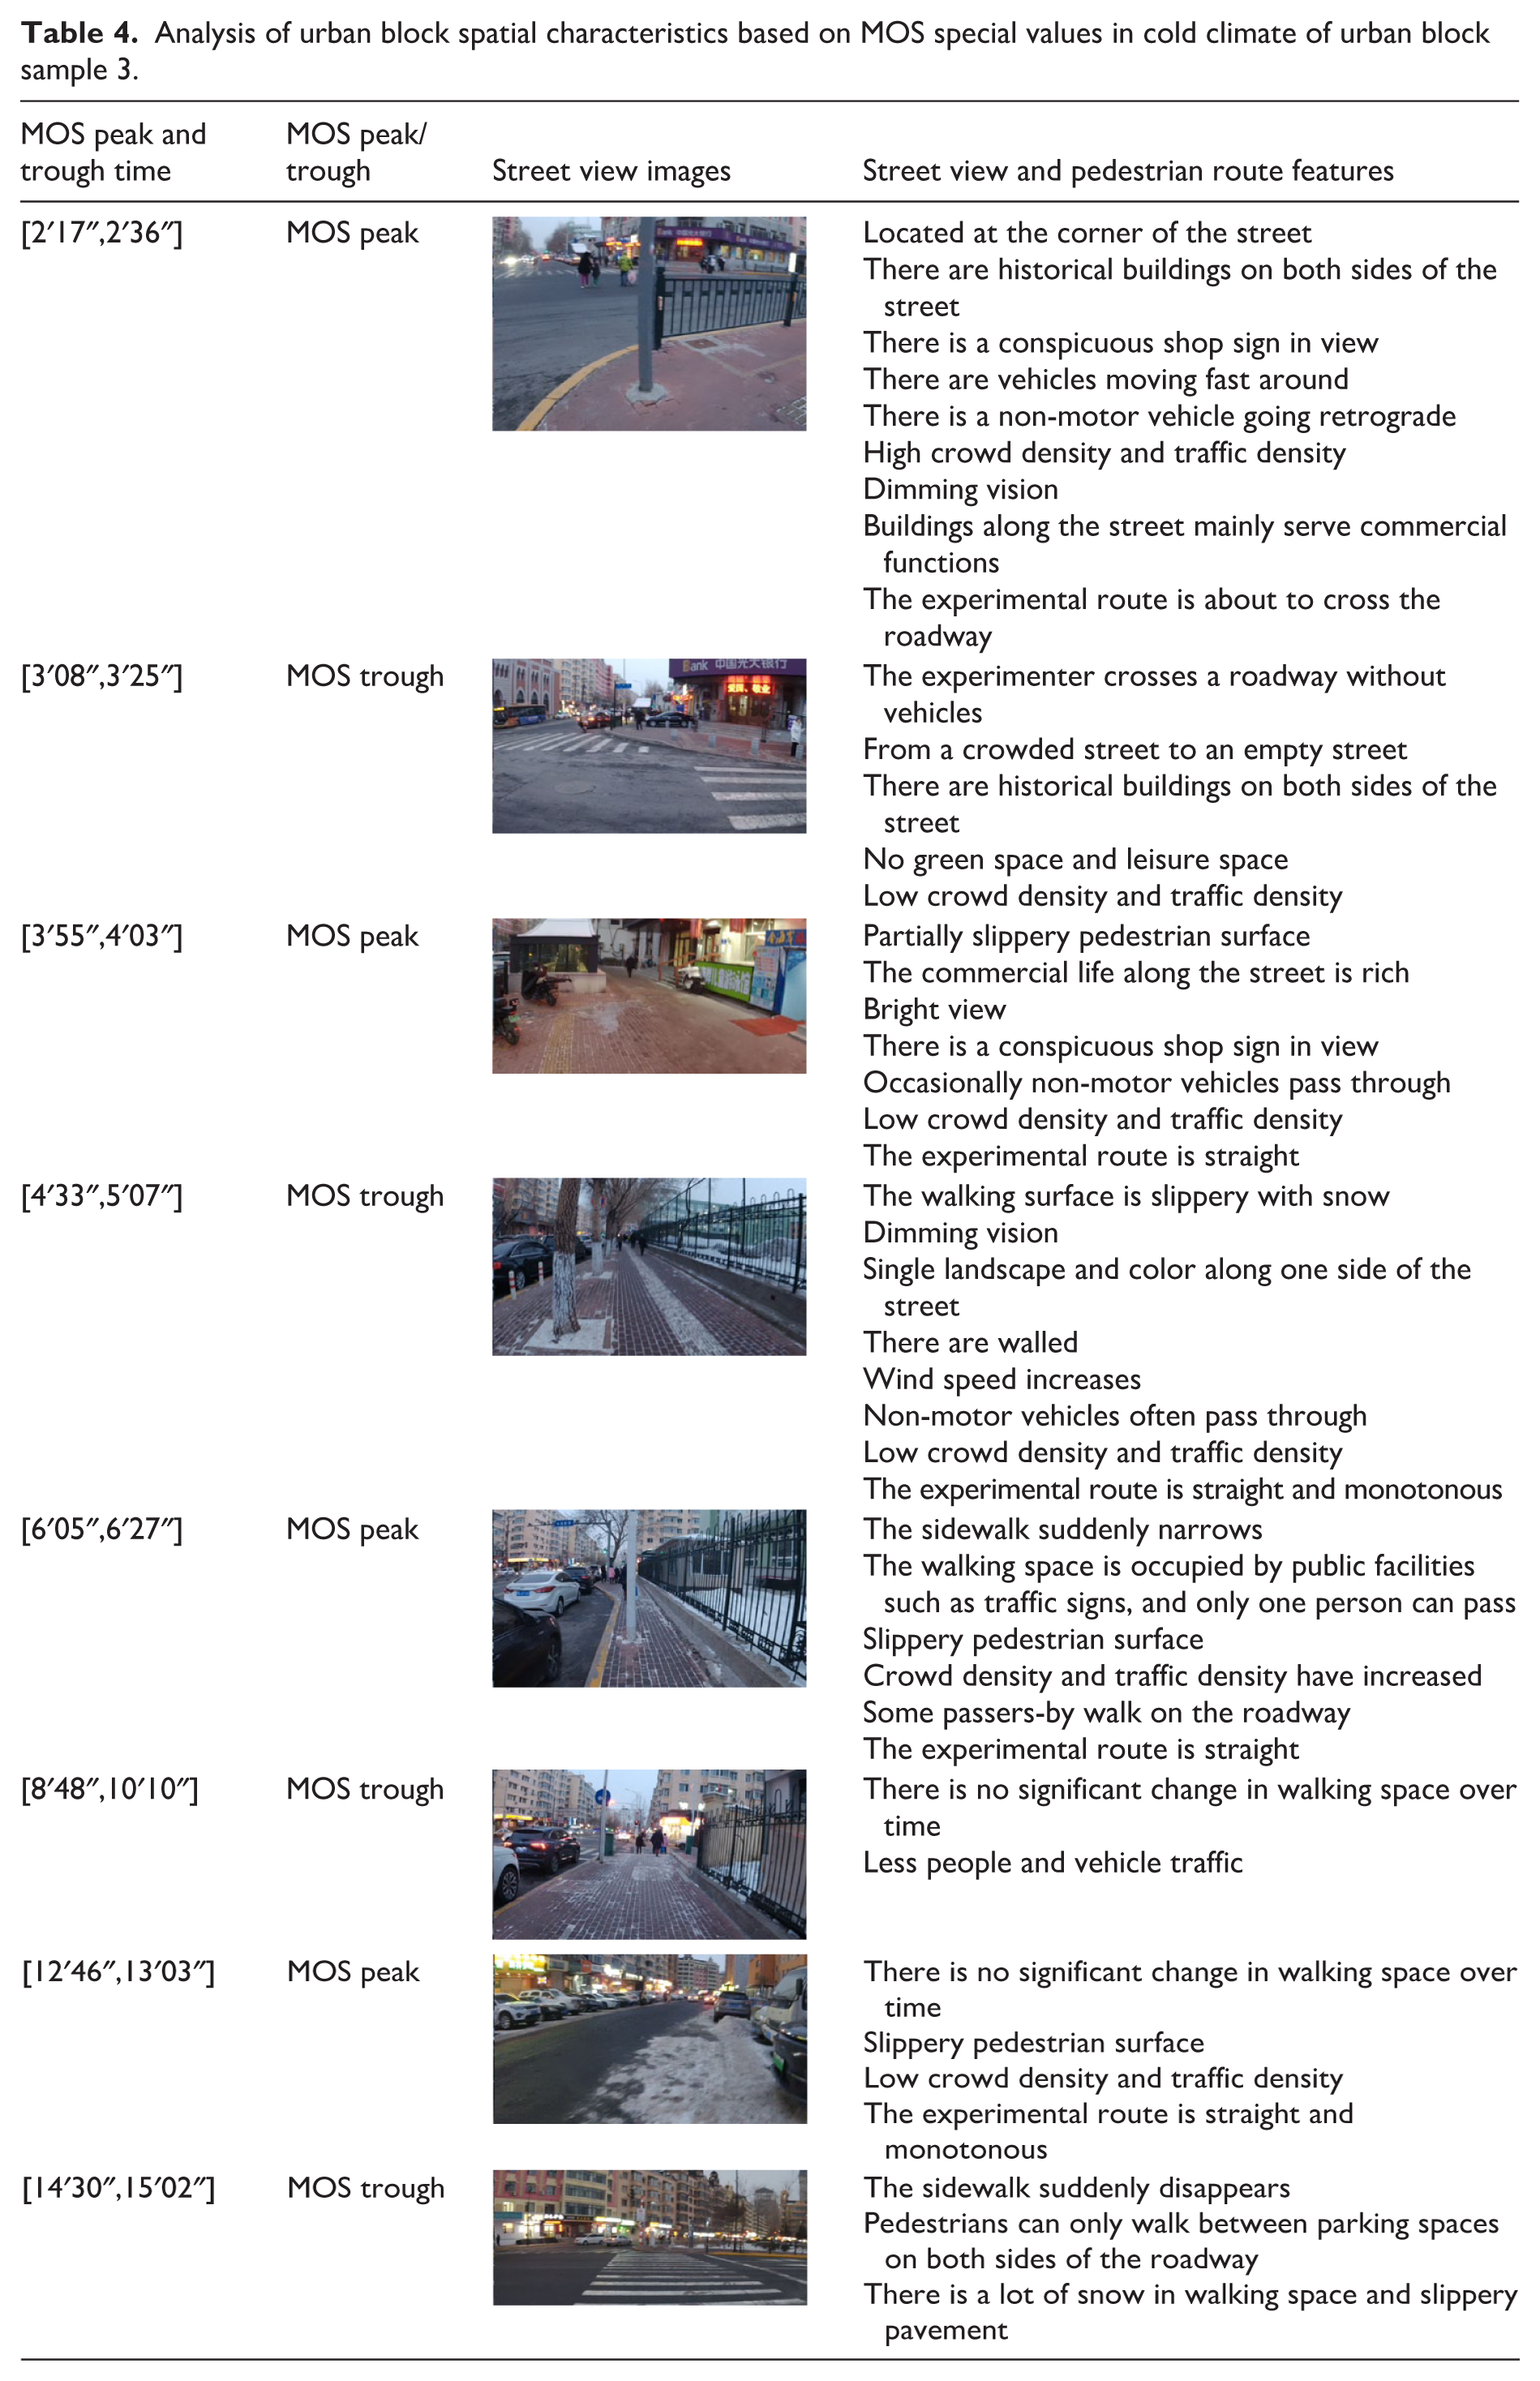
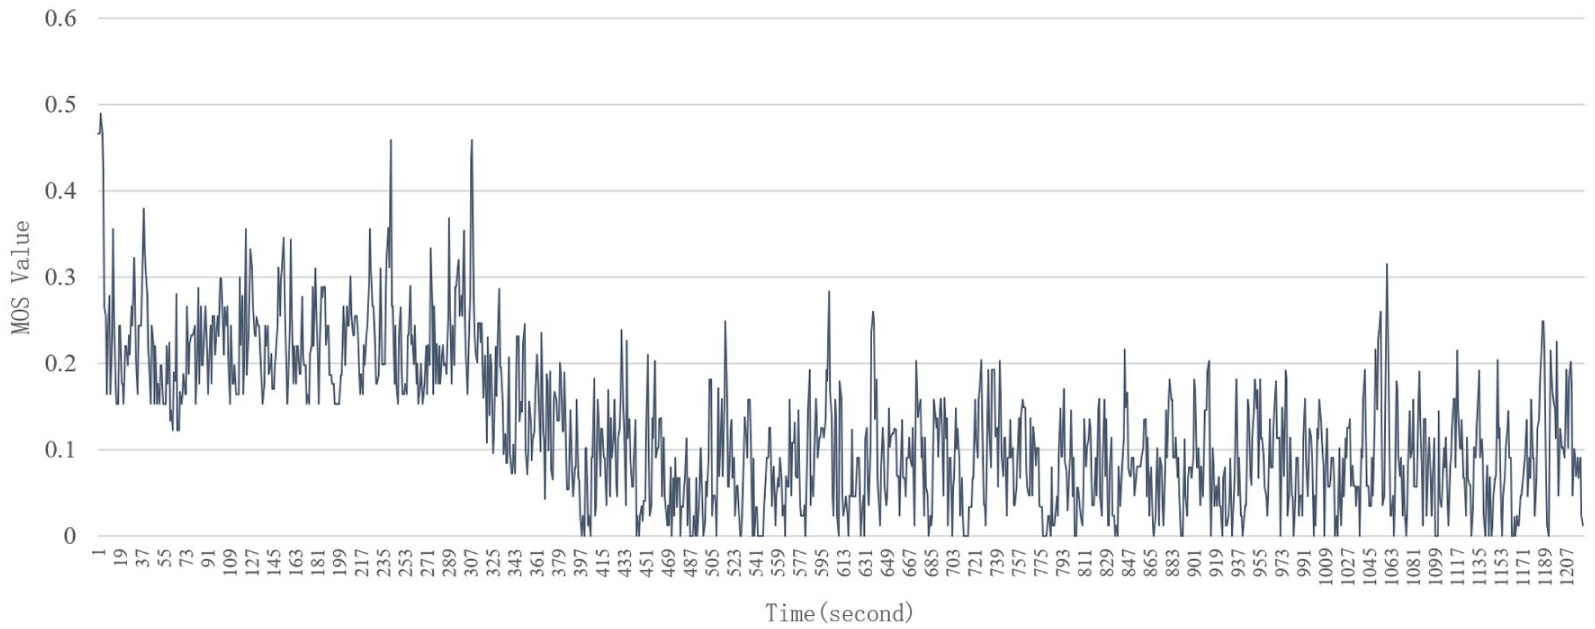
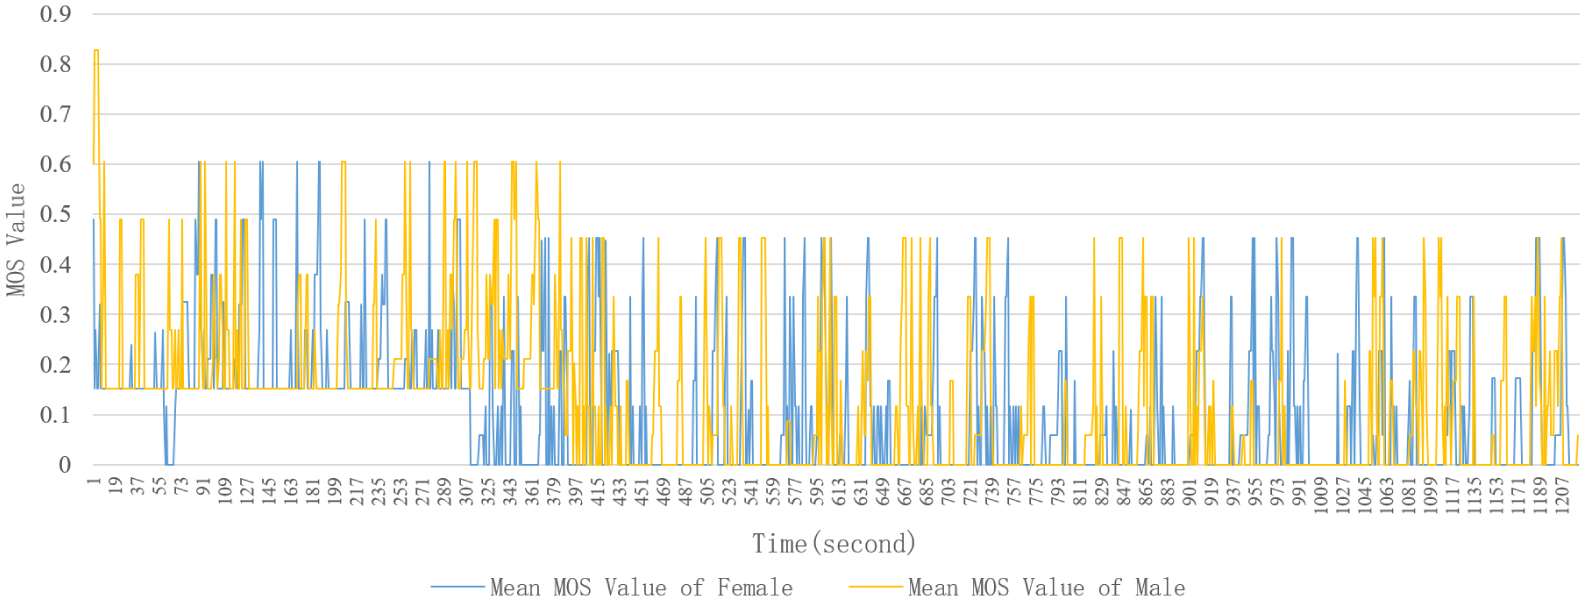
Research result 3
In the health measurement experiment of urban block sample 3 in cold climate, there are mainly four peaks and four valleys in the average MOS (Figure 13), and the peak value and number of MOS in men are significantly higher than those in women, and the number of valleys in the average MOS in women is relatively large (Figure 14). The distribution of peak and trough values of MOS mean shows that distinctive historical buildings, rich commercial living atmosphere, and orderly block space, especially the dealership space, can alleviate the insecurity caused by the environmental characteristics of blocks such as slippery roads and non-motor vehicles passing through to some extent. The narrowing or even disappearing of pedestrian spaces such as sidewalks will bring a greater degree of stress stimulation to block users. As a negative environmental factor, the influence of dim vision on MOS value is manifested in amplifying the positivity or negativity of surrounding environmental elements, so the adverse reactions caused by negative environment can be transformed by adding lighting facilities (Table 4).
MOS mean value of urban block sample 3 in cold climate.
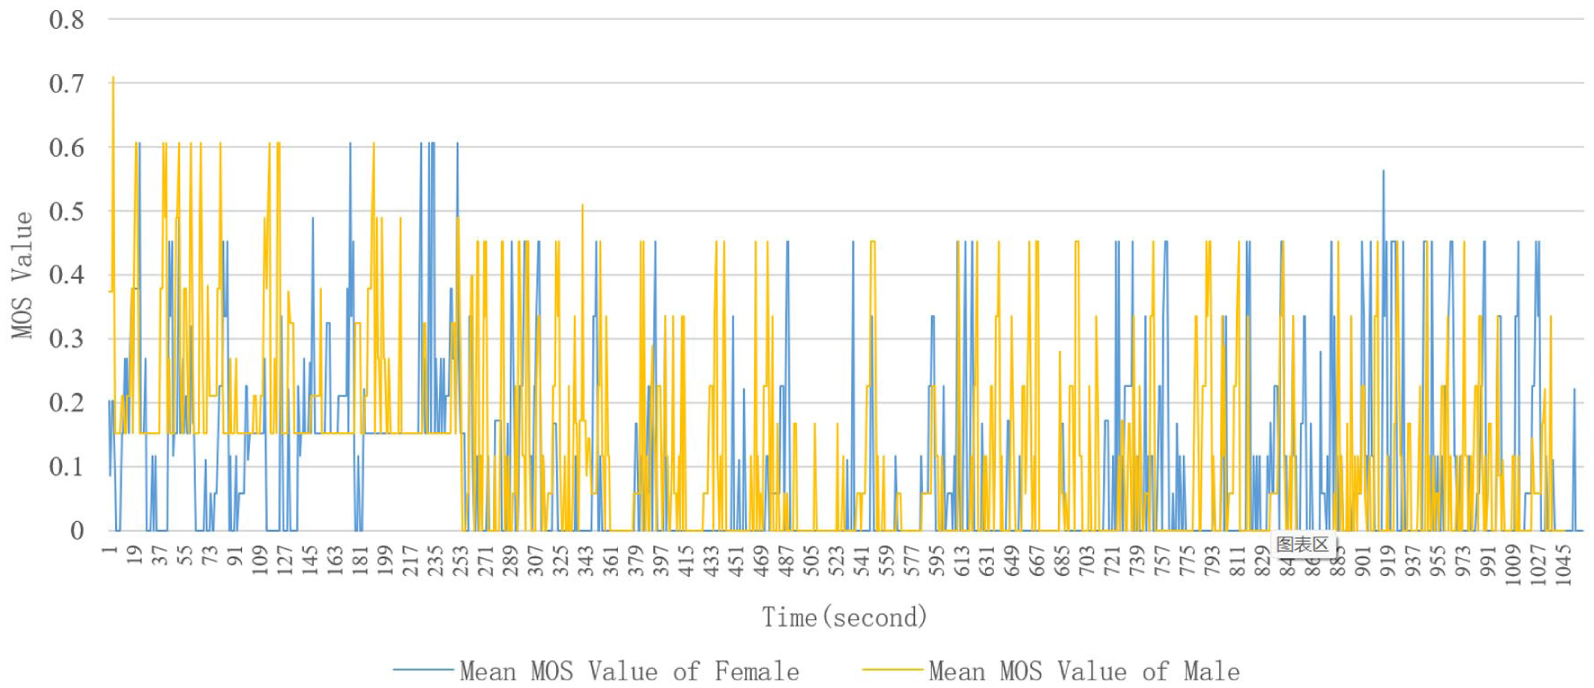
Comparison of male and female mean MOS values in cold climate of urban block sample 3.
Analysis of urban block spatial characteristics based on MOS special values in cold climate of urban block sample 3.
Research result 4
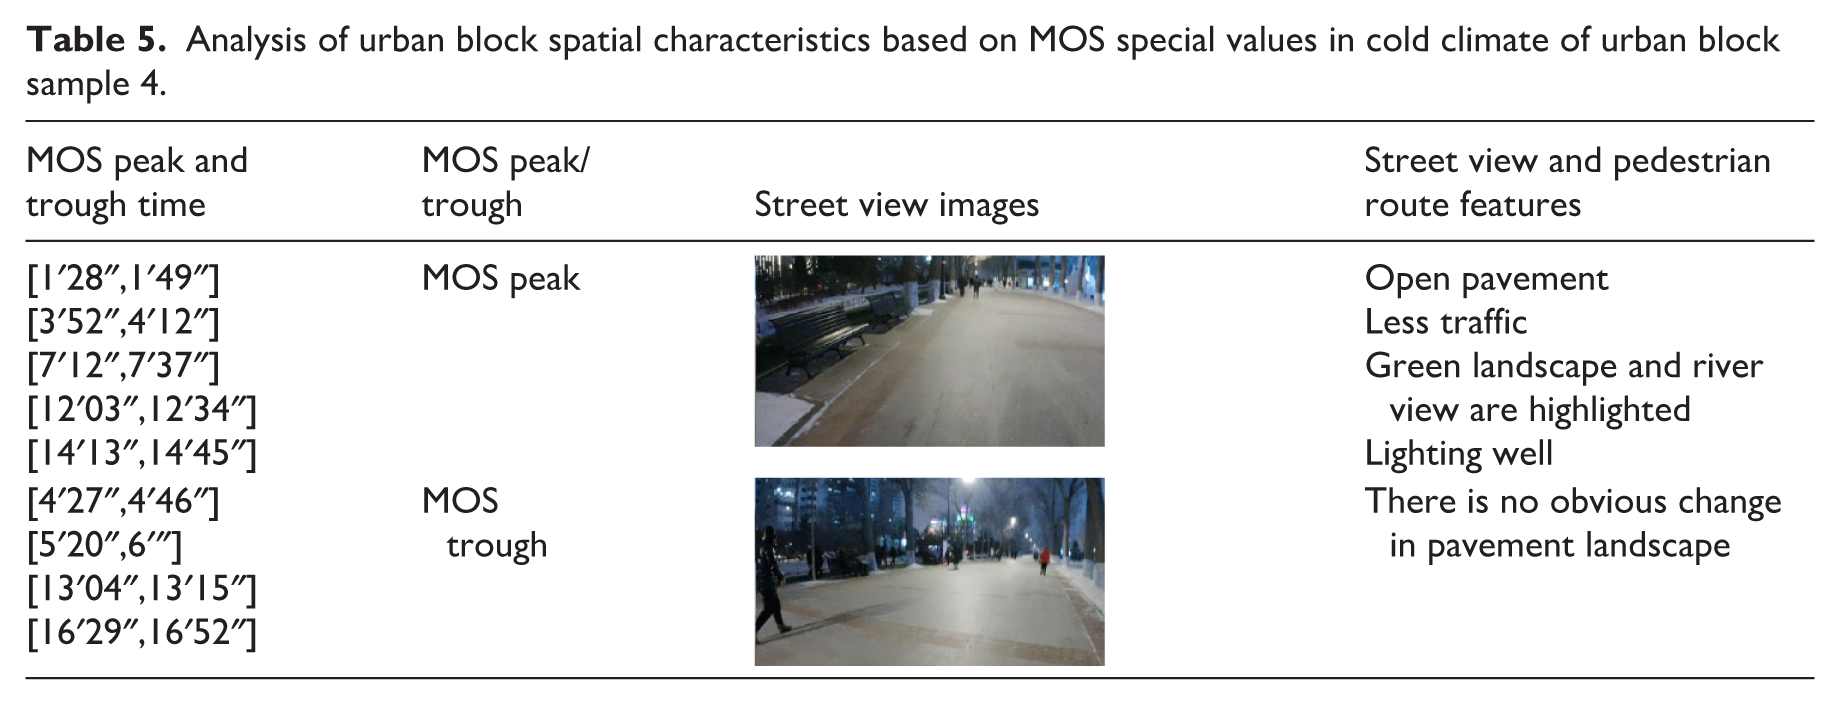
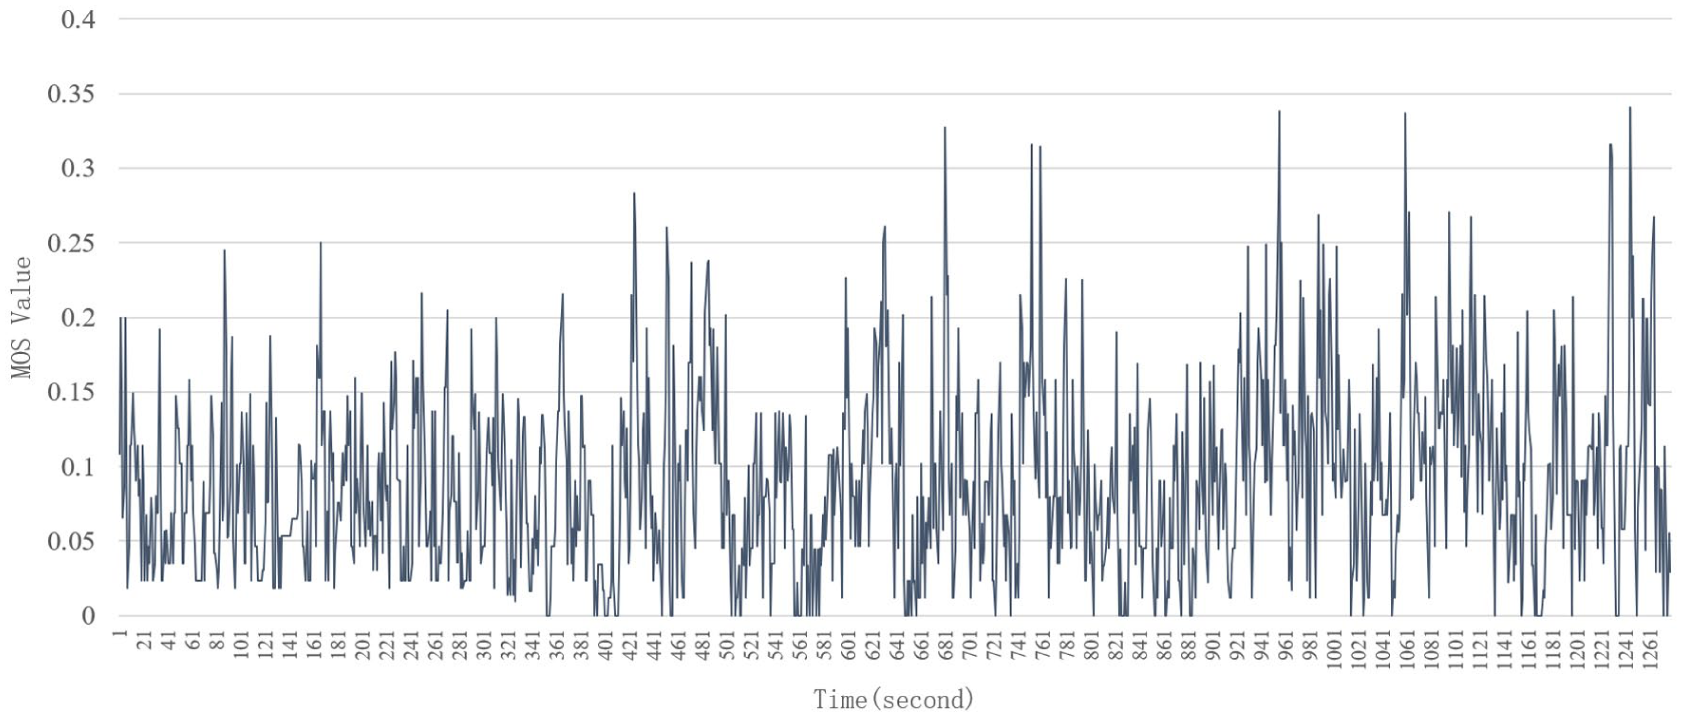
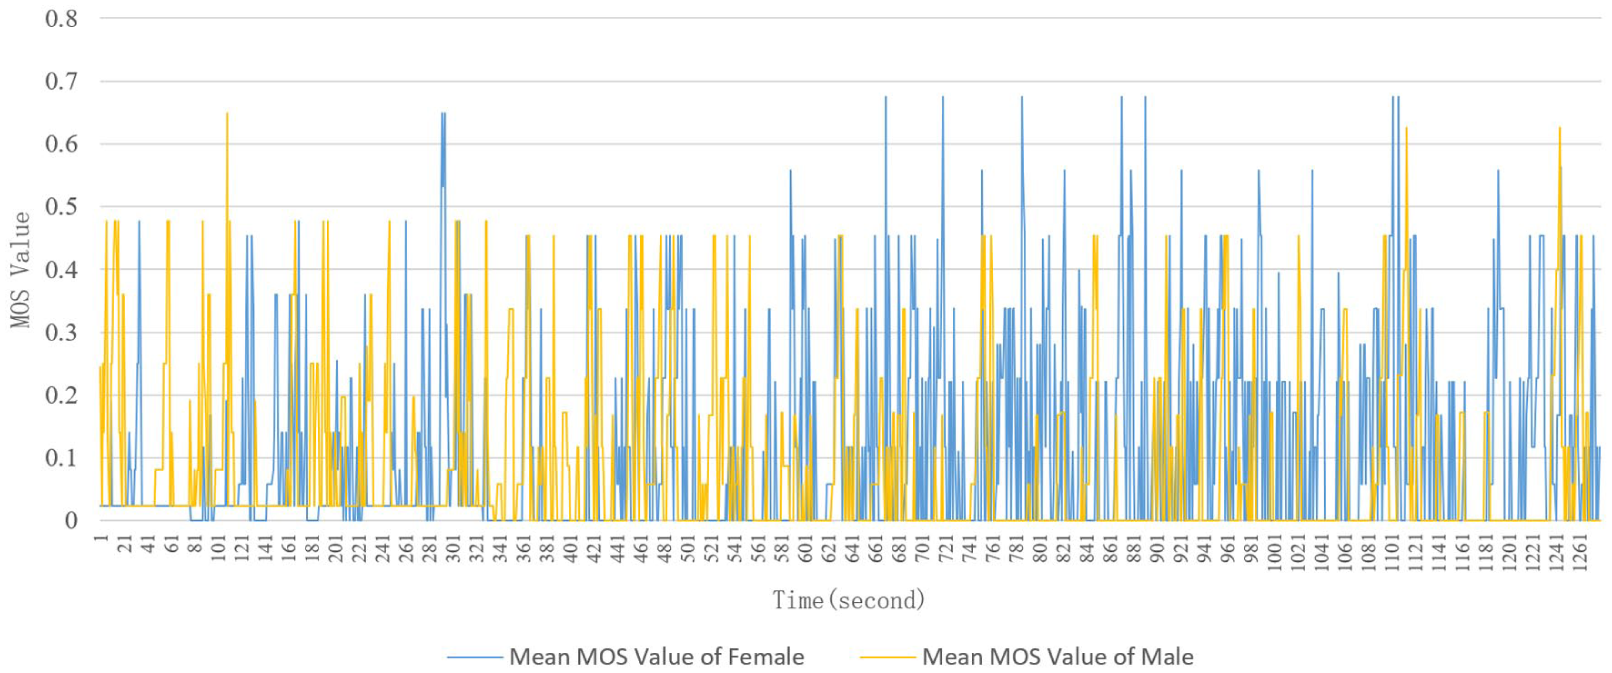
In the health measurement experiment of urban block sample 4 in cold climate, there are mainly five peaks and four trough values in the mean MOS value (Figure 15), and the peak values and numbers of MOS for women and men converge (Figure 16). The distribution of peak and trough values of MOS mean shows that good landscapes often get more emotional feedback, but if the landscape lacks rhythm and change, it is easy to reduce the stress level of human body (Table 5).
MOS mean value of urban block sample 4 in cold climate.
Comparison of male and female mean MOS values in cold climate of urban block sample 4.
Analysis of urban block spatial characteristics based on MOS special values in cold climate of urban block sample 4.
Research result 5
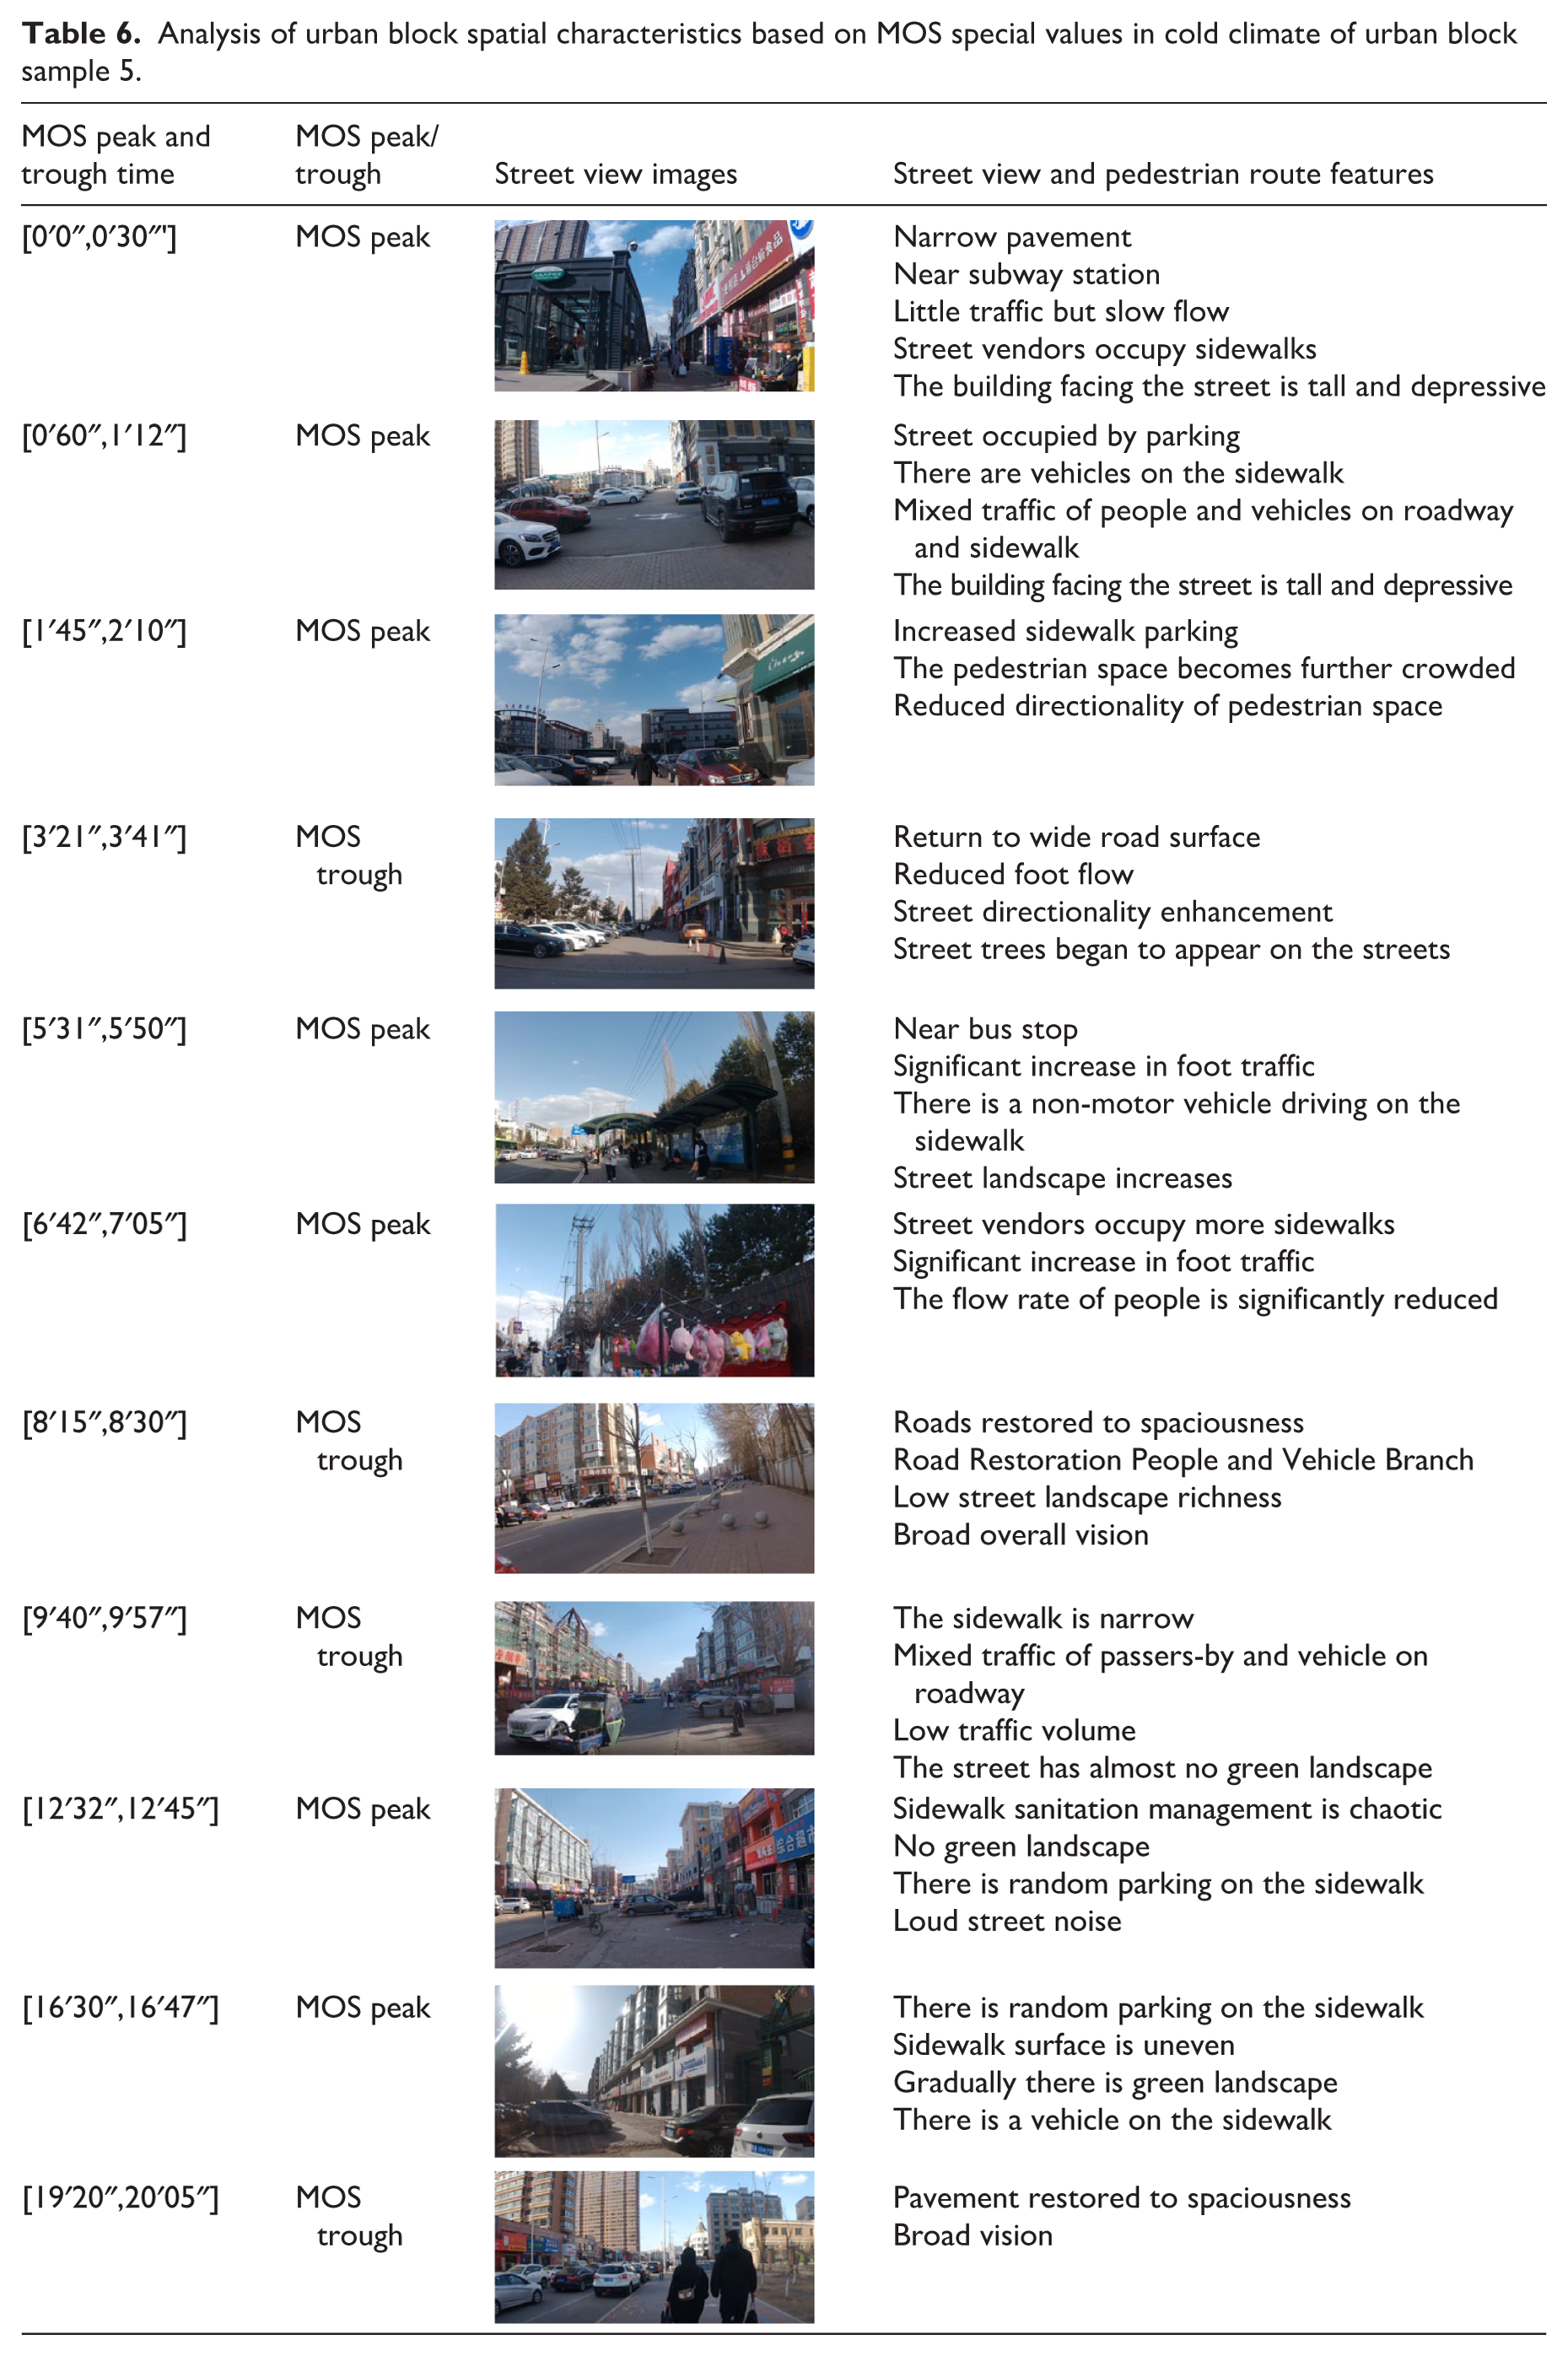
In the health measurement experiment of urban block sample 5 in cold climate, the average MOS mainly has seven peaks and four valleys (Figure 17). Although the number of MOS peaks and valleys of women and men converges, the average MOS and change range of men are significantly greater than those of women 7 minutes before the experiment (Figure 18). The distribution of peak and trough values of MOS mean indicates that chaotic sanitation and parking management of sidewalks increases pedestrian emotional stress and increases neurological exhaustion; after a long period of nervous tension, even if pedestrians get positive feedback such as the increase of greening landscape, the diversion of people and vehicles, the broadening of road surface and vision in the later period, the physiological signal stress level will no longer increase, but may gradually decline (Table 6).
MOS mean value of urban block sample 5 in cold climate.
Comparison of male and female mean MOS values in cold climate of urban sample 5.
Analysis of urban block spatial characteristics based on MOS special values in cold climate of urban block sample 5.
Analysis and summary of health performance measurement of urban blocks based on cold climate
Generally speaking, although people of different genders have different emotional perceptions in different urban blocks in the cold climate of Harbin, the environmental elements of urban blocks are related to health performance, and the specific effects can be divided into the following three situations:
• First, in a certain period of time, both positive and negative environmental factors of an urban block can cause a stress reaction in physiological signals in the urban block. Positive urban block environmental elements include distinctive urban block building facade, public space, greening facilities, street width, and building height with appropriate proportion, while negative urban block environmental elements include parking encroachment on pedestrian space and rest space, large road slope, and convergence points of people and vehicles. However, the negative effects of wind speed and snow need to be considered in cold climates.
• Second, the repetitive landscape often causes fatigue in urban block users, which is reflected in the health performance. After the human physiological signal is continuously stimulated by positive or negative urban block environmental elements without obvious change, the sensitivity of human physiological signal will be reduced, and it will no longer give immediate feedback to urban block environmental elements.
• Third, the spatial recognition of blocks in cold climates is reduced. Compared with the aesthetic color matching of spatial elements, the walking safety, thermal comfort, transportation convenience, and other elements of blocks are more concerned by residents. In addition, cold climate often make people maintain a certain degree of alertness, so the fatigue reflected by health performance shows that the block gives users a certain sense of security to a certain extent.
Discussion and conclusions
Discussion
At present, there is a good prospect that the urban public health environment on the scale of urban blocks can be optimized, as shown in the following possibilities:
(1) At the analysis level, the spatial scale of blocks under the guidance of healthy cities needs to be clarified urgently. Cities often take administrative areas as the standard for dividing urban block space, which makes it difficult to reflect the historical and cultural characteristics and usage of specific urban block environment, and to ensure the applicability of the main population of the optimized design of block environment.
(2) At the design level, the public health of urban blocks needs to be quantified urgently. At present, the healthy development goal of urban blocks design is mainly based on macro qualitative development requirements, which makes it difficult to cover the multi-dimensional, multi-factor, and multi-demand characteristics under the coupling of public health and block space, and to quantify and control the public health of urban blocks.
(3) At the level of the design-implementation mutual response, the urban block public health feedback and evaluation system needs to be enriched urgently. The existing public health evaluation at the spatial level is mainly divided into objective evaluation of physical environment and subjective evaluation of crowd spatial perception interviews. Objective evaluation focuses on reflecting the livability of an ideal state at the physiological level and lacks the insight of the human perspective. Subjective evaluation focuses on the subjective feedback of the crowd after implementation, which makes it difficult to accurately evaluate the spatial quality and comfort of the urban block, and it is difficult to feed back the health performance of the unbuilt environment, which is not conducive to managing the multi-demand trade-off involved in block design.
(4) At the implementation level, urban blocks urgently need to deal with the impact of seasonal characteristics on public health: as a direct factor affecting human health, seasonal climate has become a global public health challenge, and the impact of seasonal factors, especially the cold season, on urban blocks and their public health lacks in-depth discussion. Therefore, it is feasible, necessary, and urgent to strengthen the role of blocks in promoting public health.
In this study, the health performance measurement of blocks in cold climate and cold areas is based on the MOS algorithm, and the optimization strategy of block health performance in cold climate in cold areas can be further proposed based on human factors data detection. Specifically, there are four main ways to optimize the health performance of blocks in winter cities with human factors data as the quantitative standard: First, in accordance with experimental results 1 and 2 and experimental summary 1, make full use of natural elements and buildings to block wind and flying snow, optimize the thermal comfort of blocks, and improve the ability of block users to withstand the cold climate. Secondly, in accordance with experimental results 2 and experimental summary 1, increasing landscape in such as way as to make people feel good can improve people’s health performance and reduce the health performance differences caused by individual spatial feelings differences. Thirdly, in accordance with experimental results 1, 3, and 5 and experimental summaries 1 and 3, negative block environmental elements that do not affect travel can be appropriately added in road sections with traffic congestion, mixed traffic of people and vehicles, or large traffic flow. Fourthly, in accordance with experimental results 3 and the experimental summary 3, traffic islands, bus stops, crosswalks, and other areas where people and traffic flow are intertwined are all areas with large fluctuations in health performance. In this regard, in addition to the waiting time of signal lights, the possible interference of people flow caused by left-turn traffic, and the size of bus waiting crowds, cold urban blocks also need to consider the safety of vehicles in cold climates, such as road icing and traffic vision.
In addition, in the process of optimizing the health performance of the block samples, the perception of subjects of a specific gender can be selected as a reference according to the environmental characteristics of the neighborhood. The feedback of different gender structures on the health performance of sample blocks shows that in cold climate, males are more sensitive to the changes of health performance caused by seasonal characteristics, such as slippery road surface, snow, and strong wind, and the corresponding MOS values fluctuate greatly, while they show relatively positive feedback on the blocks with traffic congestion and high traffic density. In contrast, women’s MOS feedback on this kind of walking unfriendly factors is relatively stable, but they show high MOS value feedback on block elements rich in historical and cultural connotation, harmonious and inclusive atmosphere, rich landscape or sense of order, and have significant negative feedback on walking insecurity caused by occupation of walking space and traffic disorder. Therefore, it can be speculated that if male subjects are selected to participate in the comparative analysis of seasonal characteristics of health performance in cold cities and hot or warm cities, they may get more significant feedback. When discussing the health performance problems caused by urban human activities and spatial planning and design, women may be the better choice as subjects.
Conclusion
This study takes Harbin, a typical winter city, as an example. Based on human factors data detection, the physiological stress response score is matched with GPS data according to time series, and the evaluation frame of “block space–health performance” is established by MOS algorithm. Based on the evaluation frame, the optimization strategy of block space–health performance in winter cities is proposed.
Through experiments, this study can draw conclusions:
(1) In a cold climate, newly built blocks, commercial blocks, and traffic station blocks have relatively large people and vehicle flow, and the traffic order, traffic flow and velocity, sidewalk snow degree, and vehicle encroachment degree in the corresponding areas are the main factors affecting the health performance of block users. The health performance of older urban blocks is influenced by the richness of green landscape and public space. The health performance of park blocks is affected by the richness of landscape changes.
(2) Positive or negative urban block environmental elements do not necessarily improve or reduce the emotional feedback of urban block users. It is necessary to consider the combination and richness of urban block environmental elements spatially, and the influence duration of urban block environmental elements on urban block users temporally. Therefore, we can consider extracting negative urban block environmental elements and their influence radius in space by tracking the changes of physiological stress response.
(3) In a cold climate, the focus of the health performance optimization strategy of cold urban blocks should be wind environment and thermal comfort, and pedestrian safety and street orientation, and the design of positive environmental elements should be carried out based on both.
The contribution of this study is mainly in two aspects: (1) With respect to methodology, based on existing research, we propose an evaluation and measurement method for spatial health performance of cold urban blocks, so as to promote easier measurement of the health performance of blocks. (2) As regards content, by establishing the mapping of users’ perception of spatial design, and optimization strategy for spatial health performance of blocks in winter cities in cold climate is proposed, which provides a reference for optimization practice when improving spatial quality such as comfort, recognition, and sharing of blocks in winter cities.
This study still has the following limitations: (1) The comparative study of urban block health performance in winter cities in cold climate and non-cold climate needs to be further explored. (2) The selected urban block sample cannot completely cover all types of urban blocks in winter cities. (3) Considering the safety of walking in cold season, the physiological stress response tracking experiment only studies the urban block space with a total walking time of less than 30 minutes, and the health performance obtained is limited.
Footnotes
Funding
The authors disclosed receipt of the following financial support for the research, authorship, and/or publication of this article: National Natural Science Foundation of China Youth Project “Research on the Impact Mechanism and Optimal Design Method of Spatial Health Performance of Cold Urban Blocks Based on Quantitative Analysis of Morphological Characteristics” (Project No.: 52308018); China University Industry-University-Research Innovation Fund “Research on Practical Application of Spatial Planning and Design Generation of Urban Pedestrian Blocks Based on Artificial Intelligence Assistance” (Project No.: 2024SE031); Special Fund for Basic Scientific Research Business Expenses of Central Colleges and Universities “Comparative Study on the Aesthetic View of Chinese and Western Urban Block Form Design” (Project No.: HITHSS.202312)
Declaration of conflicting interests
The authors declared no potential conflicts of interest with respect to the research, authorship, and/or publication of this article.