
Abstract
Activity-space segregation is a new topic in urban segregation studies. The existing literature did not fully explain its mechanisms. In this study, we tested the hypothesis whether activity-space segregation is influenced by individual daily activity patterns. The dynamic ambient population that individuals interact with was identified with mobile phone big data and the individuals’ experienced segregation at the activity space was measured with travel survey small data. This study compared the differences in individuals’ daily activity patterns by different social-economic groups and examined the influence of the spatiotemporal pattern on the activity-space segregation. It has found that: (1) The degree of segregation in non-mandatory activity spaces during the day is less than that in mandatory activity spaces, and the degree of segregation in residence is the highest. (2) Disadvantaged populations have less leisure time and smaller activities space, and they are subject to greater time and space constraints. Spatiotemporal patterns affect the degree of an individual’s segregation. Those who have less leisure time and shorter travel distances experience higher activity-space segregation. This study has both theoretical and practical significance. The social interaction in non-mandatory activities is very important for decreasing activity-space segregation. It facilitates scientific decision-making for the government.
Introduction
Spatial segregation is a classical topic in the human geography research. It has been extensively discussed particularly in recent years. With the outbreak of COVID-19, the conflict between different races, ethnics, and religions has been sharpening (Bonaccorsi et al., 2020, 2021; Ellis et al., 2004; Khanijahani and Tomassoni, 2022; Yang et al., 2021). For example, the ‘Black Lives Matter’ movement is a prominent problem of the long-term racial segregation in the United States. The mainstream of the spatial segregation research takes the residential places as the spatial context. However, the segregation in other places where leisure and maintenance activities happen is ignored (Wong and Shaw, 2011). People’s daily activities and face-to-face communication also take place in workplaces and public places such as streets, parks, and shopping malls. The increase of mobility enhances the difference between home activities and out-of-home activities. With the witness of conflict between different people in the public space, researchers are aware of the defect caused by ignoring social contact outside residential places in segregation studies (Park and Kwan, 2018; Tammaru et al., 2016; Wang and Li, 2016). Biased or misleading results would be produced if segregation outside residential places is ignored (Ellis et al., 2004).
With the rise of location-based service and the rise of behavioral analysis, segregation research from the perspective of the activity space has received extensive attention (Yao et al., 2019). A new trend of individual-based and activity-space-based segregation has emerged (Wong and Shaw, 2011). Researchers begin to apply spatiotemporal and behavioral analysis to the traditional geography paradigm, and their interest has shifted from static residential-space segregation to dynamic activity-space segregation (Kwan, 2013). In general, these studies have discussed the activity-space segregation from three aspects: the spatial pattern of the activity-space segregation (Järv et al., 2015; Le Roux et al., 2017; van Ham and Tammaru, 2016), the methodology of the measurement (Park and Kwan, 2017; Schnell et al., 2015; Wong and Shaw, 2011; Yao et al., 2019), and the influencing factors (Silm and Ahas, 2014a; Silm et al., 2018; Tan et al., 2019; Wang and Li, 2016; Wang et al., 2012; Zhang et al., 2019a). In addition, recent studies have begun to discuss the segregation of children at schools, where school segregation is higher than in residential places (Boterman et al., 2019; Logan and Burdick-Will, 2017; O’Keeffe et al., 2021). Considering the complexity and particularity of school segregation, this study not only includes it in the concept of segregation but also discusses the segregation of the adult population.
There are two research paradigms of the activity-space segregation, the place-based approach and the people-based approach. The place-based approach derives from conventional residential segregation research. It emphasizes the social composition of people and their dissimilarity in a spatial unit (Li and Wang, 2017). The place-based approach is challenged by the modifiable unit areal problem (MAUP) that the arbitrary defined areal unit may lead to error. To solve this problem, the people-based approach conceptualizes the individual’s exposure to the social environment. The people-based approach describes the physical, social, and cognitive segregation that an individual has experienced in space and time. It is advantageous in measuring the exposure more accurately for each individual subject (Kwan, 2009).
However, the studies of the activity-space segregation are still at the beginning stage (Zhang et al., 2019a). Individuals’ experience of activity-space segregation is not fully captured because of data limitations. How to identify the dynamic social context that individuals are exposed to is of vital importance. Unlike residential segregation, in which the social context is static and can be derived from the census dataset, activity-space segregation relies highly on dynamic population or large-scale trajectory dataset. Accessing cellphone signaling data provides a good opportunity to identify the dynamic social context. Also, only a small number of studies focus on the explanation of activity-space segregation. The theoretical framework of the underlying mechanism of the activity-space segregation is still incomplete.
This study follows the people-based approach. It emphasizes the individual’s daily activity pattern on his/her activity-space segregation, and helps pay attention to disadvantaged groups and improve social equality. For this reason, this study aims to construct a research framework to uncover the mechanism of activity-space segregation from the perspective of the individual daily activity pattern. It applies a fusion of phone signaling, big data, and travel survey small data to reveal the experience of individual’s daily activity-space segregation.
Through in-depth analysis of the logic behind activity-space segregation, the study contributes to the social segregation theory. The study is also significant in practice that it helps the government to take measures to increase social equity and integrate disadvantaged populations into a better life.
Literature review
Data collection of the activity-space segregation studies
Studies of the activity-space segregation rely very much on the quality of collected data. Unlike residential segregation, where researchers can obtain data from the census, activity-space segregation requires data with high temporal resolution or detailed movement trajectories. In empirical studies, researchers have generally applied two sources of data, the big dataset of mobile phones and social media, and the small dataset of a travel diary (Wang et al., 2018).
The big dataset, such as mobile phone data and social media data, was widely used in the activity-space segregation researches. Müürisepp et al. (2022) reviewed activity-space segregation using big data. They summarized their research approach as a people, place, and mobility flows perspective, and summarized their data source as traditional and novel big data sources. A three-step methodological framework was proposed: data source – activity space measurement– segregation measurement. Research groups from the University of Tartu in Estonia have published a series of studies using mobile phone data. These studies focused on the ethnic segregation of Estonian and Russian in the activity space. Significant ethnic differences were found in the geographical distribution of activity location, extent of the activity space, mobility, and time use (Järv et al., 2015; Silm and Ahas, 2014b, 2014a; Silm et al., 2018). Using mobile phone data, the Uppsala group (Östh et al., 2018) found that many areas still have high activity-space segregation when considering daily mobility. Activity-space segregation of people in the outskirt areas is close to the night-time segregation because of low mobility. Dannemann et al. (2018) applied mobile phone data to measure the segregation during working hours. People in the same community have strong home-work ties. This study interestingly proposes a new method of describing the urban social spatial structure. Using mobile phone data in Singapore, Xu et al. (2019) revealed the segregation pattern in social space and physical space. The study found that the segregation of wealthy classes is higher in both social and physical space, and the communication intensity is influenced by homophily and distance decay. Social media data from sources such as Twitter can also be used to reflect the activity-space segregation. For example, Wang et al. (2018) from Harvard University collected 650 million geotagged tweets across 50 American cities. They found that residents from black or Hispanic neighborhoods are less exposed to non-poor or white middle-class neighborhoods, and white poor people are isolated from non-poor white neighborhoods. The mobility does not significantly reduce the isolation of disadvantaged population. Also based on tweeter data, they explored the social integration of American cities, and found that the connectedness of cities depends on a few neighborhoods, and cities with denser population, higher cosmopolitanism, and less segregation have higher connectedness (Phillips et al., 2021)
The activity-space segregation research also requires a detailed investigation of individuals’ personal experience, particularly the subjective perception of the segregation. Traditional travel survey has the advantage of acquiring personal socio-economic information, daily activity scheduling, and their willingness to integrate with different people. Some researchers followed the traditional interest of racial and ethnic segregation and extended the spatial context to the whole activity space. Park and Kwan (2018) applied activity-travel diary dataset of 25,810 persons to investigate the activity-space segregation among White, African American, Hispanic, and other people. Using individual spatial temporal proximity index, they found that individuals’ one-day segregation depends on where they spend their time, and segregation in the residential space is higher than in the activity space. Lee and Kwan (2011) discussed the visualization of socio-spatial isolation of Koreans in United States. The visualization did enhance the understanding of the activity-space segregation. Tan et al. (2019) and Zhang et al. (2017, 2019b) investigated the ethnic segregation at activity space of Hui minorities and Han majorities. There is notable activity-space segregation, and low income and low-level education of Hui people have a higher risk of segregation exposure. Han migrants are utility-oriented and Hui migrants seek social ties with families and ethnic bonding in their daily life. Hui migrants tend to settle down in cities with higher cultural homogeneity and less integration willingness. Recently, researchers begin to shift their interest from the traditional racial and ethnic segregation to segregation by income, education, and housing condition. Income is a direct index to measure economic difference. Considering the difficulty of acquiring personal income information, housing condition and education are used as an alternative index. Using 7 days trajectory tracking and travel diary dataset in Beijing, Zhang et al. (2019a) found that residents living in different types of housing have significant activity-space segregation, and residents in affordable housing have the smallest activity space. This finding is also confirmed by Wang et al. (2012): that the use of time and space is different for residents inside and outside privileged enclaves in Beijing. Empirical evidence from Hong Kong also has a similar finding: that people living in private or public housing have a strong activity-space segregation (Wang and Li, 2016).
Following the research paradigm from the residential segregation, traditional census dataset can also be used to identify segregation at the workplace when employment information is included in the census. Using longitudinal census data in Sweden, it found that workplace segregation for local people and immigrants is influenced by economic sector and city size rather than the residential-space context (Tammaru et al., 2016). Racial segregation at the workplace is lower than at residential places due to intergroup interaction at work. For example, native white and Mexican immigrants work in the same locations although they have substantial residential segregation (Ellis et al., 2004). Census dataset has the advantage of mapping the segregation at both residential and work places across the whole city space. However, the details of individual mobility and daily activity are not included, and the segregation in leisure and public spaces is not captured.
The large-scale travel survey is an integration of the small sample travel diary and census data. It normally investigates a sufficient large sample of respondents (5–20%) across the whole city for their socio-economic information and travel behavior. Based on a large-scale time-use survey in Tallinn, it found that the time use of leisure activity is similar for different ethnic groups, but the leisure places are segregated. The residential segregation leads to activity-space segregation since people tend to choose leisure sites close to home (Kukk et al., 2019). Farber et al. (2015) investigated the social interaction potential of white and black races in Detroit–Warren–Livonia MSA. The racial interaction is decomposed into inter-group and intra-group exposure in the space-time prism. Le Roux et al. (2017) explored segregation among people with different education levels and socio-professions in Paris. It extends the static Mosaic-like social zone into a dynamic mapping over 24 hours. The daytime segregation is lower than the night. The upper class is the most segregated group during both day and night time. The social zone structure in daytime is significantly different from that in the night.
Explanation of the activity-space segregation
Residential activity-space segregation was examined by different socio-demographic characteristics such as race, ethnic, income, and education (Ellis et al., 2004; Kukk et al., 2019; Le Roux et al., 2017; Park and Kwan, 2018; Silm and Ahas, 2014a; Silm et al., 2018). Researchers tried to provide an explanation for the activity-space segregation. First, some studies followed the framework of residential segregation to interpret the activity-space segregation (Silm and Ahas, 2014b; Silm et al., 2018; Zhang, 2011):
(1) The material gap leads to the socio-spatial gap. The limited activity space of minorities is related to the disadvantageous status of their income, education level, occupation, transportation accessibility, and other factors. These disadvantages make it difficult for minorities to enter the same activity space as the majority.
(2) Direct or indirect discrimination blocks the access of minorities to public resources, such as looking for jobs, houses, and public services. It is a barrier for minorities to integrate into the daily activity space.
(3) Minorities with similar values and cultural traditions prefer to get together. The unique traditions, values, and beliefs make them tend to interact with similar people. The contact between people based on actual contact and spatial proximity, as well as the information flowing through social networks, jointly cause the segregation of minorities. At the same time, incomplete social networks reduce the opportunities for minorities to participate in public activities and social interaction.
Second, some studies have realized the role of mobility on activity-space segregation. There is debate about the positive or negative effects of mobility. Some researchers believed that daily activities would reduce segregation. People have far more choices regarding the place of activities, and it increases the possibility to meet different people. The social environment of activity space is more heterogeneous than residential space (Wang and Li, 2016), which makes society more integrated based on the same interests rather than the same social characteristics (Silm et al., 2018). On the contrary, there are also views that mobility and accessibility constraints cause the activity-space segregation. Individuals with poor mobility are more likely to be self-isolated in daily activities (Silm and Ahas, 2014b). According to the space-time constraint theory (Shen et al., 2015), it is more difficult for people to leave the space-time prism constrained by fixed activities, thus affecting people’s social interaction and communication. Scholars (Zhou et al., 2015) believe that disadvantaged groups are subject to more serious time and space constraints, making it difficult for them to meet different groups. The argument about the positive or negative effect of mobility on activity-space segregation derives from different measurement methods and spatial scales, and both views are supported by theory and empirical evidence. Therefore, it is necessary to further investigate the impact of mobility and its affecting mechanism.
In summary, the activity-space segregation can be explained by the integration or exclusion of different people at activity space under their choice preferences and space-time constraints. However, the theoretical framework of the activity-space segregation is still incomplete. Particularly, the influencing mechanism from daily activity scheduling and its spatial temporal pattern is unclear. In terms of the temporal pattern, the time allocation would affect the starting time and duration of different types of activities. In terms of the spatial pattern, the range of potential activity space determines people’s places of social interaction. For example, individuals with a small potential activity space will be limited to a certain range of space, which makes it difficult to contact more people and causes social isolation (Zhou et al., 2015). Thus, this study will test the hypothesis that the spatiotemporal pattern will affect the segregation of the adult population, and individuals with greater spatiotemporal constraints experience greater segregation.
Study area and data processing
Study area
The study area is the inner city of Guangzhou, China. It is the largest city in South China and the capital city of Guangdong Province. In this study, data fusion of a questionnaire survey and mobile phone big data is applied. The questionnaire data involved the urbanized area of Guangzhou, including Haizhu, Tianhe, Liwan, Yuexiu, Baiyun, Luogang, Huangpu, and Panyu (Figure 1).
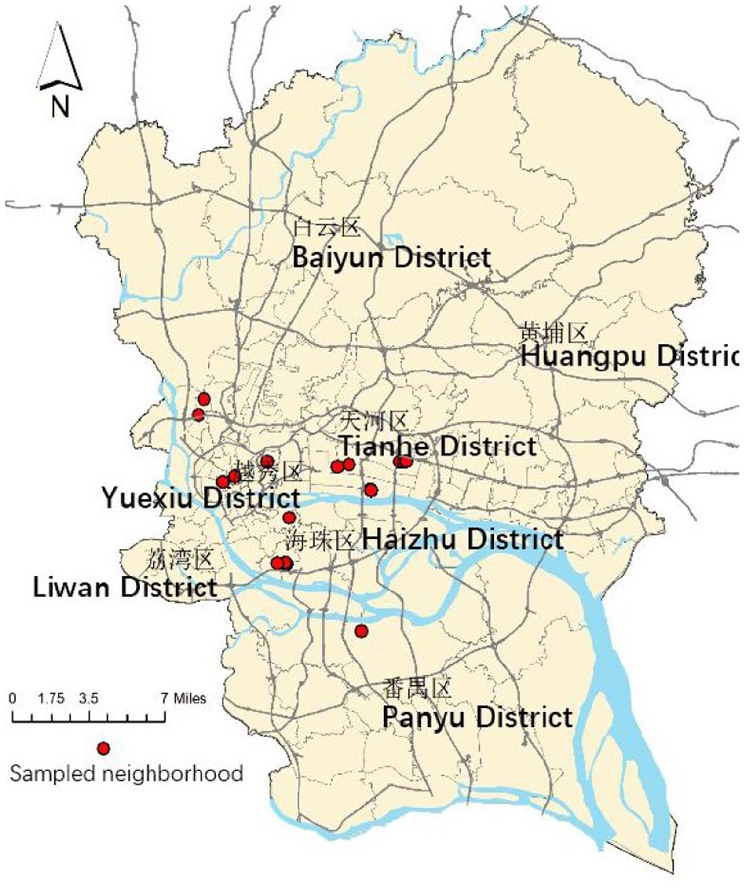
Study area and sampled neighborhood.
Data processing
This study uses a data fusion of travel survey, cellphone signaling, and census data. Figure 2 shows the data process framework.
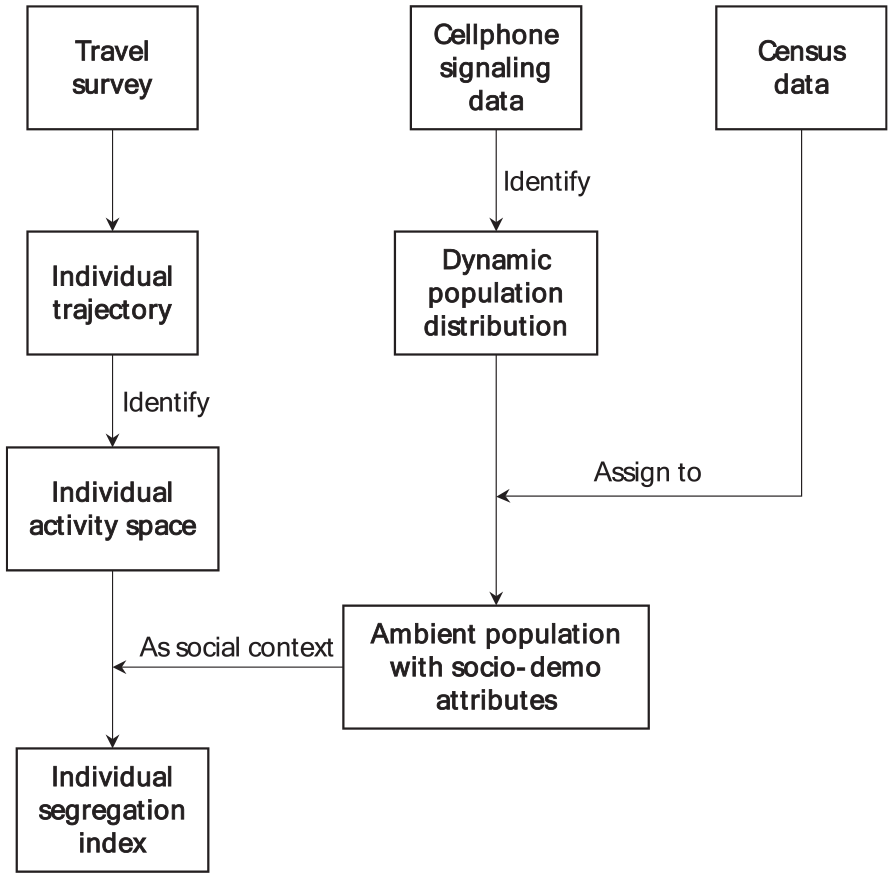
Data processing framework.
Travel survey
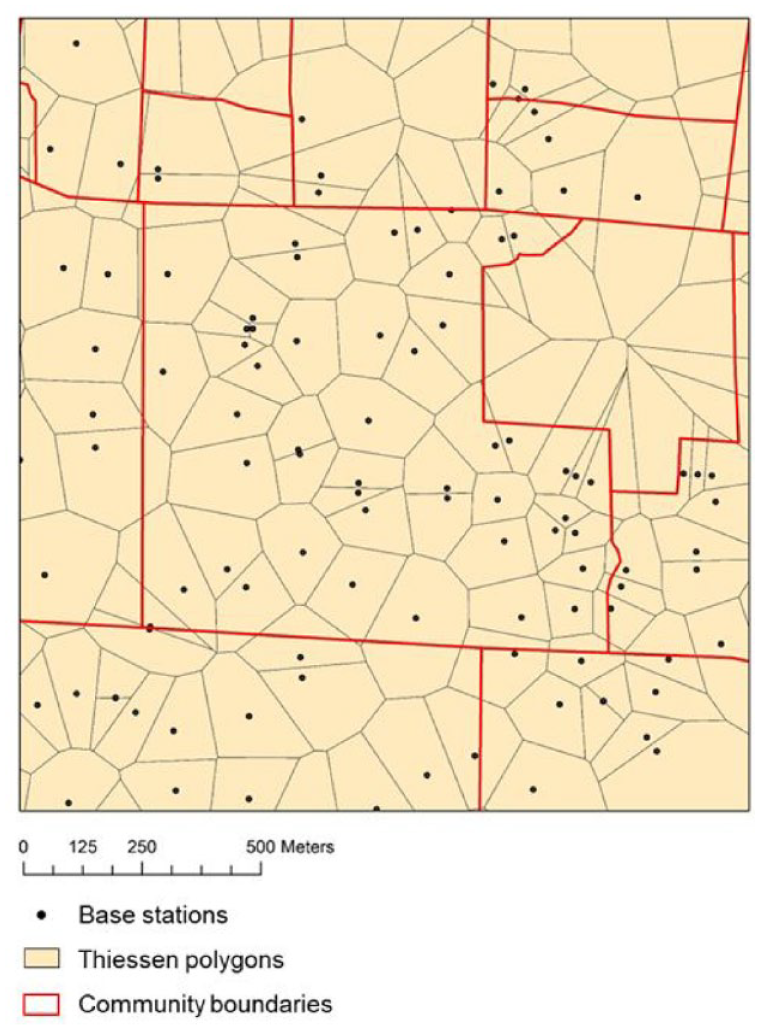
A travel survey dataset was used to measure each individual’s activity-space segregation and the daily activity patterns. It was conducted between June 24 and July 20, 2017. A stratified sampling was applied. The city was categorized into five social zones according to a factor analysis, which includes the neighborhood’s socio-demographic attributes. The social zone analysis was done before the travel survey. Eleven typical communities (Figure 1) were chosen from the five types of social zones. The respondents were randomly selected for questionnaire survey in the sampling communities. Residents aged from 18 to 60 were investigated. Travel survey questionnaire required respondents to provide basic social-demographic information, their daily life arrangement, and a activity/travel log. In total, 1003 valid questionnaires were collected. The basic information of the survey samples is shown in Table 1. The ratio of male to female is close to 1:1. The majority of the respondents are local residents of Guangzhou, the education level of senior high school and undergraduate is the majority, and the average monthly family income is 3000–7999 CNY. The sample has a good representativeness for gender balance, but the education composition is somehow over-estimated since higher educated people are a larger proportion than in the census. The aim of this study is to compare the group difference of the experienced activity-space segregation, thus we believe that the travel survey samples meet the requirement of our research design.
Statistics of sampled respondents.
The activity/travel log part of the travel survey records the activity pattern of residents in a workday and a weekend in detail. It investigates the whole trip chain and the activity type, activity location, activity time, travel time, and travel mode of each activity and trip. Considering that activities on workdays can better reflect the arrangement of daily activities, this study uses travel data on workdays for analysis.
Cellphone signaling data
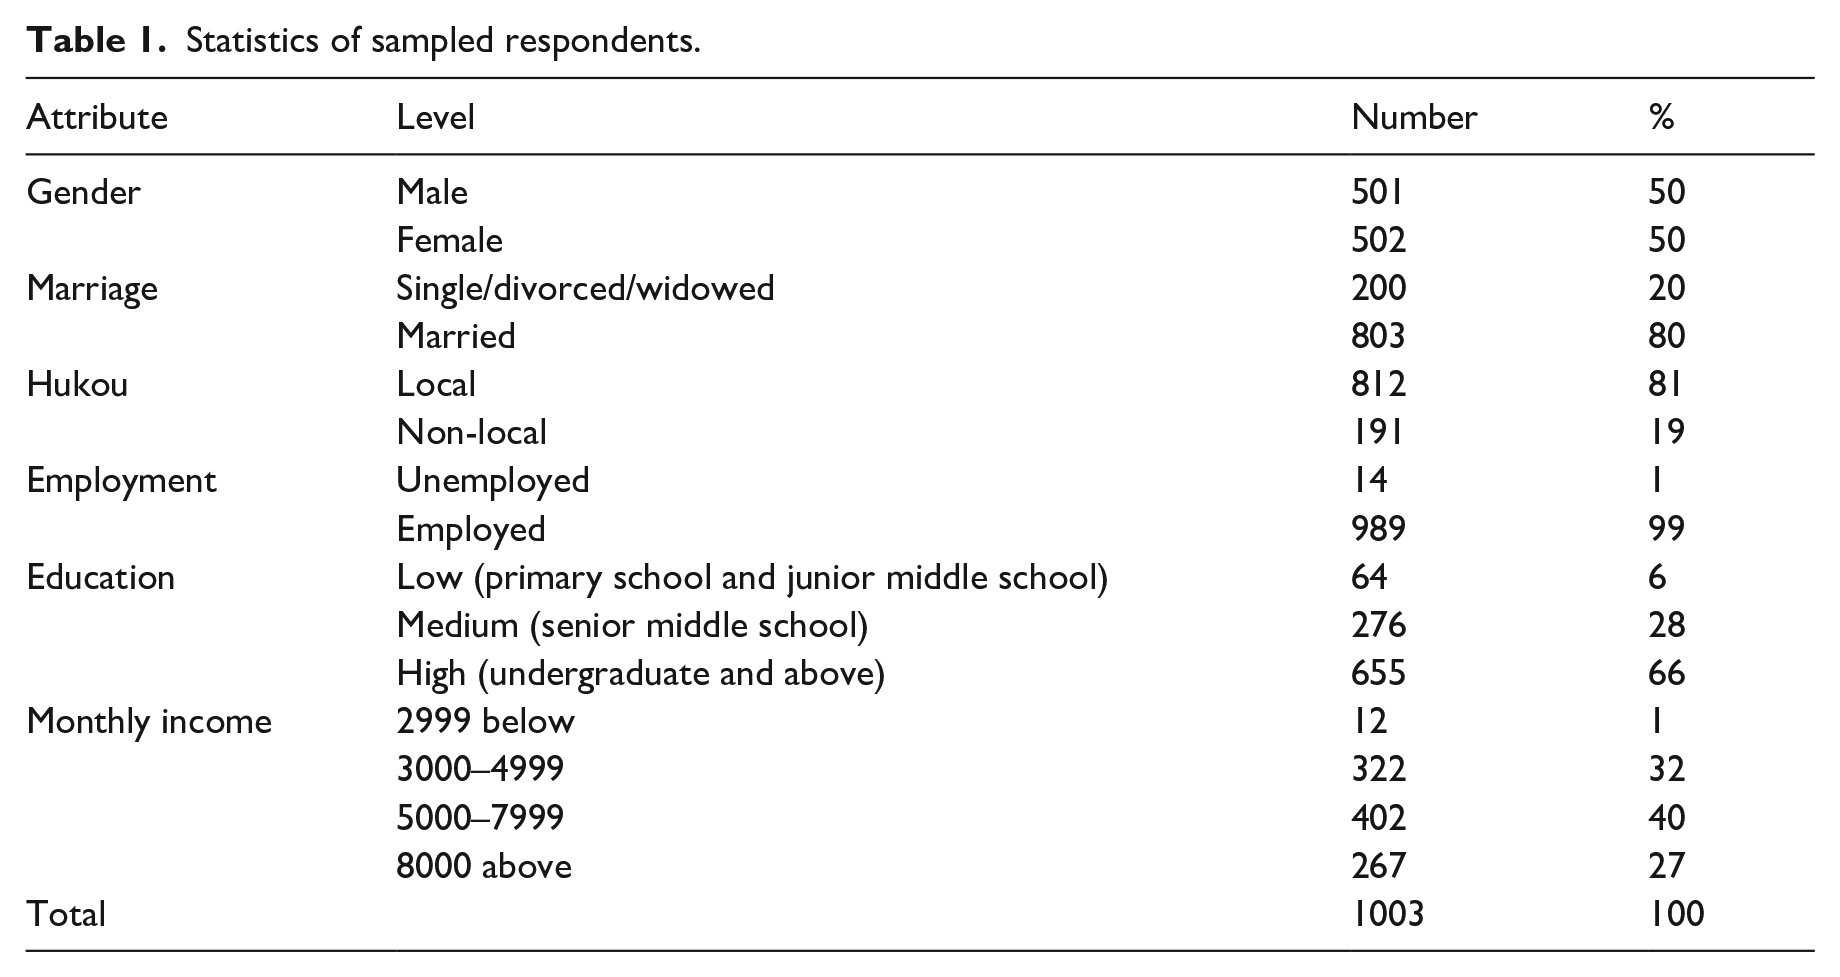
Cellphone signaling data are used to obtain the dynamic ambient population of the activity space. The dynamic population represents the social environment, which refers to the socio-demographic attributes of an activity space unit. The difference between an individual and the social environment around his/her activity is used to estimate the degree of the activity-space segregation. The activity-space segregation is a dynamic index, and it is determined by the movement of population which is constantly changing. The cellphone signaling dataset was provided by a mobile operator company. The dataset covered the whole study area. The data collected the trajectory information of cellphone users on December 28, 2016, a typical workday. The trajectory information recorded each user’s location information at 1-hour intervals. A user’s location information is represented by the location of the base station which receives the user’s signal (Figure 3). The user’s daily activity trajectory is estimated from a set of locations of the base station accordingly. A user’s trajectory was identified by the status of movement or stay. When a person stops within the range of the same base location over 1 hour, it was treated as a stay, otherwise he/she was in movement. A series of locations of a movement between two stays was defined as a piece of trajectory. The dataset includes all of the user’s movement trajectories in one day. There are about 2 million users and 30 million trajectory records in total. Each user has 10.2 trajectory records on average, and 20% of users have more than 20 trajectory records. The dataset also includes users’ socio-demographic information of gender and age. Finally, using the geographical location of base stations and by which the number of users are detected, the dynamic population distribution of the city can be obtained.
An illustration of base stations and Thiessen polygons.
Assigning socio-demographic attributes to dynamic population
This study selects education and Hukou status as indicators of the activity-space segregation. Considering the rapid development and the reform background in China, the two indicators represent the economic index and social index respectively. Although racial segregation is the traditional research domain, segregation by income and education has received increasing attention in recent research (Browning et al., 2017). Education can directly reflect people’s social status and affect their ability to access job opportunities (Le Roux et al., 2017), and education is highly corelated with a person’s income (Zhang et al., 2022).The education status has three classes in this study: low (junior middle school and below), middle (senior middle school), and high (undergraduate and above). Hukou is a household registration system in China. It identifies a person as a permanent resident of an area. In particular, Hukou differentiates residents into locals and non-locals (migrant people) of a city. The segregation by Hukou status reflects the degree of non-locals integrating into the local society. Related studies of segregation of local and migrants can be referred to in the literature (Järv et al., 2015; Silm and Ahas, 2014a; Tammaru et al., 2016; Zhang et al., 2017, 2019b).
However, the information of education and Hukou is not included in the cellphone dataset. This study applies a data fusion method to assign education and Hukou into the dynamic population data.
First, the dynamic population is identified from the cellphone data. When a user’s signal is detected by a base station at a certain time of the day, the user is seen as within the range of the base station at that time. Since the geographical format of a base station is a point, it is necessary to transform it into a polygon format to evenly distribute users within a base station’s range. A Thiessen polygon algorithm was applied. Any point within a base station’s Thiessen polygon has the shortest distance to this base station, and the polygon is regarded as the coverage area of the base station (Figure 3). Obtaining the Thiessen polygon map of a base station, we can estimate the dynamic population of the city. This study takes every three hours as a time interval, and the whole day is divided into eight time intervals: 0:00–3:00, 3:00–6:00, . . ., 21:00–24:00. The dynamic population at different time intervals is estimated by the number of people in each Thiessen polygon at that time. The dynamic population is further used to calculated the individual’s activity-space-segregation.
Second, we integrate socio-demographic attributes from the census dataset into the cellphone signaling dataset because census data have the education and Hukou information. The census dataset is from the sixth national census in 2010. The data fusion method is as follows. First, each cellphone user’s residential location is identified. A user’s residential location is identified by the location of the longest staying Thiessen polygon during 21:00 to 7:00 in one month. Second, the socio-demographic attributes (education level and Hukou) from census data are allocated to cellphone users. Since a basic census block (community) is generally larger than a Thiessen polygon, users in the Thiessen polygon are assumed to have the same proportion of socio-demographic attributes with the census block within which the Thiessen polygon is located. For example, the proportion of people with low, middle, and high education level in a Thiessen polygon is the same as the proportion of the census block which spatially contains the Thiessen polygon. Third, the socio-demographic information of the Thiessen polygon is assigned to each user in the polygon randomly. Finally, we assign the information of education level and Hukou to all cellphone users in the dataset.
Method
Daily activity classification and activity space
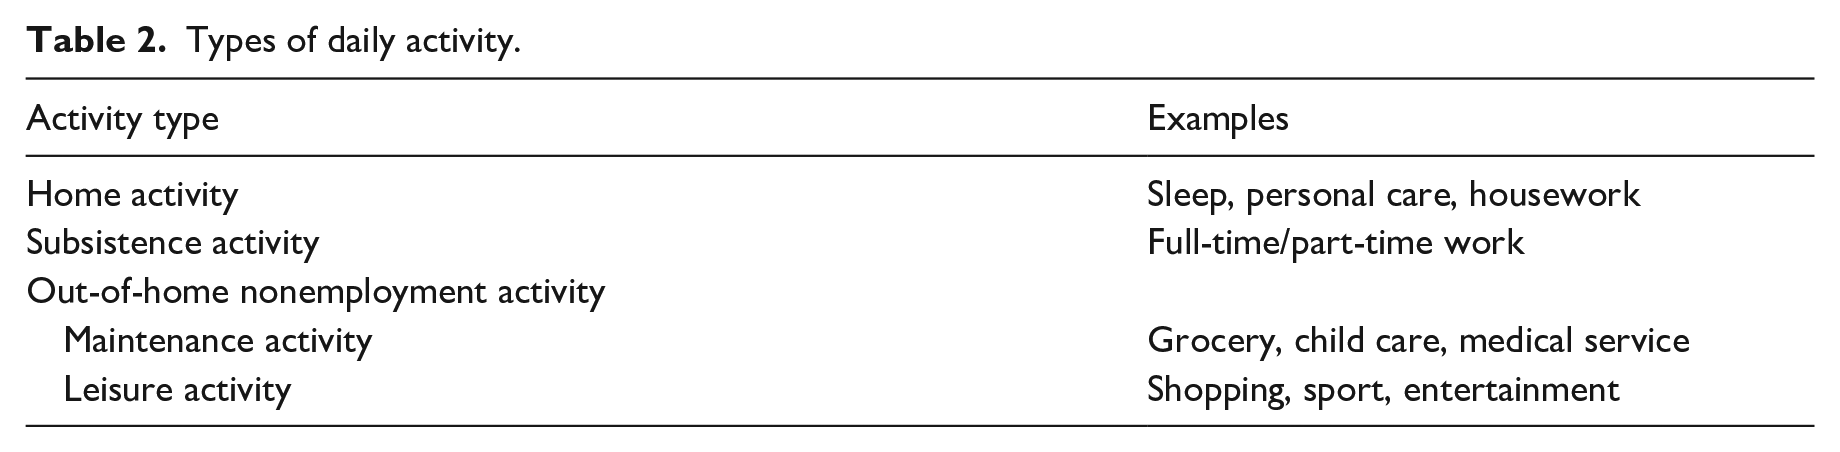
This study classifies daily activities into several sub-types to better reveal the segregation pattern at activity space. According to work by Bowman and Ben-Akiva (2000) and Golob (2000), daily activity can be divided into home activity and out-of-home activity, and out-of-home activity can be further divided into subsistence (work), nondiscretionary (maintenance, obligated or compulsory), and discretionary (leisure) activity. The types of daily activity are shown in Table 2. The subsistence activity is fixed in space and time. The maintenance activity has both fixity and flexibility feature, which is normally short in time and close to residence. The leisure activity is highly flexible, since people can freely choose the space and time of the activities. The concept of activity-space segregation emphasizes people’s decisions on activity locations and arrangement of daily activity schedule. Thus, this study focuses on the nondiscretionary and discretionary activities, and defines it as out-of-home nonemployment activities (Silm and Ahas, 2014b). The place where out-of-home nonemployment activity happens is defined as the activity space in this study.
Types of daily activity.
The activity space can be measured by different methods, such as standard ellipse, minimum polygon, density difference, shortest path, or buffer zone (Yao et al., 2019). This paper uses the standard ellipse method proposed by Kim and Kwan (2003) to measure the size of the activity space. We first identified an individual’s home and work locations as anchor point(s): if an individual is a full-time worker, he/she has two anchor points; otherwise, there is one anchor point. Two anchor points are regarded as the focal points of the standard ellipse. Recalling the space-time constraint theory, any point within the ellipse should not beyond an individual’s maximum travel distance (
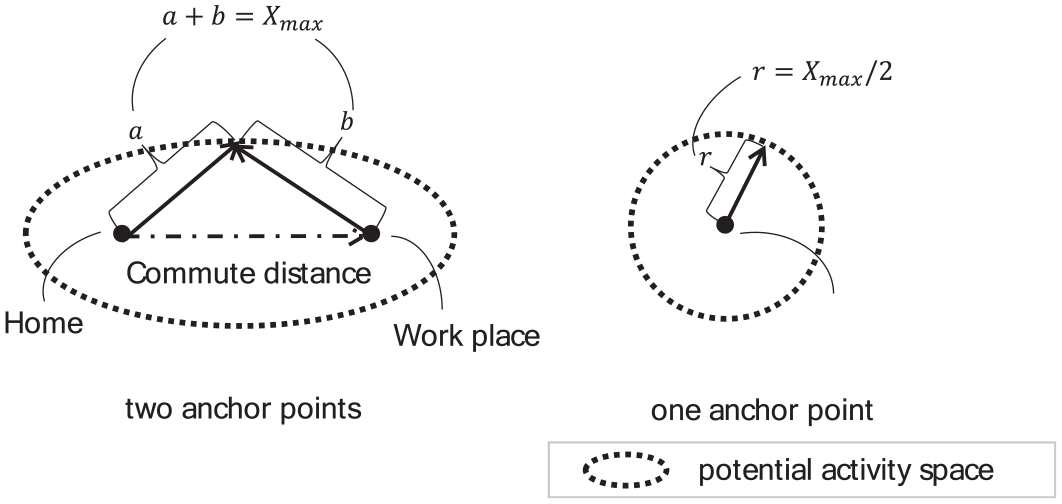
Identifying the activity space.
Segregation index
There are several indexes for the activity-space segregation. This study applies the exposure index adopted by Schnell et al. (2015). It calculates the possibility that an individual in the travel survey is exposed to the ambient population (represented by cellphone signaling data) from the same socio-demographic class in the individual’s activity space (the Thiessen polygon). Based on the degree of homogeneity between the individual and the ambient population’s socio-demography, stronger homogeneity implies a higher degree of segregation. The segregation index is given by:

where
After calculating an individual’s segregation index

where
The regression model
This study applies a linear regression model to test the correlation between the spatiotemporal pattern and segregation. The dependent variable is activity-space segregation in the out-of-home nonemployment activity space, and the segregation in a whole day is also calculated as a comparison. Activity-space segregation in day time excludes the social interaction in residential and work places. The influence of relevant factors on the segregation is analyzed by education level and Hukou respectively.
Activity-space segregation is affected by many factors, including individual personal attributes, socio-economic attributes, life stability, and social capital (Silm and Ahas, 2014b; Silm et al., 2018; Zhang, 2011). Individual personal attributes are represented by age, occupation, etc. Older people may face greater segregation due to changes in lifestyle and lack of contact with people (Silm et al., 2018). Different occupations have different contact groups due to their occupation, and it will also affect the degree of segregation (Tammaru et al., 2016). Individual socio-economic status generally includes education level, income, Hukou, and housing rent. It is generally believed that the disadvantaged population (low socio-economic status, migrant population) may have greater social segregation (Wang and Li, 2016). In addition, housing condition, including use area and the year of construction, also reflects socio-economic status to a certain extent. Life stability is generally measured by the number of years living in a same place. For thos ewho live in a place for a short time, the original social relations are broken due to leaving the originally familiar social environment, which may lead to segregation before building a new social network. Social capital mainly refers to social interaction and communication, which can directly reflect the segregation of residents. People who have a smaller social network may face greater segregation (Zhang et al., 2019a).
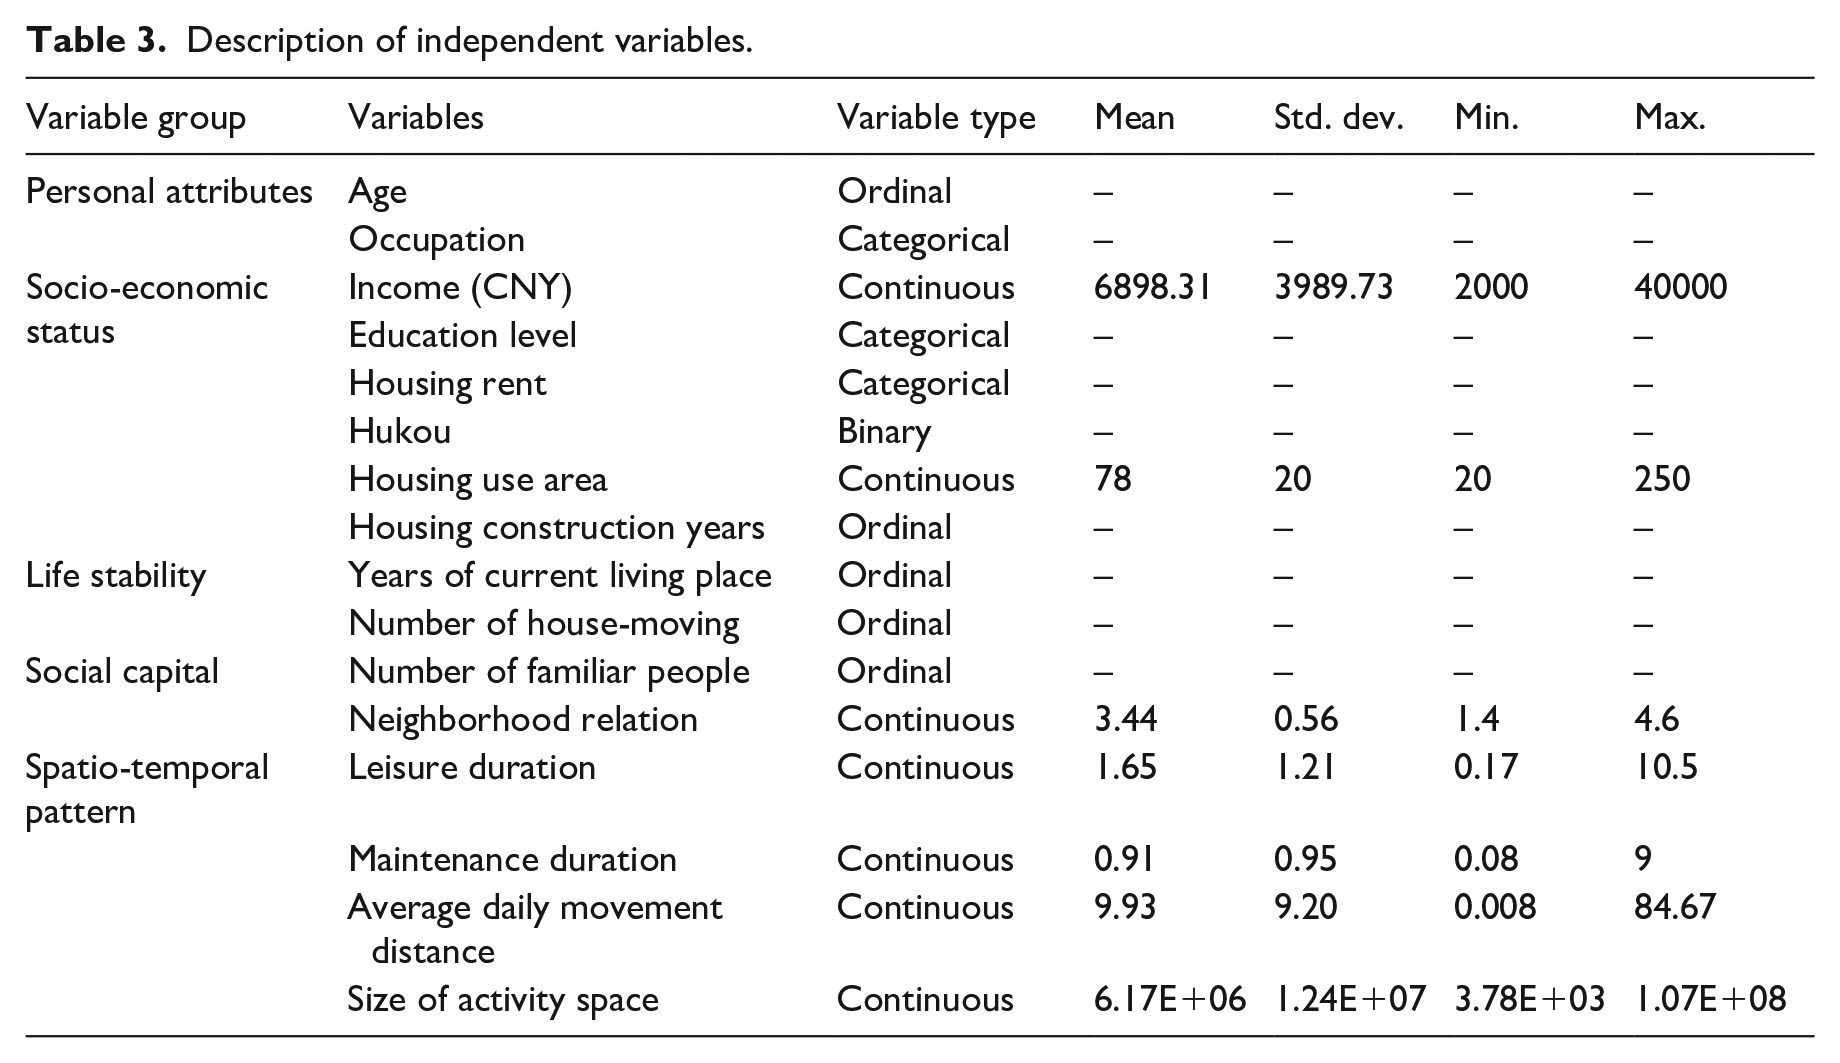
In summary, relevant studies have discussed the influencing factors of residents’ social isolation from the perspective of individual personal attributes, socio-economic attributes, life stability, and social capital. However, few studies consider the influence of the pattern of daily activity. This study introduces variables representing the temporal and spatial pattern of daily activity into the model. Specifically, temporal pattern is indicated by the length of leisure activity time and maintenance activity time, and the indicators of spatial pattern include the average distance of movement in a whole day and the size of activity space. Variables used in this study are shown in Table 3.
Description of independent variables.
Results
Activity-space segregation
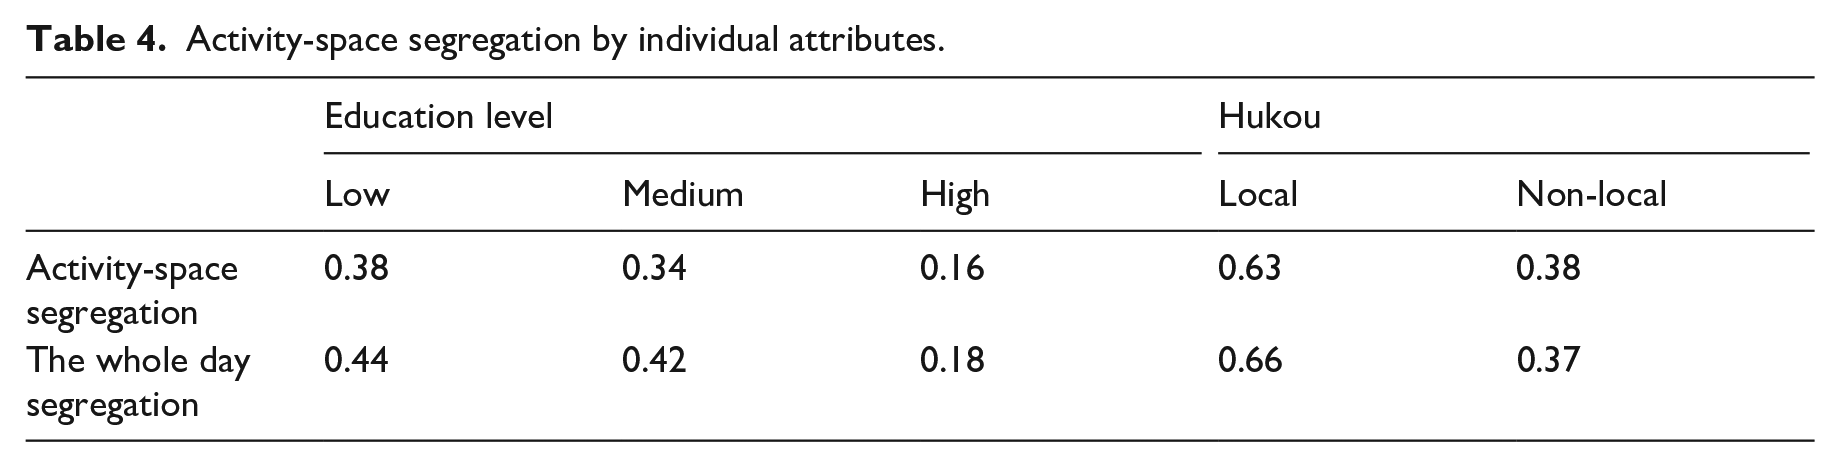
The activity-space segregation (Table 4) is calculated according to equation 2. In general, the segregation by Hukou is larger than by education level. People with low and medium education level experience more segregation than the high education group, and high education people are well integrated with the whole population. The segregation of local people is significantly larger than non-locals. Local people tend to be self-segregated, and non-locals are better integrated into the local society.
Activity-space segregation by individual attributes.
Daily activity schedule
Table 4 has shown that different groups of people do have differences in the activity-space segregation. The aim of this study is to test the influence of daily activity schedule on the activity-space segregation. This section will exhibit the differences in activity schedule for different groups of people.
Temporal pattern of daily activity schedule
The temporal patterns of daily activity schedule are analyzed from duration and start time. The duration of activities reflects the allocation of time on different activities and time constraint of people. The start time is used to investigate the temporal scheduling of different activities and the rhythm of people’s daily life. Revealing the temporal pattern would provide insight for the activity-space segregation.
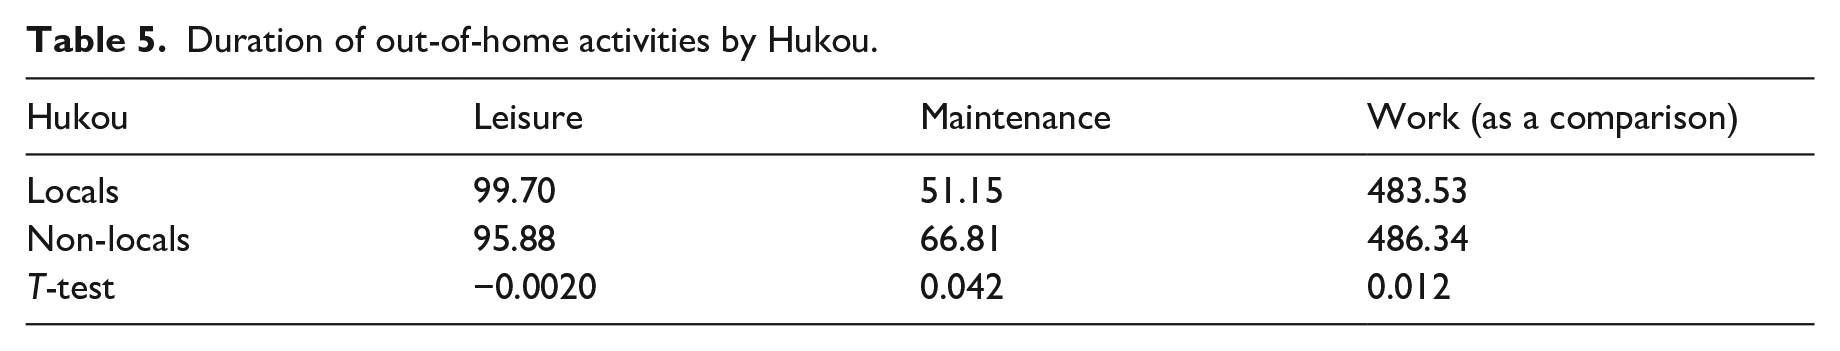
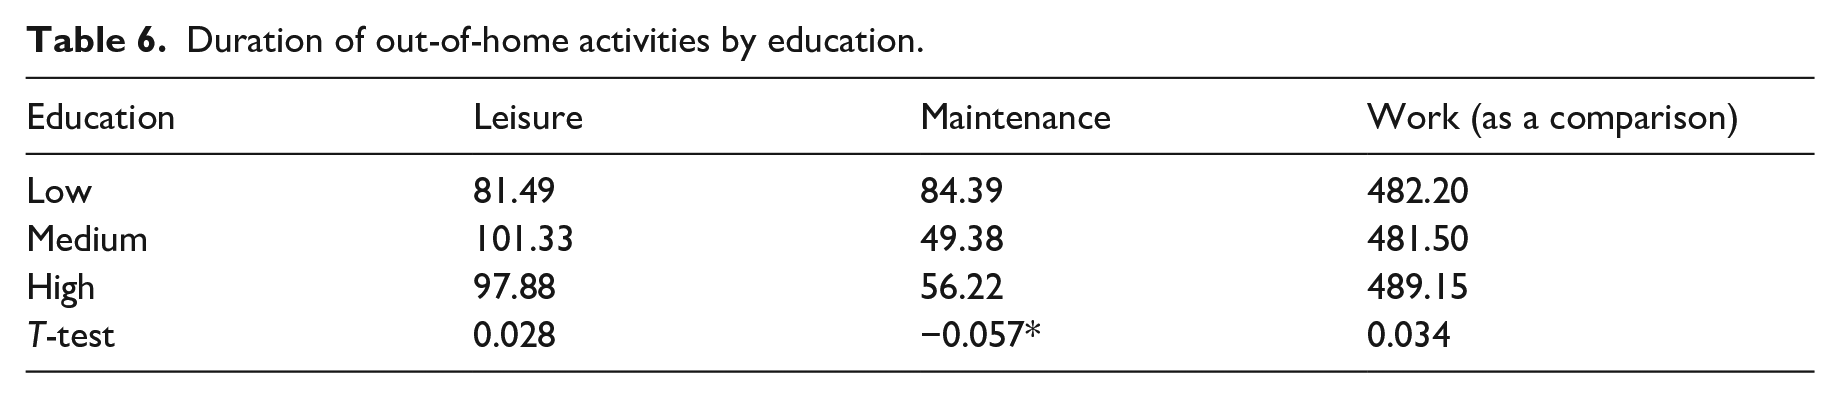
There are significant differences in the duration of maintenance activities among people with different education levels (Table 5). People with higher education level have shorter maintenance activity time, while people with low education level spend much more time than medium and high education levels on maintenance activities such as grocery and picking children on weekdays. On the other hand, people with medium and high education level have more leisure activity time than the low education group. Taking work time as an comparison, there is no significant difference among different groups. There are slight differences in the activity duration between local and non-local people (Table 6). Compared to non-local people, local people spend longer time on actual recreation activities such as leisure, dining, and other activities. Non-local people spend more time on maintenance activities.
Duration of out-of-home activities by Hukou.
Duration of out-of-home activities by education.
The start time of daily activity is plotted as Figure 5. People with different education levels have different activity start time. It is reflected in the out-of-home non-work activities. In general, there are three peak hours for the out-of-home non-work activities, namely before work in the morning, at noon, and after work in the evening. The noon time is the peak hour. Out-of-home non-work activities of high and medium educated people are mainly distributed at the three peak hours, particularly at the noon time. Out-of-home non-work activities of low educated people are dispersed across the whole day. The proportion of those activities in the morning (6:00–11:00) is significantly higher for people with low education level, while the proportion of the evening activities is lower. It implies that people with low education level have an obvious pattern of going out early and coming back at dusk. There are only slightly different out-of-home nonemployment activities, with the proportion of out-of-home non-employment activities of non-locals in the morning and evening higher than for locals.
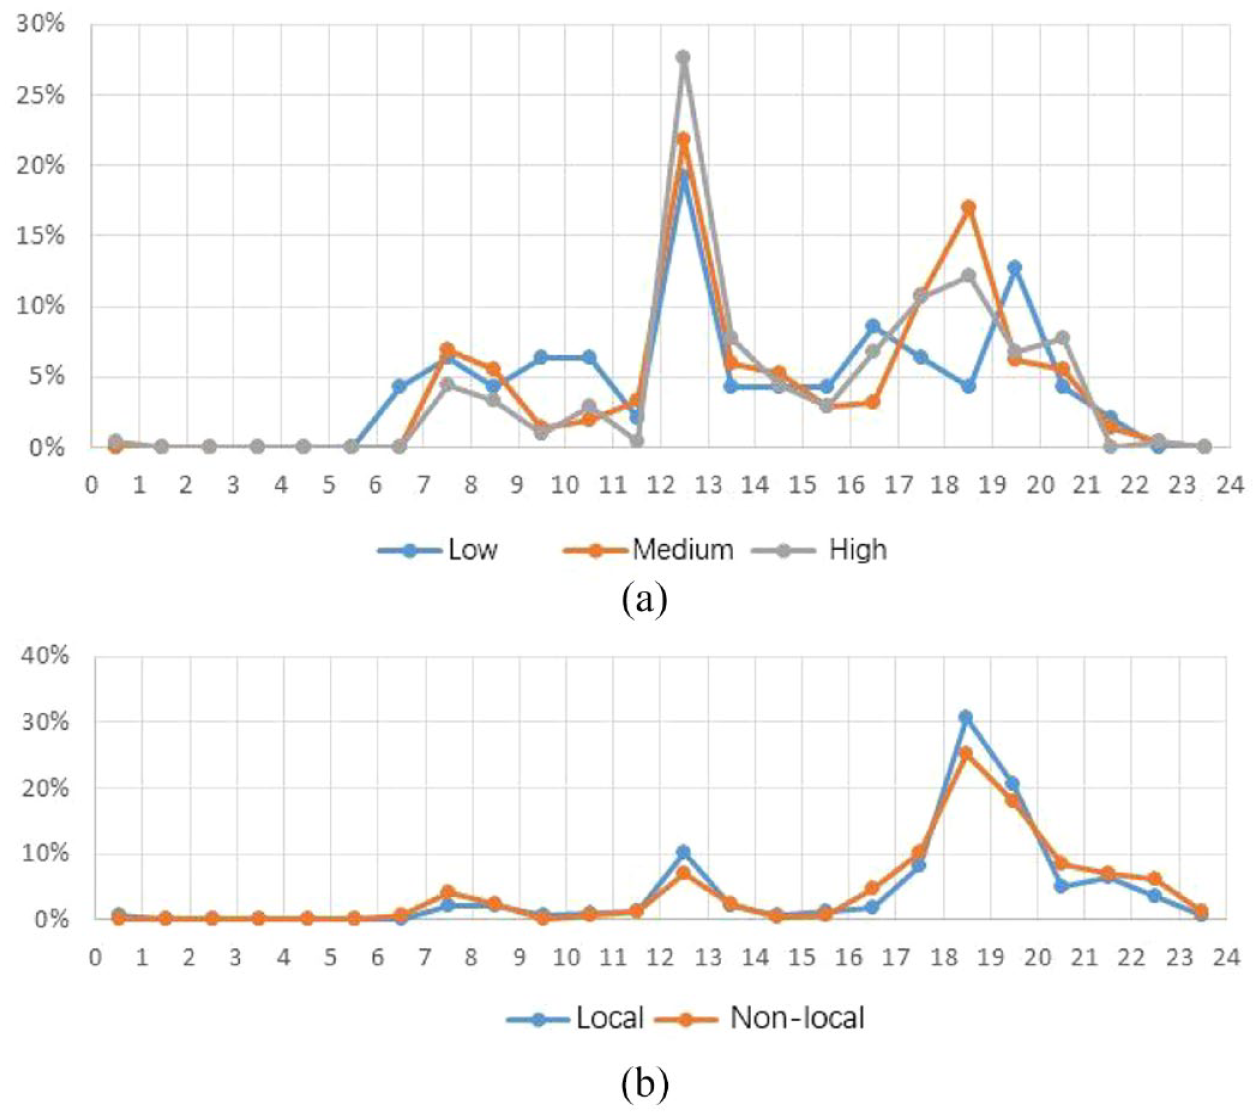
Start time of different activities. (a) Out-of-home non-employment activities by education levels. (b) Out-of-home non-employment activities by Hukou.
In summary, people with different education level and Hukou have different temporal activity patterns. Disadvantaged groups such low education and non-local people have less time for leisure activities. Due to the temporal constraint of commuting, people with lower education level conduct out-of-home non-employment activity at very early or very late times.
Spatial pattern of daily activity schedule
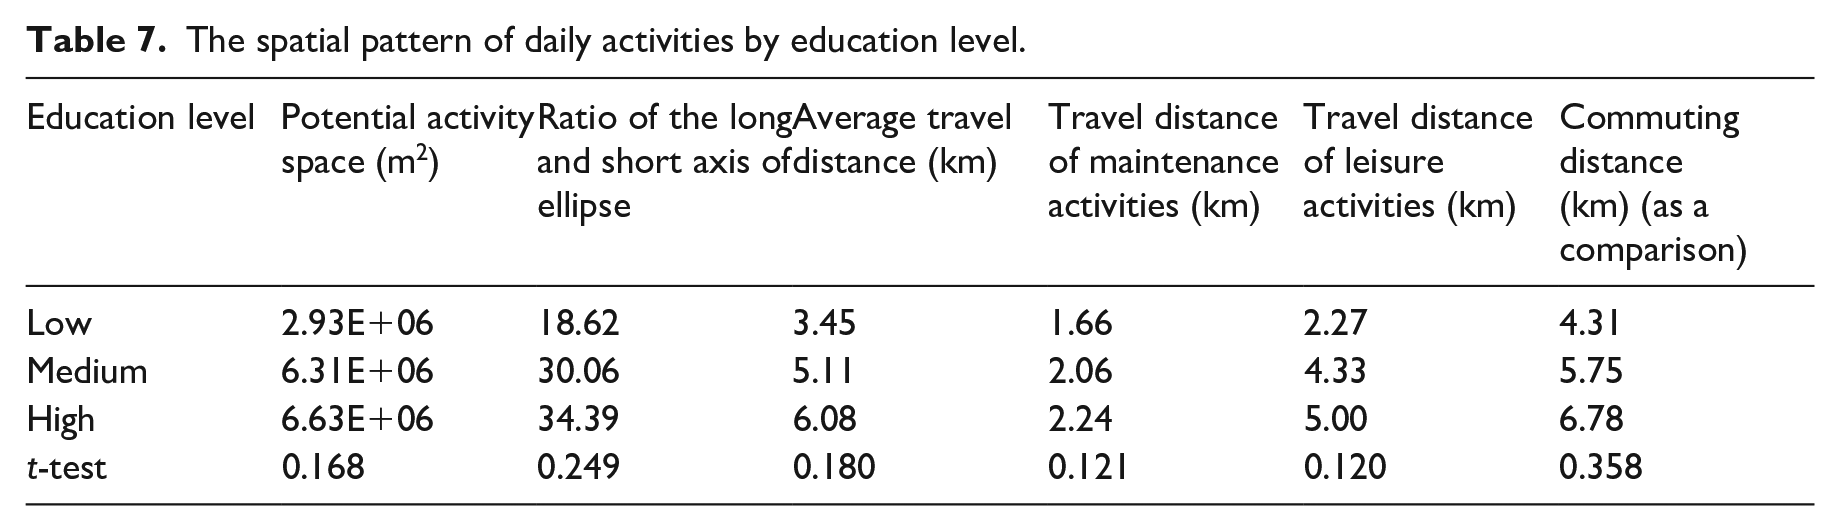
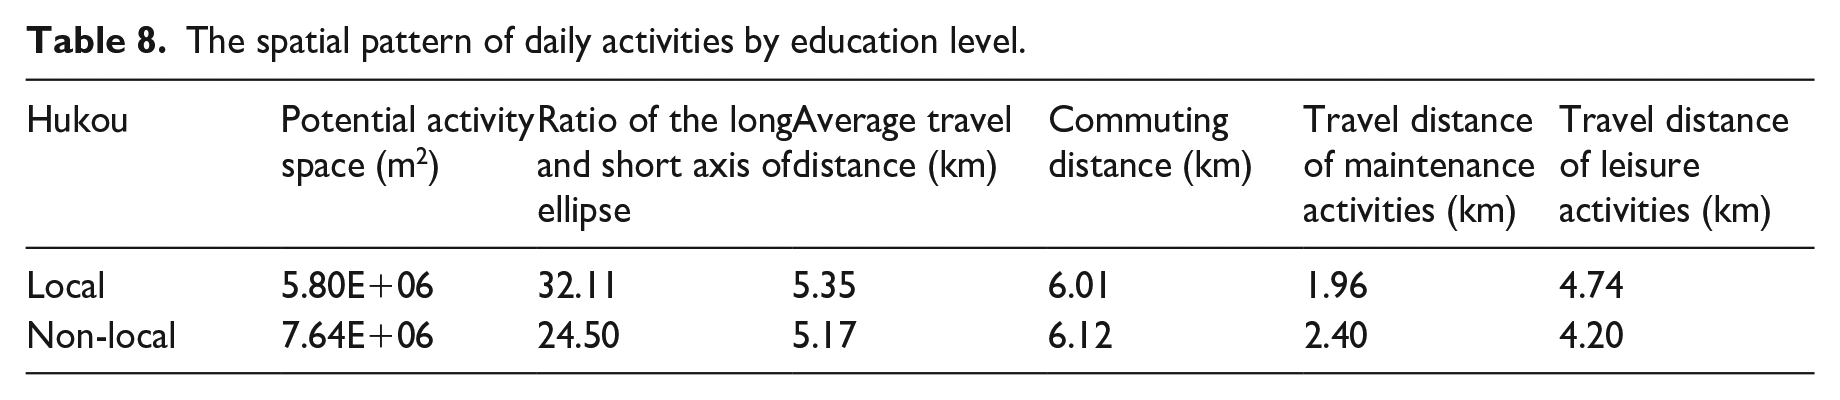
The spatial pattern of daily activity is analyzed from the size of the potential activity space and the average travel distance. The size of the potential activity space reflects people’s use of the urban space. The results show that the size of the activity space of people with low education level is significantly smaller than that of people with high education level (p < 0.01). There is no significant difference in the size of activity space between middle and high educated people (p > 0.05). The ratio of the long and short axis of the standard ellipse is larger for people with high education level. It implies that high educated people have irregular shapes of the activity space. The shape of space of near housing activities is regularly distributed and approximates a round shape, and activities distant from the residential places make the shape irregular and approaching a long ellipse. The result reflects that activities of people with low education level are constrained near their residential places.
This finding is further confirmed by the average distance between daily activities and the residential location. According to Table 7, work activity has the longest travel distance (4–7 km) and the maintenance activity has the shortest travel distance (within 3 km). People with different education level have significantly different travel distances of daily activities according to the t-test. In general, the average travel distance of work and leisure activities increases with the level of education, but there is no significant difference for maintenance activities. All kinds of daily activities of people with low education level, including work, leisure and maintenance activities, imply an obvious near-home pattern. This explains why their travel distances for daily activities are shorter than those of people with higher education level. Comparatively, people with high education level have longer travel distances for work and leisure activities.
The spatial pattern of daily activities by education level.
According to the correlation test of the size of activity space, the ratio of long axis to short axis, and average travel distance (Table 7), there is no significant difference between locals and non-locals (p > 0.05).
Daily activity schedule’s influence on social segregation
We have found that there are differences in the spatial and temporal pattern of daily activities for different people. Are these differences in temporal and spatial patterns one of the reasons affecting the degree of segregation? Until now, there is no empirical evidence to confirm this conclusion. This study uses a regression model to examine the influence of the temporal and spatial pattern on the activity-space segregation.
The dependent variable is activity-space segregation in the out-of-home non-work activity space, which was calculated according to equation 2. We also calculated the segregation in a whole day, including the residential space, as a comparison. The segregation is differentiated by education level and Hukou respectively. Results are shown in Table 7. In general, the models explain the activity-space segregation well, with adjusted R2 of 0.671, 0.704, 0.575 and 0.884 of the four models respectively. The model explains the whole day’s segregation better than the activity-space segregation.
The results confirm the theory that the material gap leads to the socio-spatial gap. Less educated and non-local people experience more segregation because of their disadvantaged socio-economic status. The material gap is reflected by variables of education level, income, housing conditions, etc. For example, the income and education level have significant negative impact: less educated and low-income people have a larger degree of segregation. For variables reflecting the housing condition, the smaller the area of housing use, the higher the degree of cultural segregation is; the earlier the house was constructed, which implies a worse housing condition, the higher the segregation is. For living stability, people who have more housing-moving experience have higher culture segregation. These pieces of evidence confirm that the activity-space segregation is well explained by the material mechanism. However, Hukou status influences the segregation the other way round. Local people’s activity-space segregation is higher than that of non-locals. It is still not easy for non-local people to integrate with locals at the activity space. This is consistent with the finding from the previous section.
The results also exhibit the influence of social communication on the activity-space segregation. The number of acquaintances positively impacts the segregation. When people conduct their daily activities with familiar people, it causes the activity-space segregation. This finding is also consistent with the theory that people with similar traditions, values, and interests tend to get together and tend to be self-segregated (Silm et al., 2018).
In particular, this study focuses on the influence of the spatio-temporal pattern of daily activities on the segregation. In general, the temporal and spatial pattern variables better explain the activity-space model than the whole-day model. It confirms that the temporal and spatial pattern is a key influencing factor of the activity-space segregation. Previous studies believe that mobility is an important mechanism of the activity-space segregation. We found that it is the contact opportunity that determines the degree of the activity-space segregation. The influence of contact opportunity includes the activity duration, the size of the activity space, and the mobility. The duration of both leisure and maintenance activities significantly affects the activity-space segregation and presents a negative impact for the education model. It shows that the longer people spend in maintenance activities and leisure activities, the lower the degree of segregation is. We can better understand this phenomenon by recalling the finding from the previous section that people face less segregation in maintenance and leisure activities. To be precise, since people experience less segregation and more integration in the non-work activity space, people who have longer out-of-home non-employment activity time have less segregation in a whole day. The mobility, presented by the average distance of daily travel, is negatively associated with the segregation in the Hukou model. This means that the longer movement distance decreases the segregation between locals and non-locals. However, the size of the activity space positively affects the segregation in contrast. Even though people have more space for activities, they still prefer to interact with similar people at Hukou level.
Conclusions
This study explores influence of daily activity pattern on social segregation by analyzing the differences of temporal and spatial pattern among different people and its impact on the activity segregation. It provides a new explanation for the activity-space segregation: that the segregation is associated with individuals’ arrangement for daily activities, particularly non-mandatory activities. This finding contributes to the spatial segregation literature. Specifically, the following conclusions are drawn.
First, there are significant differences in temporal and spatial patterns among different people. Disadvantaged populations have greater segregation in the temporal and spatial pattern. The disadvantaged groups are subject to a certain degree of spatiotemporal constraint. They have shorter time of leisure activities, and a ‘going early and returning late’ pattern in the temporal pattern. Also, their activity space is smaller and near their residential places. The choice of activity destination of different people also shows significant differences, reflected in the size of activity space and the distance between activity space and home. People with low education level are seriously restricted by space, which is reflected in the fact that their daily activities, including employment, leisure, and maintenance activities, are close to residential places, and their activity space is significantly smaller than that of residents with higher education level. In terms of Hukou, there is no significant difference between locals and non-locals in the size of the activity space, the distance between the activity space and the place of residence. It indicates that there is a similarity between the locals and non-locals in the spatial pattern.
Second, we further discussed the correlation between temporal and spatial pattern and segregation. We found that the temporal and spatial pattern of daily activities has a great impact on the degree of segregation. The segregation by educational level is mainly affected by temporal pattern indicators. Longer duration of maintenance and leisure activities is associated with less segregation by educational level. Segregation of locals and non-locals is mainly affected by spatial pattern. Longer travel distances for daily activities provide opportunities to meet different people and reduce the segregation. In general, people are subject to a higher degree of segregation when they have greater space-time constraints. However, the mechanism of space-time is more complex. The negative effect of time mainly depends on whether people can reduce their segregation through daily movement.
Third, social spatial segregation in China is quite different from that in Western society. Researchers have observed significant racial segregation in the United States (Park and Kwan, 2018) and ethnic segregation in European countries (Silm and Ahas, 2014a; Silm et al., 2018). In Chinese cities where people have similar culture, the segregation exhibits different patterns, such as between local and non-local people, poor and rich people, etc. That is why we see different research findings. For example, the start time of out-of-home non-employment activities by Hukou shows little difference. However, we could still see other differences in the space-time pattern by Hukou. Migrant people have shorter leisure activity duration and smaller activity space (Tables 8 and 9). The general segregation by local and non-local people is even larger than that by education (Table 4). Therefore, we see both segregation of Hukou and education in this study. Another interesting finding is that higher educated people are less segregated than lower educated people in the activity space. A trend is observed in recent studies that better educated and higher earning people drive up levels of residential segregation (Clark et al., 2015). Daily mobility improves the social integration to some extent. More than that, people with low and medium education level also have less activity-space segregation than residential segregation. In general, people with different education levels are getting spatially integrated by daily mobility.
The spatial pattern of daily activities by education level.
Co-relations of segregation and influencing factors.
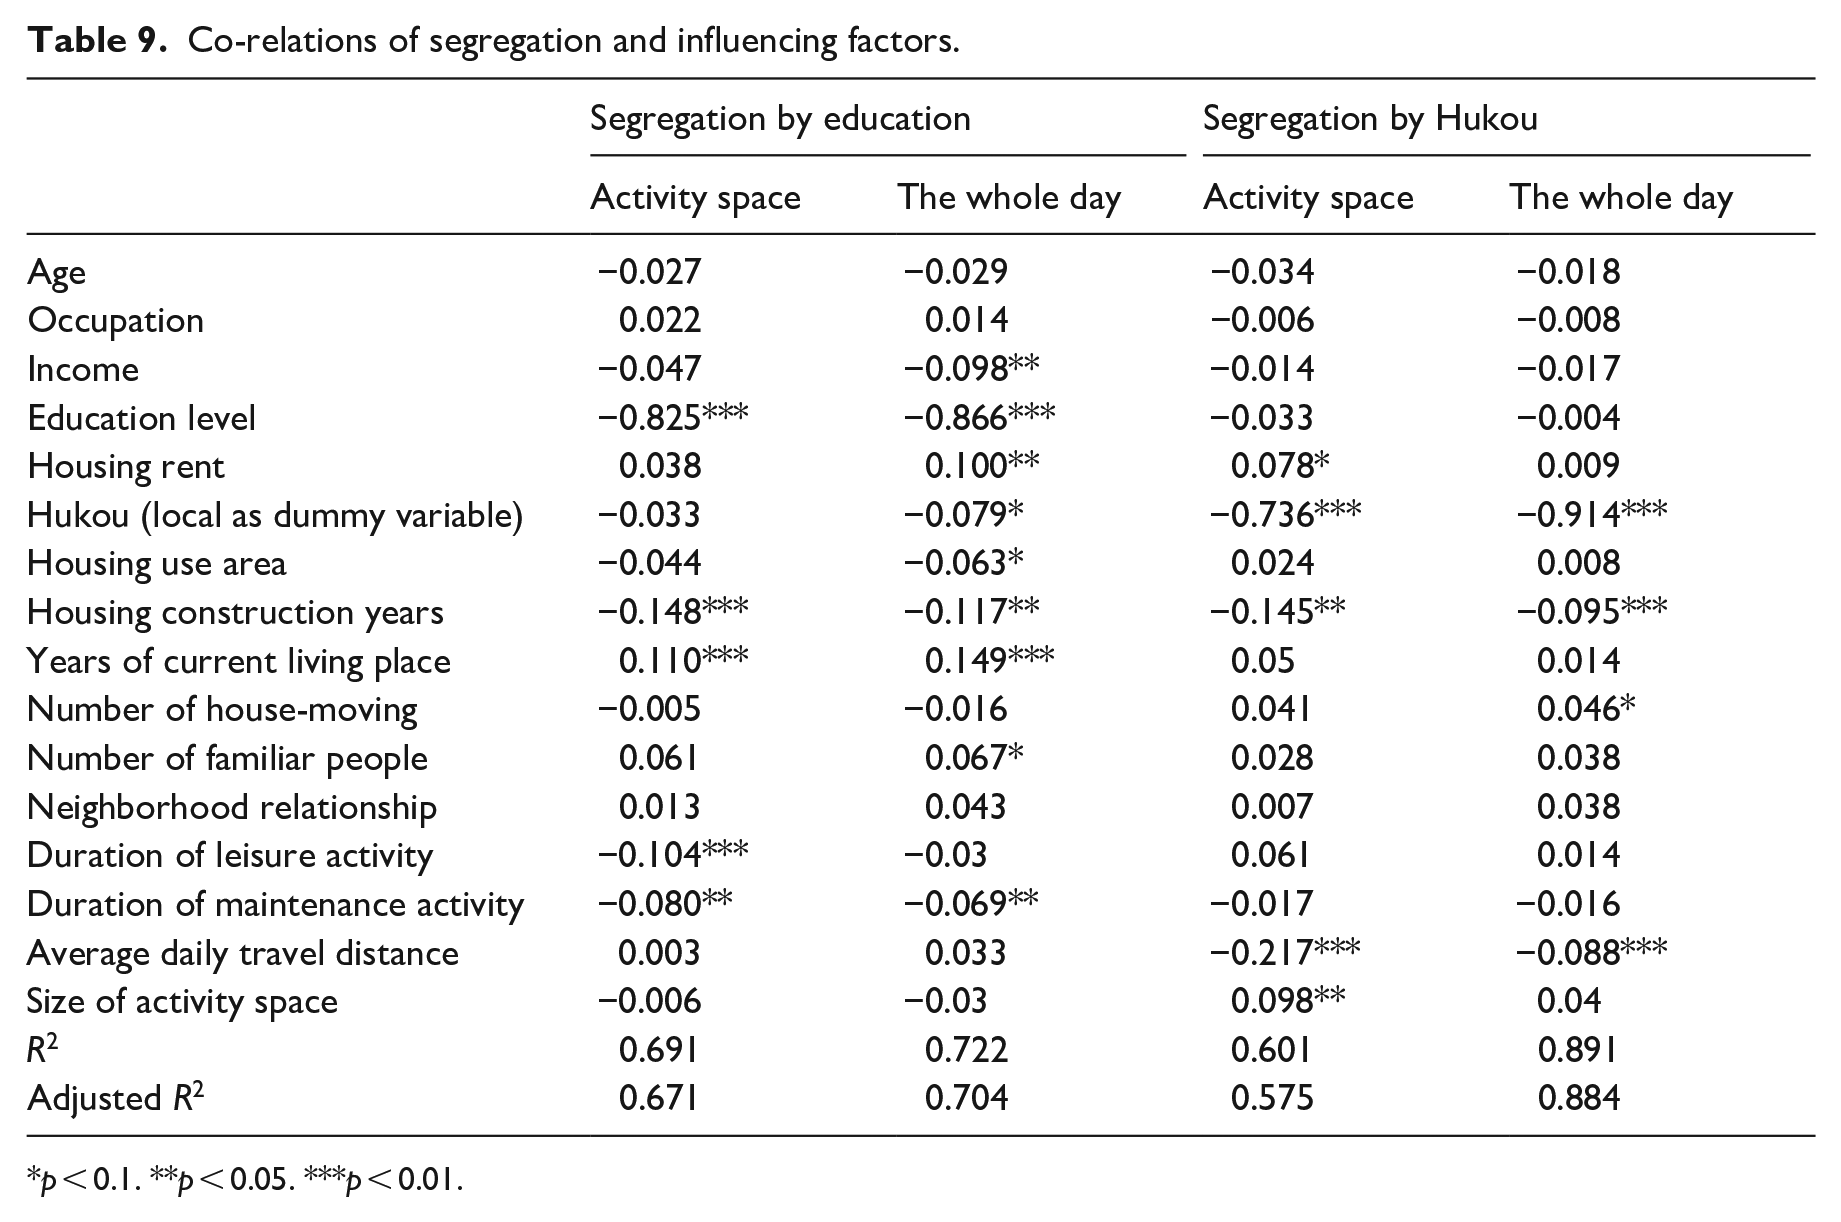
p < 0.1. **p < 0.05. ***p < 0.01.
This study has some limitations. It partly but not fully explains the mechanism of the impact of temporal and spatial pattern on the segregation. How is the segregation at the out-of-home non-work activity space formed? Why is the activity segregation larger for locals and non-locals than for different education groups? The above questions have not been answered. It is difficult to further explain these phenomena through the temporal and spatial pattern of residents. Future work will further explore the formation mechanism of activity segregation from the choice of activity destination.
Because of data limitation, some important factors are absent from our framework. For example, the interaction of education and Hukou is not considered, and not all the non-local residents are disadvantaged. The interaction of education and Hukou is not available in both cellphone and census dataset. An underlying question is how to identify the disadvantaged population. One solution is to consider the interaction of education and Hukou. Another is to collect more attributes such as income, household consumption, etc., for example, inferring the income level from cellphone users’ consumption behavior. These problems would be solved in future work.
An important influencing factor, the residential location, is not discussed in this study. The influence of residential location on the activity-space segregation could be direct and indirect. For the direct effect, since the city center has well-developed public services and great attraction for daily activity, it is easier to access for people whose residential location is close to the city center. The possible indirect effect is its influence on residential segregation. Because of different housing affordability, high-earning people reside near central locations and low-earning people have to choose suburban and rural areas. Then the residential segregation acts on the activity-space segregation. Incorporating the residential location into the framework is a promising direction for future work.
We also admit there is slight mismatch of the data collection time among different sources. The collection time of the travel survey, cellphone signaling, and census are different. Ideally, collecting different data sources with temporal consistency is perfect, but it is of high difficulty for us. We have to make several strong assumptions that the neighborhood composition is similar between census and cellphone data, and the ambient population identified from cellphone data is consistent with that when we did the travel survey. An underlying assumption is that the social composition is temporally stable. Nevertheless, that is one of the limitations of this study.
Footnotes
Declaration of conflicting interests
The author(s) declared no potential conflicts of interest with respect to the research, authorship, and/or publication of this article.
Funding
The author(s) disclosed receipt of the following financial support for the research, authorship, and/or publication of this article: This article is funded by National Natural Science Foundation of China (42101223; 42271234), Guangdong University Innovation Team Project (2021WCXTD014).