
Abstract
The essential role of urban streetscape skeletons in fostering vibrant streets has been repeatedly emphasized. However, most research focused on the macro-scale or mesoscale urban form or measuring streetscape skeletons using quantitative methods, failing to systematically examine the relationship between the street-level urban form with urban activities. This study took street segments as the analytic unit to analyze the relationship between streetscape skeletons and urban activities represented by the density of online reviews on the Dazhong Dianping by controlling other built environments. Using models like Multiple Linear Regression, Spatial Lag Model, and Random Forest Regression, the result suggested that when conducting activities, people preferred the strengths of the street but ignored its weaknesses. The findings demonstrated some skeleton indicators associated with urban activities, such as the width and enclosure of the street and the higher and more continuous buildings on the side of the streets. Moreover, the result also suggested that some streetscape skeletons, such as cross-section and length, have differentiated performances for online reviews at different distances to the street centerlines. These findings could help urban designers to rethink the interaction between urban activities and street-level urban form.
Introduction
The essential role of urban streetscapes in fostering vibrant streets has been repeatedly emphasized in conventional urban design guidelines (Tucker et al., 2005). The streetscape skeleton, as the three-dimensional spaces of streets defined by the size and arrangement of large neighboring objects such as buildings and trees, is an irreplaceable part of street design to create prolific public spaces and accelerate abundant daily activity (Harvey and Aultman-Hall, 2016). Livable streetscape skeletons can help citizens construct impressive city images (Lynch, 1960) and instill a sense of place by providing attractive and comfortable outdoor spaces for staying and communicating (Gehl, 2011). Therefore, there have been numerous attempts to explore suitable streetscape skeletons for urban designers to better understand human-scale urban form and shape vibrant and sticky streets in the past six decades (Ashihara, 1983; Jacobs, 1961; Long and Ye, 2019; Sternberg, 2000).
Recent advancements in the new data environment, such as street view pictures (SVP), point of interest (POI), open street maps (OSM), and social media data, have created a new context for gaining insights into human-scale streetscapes (Harvey et al., 2017; Harvey and Aultman-Hall, 2016; Long and Ye, 2019; Lu, 2018). A growing number of scholars are being committed to proposing various approaches to measuring streetscapes such as using GIS (Geographic Information System)-based methods (Harvey, 2014; Harvey and Aultman-Hall, 2016; Harvey et al., 2017) to depict the skeletons of the streetscape, and applying deep learning algorithms to extract visual elements from SVP data (Zhang et al., 2018). Meanwhile, some studies have also revealed the close relationship between streetscapes and urban activities, such as diverse functions (Yoshimura et al., 2021), short streets (Long and Huang, 2019; Sung et al., 2015), and street-level greenery (Lu, 2018). However, the association between urban activities and geometric arrangements in the streets that urban designers also consider when discussing streetscapes, such as cross-sectional proportion, the continuity of urban streets (Ashihara, 1983), enclosure and spaciousness (Stamps, 2009), and the average height of buildings (Harvey, 2014), have not been systematically analyzed and discussed.
Are the streetscape skeletons frequently highlighted in conventional urban design guidelines associated with urban activities? What three-dimensional street forms are pedestrians prefer when they engage in urban activities? To address these two questions, we took social media data—online reviews—from the Dazhong Dianping platform (China’s version of Yelp) as a proxy for people’s in-person activities and willingness to share or review some locations or places. The relationship between the density of online reviews and streetscape skeletons was examined in Multiple Linear Regression (MLR) by controlling other indicators that could influence travel demand. The Spatial Lag Model (SLM) and Random Forest Regression (RFR) were used to verify the robustness of the results.
Literature review
Built environment potential to moderate travel demand
The built environment that could influence travel demand is a hot research topic in urban planning and transportation. Early explorations based on subjective perception and evaluation provided a fundamental framework for a sustainable and preferred built environment via interviews, in-person questionnaires, and field observations (Ashihara, 1983; Jacobs, 1961, 1995; Lynch, 1960). These subjective perceptions are the subjective impression or image of the human-scale urban form and built environmental elements for citizens, auditors, or spectators, such as aesthetics (Ashihara, 1983), safety, vitality (Jacobs, 1961), imageability (Lynch, 1960), enclosure, comfort (Gehl, 2011), transparency, and complexity (Ewing and Handy, 2009). Some scholars summarized the influential built environment features with words beginning with D through literature reviews to describe pedestrian activity-related built environments. Initially, “three Ds” (density, diversity, and design) were proposed (Cervero and Kockelman, 1997) to emphasize the essential role of urban form, land use, and design features in appealing travel activities. Afterward, two Ds- destination accessibility and distance to transit- were introduced to underline the transport accessibility defined by the transport links with other vital nodes or landmarks (Ewing and Cervero, 2010).
Recently, the emergence of social sensing data (Liu et al., 2015) and open digital map data has enabled researchers to “measure the unmeasurable” (Ewing and Handy, 2009) and verify the significance of five Ds by investigating their relationship with urban activities (Long and Huang, 2019; Meng and Xing, 2019; Xia et al., 2020). Some indicators such as transport and landmark accessibility (Sung et al., 2015), mixed land use (Frank et al., 2006; Grant, 2002), intersection density (Ewing and Cervero, 2010; Sung et al., 2015), and street-level greenery (Lu et al., 2018) were verified highly associated with urban activities. Among various elements in five Ds, the design features vary the most among different spatial scales and analytic units. Meanwhile, the street-level design elements, coined “streetscapes”, are fundamental objects that urban designers and architects emphasize in urban design guidelines. Therefore, compared with researchers in the transportation field who focus more on transportation networks and land use, urban planning and design scholars also highlight human-scale design features. However, most studies examined the urban form at macro and meso scales by using blocks or grids as analytic units, failing to ascertain the relationship between urban activities and urban design elements at the street level.
Streetscapes features related to urban activities
The emphasis on the street system can be traced back to Lynch’s city images, where paths are regarded as channel-like images that contain physical movement and contribute to the urban configuration (Lynch, 1960). Then, Jacobs (1961) proposed four conditions of urban design and underlined the critical significance of livable streets and small blocks. Later, the reciprocal relationships between specific urban forms and activities were described in Gehl’s book (Gehl, 2011), in which Gehl examined the relationship between patterns of space use and spatial properties of the physical environment. Some more specific indicators, such as the relationship between buildings and streets and the aspect ratio, were proposed by Ashihara (1983) to discuss the geometric structure of streets. With the emergence of space syntax, numerous researchers started to regard streets as linked linear spatial units that contribute to the functional organization of cities (Hillier, 2012; Shen and Karimi, 2016).
In this context, streetscapes were introduced to describe the human-scale built environmental characteristics of streets (Tang and Long, 2019), which are defined as the spatial arrangement, street furniture, and visual appearance of built and landscape features when viewed from the street (Tucker et al., 2005). Ewing et al. (2006) identified and measured urban design characteristics via an audit protocol, which inspired Purciel et al. (2009) to measure 22 physical features in the streets in terms of imageability, enclosure, human scale, transparency, and complexity using GIS-based methods. Referring to Purciel’s proposal, Ewing and Handy (2009) summarized 20 streetscapes from video clips regarding five design qualities. Rehan (2013) introduced 17 streetscape elements to describe the natural and built fabric of the street, ranging from buildings and street surfaces to fixtures and fittings that facilitate its use. Harvey (2014) used the term “streetscape skeleton” to depict the 12 characteristics of spatial arrangement in three-dimensional space to show the size and arrangement of buildings and trees within streetscapes, and in 2016, Harvey and Aultman-Hall (2016) proposed a framework to illustrate 19 components of streetscapes. Although these scholars focused on different dimensions of streetscapes from diversified perspectives, they all emphasized the importance of streetscape skeletons, street furniture, physical and visual appearance, and land use.
Recently, emerging big data such as open street maps and street view pictures, and deep learning algorithms have enabled an increasing number of studies on quantifying streetscapes. (Li, 2021; Ye et al., 2019). Some studies applied the GIS method to depict the three-dimensional geometric characteristics of the street and surrounding buildings and trees (Harvey et al., 2017; Purciel et al., 2009). Meanwhile, some studies explored extracting visual elements from street-view pictures. Among various deep learning techniques, image classification, object detection, and semantic segmentation were three frequently used models for extracting information from street view pictures, which has a broad range of potential applications (Ibrahim et al., 2019; Kruse et al., 2021; Tang and Long, 2019). Although several studies revealed some streetscapes highly associated with pedestrian activities, such as street-level greenery, openness, and spaciousness, they failed to systematically identify the associated streetscape skeletons.
Streetscape skeleton and its measurement
Academic discussions on the qualitative and quantitative measurement of streetscape skeletons have evolved over the past 60 years. Jacobs (1961) underlined the necessity of small blocks (short streets) based on subjective perception and observation. Ashihara (1983) introduced a quantified index - the width-to-height ratio (D/H) - to define the aesthetics of the street by measuring the relationship between buildings and streets. Measuring skeleton indicators using GIS-based methods is a state-of-the-art method that examines three-dimensional geometric relationships based on vector data with geographic information. The street wall continuity, the average height of buildings, and the count of buildings along the street were measured in most studies (Ewing and Handy, 2009; Harvey, 2014; Purciel et al., 2009). Purciel et al. (2009) and Ewing et al. (2015) also emphasized the sight range in the street, simulated the horizontal sight lines, and counted the number of long sight lines and the proportion of the visible sky, respectively. In comparison, Harvey (2014) introduced more specific measures of street skeletons, such as width between buildings across the street, cross-sectional proportion, length of centerline, variability in height and width, and sinuosity of the centerline, to portray the arrangement of buildings along either side of a streetscape (Figure 1). However, most studies on streetscapes focused on the measurement rather than their relationship with urban activities. Therefore, there is an urgent need to understand the streetscapes repeatedly cited in previous studies and recognize elements that urban designers need to focus on during urban design.
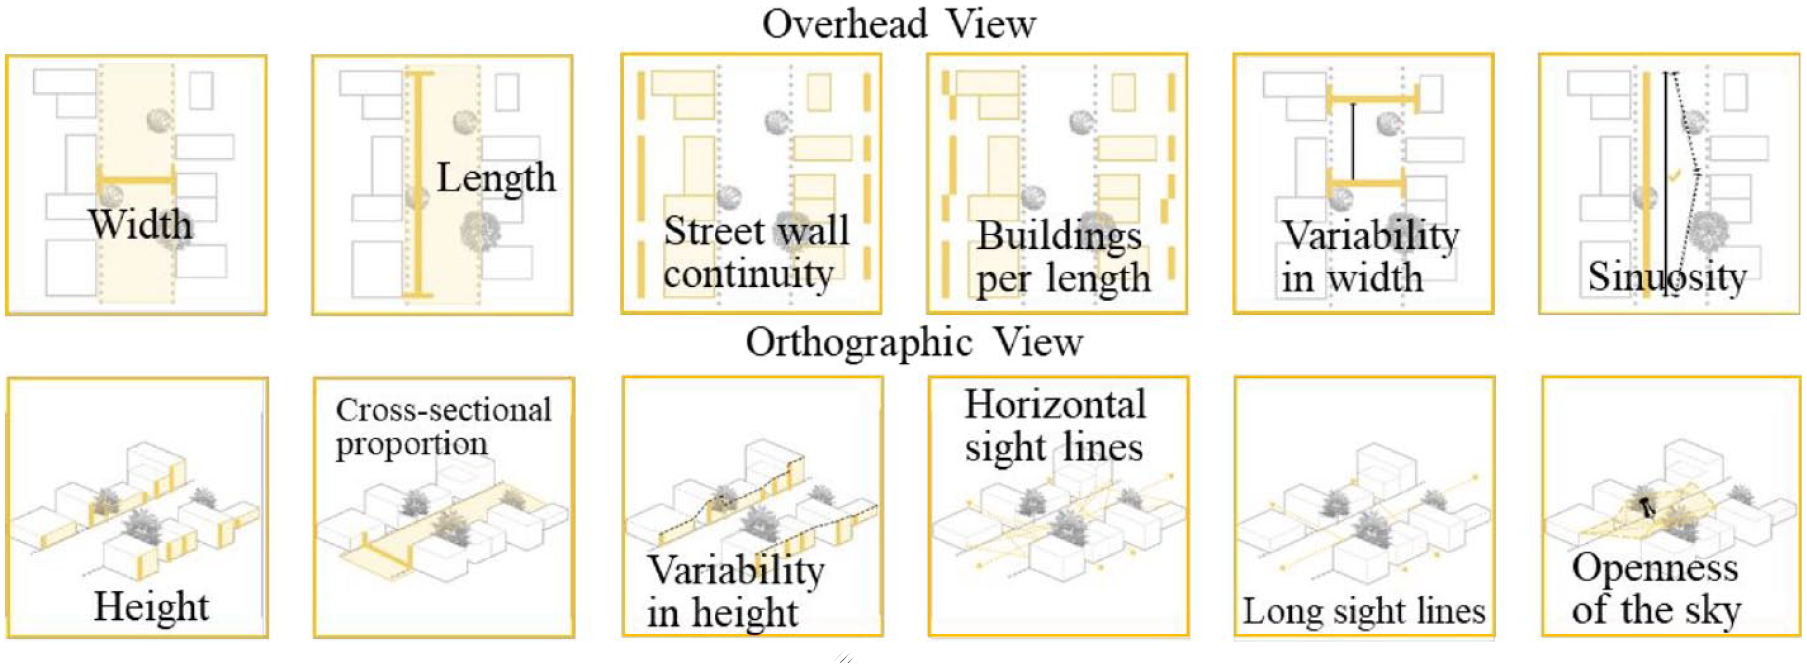
Streetscape skeletons define the three-dimensional space of a street.
Methodology
Research framework
This study focused on Beijing’s Fifth Ring Road area, a central city area covering approximately 667 km2. To achieve a deeper understanding of the relationship between streetscape skeletons and urban activities, we used streets as the analytic unit to measure the human-scale urban form. The raw data for this investigation contained 17,330 streets with street-level spatial data within the Fifth Ring Road area (Figure 2).
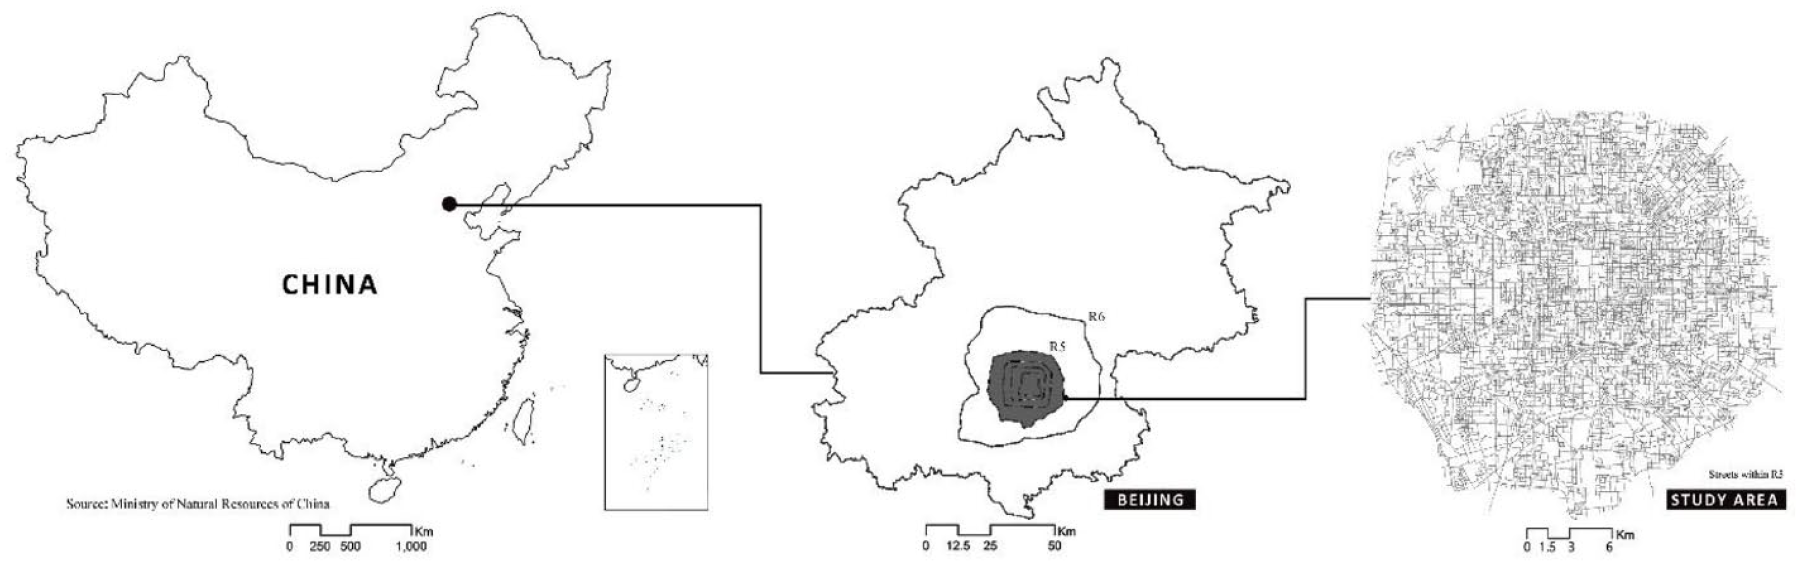
Study area.
In this research, we took online reviews on Dazhong Dianping (the most prominent online rating and deal service platform for local recreation providers in China) (Long and Huang, 2019) as a proxy of urban activities for three reasons (see Supplementary Information (SI) for Figure S1). First, online reviews were highly associated with on-site consumption, and thus could reflect the actual in-person activities. Second, online reviews reflected the consumer’s preference to share their opinions. Though there might be some bad reviews or provider-induced good reviews, only service providers with good quality could receive more online reviews. Therefore, the number of good reviews also closely correlated with the total number of online reviews. Third, the online reviews could serve as the Electronic Word of Mouth (eWoM) (Cheung and Lee, 2012), which could influence customers’ demand confirmation, location choice, and post-evaluation (Mu et al., 2019; Shi et al., 2021) thus has the potential to attract more pedestrian flows (Xu et al., 2019).
We used the density of online reviews as the dependent variable to examine its association with 11 streetscape skeletons (width, length, height on the higher and lower side, cross-section on the higher and lower side, continuity of the higher and lower side, buildings per length, sinuosity, and openness of the sky) by controlling for the other four Ds—destination accessibility (distance to city center), distance to transit (distance to metro station), density (density of various POIs), and diversity (mixing degree of POIs). Multiple Linear Regression (MLR)—Ordinary Least Square (OLS) Estimation—was employed in this study to conduct step-wise regressions after examining the difference in results with different radii of the buffer for the street to calculate the density of online reviews. The Spatial Lag Model and Random Forest Regression were applied to test the robustness of the result (Figure 3). Based on the standard linear regression, SLM considered the autocorrelation among observed variables by generating the matrix between streets (Seya et al., 2020). We generated a 50-m buffer of streets and ran the SLM in GeoDa. The RFR was also used because it could provide an index—the proportion of variance explained (Prop. Var)—for the overall model and a series of “variable importance” scores for predictor variables (Smith et al., 2013). The Cross Validation was used to automatically and randomly take a proportion of different data as test and train data to obtain the average Prop. Var.
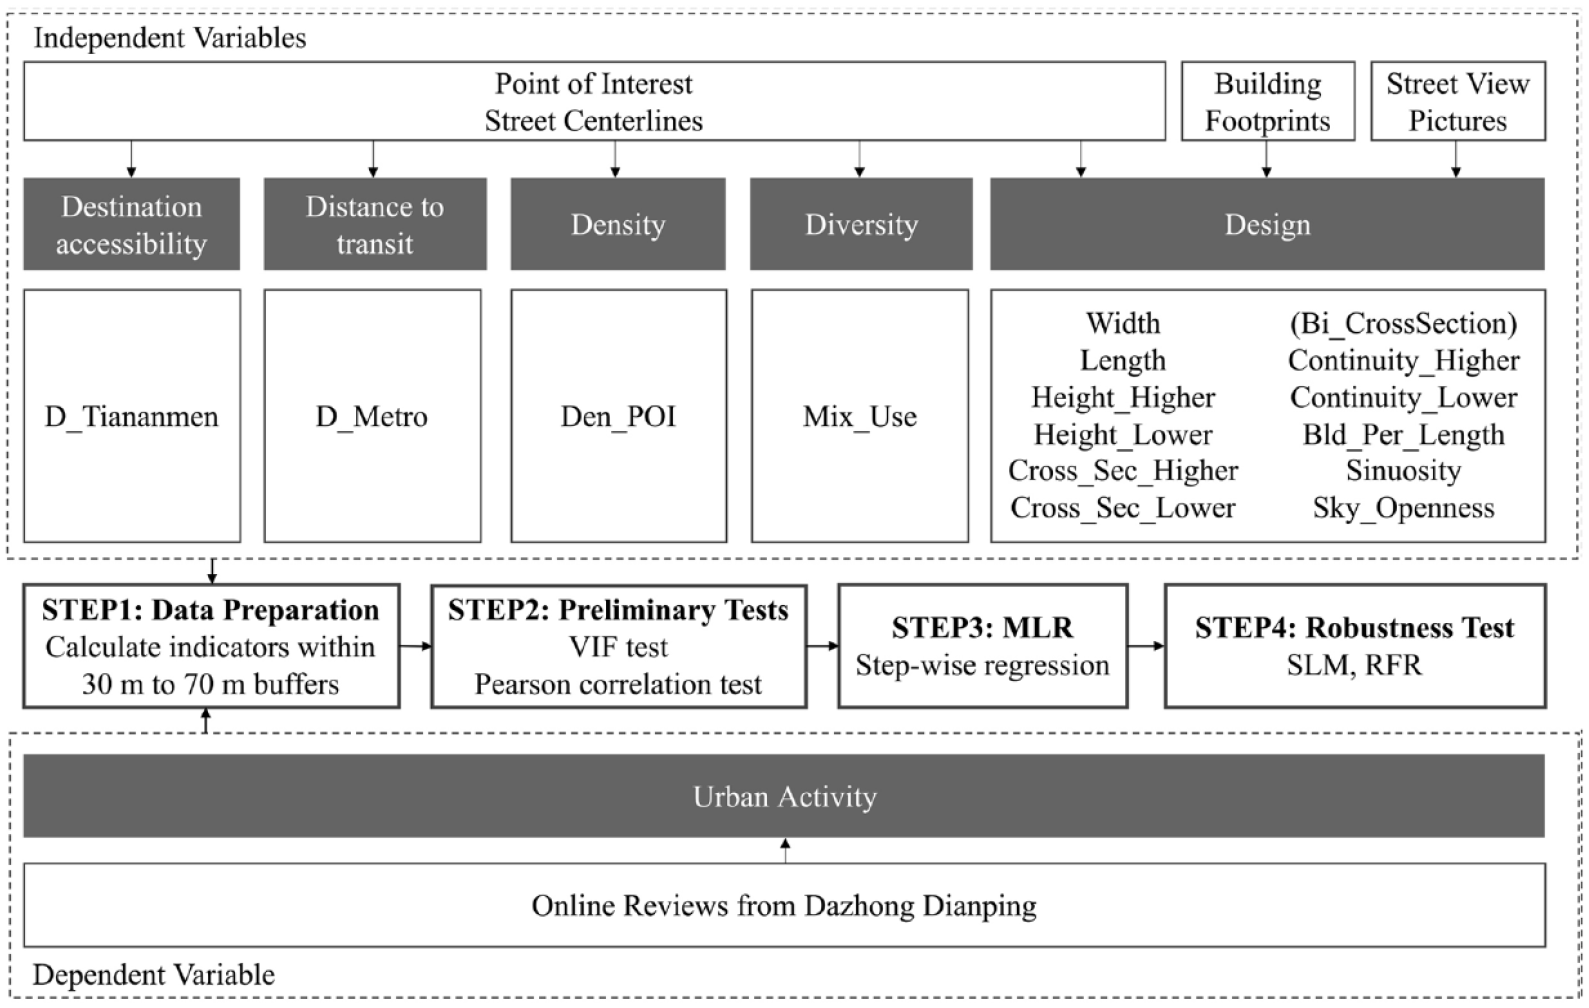
Analytical framework.
Measurement of the dependent variable—urban activity
The density of online reviews derived from Dazhong Dianping was considered the dependent variable representing urban activity. Online reviews were generated from consumers who scored and commented on places or service providers they patronized. From the company’s website (http://www.dianping.com), we obtained available information on service providers, including the name, detailed location (longitude and latitude), and the number of reviews (see Figure S2 in SI for details). After data deduplication, we converted the address to the WGS-84 coordinate to ensure all the data was in the same coordinate. Then, to avoid the impact of the buffer area and the length of the street on the results, we calculated the density of online reviews within a buffer zone for each street as the value of each sample. Given that the radius to generate the buffer of the street might interfere with the results, this study selected the radius 30 m, 40 m, 50 m, 60 m, and 70 m to build the buffer, respectively, and compared their differences. According to the spatial visualization of the density of Dianping POIs and online reviews in the 50 m buffer of the street, the distribution of Dianping POIs was even across the city, while the density of online reviews clustered around the north-eastern part of the city (Figure S3 in SI).
Measurement of the independent variable—streetscape skeletons
The streetscape skeletons were regarded as the design indicators in this study. We acquired building footprint data with layer information and street centerlines to calculate skeleton indicators according to methods developed by Harvey (2014). We also applied a SegNet method to count the visual proportion of the sky in street-view pictures (Note 1 in SI) to depict the openness of the sky, referring to Ewing and Handy (2009). All the streetscape skeletons included the width (Width), length (Length) and sinuosity (Sinuosity) of the street, and the height (Height_Higher and Height_Lower), cross-section (Cross_Sec_Higher and Corss_Sec_Lower), continuity (Continuity_More and Continuity_Less), and density (Bld_Per_Length) of buildings on two sides, and the openness of sky from the view of the street (Sky_Openness). Considering the existing ideal ranges for cross-sectional proportions (width/height) in the conventional urban design theory, we further transferred the cross-section variables into a binary variable in which the proportion values between the ideal ranges (1 and 2 according to Ashihara (1983)) were transferred into 1, and other proportion values were transferred into 0. The detailed descriptions and methods to calculate these skeleton indicators are presented in Table 1.
Dependent and independent variables and their descriptions.
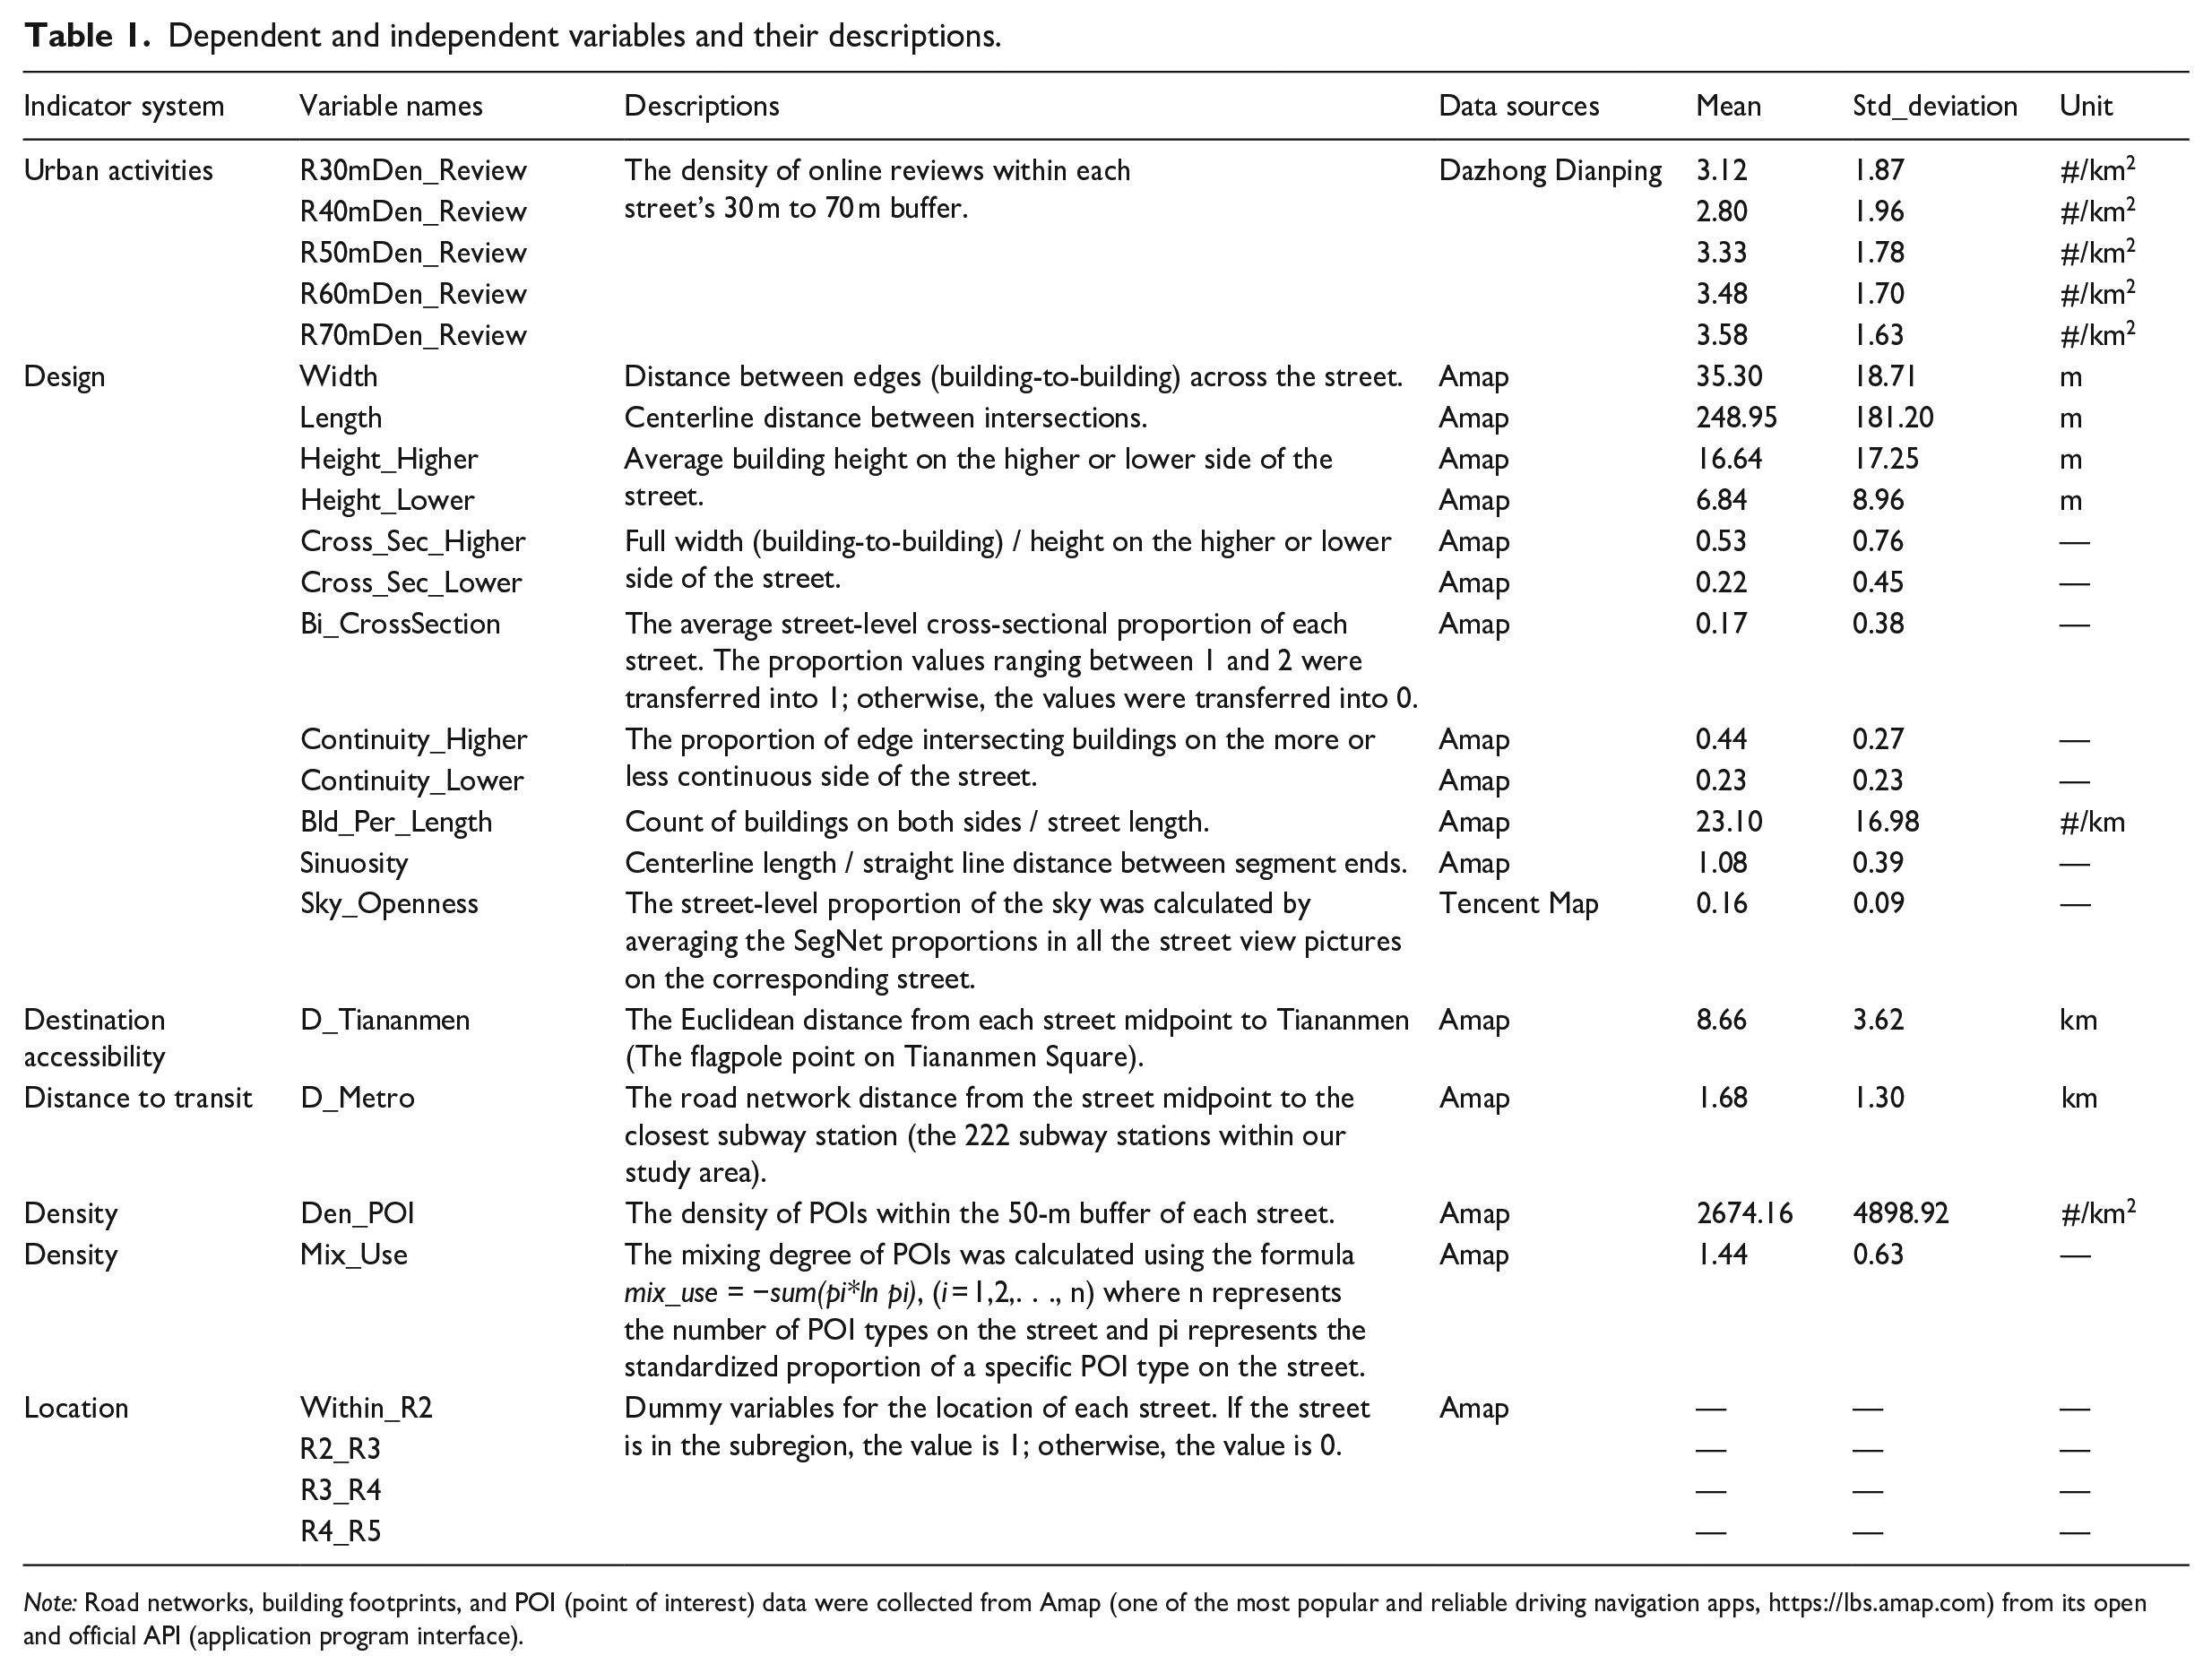
Note: Road networks, building footprints, and POI (point of interest) data were collected from Amap (one of the most popular and reliable driving navigation apps, https://lbs.amap.com) from its open and official API (application program interface).
Measurement of the independent variable—control variables
Other four types of elements in the five Ds were used as the control variables in this study. This study applied four elements that have been verified highly associated with urban activities. (1) Destination accessibility. The distance to the central city was the accessibility indicator to describe the specific location of each street by calculating the Euclidean distances between the midpoint of the street to the flagpole point based on Tiananmen Square. (2) Distance to Transit. The distance to transit was measured by the network distance from the street midpoint to the nearest metro station. (3) Density. The density of various functions was selected as the density indicator, which was the POI (point of interest) density calculated within the defined radius of the buffer of each street. (4) Diversity. As for the diversity indicator, this study examined the mixing degree of POIs within the buffer zone for each street using Shannon’s entropy. Specifically, the POIs were firstly divided into six types of land use, namely, residential, commercial, industrial, public management and public service, road, and transportation facilities, and park and green land. Then, the normalized proportion of each type of POIs was calculated with Shannon’s entropy. The final result represented the degree of mixed land use, where a value close to 1 showed the street had more diversified uses. Besides, regarding the different functions of the different ring roads of Beijing, this study added the dummy variable to indicate the subregions of each street: 1) within the 2nd Ring Road areas, 2) between the 2nd and 3rd Ring Road areas, 3) between the 3rd and 4th Ring Road areas; and 4) between the 4th and 5th Ring Road areas. Table 1 shows the descriptions and methods to calculate the aforementioned control variables. The spatial visualization of independent variables is shown in Figure S4 in SI.
Results
Data processing and preliminary tests
Because the OLS regression assumes that the involved variables are normally distributed, we examined the dependent variables’ original data distribution through histograms and boxplots. The variables of online review density and POI density were long-tailed. Therefore, we used the log([VAR]+1) transformation on the density of online reviews and removed zero values in the subsequent regression to guarantee the model’s reliability. Besides, we also preprocessed the independent variables and applied logarithmic transformation for the variable Den_POI. After logarithmic transformation, we examined the data distribution to check whether this step would help achieve normal distribution. After data cleaning, the final sample size was 16,718.
Before completing the regressions, we employed the Pearson correlation and VIF (variance inflation factor) tests to determine the regression models’ reliability and avoid the multicollinearity effect. Since the dummy variable R3_R4 was highly correlated with other location variables, this study removed this indicator. Then, the results showed that the correlation coefficients between other variables were less than 0.8, and the VIF values were less than 5. That means the multicollinearity of the model was not very severe, and the model was relatively reliable.
Multiple Linear Regression analysis and results
Before we compared the differences between streetscape skeletons and other indicators, we examined the influence of the selected radius to generate the buffer of the street and to calculate the density of online reviews on the robustness of the results. The results showed that (Table 2), with the buffer radius raised from 30 m to 50 m to measure the aforementioned indicators, the number of elements significantly associated with online reviews decreased; when the radius was higher than 50 m, results tended to present similar patterns. According to the results, most skeleton indicators were significantly associated with urban activities using 30 m and 40 m as the radius of the buffer. One possible implication of this result is that urban activities represented by the density of online reviews near the centerlines were highly associated with more skeleton variables, such as those in living and commercial walking streets. When some service providers further away from the centerlines were analyzed in larger buffers, skeleton variables, such as length and cross-section indicators, had adverse results or were not statistically significant. Since the 50-m buffer had similar results to buffers with higher radii, this study chose the 50-m buffer to conduct the following studies and robustness tests.
MLR results using different radii to generate buffers and calculate indicators.
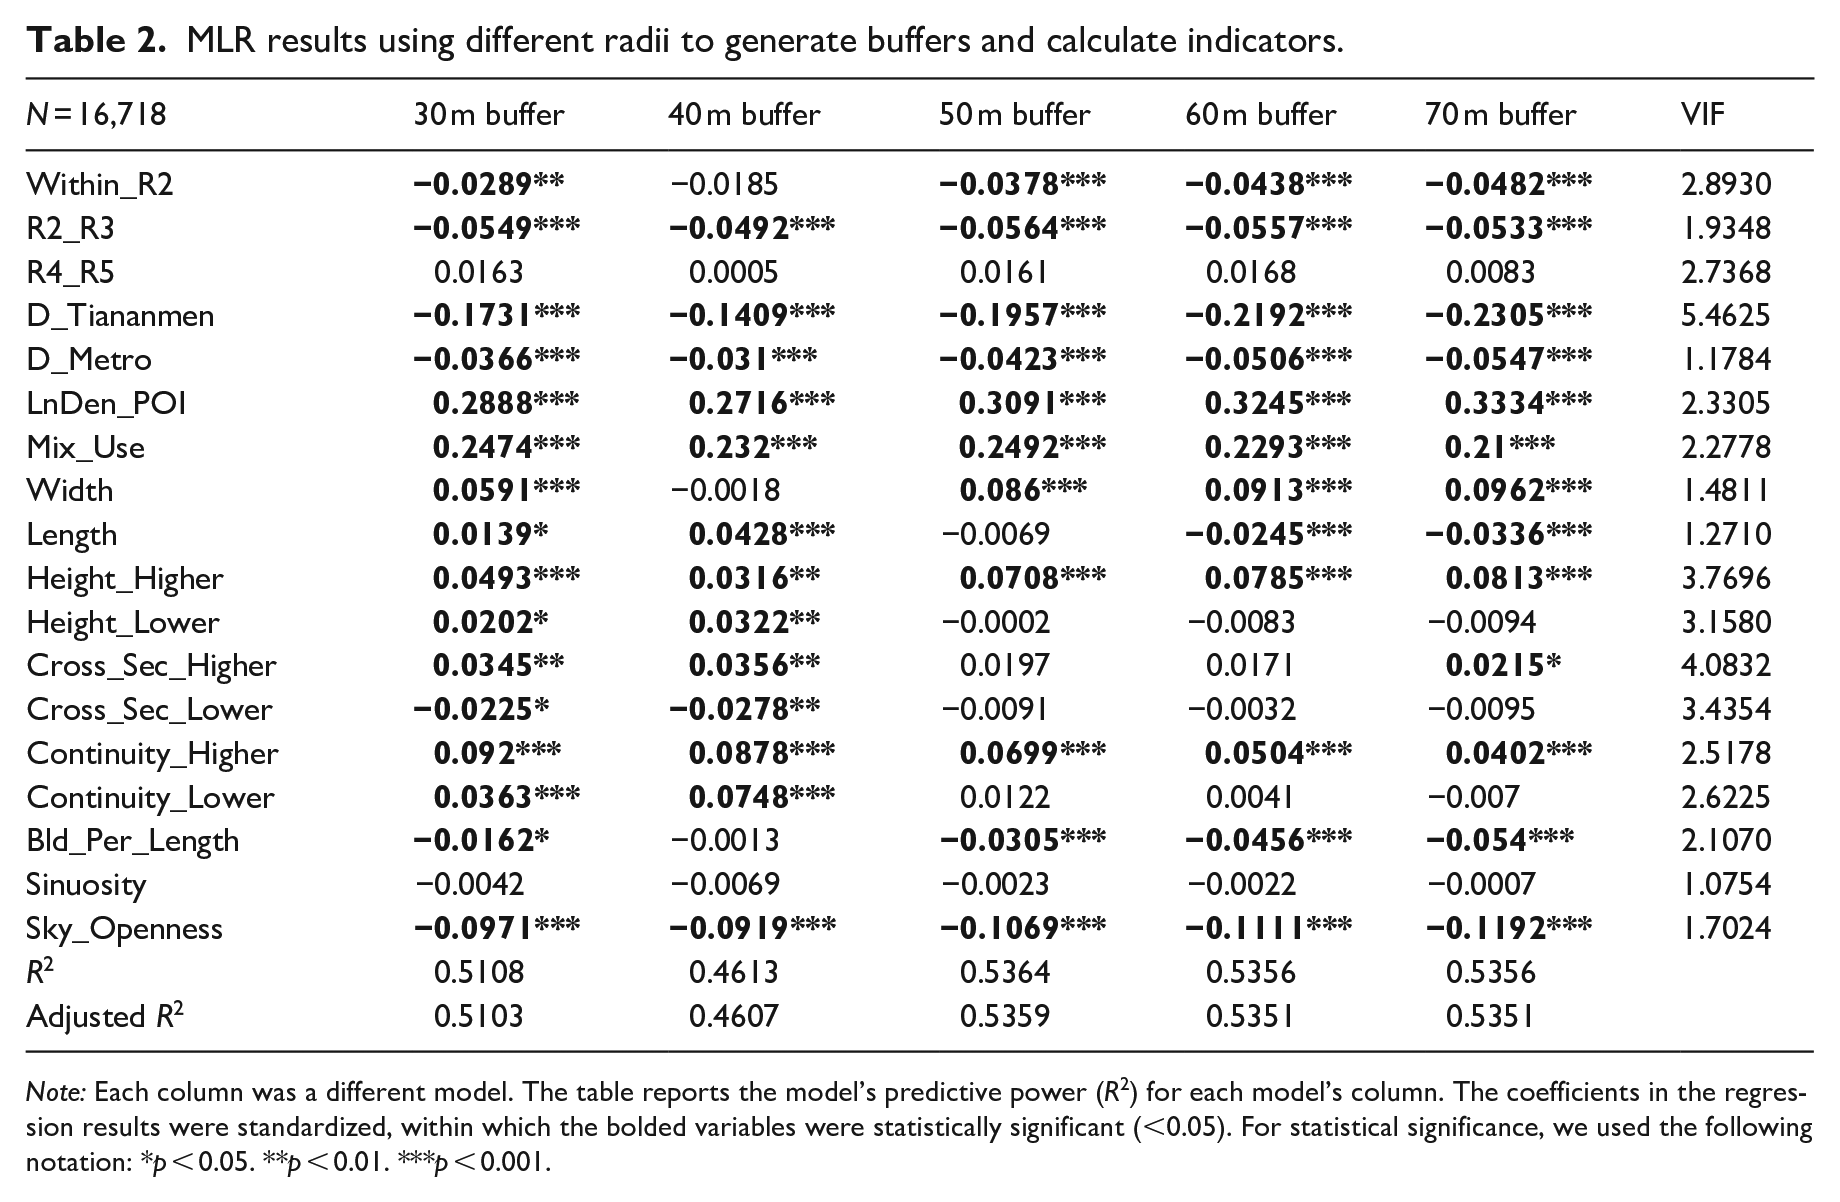
Note: Each column was a different model. The table reports the model’s predictive power (R2) for each model’s column. The coefficients in the regression results were standardized, within which the bolded variables were statistically significant (<0.05). For statistical significance, we used the following notation: *p < 0.05. **p < 0.01. ***p < 0.001.
Then, we conducted a step-wise OLS regression to explore the explanatory power of different Ds (Table 3). The results showed less density of urban activities within the third ring road of Beijing and verified previous findings that destination accessibility, distance to transit, density, and diversity had close relationships with urban activities. Among these, the density and diversity indicators had higher positive and statistically significant coefficients. As for the streetscape skeletons - the design indicators in this study - the width of the street, the higher height and continuity of buildings along the street were positively and significantly associated with online reviews, indicating that the broad street with high-rise buildings and more continuous street walls are more likely to witness more activities. Meanwhile, insignificant coefficients of Height_Lower and Continuity_Lower suggested that urban activities preferred the strength of the street, such as the higher height and continuity, but ignored the drawbacks of the other side. Besides, this study revealed the negative correlations between building density and the openness of the sky in the street with urban activities. In terms of the urban form and layout of buildings in Beijing, streets with more buildings along the street are north-south streets, which are along the side face of the buildings, thus with fewer storefronts or street-level ground-floor windows. The higher proportion of visual sky in the street view picture indicated fewer trees and buildings in the street, which might not be suitable enough for people to conduct activities. Moreover, although this study also used the dummy variable to represent the ideal cross-section as an alternative, the cross-section indicators that conventional urban design highlighted were not statistically associated with urban activities.
The results of step-wise MLR for different dimensions of variables.
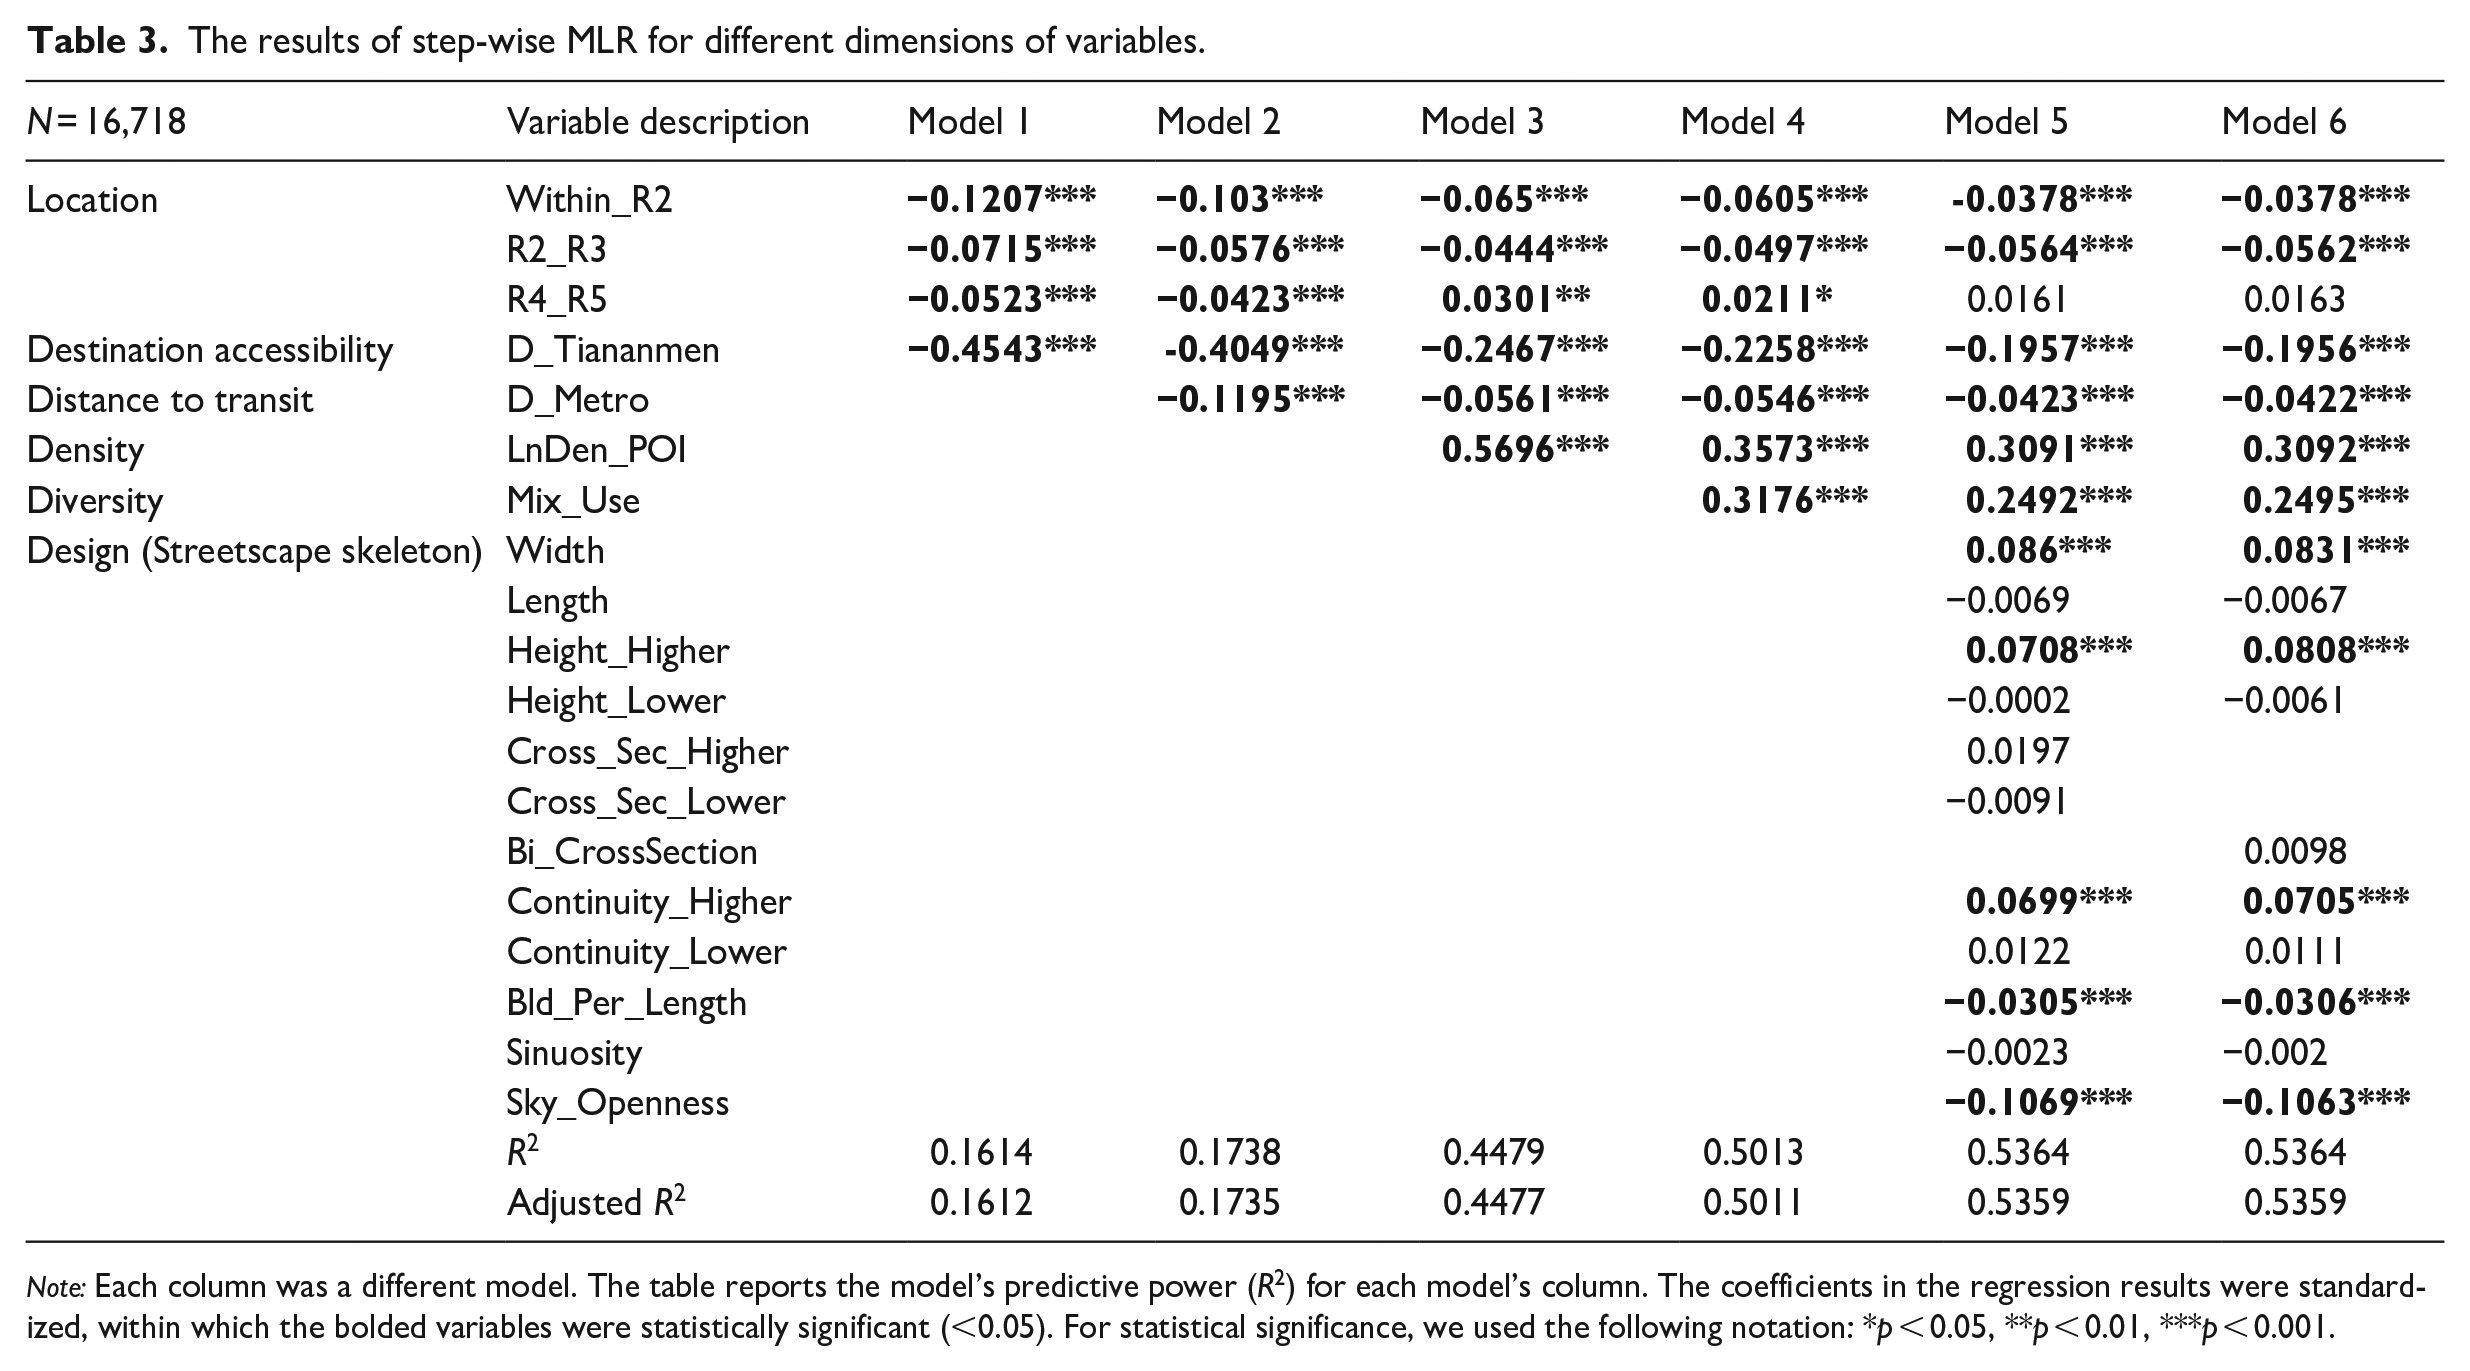
Note: Each column was a different model. The table reports the model’s predictive power (R2) for each model’s column. The coefficients in the regression results were standardized, within which the bolded variables were statistically significant (<0.05). For statistical significance, we used the following notation: *p < 0.05, **p < 0.01, ***p < 0.001.
Overall, the result using the density of online reviews on Dazhong Dianping as the dependent variable uncovered the close relationship between some skeleton indicators, such as width, higher height, and more continuous side of the street with urban activities. Nevertheless, some indicators such as Cross_SecHigher, Corss_SecLower, and Length have different performances when considering different buffer areas. Besides, this study also indicated that streetscape skeletons have lower explanatory power than function-related indicators, such as the density and diversity of POIs.
Robustness tests
Results using Spatial Lag Model
Before using the spatial lag model, we conducted a global Moran’s I test for the dependent variable to examine the degree of spatial autocorrelation. The result showed that the p-values were significantly less than 0.05, the z-values were significantly larger than 1.96, and Moran’s I was positive, indicating that the online review density showed significantly clustered patterns. Therefore, we applied the SLM to better understand the clusters of urban activities. The results showed that MLR and SLM could explain 53.62% and 53.82% of online reviews, respectively, suggesting that SLM had a slightly better performance than MLR, and implying the spatial autocorrelation of the density of online reviews was apparent. The results also showed that by controlling the spatial autocorrelation effect, all the dependent variables showed similar performances to MLR, indicating that the results in the above study were reliable (Table 4).
The comparison between MLR and SLM.
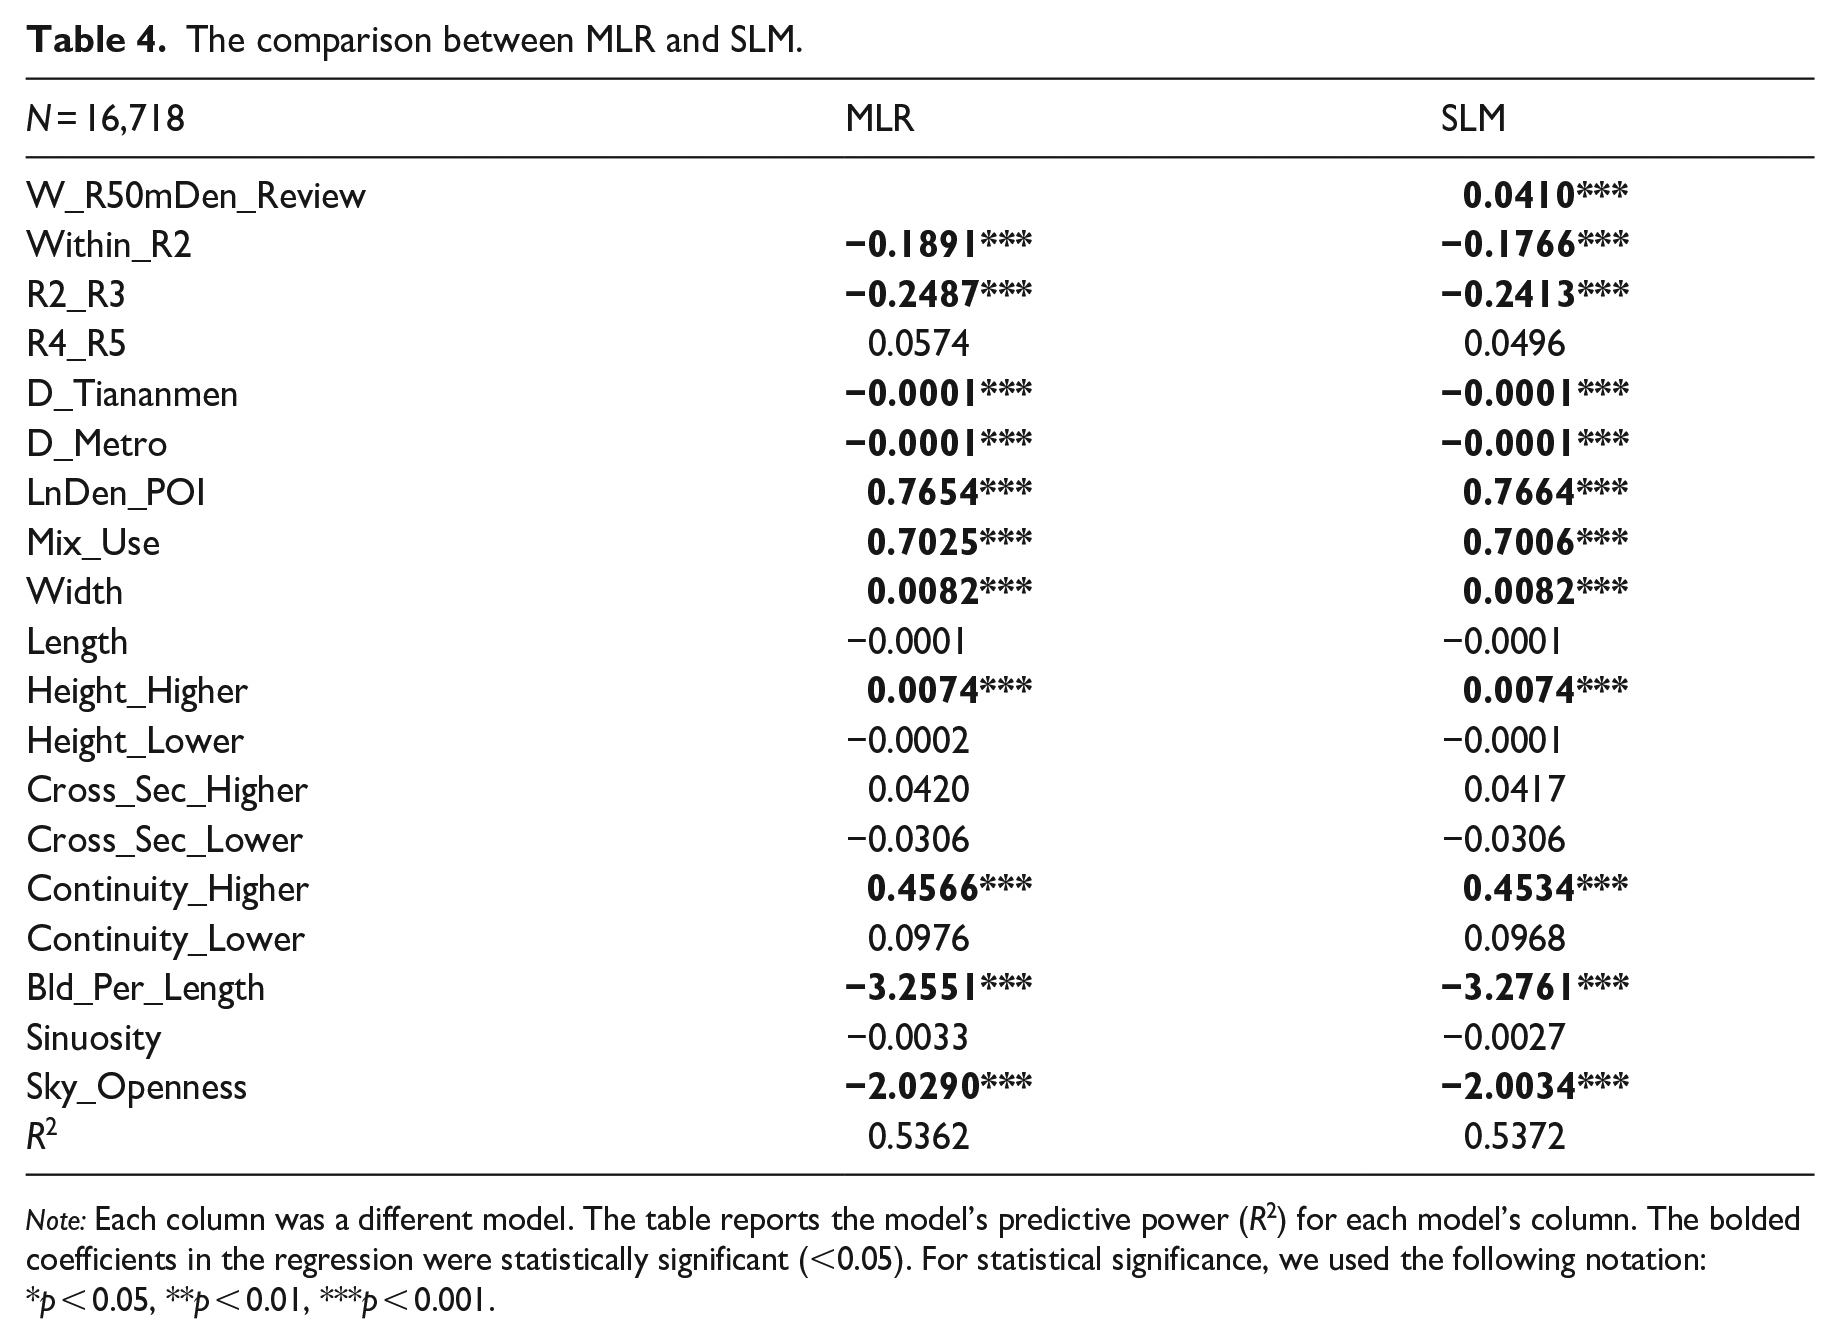
Note: Each column was a different model. The table reports the model’s predictive power (R2) for each model’s column. The bolded coefficients in the regression were statistically significant (<0.05). For statistical significance, we used the following notation: *p < 0.05, **p < 0.01, ***p < 0.001.
Results using Random Forest Regression
This study also used 10-fold Cross-Validation in RFR to test the reliability of the results from MLR. All the observations were automatically divided into training and test sets (90%:10%) to run the model and test its accuracy. This process was repeated ten times using different training and test data, resulting in the average value of the proportion of variance explained (Prop. Var).
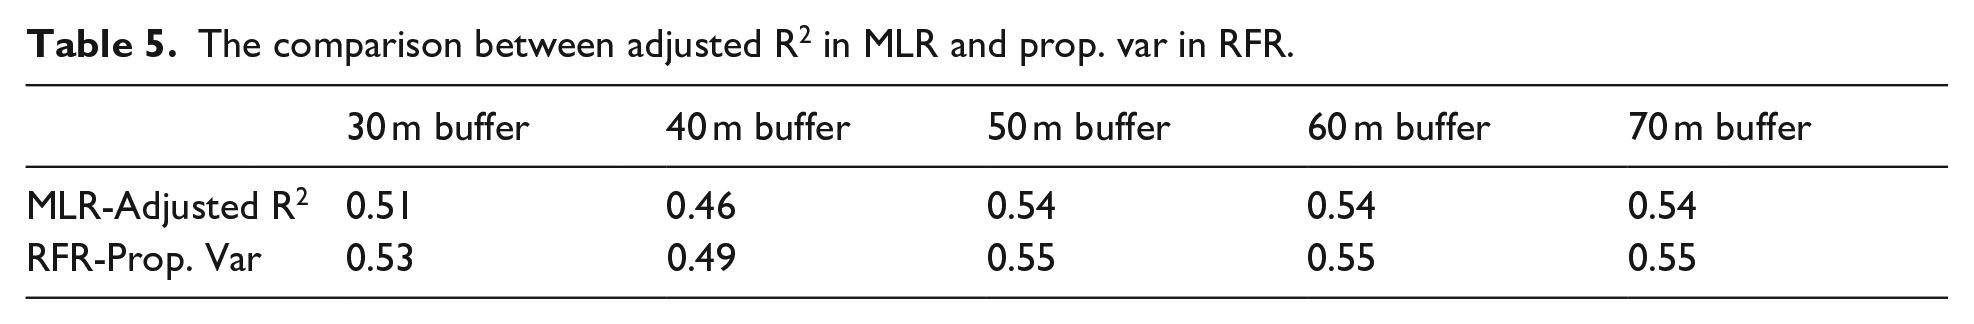
The Adjusted R2 values for the MLR were compared to the Prop. Var values for the RFR (Table 5). The proportion of Prop. Var in RFR ranged from 0.49 to 0.55, and the Adjusted R2 values in the MLR were slightly lower, varying from 0.46 to 0.54. Figure 4 shows the importance of variables. For the RFR, these variables were the ones that had the largest effect on the MSE (mean square error), and for the MLR, they were the statistically significant variables, listed in order from the largest to the smallest absolute value of the standardized coefficients. The same number of variables is shown for the RFR as for the MLR: the number of variables with significant coefficients (p-value <0.05) in MLR. In the two regressions, function density, diversity, and distance to the city center were the most significant and important variables. As for skeleton variables, although the orders varied, the significance of the higher side of the street, openness of the sky, street width, building density, and higher continuity of buildings along the streets was revealed in two regressions. Overall, the similar Adjusted R2 in MLR and Prop. Var in RFR, and similar variables with higher importance indicated that the results in this study were reliable.
The comparison between adjusted R2 in MLR and prop. var in RFR.
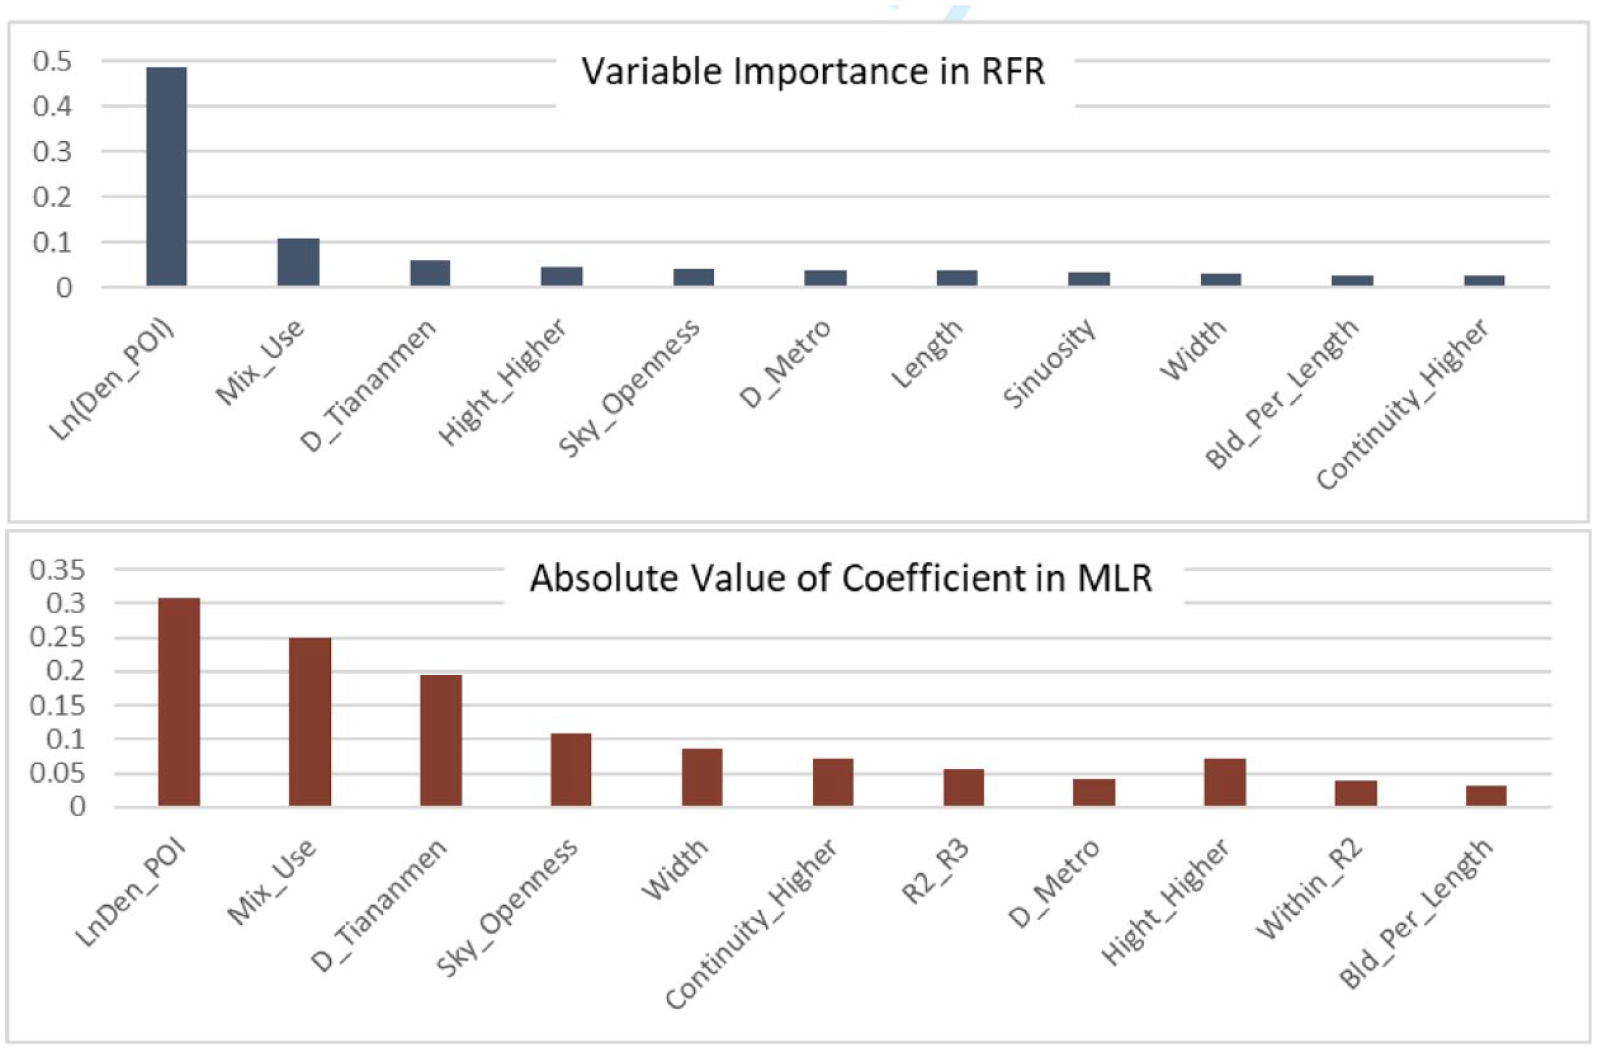
The variables in order of importance in the RFR and the absolute value of the coefficients in the MLR.
Discussion
Using the street segment as the analytic unit, this study focused on the human-scale urban design elements—streetscape skeletons, which may provide more insights into the refined management of the built environment. Some conclusions of this research could enhance the understanding of diverse urban design ideas and reinforce urban design pedagogy and the theoretical foundation of urban design.
On the one hand, the results verified previous scholars’ claims by revealing the importance of some streetscape skeletons. The results suggested that when conducting activities, people preferred the strengths of the street but ignored its weaknesses. The street’s higher and more continuous sides of buildings were associated with urban activities, while the lower and less continuous sides were not statistically significant. Besides, the positive coefficient of width and the negative one for the proportion of sky in the street implied that broad roads with higher enclosure are more likely to attract more urban activities in Beijing. On the other hand, the findings also provided some alternative perspectives on the streetscape skeletons. For example, the cross-section indicators were significantly associated with urban activities in narrow buffers of streets but were insignificant for wider ones. The relationship between street length and urban activities changed with more online reviews being involved in buffers to calculate the activity density. For those close to the centerline of streets, long streets received more activities, while for those further away from the centerline, short streets could be more appealing to pedestrians. These findings could enhance understanding of the complexity of the relationship between the three-dimensional street form (streetscape skeletons) and urban activities. Meanwhile, this study also compared the skeleton indicators with other elements. Besides, the results suggested that function density and diversity indicators played the most significant role in explaining the relationship between built environmental elements and urban activities. Urban designers should pay more attention to the guidance of diverse functions in urban renewal.
The present empirical analysis has several limitations. The first is the representativeness of the data. Online reviews represent only one specific dimension of urban activities and cannot wholly reflect people’s preferences for built environment characteristics. Further studies are required to benchmark our analysis with other proxies, such as 5G location-based service (LBS) data for urban activity. Second, the analysis lacks a temporal dimension. While urban activity is time-dependent and varies in different months, weeks, days, and times of the day, the current time granularity of built environment data is insufficient to support the research on these different time sections. Information about urban activities and their performances throughout different times should be included in further studies to increase the robustness of the analyses. Third, some insignificant results and the generalizability of the significant results require more samples and variables for falsification or verification.
Conclusions
Human-scale urban form, as a basis for urban planning and design, can enhance the character of the built environment (Ewing et al., 2015; Long and Ye, 2019) and has the potential to attract more urban activities. Taking the central Beijing, China, as the study area, this study used the street segment as the analytic unit to examine the relationship between the street-level urban form-streetscape skeletons and urban activities represented by the density of online reviews from Dazhong Dianping through models like Multiple Linear Regression, Spatial Lag Model, and Random Forest Regression. The results verified some streetscape skeletons related to urban activities, such as the width and enclosure of the street and the higher and more continuous buildings on the side of the streets. Meanwhile, the findings also suggested that some skeleton indicators, such as cross-section and length, have differentiated performances in narrow and wide streets. Besides, the results indicated that although some streetscape skeletons were highly associated with urban activities, function density and diversity were much more important. The findings of this study could provide new insights into streetscapes and help urban designers design more vibrant and sticky streets.
Supplemental Material
sj-docx-1-tus-10.1177_27541231221143608 – Supplemental material for Decoding the association between urban streetscape skeletons and urban activities: Experiments in Beijing using Dazhong Dianping data
Supplemental material, sj-docx-1-tus-10.1177_27541231221143608 for Decoding the association between urban streetscape skeletons and urban activities: Experiments in Beijing using Dazhong Dianping data by Enjia Zhang, Hanting Xie and Ying Long in Transactions in Urban Data, Science, and Technology
Footnotes
Declaration of conflicting interests
The author(s) declared the following potential conflicts of interest with respect to the research, authorship, and/or publication of this article: This manuscript was not handled by the editor himself, but it was handled by another editor.
Funding
The author(s) disclosed receipt of the following financial support for the research, authorship, and/or publication of this article: This work was supported by the Beijing Outstanding Young Scientist Program (JJWZYJH01201910003010) and the Natural Science Foundation of China (52178044).
![]() .
.
References
Supplementary Material
Please find the following supplemental material available below.
For Open Access articles published under a Creative Commons License, all supplemental material carries the same license as the article it is associated with.
For non-Open Access articles published, all supplemental material carries a non-exclusive license, and permission requests for re-use of supplemental material or any part of supplemental material shall be sent directly to the copyright owner as specified in the copyright notice associated with the article.